


INTRODUCTION
The Middle Bronze Age (MB or MBA), spanning the first half of the second millennium BC, is often discussed as the period in which urban entities began to spread throughout the southern Levant, after a 500-year hiatus in urban culture (Regev et al. Reference Regev, de Miroschedji, Greenberg, Braun, Greenhut and Boaretto2012; Greenberg Reference Greenberg2019:180–184; Lev et al. Reference Lev, Shalev, Paz, Regev and Boaretto2020). These entities left an everlasting mark on the landscape through the construction of various earthworks and structures, which changed the shape of their surroundings (Uziel Reference Uziel2010). This is often thought of as the period when many cities in the region were first established, including in the hill country of Israel.
The archaeological study of the multilayered mounds, which represented the contemporaneous urban centers, alongside the investigation of written histories of empires to the southwest (Egypt) and east (Babylon) led to numerous chronological studies, offering several chronologies for the period. These chronologies have far-reaching implications for understanding the reasons for the rise of the MB culture in the southern Levant, as well as the relationship of the region to the surrounding empires. As widely understood by now, radiocarbon (14C) is the absolute measure by which these correlations can ultimately be settled (Levy and Higham Reference Levy and Higham2005).
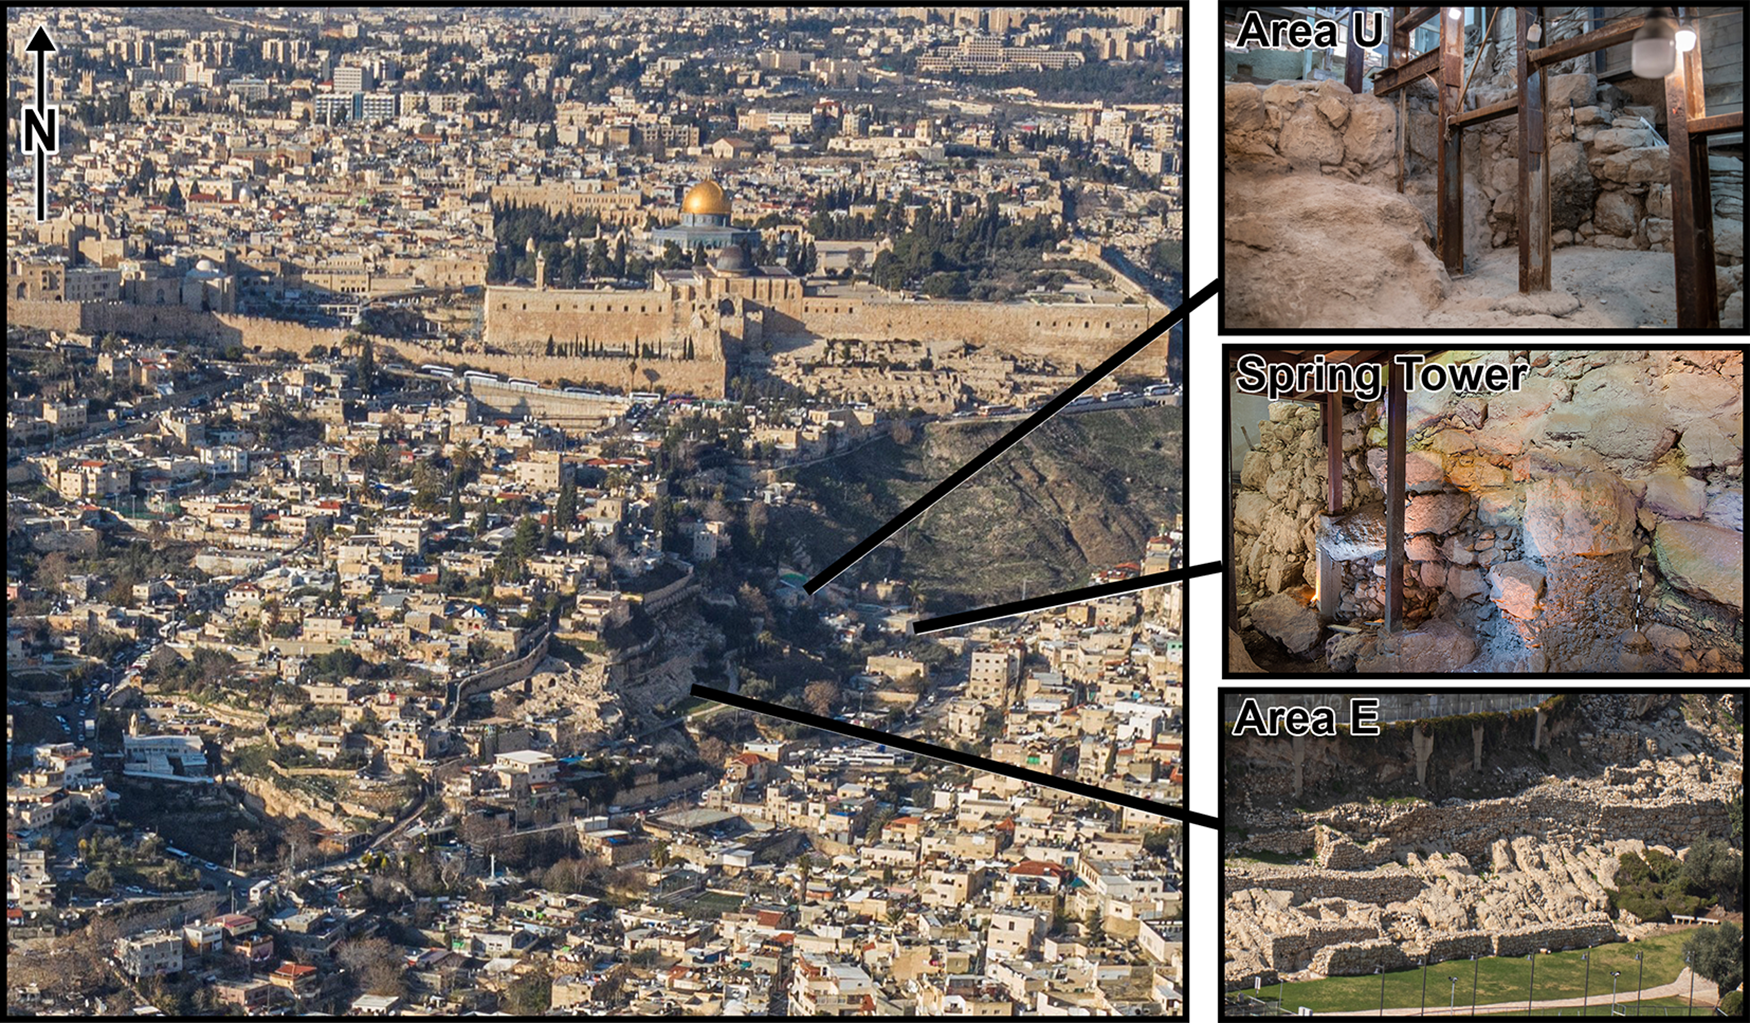
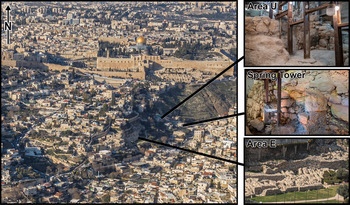
The following article will present a radiocarbon-based chronology for the site of Jerusalem, a key location for reconstructing the spread of urban culture in the south Levantine highlands. We will introduce results of samples collected from three different areas of excavation along the eastern slope of the southeastern hill, the location of ancient Jerusalem, offering a revised understanding of the site and its development during the first half of the second millennium BC (Figure 1): Area E, along the eastern slopes of the hill (De Groot and Bernick-Greenberg Reference De-Groot and Bernick-Greenberg2012; Eisenberg Reference Eisenberg2012), including what has been defined as the city wall of the period; Area U, some 80 m north of Area E and just above the Gihon Spring, Jerusalem’s primary water source; and the Spring Tower, the results of which were published elsewhere (Regev et al. Reference Regev, Uziel, Szanton and Boaretto2017a). It is important to note that save for the remains uncovered in Area E; the eastern slope has yielded significant amounts of MB finds (particularly pottery), although more often than not, they cannot be directly related to particular architectural remains (Roth Reference Roth2020a, Reference Roth2020b, Reference Roth2020c).
Location of the sampled areas within Jerusalem: Areas E, U, and the Spring Tower.
The absolute dating of the remains in these areas offers the opportunity to articulate the phases in which the site was first settled and developed, in turn leading to an understanding of Jerusalem’s standing in the period placing it within the historical narrative of the region. The chronological picture offered by the samples presented here has bearing beyond the site itself. It offers insights into the chronological debates surrounding the Middle Bronze Age and the historical reconstruction of how the period came to an end.
Middle Bronze Age Chronology and Jerusalem: Current State of Research
Middle Bronze Age chronology has been the subject of extensive research, with scores of papers published offering support for different chronological schemes, mainly due to the attempts to create a uniform timeframe for the events in Egypt and Syria-Mesopotamia, using both historical chronologies (Kempinski Reference Kempinski1974) and radiocarbon dating (Bronk Ramsey et al. Reference Bronk Ramsey, Dee, Rowland, Higham, Harris, Brock, Quiles, Wild, Marcus and Shortland2010). Early schemes for the timeline of the southern Levant in the period were primarily based on the historical reconstruction of events and the relationship to the region with Egypt. The onset of the period was attributed to the rise of the Twelfth Dynasty, with the end of the period assigned to the expulsion of the Hyksos (Albright Reference Albright1964: 41, Mazar Reference Mazar1968). Dever (Reference Dever, Cross, Lemke and Miller1976, Reference Dever1991, Reference Dever1992), for example, argued for a high chronology, roughly spanning between 1950 and 1525 BC. Others, such as Bietak (Reference Bietak1984, Reference Bietak1991, Reference Bietak2002, Reference Bietak, Shortland and Ramsey2013, Reference Bietak2014), suggested a low chronology. Based on the finds at the excavations of Tell el-Dab’a, he suggested the onset of the MB at some point in the early 19th/late 18th century BC. An even lower chronology has been presented for the period based on studies involving the Babylonian Kingdom and related astronomical research (Gasche et al. Reference Gasche, Armstrong, Cole and Gurzadyan1998; Ben-Tor Reference Ben-Tor2004). Most recently, a series of studies spearheaded by Höflmayer (Höflmayer et al. Reference Höflmayer, Kamlah, Sader, Dee, Kutschera, Wild and Riehl2016a, Reference Höflmayer, Dee, Riehl, Kamlah and Sader2019 and references therein; Höflmayer Reference Höflmayer2017) have presented radiocarbon dates that support what is termed a “Levant radiocarbon chronology,” with the onset of the MB placed around 2000 BC and the end of the period set at the transition of the 17th–16th centuries BC. A significant contribution to MBA chronology was recently published (Pearson et al. Reference Pearson, Brewer, Brown, Heaton, Hodgins, Jull, Lange and Salzer2018, Reference Pearson, Salzer, Wacker, Brewer, Sookdeo and Kuniholm2020), adding a sequence of single year radiocarbon measurements spanning between 1700 and 1500 BC. These data were used for building and slightly altering the new IntCal20 calibration curve (Reimer et al. Reference Reimer, Austin, Bard, Bayliss, Blackwell, Bronk Ramsey, Butzin, Cheng, Edwards and Friedrich2020), by which the results of this study are also calibrated.
In the MBA chronological setting, Jerusalem is no exception. According to most scholars, the earliest mention of the site appears, as one of the numerous sites, in the Execration Texts (Rainey Reference Rainey2006), leading to the definition of Jerusalem’s character in the Middle Bronze Age I as an urban entity in the hill country (the terminology used here is MB I, MB II and MB III, following Greenberg (Reference Greenberg2019: 180). Although Na’aman (Reference Naaman1992) has argued against the identification of Jerusalem in the texts, later adopted by Ussishkin (Reference Ussishkin2016), this is not the consensus opinion. However, pottery typology and scarabs found in the excavations do not support such an early date, and most scholars assume Jerusalem became an urban center only during the MB I-II transition (Reich Reference Reich2011: 284–287; De Groot and Bernick-Greenberg Reference De-Groot and Bernick-Greenberg2012: 144–149; Eisenberg Reference Eisenberg2012; Maeir Reference Maeir2017; Greenberg Reference Greenberg2019: 236). According to these studies, the urban nature of the site is exemplified by massive public constructions, such as a fortification wall, a tower protecting the spring, and underground water tunnels. These finds seemed to make a solid case for Jerusalem’s stature as a strong and powerful city, ruling over its hinterland appears to have been solidified by research.
Recently, a different approach was offered regarding MB Jerusalem. Ussishkin (Reference Ussishkin2016) suggested that no city existed before the late 8th century BC at the site, offering a reevaluation of the remains attributed to the Middle Bronze Age based on the published archaeological data, suggesting a later date for specific features and a different interpretation for others. Concrete evidence for the misdating of elements to the Middle Bronze Age—particularly the large tower surrounding the spring (hereafter Spring Tower)—was presented through radiocarbon dating (Regev et al. Reference Regev, Uziel, Szanton and Boaretto2017a). The new finds created a need to re-evaluate the character and chronology of the site in this period, the task of this article.
The Archaeological Contexts
Middle Bronze remains were discovered in all excavations conducted along the eastern slope of the southeastern ridge, especially those conducted by Kenyon, Shiloh, and Reich and Shukron (Reich Reference Reich2011). The work presented here includes three areas in which it was possible to find dateable architectural contexts.
Area E
Area E (Figure 1) was extensively excavated in the 1970s and 1980s by Shiloh (De-Groot and Bernick-Greenberg Reference De-Groot and Bernick-Greenberg2012; Eisenberg Reference Eisenberg2012). These excavations exposed three MBA strata: 18, 17B, and 17A (see top plans in Figure S1 in supplementary material). The main feature discovered here was wall W285, defined as the city’s eastern fortification. The outer face of the wall was traced for 30 m while its inner face was exposed in segments. It is, however, clear that at one point, the wall was widened from the inside (De Groot and Bernick-Greenberg Reference De-Groot and Bernick-Greenberg2012: 147). Several structures were found further west of the wall and within its bordered space, though the plan and function of these structures remain unclear.
The separation of the various architectural features into the three strata is based mainly on their relationship to wall W285. The earliest occupation level detected in Shiloh’s excavation (Stratum 18) was defined by the construction of the narrow phase of Wall 285. All features that coexisted with the wall in its original, narrow form were assigned to this stratum (e.g., stone pavement L1689). The transition to Stratum 17B included the widening of wall W285 westwards into the city, and all features that coexisted with the wall when it was widened were assigned to this stratum (e.g., floor L1631). Stratum 17A includes mainly the construction of wall W629 that, according to De-Groot and Bernick-Greenberg, cuts into Floor L1631 of the earlier phase. Note that Shiloh and his team did not recognize any Middle Bronze features cut by wall W285, and therefore did not define an MBA phase earlier than the construction of the wall. Using pottery and other material culture items, stratum 18 was relatively dated to the late MB I or the beginning of the MB II period (Eisenberg Reference Eisenberg2012: 272), while strata 17B and A were dated to the MB II.
In the current study, the authors initiated a renewed excavation aimed to recover material for a radiocarbon-dated absolute chronology from all the key contexts described above and from secure, microarchaeologically characterized contexts that could be correlated with the stratigraphy of Shiloh. The excavation locations chosen for this purpose are located adjacent to previously identified MBA remains, and within baulks which remained from the previous excavations (Figure 1 and Figure S1):
-
1. Section P5- The southernmost baulk abutting wall W285.
-
2. Section PQ5- The middle baulk of area E north abutting wall W285.
-
3. Section T5- The northernmost baulk in area E north. This section contains surfaces within an architectural unit in the northern part of area E north.
Area U
Area U is located on a steep slope above the Kidron Valley and the Gihon Spring, some 80 m north of area E (Figure 1). The most significant remains discovered in the area were a series of structures dating to the Iron Age II-III (Mendel-Geberovich et al. Reference Mendel-Geberovich, Chalaf and Uziel2020). However, several contexts could be attributed to the Middle Bronze Age. It appears that most of the area had been cleared in preparing the construction already during the Iron Age II, much of which was carved into the natural bedrock. However, in a few locations, the area had not been cleared until the bedrock, and MBA occupational levels were revealed, primarily consisting of occupational accumulations with no associated architecture. These remains were found above the bedrock and included a channel/installation and a layer of ash. The most significant of the contexts is a room or structure, built of large boulders. The structure, 4 × 4 m in size, was built directly on the bedrock, in a stepped manner in order to take into account the steep slope, and was preserved to a maximum height of ca. 1 m. The building had been exposed in its northern part by E. Shukron, who suggested a Middle Bronze Age for the building, based on pottery collected in the excavations. It appears that the work of M. Parker dismantled the building’s southern extension in the early 20th century. However, there is no documentation for such remains in Parker’s Tunnel XVIII (Vincent Reference Vincent1911). Although no associated pottery was found in the current excavation, the central part of the structure was exposed and sampled in order to provide an exact date for its construction.
The Spring Tower
Previous archaeological excavations by Reich and Shukron exposed a monumental tower built of huge boulders around the spring. They dated the tower to the Middle Bronze Age (Reich and Shukron Reference Reich and Shukron2010). In a further study, the soil below the lowest course of the tower’s eastern wall was sampled for dateable material in order to provide an absolute date for the construction of the tower. A section was cleaned, documented, and sampled beneath the massive stones of boulders of the northeastern corner of the tower. The tower—thought to be dated to the MB II—yielded dates in the late 9th century BC directly beneath the stones, indicating that it was not built (or at least in its current form) until that time (Regev et al. Reference Regev, Uziel, Szanton and Boaretto2017a). That said, in situ layers significantly below the tower did yield Middle Bronze Age dates (see below) and are relevant to the current discussion.
METHODS
Field Sampling
All the samples measured were taken particularly for chronology building purposes, meaning extreme caution was exercised during the sample collection in order to minimize introducing noise to the chronology caused by accidental dating of residual or intrusive dates. The general approach for radiocarbon sampling is based on collecting the associated material in the selected context. The dating assemblage (Boaretto Reference Boaretto2015) for chronology is based on several proxies as burned sediments, ash composition, phytoliths, phosphate concentration, and control samples of above and below sediments, as described in Weiner (Reference Weiner2010) and Boaretto (Reference Boaretto2015). This is the approach used for all the chronology studies at the D-REAMS laboratory (see Regev et al. Reference Regev, Finkelstein, Adams and Boaretto2014, Reference Regev, Paz, Greenberg and Boaretto2020a, Reference Regev, Uziel, Lieberman, Solomon, Gadot, Ben-Ami, Regev and Boaretto2020b; Weiner et al. Reference Weiner, Nagorsky, Taxel, Asscher, Albert, Regev, Yan, Natalio and Boaretto2020). All the samples, excluding the ones retrieved from baulk PQ5, were recovered from a horizontal excavation and not picked from a section. Exposing a larger surface area helps to define the context better, as well as avoid sampling later intrusions such as pits and animal burrows. In Area E, where the work was done on remaining baulks, first, the sections were cleaned, photographed, and sampled for microarchaeological analysis (Weiner Reference Weiner2010), with the aim of identifying potential floors and surfaces before the excavation itself. The excavation was performed slowly, in high resolution, particularly when approaching and reaching floors and in situ burnt contexts. In order to expose surfaces for dating, the best method was usually to use a trowel with a sharp edge in order to lift the overlying sediment above the underlying ash layer. It allowed for the exposure of very thin layers, such as ash. As some of the ash adheres to the removed overlying sediment chunk, it was also inspected for charred remains. Alternately, the area was gently brushed, and air was blown to recover clean ash surfaces.
Each sample location was marked with a numbered tag and photographed. Sediment samples of ca. 10 g were taken for microarchaeological analyses from the context dated as well as fill materials for control. Charred material was first picked in situ in the field. After this, the sediments from good contexts were carefully separated and collected and sieved in the laboratory through a stack of botanical sieves. The most useful size for our purposes is the 2-mm mesh. The charred botanical remains were identified using a binocular microscope SMZ 800N (Nikon) and metallurgical microscope eclipse LV150N (Nikon) prior to 14C analysis.
The sediments were characterized using FTIR analysis (Fourier transform infrared spectroscopy). When verification of ash presence was needed, microscope grain mount slides were prepared for pseudomorphs identification. Representative relevant FTIR results are shown in Figure S2 in the supplementary materials. A few milligrams of sediment were crushed in an agate mortar and pestle. A small amount of KBr was added, mixed, and pressed under a pressure of 2 tons to form a 7 mm pellet with a Specac manual hydraulic press. The pellet was then measured with a Nicolet iS5 (Thermo) FTIR instrument at 4 cm–1 resolution. The spectra could be used to identify the presence of anthropogenic substances, such as burnt clay (Berna et al. Reference Berna, Behar, Shahack-Gross, Berg, Boaretto, Gilboa, Sharon, Shalev, Shilstein and Yahalom-Mack2007), phosphate (Weiner Reference Weiner2010), and disordered calcite (Regev et al. Reference Regev, Poduska, Addadi, Weiner and Boaretto2010, displayed in Figure S3 in the supplementary material).
Sample Preparation for Radiocarbon Dating and Measurement
Seed and charcoal samples were treated according to the acid-base-acid (ABA) method described in Boaretto et al. (Reference Boaretto2009). One single seed/charcoal was ground into a powder and accurately weighed into a pre-baked glass tube. The powder was first treated with 1 N HCl at room temperature for 1 hr to dissolve the carbonate fraction and then treated with 0.1 N NaOH at room temperature for 30 min to remove humic substances, following by 1 N HCl at 80°C for 1 hr to release the CO2 absorbed during the base treatment. Each acid or base treatment is followed by rinsing with Nanopure water until pH=7. After drying overnight at 90°C, the pretreated sample was weighed.
Collagen was extracted and purified from bone samples with the ABA procedure followed by gelatinization and ultrafiltration methods (Yizhaq et al. Reference Yizhaq, Mintz, Cohen, Khalaily, Weiner and Boaretto2005; Brock et al. Reference Brock, Higham, Ditchfield and Ramsey2010). Around 500 mg of bone material was taken from one single piece of a bone sample, ground into a powder, and weighed accurately in a pre-baked beaker. The bone powder was treated with 0.5 N HCl for around 1 hr, until all the mineral dissolved, and was then treated with 0.1 N NaOH for 30 min to remove humic substances. Both the acid and base steps are followed by rinsing with Nanopure water until pH=7. A final acid treatment with 0.5 N HCl for 5 min is followed by rinsing until pH=3. Gelatinization was performed at 80°C for 20 hr, followed by filtering with polyethylene filters (Ezee-filterTM) and ultrafilters (VivaspinTM 15, 30kD MWCO). The filters were pre-cleaned using the procedures established in Brock et al. (Reference Brock, Bronk Ramsey and Higham2007). The filtered solution was frozen in liquid nitrogen and dried under vacuum in a freeze drier (Heto LyoLab 3000). The dried collagen was weighed accurately and examined with FTIR spectroscopy.
Graphitization was done using an EA-AGE3 system, composed of an elemental analyzer (EA, “vario ISOTOPE SELECT” by Elementar), coupled to a third generation of the Automated Graphitization Equipment (AGE3, Ionplus). The carbon content of the sample was measured by the elemental analyzer. The graphite was then pressed into an aluminum cathode using a pneumatic sample press (PSP, Ionplus). The 14C content was measured at the DANGOOR Research Accelerator Mass Spectrometry Laboratory at the Weizmann Institute of Science (Regev et al. Reference Regev, Steier, Shachar, Mintz, Wild, Kutschera and Boaretto2017b). The radiocarbon ages were calibrated using the OxCal software version 4.4.2 (Bronk Ramsey Reference Bronk Ramsey2009a) according to the IntCal20 atmospheric curve (Reimer et al. Reference Reimer, Austin, Bard, Bayliss, Blackwell, Bronk Ramsey, Butzin, Cheng, Edwards and Friedrich2020). Unless otherwise indicated, the intervals for 68.2% are used throughout the text.
Bayesian Modeling of the Radiocarbon Results
The MB chronology of Jerusalem is based on 44 independent determinations. The site chronology was built from 5 independent sequences, as only samples that could be securely located in stratigraphic order were placed in each sequence. The chronology was obtained by modeling the results of the samples according to the stratigraphic considerations based on Bayesian principles, using the OxCal 4.4.2 program (Bronk Ramsey Reference Bronk Ramsey2009a; Reimer et al. Reference Reimer, Austin, Bard, Bayliss, Blackwell, Bronk Ramsey, Butzin, Cheng, Edwards and Friedrich2020). The 68.2% probability is used wherever modeled results are referred to. The unmodeled and modeled results are given in Table 1.
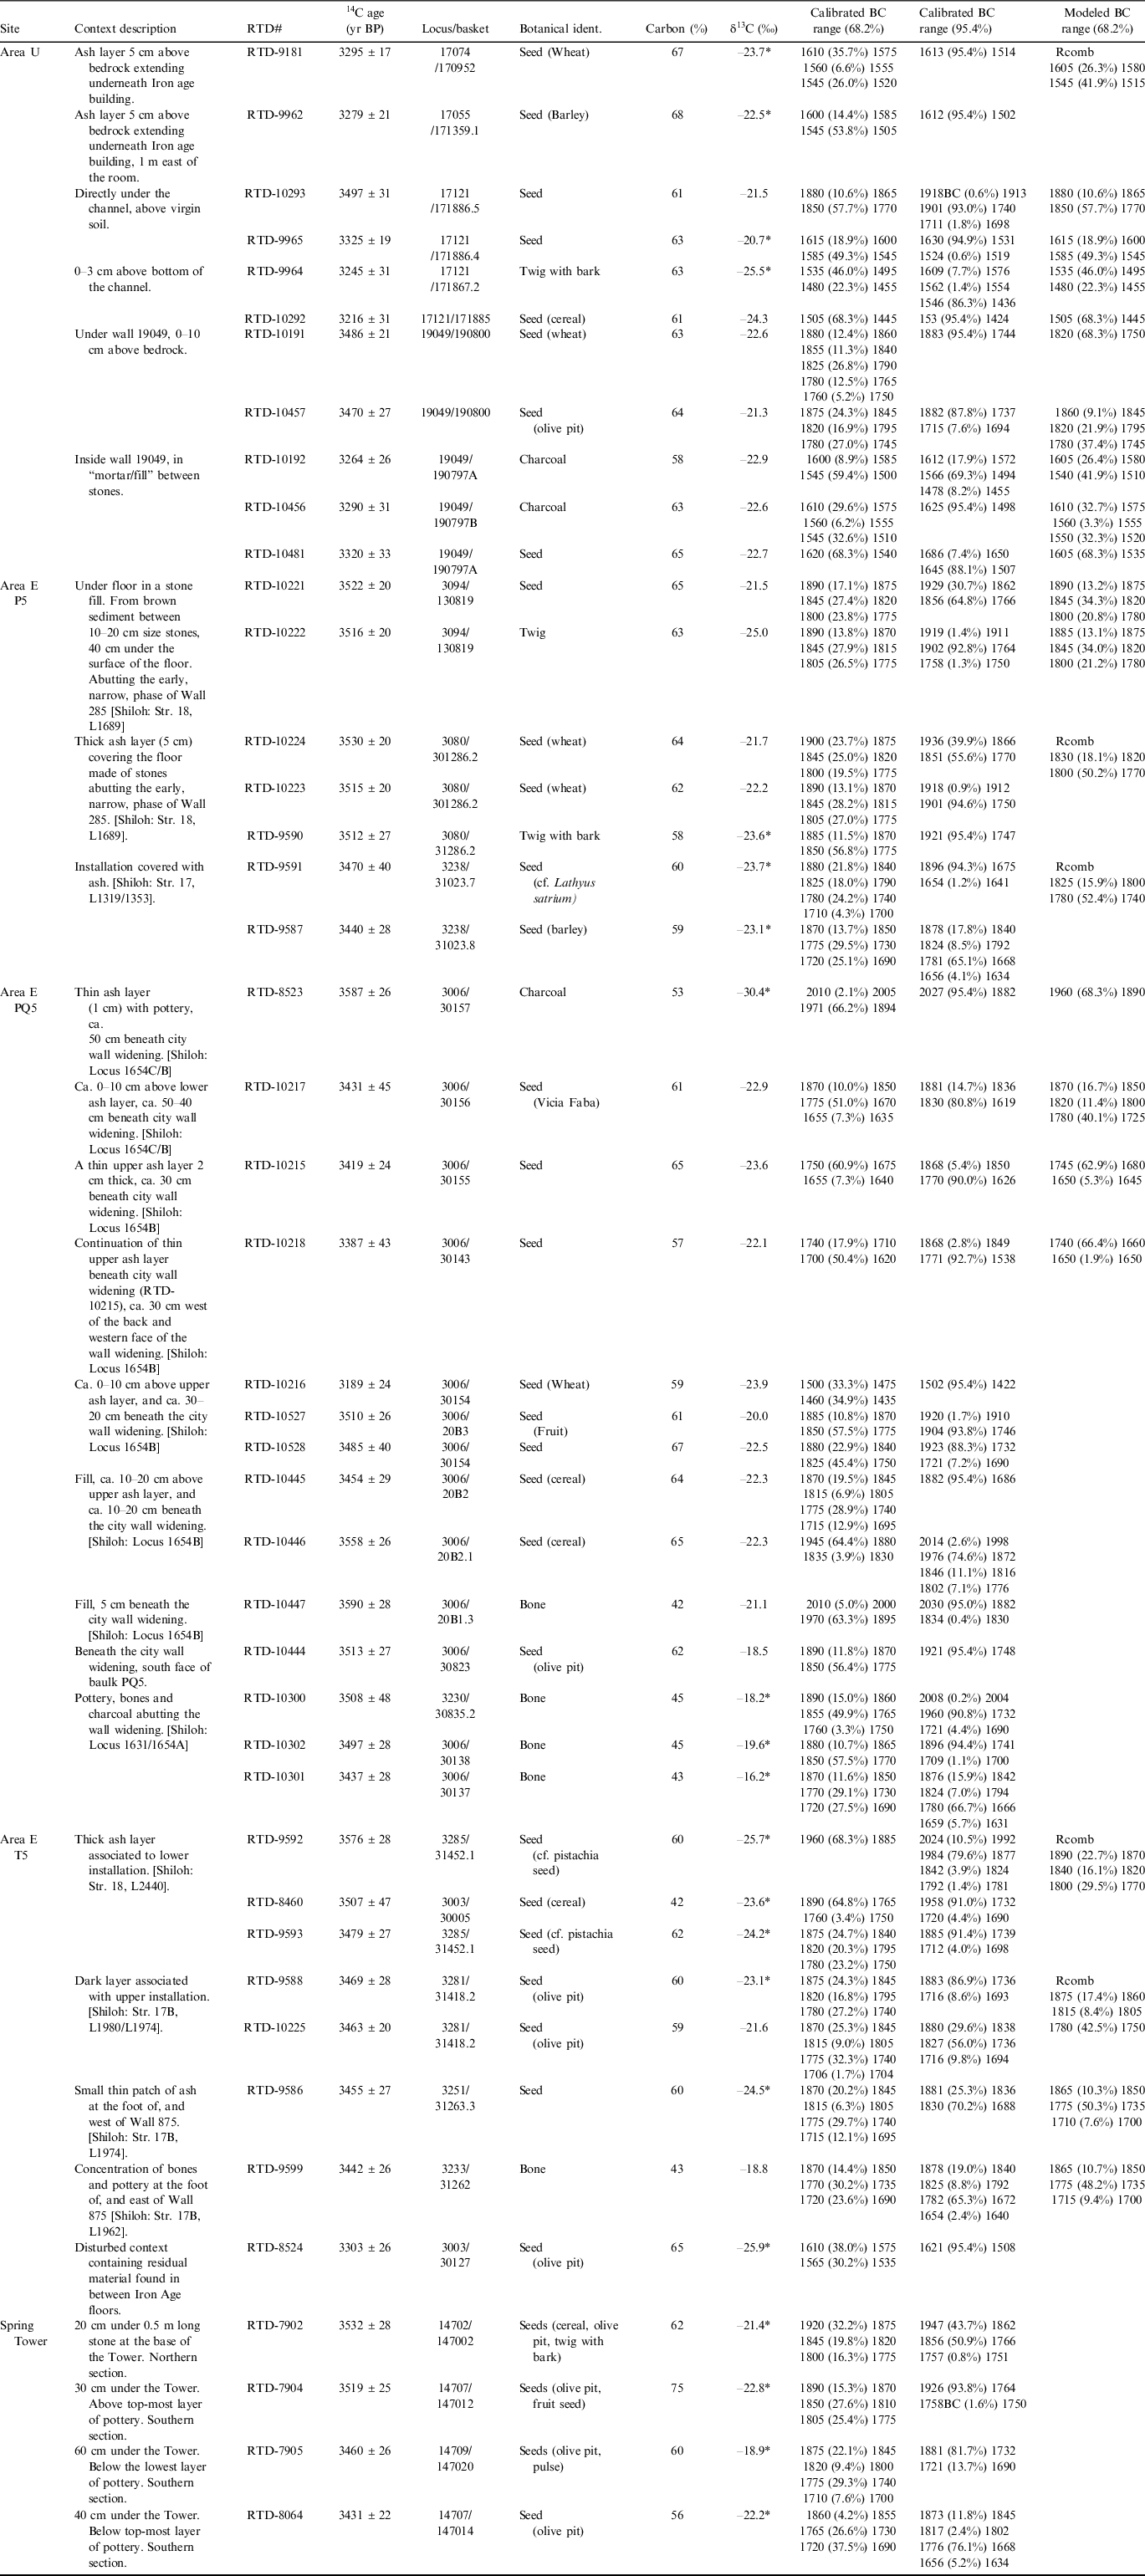
Dating results and context description of the samples dated in this study. The strata and loci assigned by Shiloh are in parentheses in the Context Description column. δ13C values marked by an asterisk * were measured by AMS. The MB dates from the Gihon Spring Tower are added here from Regev et al. (Reference Regev, Uziel, Szanton and Boaretto2017a). The results are ordered according to excavated areas and the internal stratigraphy from lower to top layer. The modeled age, where modeling was possible, relate to the model in Figure 2 and SM6.
RESULTS
Altogether 44 new radiocarbon dates were measured from 16 different contexts (Table 1). As the MBA has a calibration plateau consisting of three small wiggles, single calibrated ranges remain large. To reach a higher resolution for the calibrated ranges, where possible, samples with clearly superimposed stratigraphy were sought after in the field to enable modeling. As it was not possible to establish for certain stratigraphic connections between the various baulks and areas, each small sequence was modeled separately and displayed together as a multiplot for easier comparison.
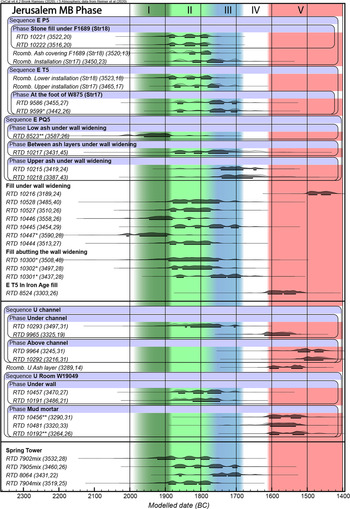
All the dated ranges mentioned throughout the text, refer to the model presented in Figure 2 (the model itself is in SM6 in the supplementary material).
Bayesian modeled (dark grey) and unmodeled (light grey) probability distributions of the modeled radiocarbon results. Results of samples that could not be modeled are only in dark grey. The results are plotted according to excavated areas and the internal stratigraphy from lower to top layer. Colors are related to Jerusalem MB phases suggested in this paper, indicated at the top of the plot. The transition between Phases II and III is based on the model presented in Figures S21 and S22. The overall agreement for the model of each area is over 100%. Note that the fills under and abutting the wall widening, and the U ash layer are not modeled. Agreement in the model for each date is above 94%. Only date RTD-10192 had 85% agreement. Dates marked with (*) are animal bones, and dates with (**) are wood charcoal. The model itself is in SM6 in the supplementary material. (Please see the electronic version for color figures.)

In the following section, the radiocarbon contexts are described in geographical order, from south to north. Further details and close-up photos can be found in SM3 section in the supplementary material.
Area E
Baulk P5
The samples from the southernmost baulk P5 (Figure 3) were taken from three contexts: between the stones of pavement 1689 (De-Groot and Bernick-Greenberg Reference De-Groot and Bernick-Greenberg2012), from an even and thick ashy layer covering entirely pavement 1689 (previously unreported), and from a small and rounded installation with ash established on fill 1353, laid on top of the burnt layer (previously undetected). These contexts were directly superimposed and could be modeled as a sequence accordingly.
Sample locations and their calibrated ranges from section P5, view to the south. (A) Section drawing (adapted from De-Groot and Bernick-Greenberg Reference De-Groot and Bernick-Greenberg2012 plan 66, Institute of Archaeology, The Hebrew University of Jerusalem), with strata 18 (phase II) and 17 (phase III) marked (blue and green respectively). The modeled (1 σ) date ranges are on the right. The rectangular marks the area shown in (B). (B) Lab numbers and locations of the dated samples on a photo during the renewed excavation.
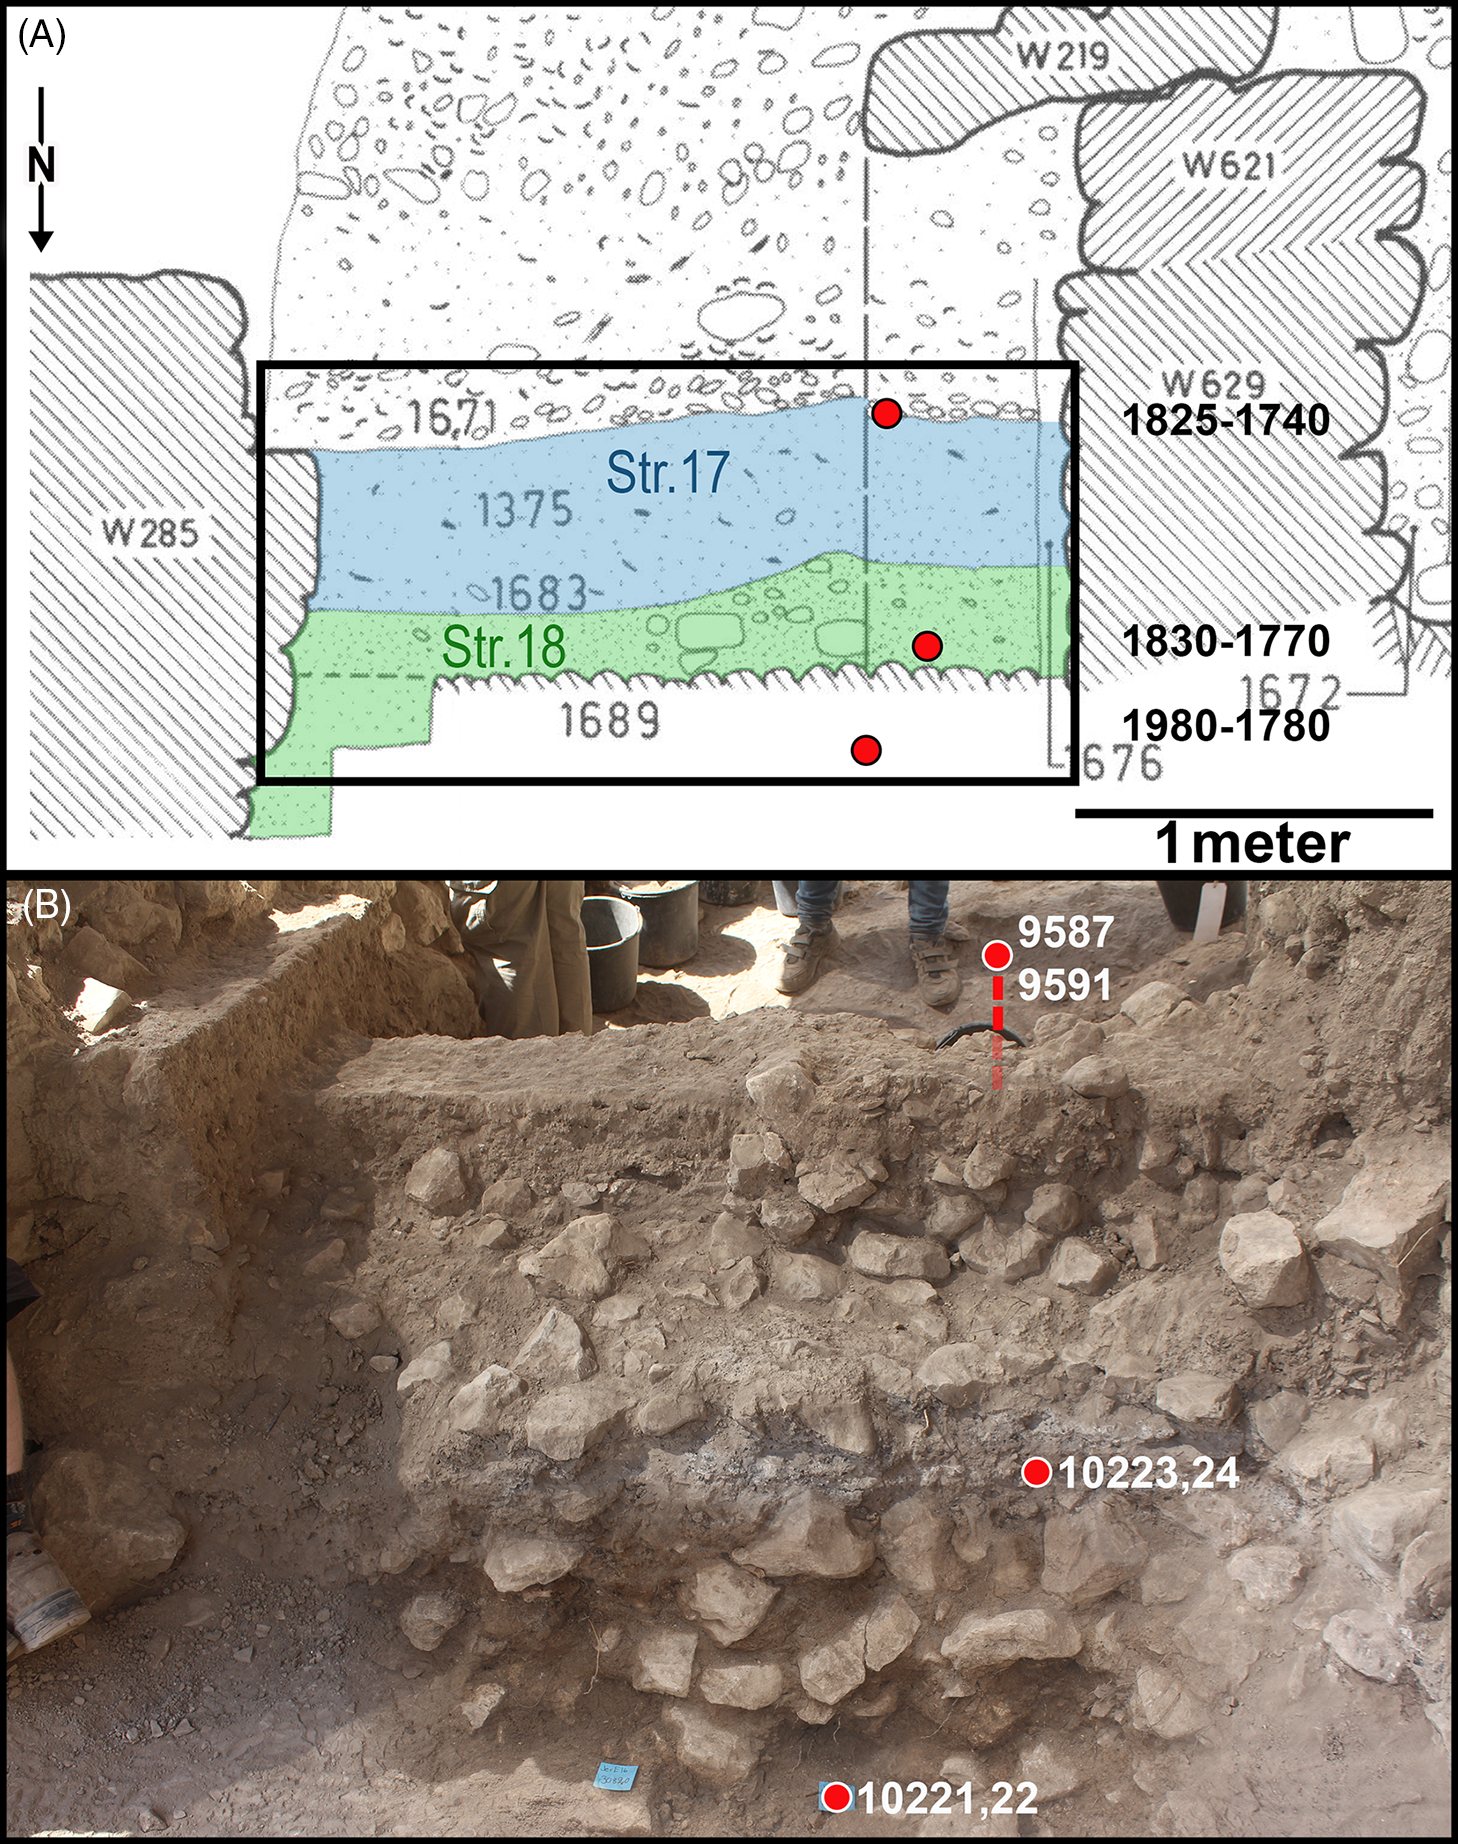
The lowest context in baulk P5 represents the laying of the earliest MBA surface identified in previous excavations, Pavement 1689. This pavement was discovered abutting Wall W285 in its earlier, narrow phase. The stone floor was probably constructed at the same time as the narrow wall or directly afterward. In order to level the sloping bedrock, it was based on a thick stone fill. Consequently, the brown non-heat-altered fill sediment in-between the stones from which samples RTD-10221 and 10222 were taken could originate from before the time of the building of the wall or roughly from the same time (De-Groot and Bernick-Greenberg Reference De-Groot and Bernick-Greenberg2012: 107). The samples were taken ca. 30 cm below the top of the floor to prevent the possibility of mistakenly sampling intrusive material from the burnt layer above it. They date between 1890–1780 BC.
The next context, located above Pavement 1689, represents the end of the use of the surface. Samples RTD-9590, RTD-10223, and 10224 originating from the thick ash layer covering the top of the pavement securely postdate the construction of the narrow wall, giving a range of 1830–1770 BC. The uppermost context was dated by the small stone installation with associated ash layer, between L1353 and L1319, samples RTD-9591 and 9587. It is assigned to Shiloh’s stratum 17 and dated between 1825–1740 BC.
Baulk PQ5
The sampling of the northern face of the middle baulk PQ5 concentrated on the material under the widening of Wall W285 and the fill west of it (1654), abutting the face of the wall in its second, wider phase (Figure 4, De-Groot and Bernick-Greenberg Reference De-Groot and Bernick-Greenberg2012:110). According to De-Groot and Bernick-Greenberg (Reference De-Groot and Bernick-Greenberg2012:106), Floor 1631 was placed above Fill 1654 and in the same phase. The floor was identified by complete crushed jars found in situ, directly west of the widened wall. Wall W629 cuts through floor 1631, taking it out of use and so has to be later.
Sample locations and their calibrated ranges from section PQ5, view to the south. (A) Section drawing (adapted from De-Groot and Bernick-Greenberg Reference De-Groot and Bernick-Greenberg2012 plan 58, Institute of Archaeology, The Hebrew University of Jerusalem), with strata 18 (phase II) and 17 (phase III) marked (blue and green respectively). The modeled (1 σ) date ranges are on the right. The red and orange rectangular frames correspond to (B) and (C) respectively. (B,C) Lab numbers and locations of the dated samples on a photo during the renewed excavation. The left part of (B) is perpendicular to the section drawing’s pane.
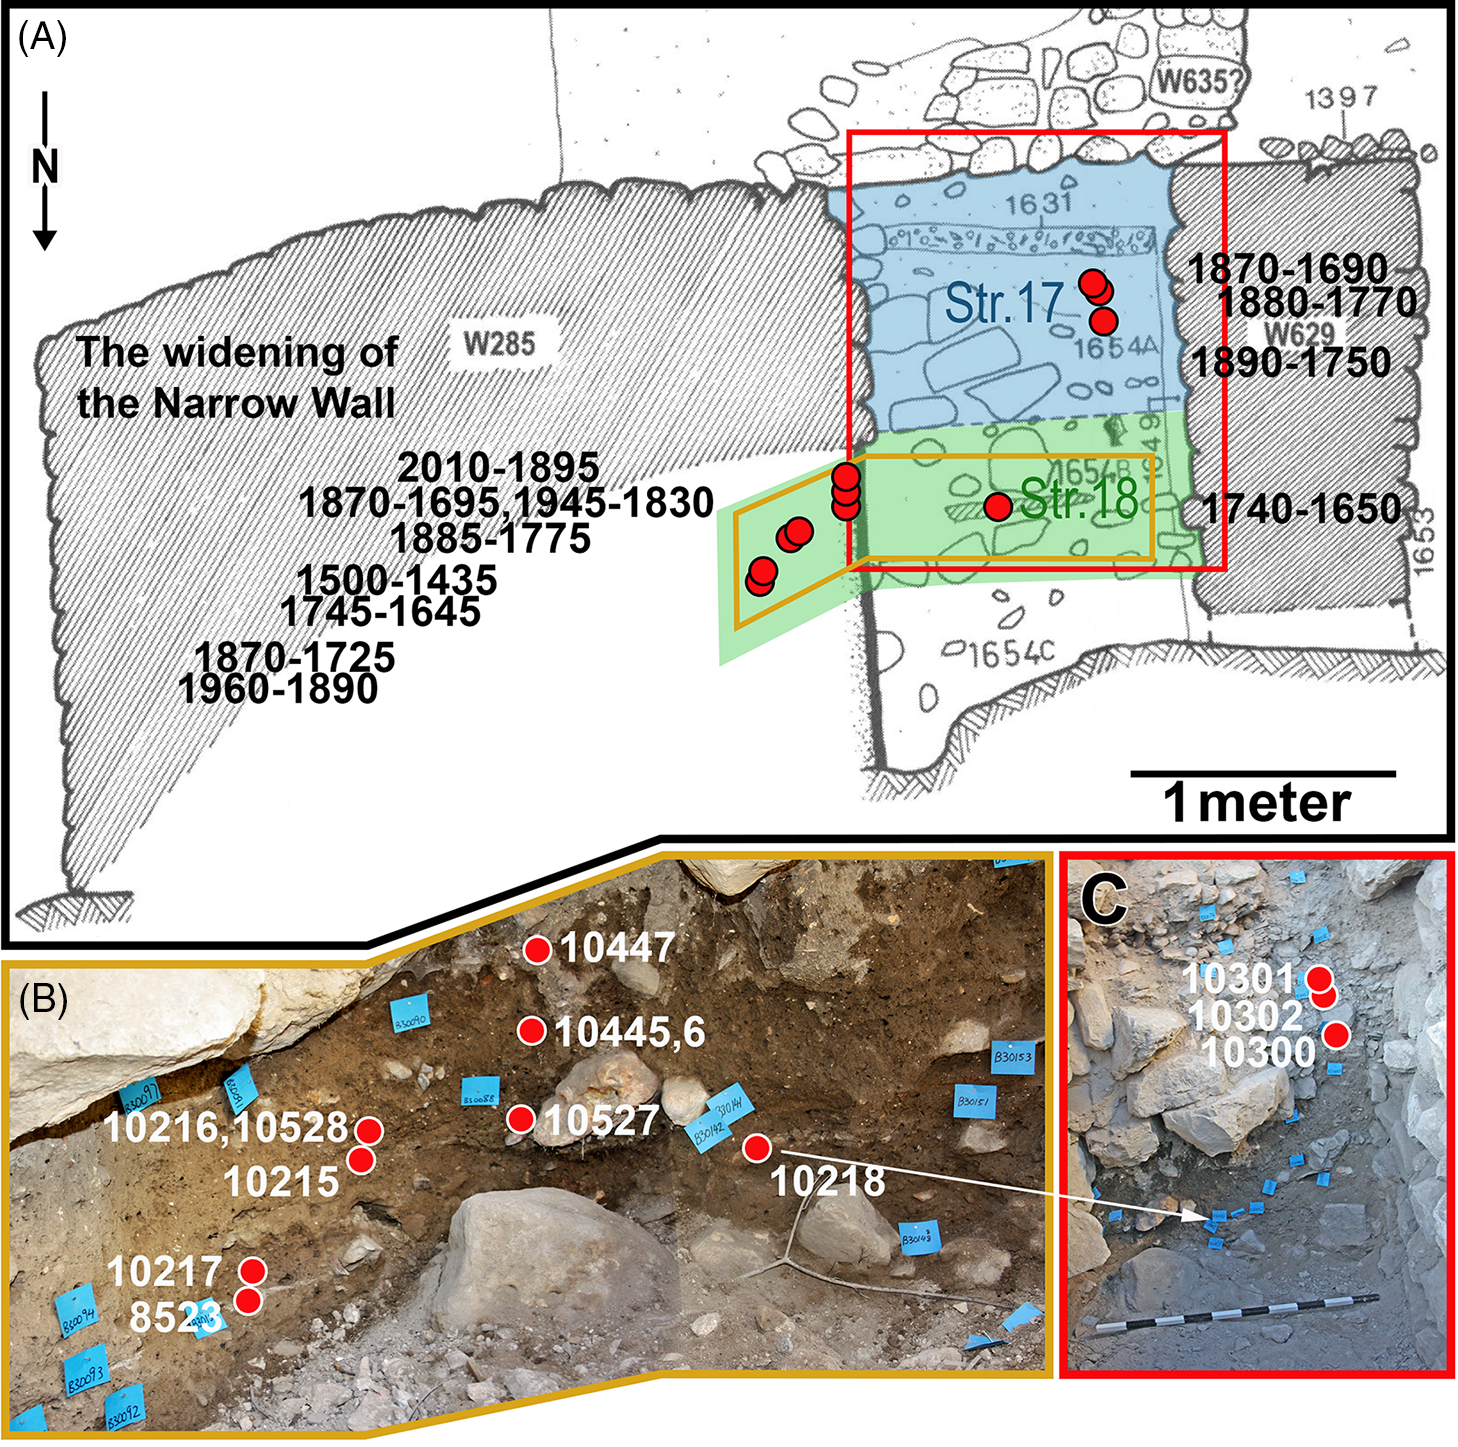
Our re-examination of the northern face of section PQ5 failed to identify Floor 1631 clearly, and rather noted a layer of crushed, non-restorable pottery at the same elevation. In addition, all of the material enclosed between wall W285 to the east and W629 to the west, including the presumed floor 1631, had the character of a fill throughout its layers, with pottery, bones, and stones laid in a non-organized manner. Furthermore, no clear foundation trench belonging to wall W629 was discovered. We were able to identify two in situ ash layers underneath the widening of wall W285, while the upper one continued from the east until the face of W629 to the west, which seems to abut Wall 629. Based on these observations, as well as our interpretation of the photograph published by the previous excavators (De-Groot and Bernick-Greenberg Reference De-Groot and Bernick-Greenberg2012 Photo 130), we suggest identifying floor 1631 as part of the intentional fill (L1654), into which also complete jars were discarded. The fill was probably placed there for the construction and widening of Wall W285 and, as will be shown below, was composed of soil brought over from earlier occupational levels.
A sequence of dates was measured underneath the widened wall. The lowest sample was measured from a thin ash layer (RTD-8523). This charcoal sample, dated to 1960–1890 BC, could have an “old-wood effect.” The next sample (RTD-10217) came from a light brown color, non-heat-altered sediment with lots of charred material located directly above the ash layer and yielded an age of 1870–1725 BC. Above this sediment, a second layer of ash with pottery sherds was identified, extending from under the widening of Wall W285 and abutting Wall W629. In the current excavations, we did not identify the foundation trench of wall 629, which was reported to have cut through surface 1631 and fill 1654A and 1654B (De-Groot and Bernick-Greenberg Reference De-Groot and Bernick-Greenberg2012: 106). This ash layer, rising towards the west, was identified as a patch of plaster within fill 1654B in the initial report (De-Groot and Bernick-Greenberg Reference De-Groot and Bernick-Greenberg2012 plan 58). However, ash pseudomorphs are visible under the microscope, and the grinding curve location of the sample fits ash rather than plaster (Regev et al. Reference Regev, Poduska, Addadi, Weiner and Boaretto2010). Samples RTD-10215 and RTD-10218 come from this ash layer, although the latter is positioned west of the widening. Both samples gave identical ages, dating to 1740–1650 BC. This upper ash layer is the uppermost in situ identified ash layer underneath the widening of the wall. Six samples were measured from the ca. 30 cm between the uppermost ash layer and the lowest stone course widening of the wall. Three out of the six come from the 10 cm above the uppermost ash layer (RTD-10216 dated to 1500–1435 BC, and RTD-10527 and 10528, both dated to 1885–1750 BC). Sample RTD-10216 has an exceptionally young age and is of interest in terms of the terminal phases of the MB both in Jerusalem and the MB on a whole. However, caution should be exercised as it is a single date and cannot be ruled out as an outlier (see further discussion below). Samples RTD-10445,10446 come from 20–10 cm below the wall widening dating to 1870–1695 BC and 1945–1830 BC respectively. The uppermost sample RTD-10447 (a bone 5 cm beneath the wall’s widening) gave early age between 2010 and 1895 BC. Another sample, RTD-10444 directly beneath the wall widening was taken 2 m more to the south, dating to 1890–1775 BC.
The following three samples from bones come from material found between the wall widening and wall 629. Samples RTD-10300 and 10302 were taken from the lowest part of a Fill 1654A. RTD-10301 comes from the continuation of the same fill, but at a higher elevation by 10 cm, the same elevation as Floor 1631 was supposed to be found. The three dates range between 1890–1690 BC and are all later than the dates measured from the underlying ash layer. This indicates, as suggested above, that the material between wall W285 and W629 is a constructional fill made of anthropogenic soil, brought over from earlier occupational levels.
Baulk T5
Samples of baulk T5 originate from two superimposed installations, under Wall W875, as well as samples taken from the very base of the foundation of the wall, on its east and west sides (Figure 5). The relation of these surfaces to the MBA city wall remains unknown, as it fails to reach the section due to damage in its northern part by an Ottoman drainage channel (De Groot and Bernick-Greenberg Reference De-Groot and Bernick-Greenberg2012: 116–117, 106).
Sample locations and their calibrated ranges from section T5, view to the south. (A) Section drawing (adapted from De-Groot and Bernick-Greenberg Reference De-Groot and Bernick-Greenberg2012 plan 78, Institute of Archaeology, The Hebrew University of Jerusalem) with strata 18 (phase II) and 17 (phase III) marked (blue and green respectively). The modeled (1 σ) date ranges are on the right. The sample marked by a star is in a disturbed context. (B) A photo, taken during the renewed excavation. The rectangular area is magnified in (C). (C) Lab numbers and locations of the dated samples.

The lowest three samples (RTD-9592, 9593, 8460), dating between 1890–1770 BC, were taken from a clean 2-cm-thick layer of ash-rich in charred material, covering a concentration of 10 cm size stones (this surface is equivalent to Shiloh’s Locus 2440 belonging to St. 18 (A. De-Groot and Bernick-Greenberg Reference De-Groot and Bernick-Greenberg2012: Plan 78). The ash extended for 1.5 m and was covered by 15 cm of brown, heat-unaltered sediment. Above this fill was another installation consisting of black (charcoal rich), uncommon red clay, and white (ash) laminations, respectively. Samples RTD-10225 and 9588 were taken from the black layer and dated to 1875–1750 BC. This installation was covered by 10–20-cm size stones that probably served as a foundation of a floor. The uppermost MBA samples from this baulk were taken from both sides of Wall W875, at the level of its foundations: RTD-9586 from a small, 20 cm, ashy patch at the eastern side of the wall and RTD-9599 from a concentration of bones at the wall’s western side, both yielding ages between 1865–1700 BC. An additional MBA sample (RTD-8524) dating to 1610–1535 BC was measured in an Iron Age context in laminations between two plaster floors from Stratum 12. Albeit not in context, it suggests continued occupation in Area E during the late MBA. This is also supported by RTD-10216 of Bulk PQ5.
Area U
Channel 17121
This channel/installation was built above orange colored clay-rich virgin soil inside a natural cavity in the bedrock (Figure 6). The soil was leveled, and a thin, ca. 2-cm layer of plaster was applied to form the installation. Directly beneath the plaster, small charcoal flecks were found and dated separately as samples RTD-10293 and 9965, the later sample dating between 1615–1545 BC, gives a terminus post-quem for the channel. At the bottom of the channel, above the plaster several grey and white laminations were found with charred material from which samples RTD-9964 and RTD-10292 were taken, understood to represent the time of the use of the channel, dated between 1535 and 1445 BC. Stark mineralogical differences of these materials can be seen in the FTIR (Figures S2 and S3).
Sample locations and their calibrated ranges from the channel/installation and associated sample in area U. (A) Section drawing of the channel/installation with modeled (1 σ) date ranges on the right. (B) Sample locations and lab numbers of the dated samples. (C) A top plan drawing of the area. The blue line marks the location of the section shown in (B). (D) Lab numbers and locations of the dated samples. The excavator with the blue hat is within the channel.

Sample locations and their calibrated ranges from the room in area U. The samples are from within and below W19049. (A) A top plan drawing of the area with modeled (1 σ) date ranges on the right. Note that the samples marked by red circles with a black circumference on the left appear also in Figure 6. (B) Sample locations and lab numbers of the dated samples. (C) A zoom-in image of the lower part of (B).

Next to the channel/installation, at the level of up to 10 cm above the bedrock, a thin ca. 1-cm horizontal layer of ash was identified. In the west, where sample RTD-9962 was taken, it was covered by a collapse of medium size stones, and to the east, dated by RTD-9181, it continued beneath a floor of an Iron age building. The ash horizon could be traced for ca. 2 m and it dates between 1605 and 1510 BC.
Building 1948
In close vicinity to Wall 109, the southern wall of the “Fortified Passage,” a building made of large boulders was uncovered. It was built on a bedrock, but in a corner of the room, under a large stone where the bedrock was not level, a row of small stones was added underneath the boulder in order to fill in sediment and level the bedrock. Sediment under the large stone and under the small stones directly above bedrock was sampled (samples RTD-10191, RTD-10457) dating to 1880–1745 BC (Figure 7). As the stones of wall 19049 (the western wall of the building) were large and only roughly hewn, small stones imbedded in “mortar” were used to fill in the seams. At a height of 1.2 m above bedrock, under a large boulder the face of the wall was thoroughly cleaned, and the outer 10 cm with small stones and “mortar” of clay rich sediment were removed to reach deeper mortar, to avoid danger of contamination. Samples RTD-10192, RTD-10456, and RTD-10481 were taken from this mortar, dating between 1610–1510 BC.
The Spring Tower
In a previous published paper, measurements from MBA layers underneath the Spring Tower were reported (Regev et al. Reference Regev, Uziel, Szanton and Boaretto2017a). The tower, surrounding Jerusalem’s perennial water source, had been exposed and dated to the Middle Bronze Age by the excavators (Reich and Shukron Reference Reich and Shukron2010). A section of sediment beneath the northern corner of the tower had been cleaned, with a series of sequenced layers underlying the lowest course of boulders of the tower’s eastern wall (Wall 104). Although the uppermost layers yielded dates belonging to the late 9th century BCE, and therefore affecting the date of the tower itself greatly, of importance here are three earlier occupation surfaces recognized. These floors yielded dates between 1920–1690. The fact that these floors are situated below the foundation of Wall 104, the northeastern corner of the tower, prove that the area of the spring was settled during the Middle Bronze and that the Spring Tower was definitely built later (see Regev et al. Reference Regev, Uziel, Szanton and Boaretto2017a).
DISCUSSION
The radiocarbon dates from all the areas, dated from a variety of contexts and modeled to slightly narrow the calibrated ranges, suggest a continued occupation in Jerusalem, lasting from the 20th to the 15th centuries BC covering the entire MBA, with a curious, possible occupational gap occurring in the 17th century BC. In order to create a clear chronological framework for the site, the construction of Wall W285 and its widening in Area E are the key anchor points:
-
1. The construction of Wall 285: The dates from Floor 1689 supply a terminus ante quem of 1830–1770 BC for the construction of the wall, with the dates obtained earlier than this anchor attesting to an earlier phase in Jerusalem’s settlement history. This key point in the chrono-stratigraphy of Jerusalem can help in determining how Jerusalem evolved during the first half on the second millennium BC. Below we present our understanding of how Jerusalem evolved through the first part of the second millennium BC, in which the radiocarbon dates are attributed to relative phases in relation to the initial construction of W285. Regardless of the exact function of this wall, its width and form of construction advocate for a communal construction effort. The considerable length 30 m points to its public, rather than private, use. Accordingly, the initial construction of Wall W285, in its narrow phase, marks a point in time where a certain level of settlement complexity was reached where communal and public projects could be undertaken through a joint workforce.
-
2. The widening of Wall W285: Two in situ ash layers were identified underneath the wall, the upper of which was located 30 cm under the lowest course of stones, used for the widening. The dates obtained from the two in situ ash layers (RTD-8523, 10215, 10218) and the fill (RTD-10217) in between them appear in an excellent chronological sequence, indicating that these were not random fill layers, but rather independent layers of human activity. The uppermost in situ ash layer is dated to 1740–1650 BC. From the remaining 30 cm between the upper ash layer and the first course of stones of the wall widening, one sample (RTD-10216) gave an age in the 15th century BC. To verify this late date, 6 additional samples from the fill under the widening of the wall and 3 samples abutting the “widening of the wall” were collected and measured. These samples included bones and single seeds. No cluster of charred seeds was found supporting the fill nature of the deposit. All the samples turned out to be earlier than 15th century BC, making RTD-10216 an outlier candidate. However, as these 9 additional dates are earlier than the in situ ash layer (RTD-10215 and 10218) around 1700 BC, they indicate that these fill dates are residual and the action to set the fill in that location should be associated to the latest date (RTD-10216) in the 15th century BC. Furthermore, other dates obtained in Area U indicate the existence of the site in the early 15th century BC. Therefore, if one considers several pieces of evidence, the widening of the wall may have occurred in the first half of the 18th century BC or in the early 15th century BC (and see further below).
On the basis of the actual radiocarbon dates, the new excavations and Shiloh’s findings, a new division into five phases (I–V) of the MB settlement in Jerusalem is proposed (Table 2):
Summary of phases and Shiloh’s equivalents.
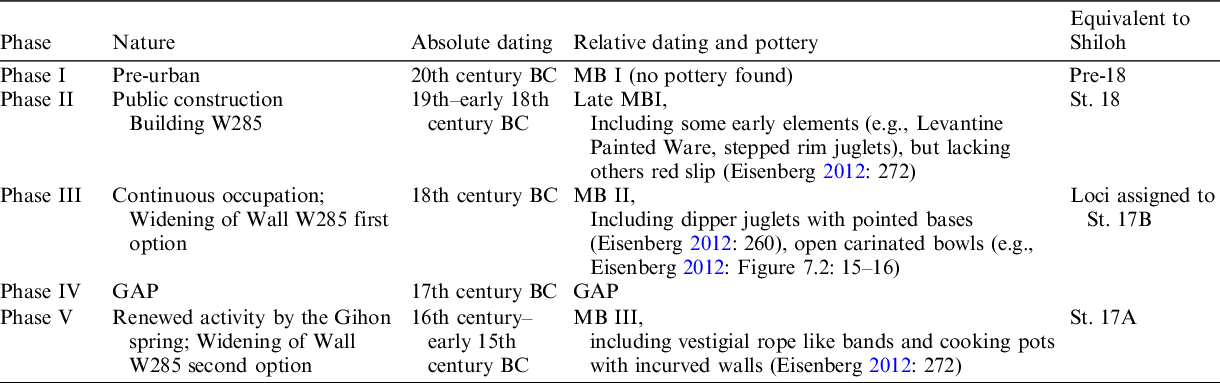
Phase I: The Earliest Settlement
Three dates (RTD-8523, 10446, 10447) beneath the widening of Wall W285 in Area E (baulk PQ5) suggest some type of settlement in Jerusalem during the 20th century BC, the very beginning of MB I, following the high chronology (Höflmayer Reference Höflmayer2017; Höflmayer et al. Reference Höflmayer, Dee, Riehl, Kamlah and Sader2019). Although we do not know how these samples relate to the narrow wall, they are earlier than Floor 1689 (Figure 3) that was built simultaneously or slightly later than the narrow wall. The sample originating in the lowest ash layer reached in this location, provides a date from the second half of 20th century or very beginning of 19th century BC. Although this sample is of charcoal, thus possibly attaining the old wood effect, its date is supported by two same-age seeds samples originating in a constructional fill under Wall W285. These dates confirm that some activity was already taking place in Jerusalem during the early MB I, prior to the appearance of public architecture. As the finds related to this archaeological period are very scarce, it is impossible to reconstruct the nature of the settlement. Previous scholars assumed that the construction of Wall W285 marked the beginning of settlement activities in Jerusalem (De-Groot and Bernick-Greenberg Reference De-Groot and Bernick-Greenberg2012: 147; Eisenberg Reference Eisenberg2012: 272).
Phase II: The Earliest Public Architecture
The next phase, representing the MBA occupation with confirmed architectural remains, some of which attain public character, was dated from the 19th century and the very beginning of 18th century in all the three baulks in Area E, beneath the Spring Tower and in Area U.
The initial construction of Wall W285 in its narrow, early phase can be attributed to this phase. This is based on the dates (RTD-10221, 10222) attained from inside the stony fill of Floor 1689 abutting the narrow wall. The thick layer of ash overlying the pavement indicates the surface had gone out of use between 1830 and 1770 BC (RTD-10224, 10223, 9590), placing the building of the narrow wall most likely close to the beginning of 19th century BC (baulk P5). Additionally, the rich ceramic fill (baulk PQ5 RTD-10528, 10527, 10447, 10444, 10300, 10302), as well as the thick layer of ash in T5 (R comb (RTD-9592, 8460, 9593)) that can be associated with an installation (baulk T5), from Area E, gave similar dates suggesting intense activities in this period.
The dates associated to the floor layers underneath the Spring Tower can be associated to the Phase II on the basis of the radiocarbon dates (RTD-7902, 7904, and 7905). In Area U, evidence for Phase II was found beneath Room 1948, dated to the 16th century BC (see further below), and Channel 17121, where slightly later dates, around 1800 BC were retrieved.
The modeled transition presented here between Phase II-III dates to 1780–1760 BC (Figures S21 and S22). If the transition to Phase III is associated with the widening of Wall W285, following Shiloh (Reference Shiloh1984) and De Groot and Bernick-Greenberg (Reference De-Groot and Bernick-Greenberg2012) understanding of the stratigraphic sequence, the transition from Str. 18 and Str. 17 date to the same time. However, below, dates that move this construction to Phase V suggest otherwise.
Phase III: Continuous Occupation
The third group of dates clusters in the mid-late 18th century BC. In Area E, directly superimposing the 19th century features, installations (P5 RTD-9591and 9587; T5 RTD-9588 and 10125) were dated to this time. Wall W875 (T5 RTD-9586 and 9599) should probably also be attributed to this phase as well, based on the dates from both sides of the wall, originating from concentrations of bones and an ash patch. Note that the wall could also be a later, Iron Age IIA (St. 13) intrusion cutting into the Middle Bronze floor.
As presented above, the dates retrieved beneath the widening of Wall W285 allow for two possible chronological attributions. If the single date (RTD-10216) of the early 15th century BCE is interpreted as an outlier, then this widening should be attributed to Phase III. However, this explanation seems less likely than the attribution to Phase V (see further below).
In the Spring Tower, the uppermost MBA layer (RTD-8064) dates to this phase. The dating of the Spring Tower and other public architectural elements around the spring (Ussishkin Reference Ussishkin2016; Regev et al. Reference Regev, Uziel, Szanton and Boaretto2017a) has been contested in recent publications (Reich Reference Reich2018). While 14C evidence suggests that the tower was built during the Iron Age (9th century BC), some scholars maintain that this was a rebuilding operation and the original construction took place during the Middle Bronze Age. The fact that Wall W285 was constructed and the spring was settled, but not fortified, suggests that there was not any simultaneous fortification phase that included the construction of a city wall half way up the slope together with a projecting tower around the spring. Whatever scenario is chosen for the construction of the Spring Tower, it had to take place at least a century after Wall W285 was already built (and see De-Groot and Bernick-Greenberg Reference De-Groot and Bernick-Greenberg2012: 147) for the suggestion that the Spring Tower was added after Wall 285).
Phase IV: A Settlement Gap?
The 17th century is very poorly presented in the current study: part of the radiocarbon age probability distribution in section PQ5, falls in the beginning of this century, as well as the later date beneath the channel/installation in Area U, suggesting the channel/installation, was built either at the very end of the 17th century or beginning of the 16th century BC.
Interestingly, according to her ceramic analysis, Steiner (Reference Steiner2001: 22) suggested that the settlement ceased to exist around the MBI/II transition, as no ceramics later than this were found in Kenyon’s excavations. Eisenberg (Eisenberg Reference Eisenberg2012: 272–273), however, attributed a late MB II ceramic phase (MBIII according to the terminology used here) for Shiloh’s Stratum 17, claiming this to be evidence for a continuous chronological range for the settlement in Jerusalem.
Phase V: Renewed Settlement
Subsequent to the apparent gap noted in Phase IV above, the settlement in Jerusalem was renewed, with significant architectural remains. In the 16th century BC, a building was constructed in close vicinity to the fortified passage and the spring. The channel/installation has highest probability of being built during this time. An ash layer, near the channel/installation, several cm above the bedrock, also dated to the 16th century BC. The ash layer was identified covering an area of at least 2 m2, but it did not cover the channel, and in fact the channel kept functioning until the beginning of 15th century BC, dated by charred seeds found in grey sediments at the very bottom of the channel/installation.
In addition, in Area E, an out of context sample was dated to this time, also suggesting activity in that area. In light of these dates it is essential to consider the latest date found beneath the widening of Wall W285. The widening of the wall would certainly have required the movement of significant amounts of earth, placed beneath it and by its side, in order to support its construction. If the late date (RTD-10216) was the only late date at the site, its definition as an outlier would have been justifiable easily. The fact that we were able to identify settlement activities by the spring and in Area E, seems to indicate that this single date should not be ignored and the widening of the wall should be correctly attributed to the early stages of the 15th century BC.
The Implications of Jerusalem’s Settlement History on MBA Chronology in the Southern Levant
The above-presented dates have important implications for the history of settlement in Jerusalem, as well as broader implications regarding the debates of Middle Bronze Age chronology—and therefore history—in the southern Levant. Figure 8 presents a comparison of the radiocarbon dates between Jerusalem surrounding sites in the southern Levant and Egypt (for raw data see supplementary online material, Table S1).
MB radiocarbon dates from southern Levant sites (including Jerusalem), compared to various MB site chronologies (see Table S1) (Bruins and van der Plicht Reference Bruins and van der Plicht1995, Reference Bruins and van der Plicht2019; Carmi and Ussishkin Reference Carmi, Ussishkin and Ussishkin2004; Toffolo et al. Reference Toffolo, Arie, Martin, Boaretto and Finkelstein2014; Webster Reference Webster2015; Höflmayer et al. Reference Höflmayer, Yasur-Landau, Cline, Dee, Lorentzen and Riehl2016b, Reference Höflmayer2019; Marcus Reference Marcus and Shortland2016; Falconer and Fall Reference Falconer and Fall2017; Martin et al. Reference Martin, Finkelstein and Piasetzky2020). Each date is represented by a line, covering the calibrated, unmodeled, 68.3% probability range. The colors are based on the archaeological identification of the dated context and not on the date itself. The periods are marked: MB I (green), MB II (blue), and MB III (red). When the plot is gray, no associated material culture was found, making it impossible to determine the cultural subphase. Note that the plot is arranged stratigraphically, per site, from the earliest phase to the latest. The transitions between the sub-periods are calculated based on a model containing all the samples above, except Jerusalem (See Figures S23 and S24). The transitions are: MB I-II between 1790–1760 BC (68.3%), 1830–1745 BC (95.4%); MB II-III is between 1670–1630 BC (68.3%), 1700–1610 BC (95.4%); and the end of MB III to 1515–1485 BC (68.3%), 1530–1460 BC (95.4%). The Jerusalem Phases transitions are: I-II early 19th century, II-III 1780–1760 BC, III-IV beginning of 17th century, IV-V end of the 17th century, V ends in early 15th century. The compared chronologies at the bottom are based on Höflmayer (Reference Höflmayer2017, Reference Höflmayer2019), Streit (Reference Streit2017), and Bronk Ramsey et al. (Reference Bronk Ramsey, Dee, Rowland, Higham, Harris, Brock, Quiles, Wild, Marcus and Shortland2010).
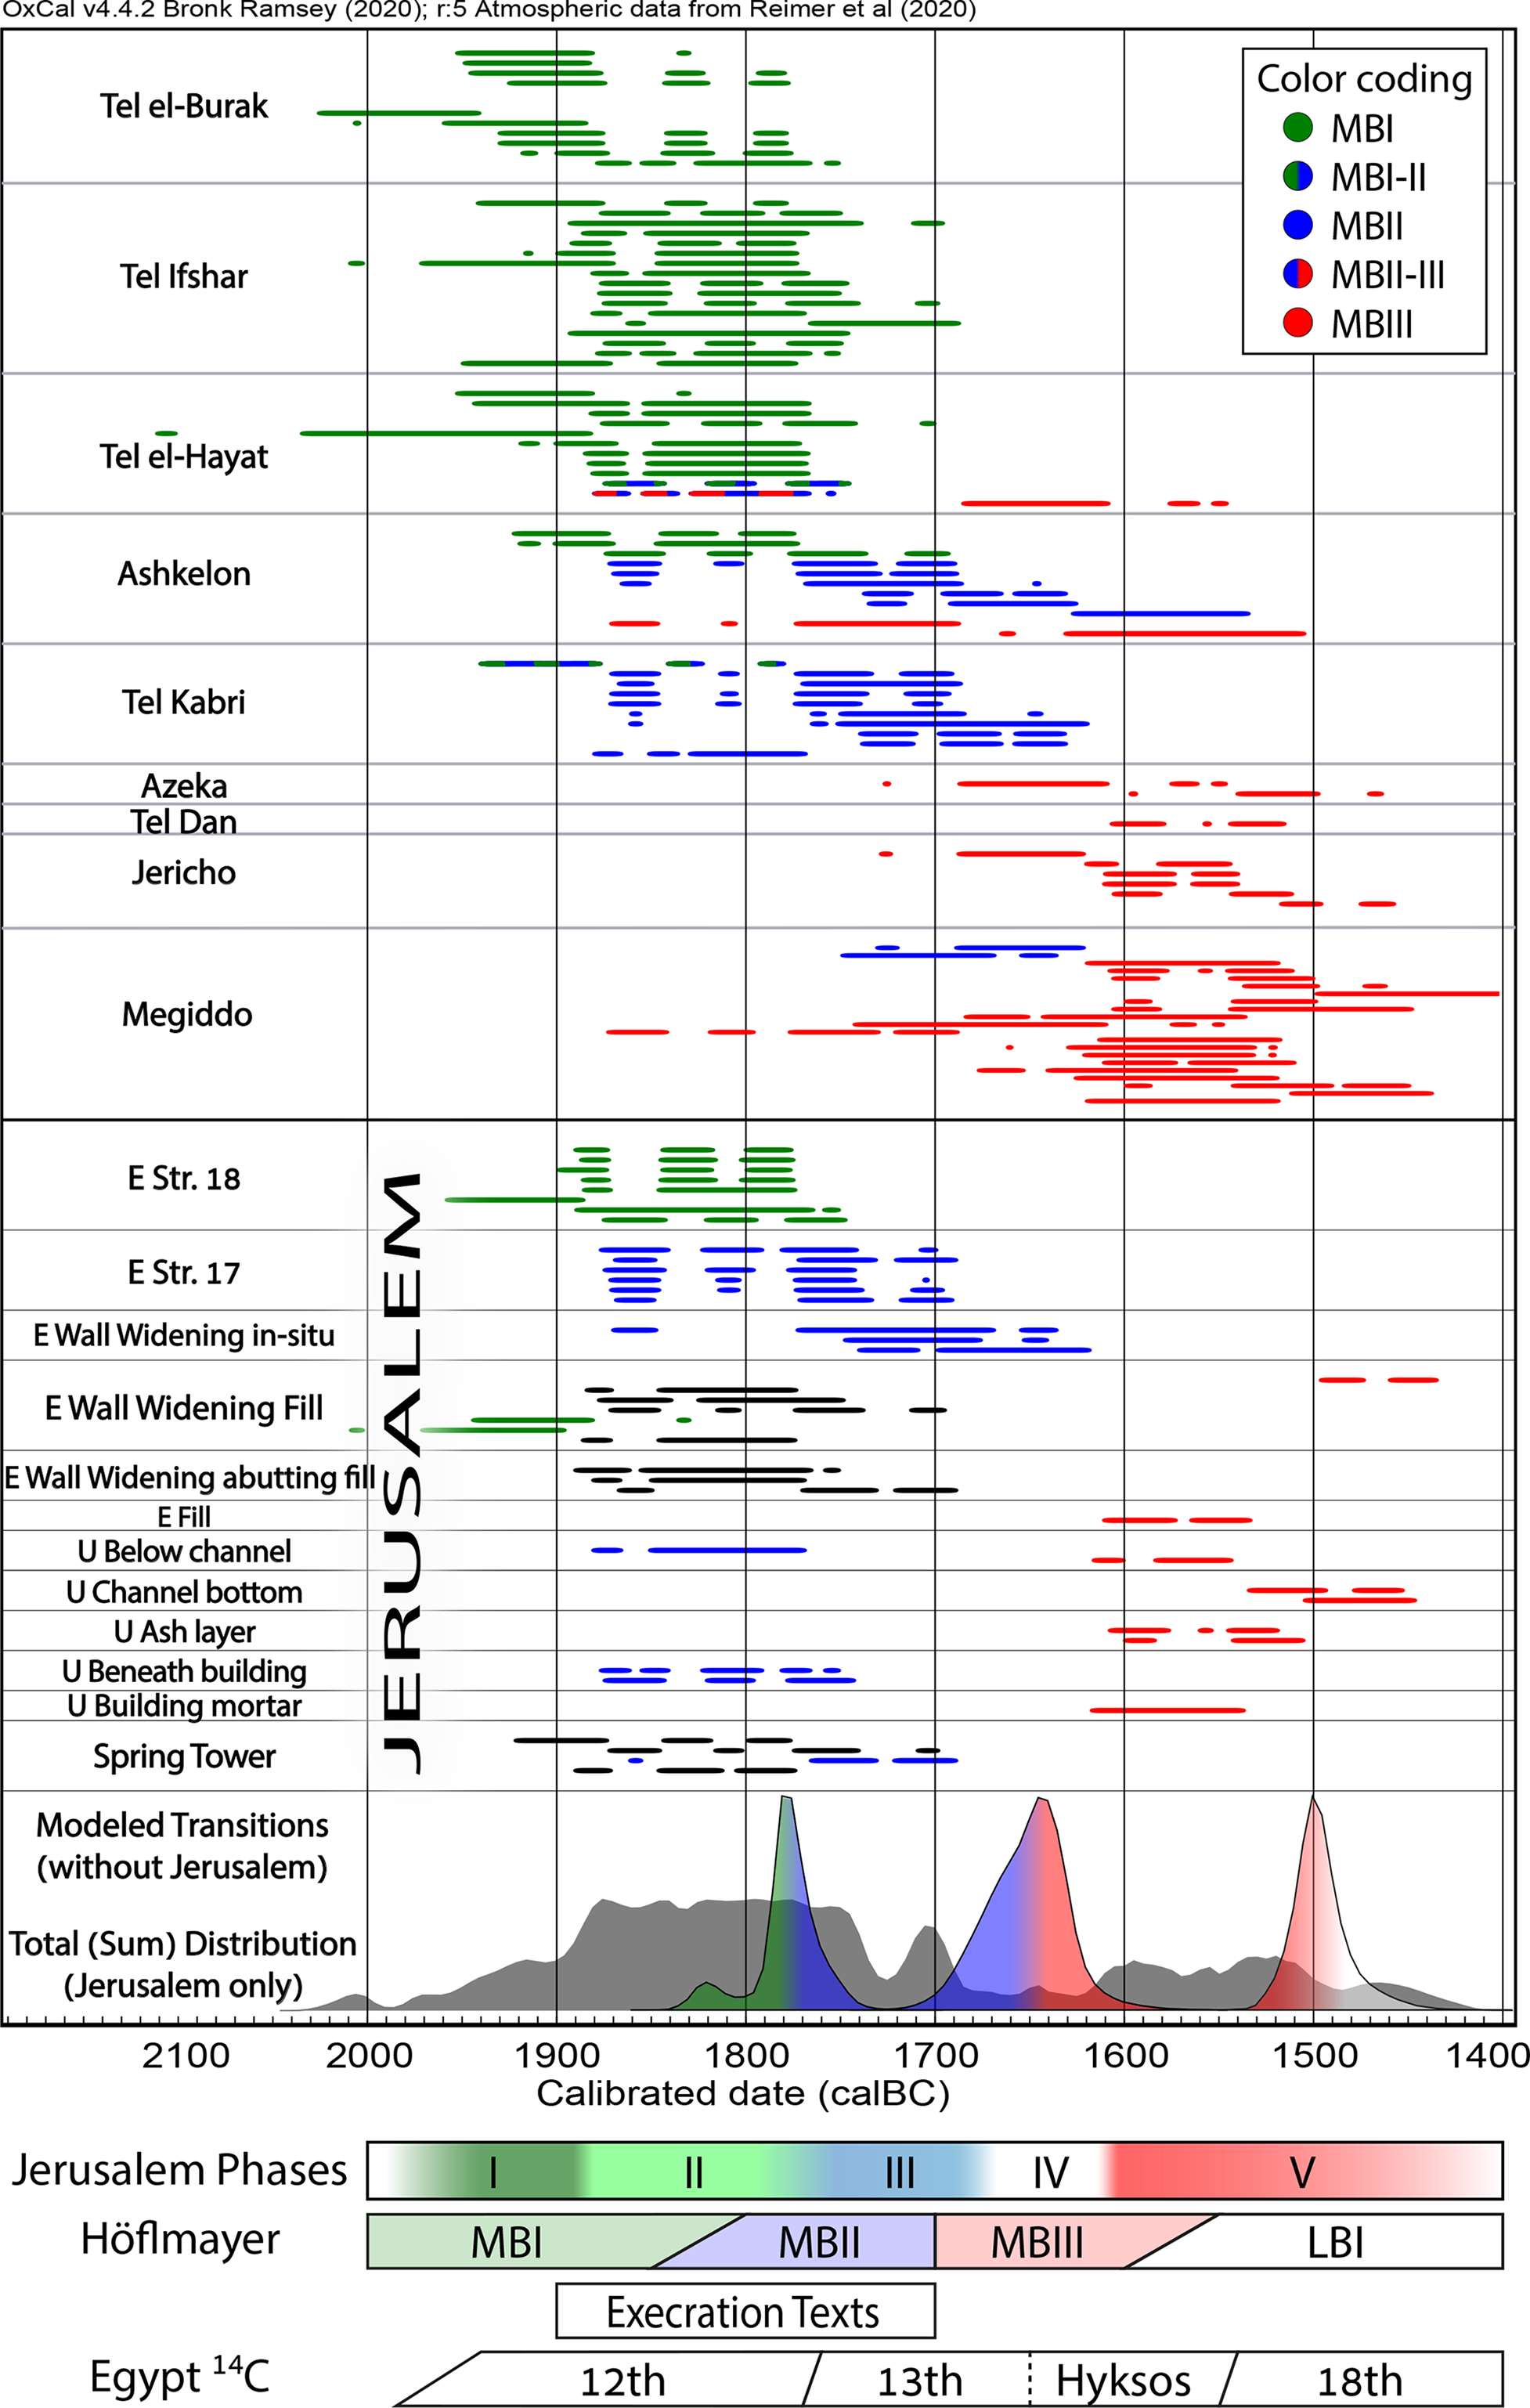
As noted above, Phase I in the settlement in Jerusalem begins already in the 20th century BCE. No architectural remains were uncovered, and the site was probably rural in its nature. It seems that Jerusalem held a similar nature to that of Shechem (Tell Belatah) of St. XXII-XI which was also a small and unfortified settlement (Campbell and Wright Reference Campbell and Wright2002). These dates indicate that the hill country likely witnessed a wave of rural settlement already in the 20th century BC. Well-developed urbanism was restricted however, in this phase to the coastal plain, to sites such as Tell el-Burak, Tel Ifshar (based on 14C dates), and Tel Aphek (based on typology), which seem to have their public construction already beginning at this time (Cohen Reference Cohen2017; Greenberg Reference Greenberg2019: 200). With no associated pottery with these dates, it is not possible to determine if these dates support Höflmayer’s (Reference Höflmayer2017) suggestion for the onset of the MBI, at least for Jerusalem.
In order to compare the 14C-based chronologies of the surrounding sites recalibrated using IntCal20 calibration curve, we built a simple model utilizing the “outlier model” (Bronk Ramsey Reference Bronk Ramsey2009b). In the model, we included only dates from short-lived material and associated to clear cultural material using definitions (as in Ilan Reference Ilan and Levy1995) MB I, II, III as defined by the excavators. All dates from the same cultural period were grouped as a phase, and the transitions between the phases were a single “contiguous” boundary. This model is a sequence of three contiguous phases, with a total of 88 dates. With this simple model, we wanted to distinguish two possibilities: (1) If the transition is very spread, it would indicate that between the phases there might be some gaps or the calibration curve has a plateau; (2) If the transition in each site happened in very different time, then there would be many outliers before and after the transitions with an effect on the agreement of the model. The outlier model used here is in the supplementary material sections SM5 (Figures S23, S24) and SM7. The agreement of the model is 117% with six outliers. This result indicates that the transitions MB I-II and MB II-III could be synchronous in the southern Levant.
The transition for MB I-II falls between 1790–1760 BC (1830–1740 BC with 95.4% probability distribution), roughly 50 years later than suggested by Höflmayer (Reference Höflmayer2017). Interestingly, the modeled transition (Figures S21, S22) between Jerusalem Phase II Shiloh Stratum 18 and Phase III Shiloh Stratum 17 falls in the beginning of the 18th century BC. The dating of Phase II to the 19th–early 18th century BC with the construction of Wall W285, shows that communal building projects had begun in Jerusalem in this phase and corresponds nicely with accepted dating of the execration texts (Streit Reference Streit2017). Considering cultural association, the date of Phase II in Jerusalem provides a time frame for the first evidence for public construction at Shechem, Str. XX (Campbell and Wright Reference Campbell and Wright2002).
Whereas the continued occupation of Jerusalem in the 18th century BC follows suit with the growth of other sites in the region, the gap noted in Jerusalem settlement in the 17th century BC is of interest. In fact, no other central site in the country shows such a gap and most places are understood to be reaching their zenith in what is considered to be the MB II and III periods, some 250–300 years long (Greenberg Reference Greenberg2019), which in our model would be 1790–1500 BC. It seems that the gap in Jerusalem is synchronous with the MB II-III transition in the region, calculated to 1670–1630 BC (1700–1610 BC with 95.4% probability distribution). It is impossible to verify whether the entire site of Jerusalem was not inhabited and for how long this gap lasted, but it can be argued that there is a need to give space for individual histories.
Höflmayer places the end of the MBA roughly at the end of the 17th century BC. Our model suggests a later date, around 1500 BC. The phase V dates from Jerusalem show that the site underwent a renewed expansion, marked by construction activities and the repair or refurbishing of public architecture as may be inferred from the latest date (RTD-10216) found below the widening of Wall W285. In this sense, the dates of the Middle Bronze Age destruction of sites such as Jericho, Azeka, and Lachish, in the 16th century BC, do not match the continued occupation of Jerusalem in the 15th century BC. A possible solution would be to place Phase V in the Late Bronze Age. However, the ceramic assemblages and other finds, such as a late MB II scarab (Eisenberg Reference Eisenberg2012: 273), seems to suggest that this is not the case.
The transition from the Middle to Late Bronze Age has been heavily debated, with scholars challenging the earlier paradigm of Egyptian conquest and hegemony of the southern Levant in favor of other factors, such as climate change or internal strife leading to the destruction of sites at the end of the MB. The data presented here clearly fits with the idea that the transition occurred in the more central areas of the lowlands earlier on. It did not affect the inland areas of the hill country in the same manner (e.g., Uziel Reference Uziel2008), with later waves of destruction affecting the valleys (e.g., Jericho, Tell Hayyat). Only in its final stages would the hill country—and particularly Jerusalem—be affected by the changing political setting in the region. This sequence of events and its chronological attribution, as seen in the dates presented here, dovetail nicely with the Egyptian campaigns known in historical sources as an explanation for the destruction of MB sites across the region, though with a slight range in the dates provided from each site. In this sense, very high-resolution chronologies need to be obtained for MB sites, which will allow us to better pinpoint events and allow for synchronizations, such as the Middle Bronze ceramic tradition lingering longer in Jerusalem and its environs while other sites experience destruction earlier (Jericho, Azekah, Lachish) and others came under the Egyptian yoke (Tel el Ajul, Megiddo).
CONCLUSIONS
The absolute dating of various portions of the MBA settlement of Jerusalem, through radiocarbon dating coupled with microarchaeology and stratigraphic sequencing, clarified the settlement history of the site. The settlement began already in the 20th century BC and continued until the 15th century BC, with an apparent gap in the 17th century BC. The architectural finds in Jerusalem, such as the earliest walls around the settlement in the 19th century, now with absolute dates, allow for comparison with the previously radiocarbon-dated southern Levantine sites, creating a platform for understanding the chronology of the urban development of the Hill Country surrounding Jerusalem, in comparison to other regions. The dating of the first intense settlement of Jerusalem correlates with the time of Egyptian Execration texts where Jerusalem is also mentioned. The emerging settlement history of Jerusalem, throughout the 500 years of the MBA, is that of a sparse settlement developing into a small town, with some sort of a break in the settlement in the middle of the MBA, with recovered occupation several decades later, when it continued to be settled through the latest phases of the Middle Bronze Age.
ACKNOWLEDGMENTS
The research presented here is part of a project on the absolute dating of ancient Jerusalem and supported by the Israel Science Foundation (Grant No. 1873/17). The excavations in Area U (License A7916; A8257) were conducted by Ortal Chalaf and Joe Uziel, on behalf of the Israel Antiquities Authority. The project was conducted within the confines of the City of David National Park and funded by the Elad Foundation. We wish to thank all the support given by the IAA and Elad. The excavations of the baulks in Area E were directed by Yuval Gadot with the help of Helena Roth (license numbers G-62/2015; G-24/2016; G-11/2017). The excavations were conducted in cooperation with Macquarie University (Sydney, Australia, 2015), University of Bonn, University of Heidelberg, the Christian Theological Academy in Warsaw (2016), Charles University, Prague, and Zurich University (2017). The work was made possible thanks to the generous contribution of Dr.med. Holger Aulepp. The authors wish to extend their thanks to Prof. Manfred Oeming, Prof. Axel Graupner, Prof. Gill Davis, Prof. Martin Prudký, Prof. Filip Čapek, Prof. Jakub Slawik, and Dr. Florian Oepping. In all excavations, Johanna Regev was responsible for microarchaeology and radiocarbon sampling. We wish to thank Alon De-Groot for his permission to use Shiloh excavation section drawings and plans. The Radiocarbon research was supported by the Exilarch Foundation for the Dangoor Research Accelerator Mass Spectrometer (D-REAMS) Laboratory. We wish to thank the Kimmel Center for Archaeological Science and George Schwartzman Fund for the laboratory and funding support for microarchaeology material analysis. E.B. is the incumbent of the Dangoor Professorial Chair of Archaeological Sciences at the Weizmann Institute of Science.
Supplementary material
To view supplementary material for this article, please visit https://doi.org/10.1017/RDC.2021.21


 Open access