

1. Introduction
In the 1960s, significant work—often combined under the rubric of what became known as the monetarist experiment—by Brunner (Reference Brunner1961), Brunner and Meltzer (Reference Brunner and Meltzer1963), Friedman (Reference Friedman1961), and Friedman and Schwartz (Reference Friedman and Schwartz1963)—posited a strong connection between money and real economic activity. Later, a new Keynesian consensus emerged—buttressed by the influential work of Bernanke and Blinder (Reference Bernanke and Blinder1992) and Taylor (Reference Taylor1993)—which ultimately resulted in, as the title in Leeper and Roush (Reference Leeper and Roush2003) implies, taking money out of monetary economics.
Modern monetary models have, by and large, de-emphasized monetary aggregates in favor of connecting monetary policy and aggregate demand using a single short-term nominal interest rate. Rationales for this include: (i) the signaling advantage that interest rates provide over monetary aggregates, and (ii) that interest rates are included in traditional IS equations, whereas money balances typically are not. Nelson (Reference Nelson2003), however, argued that monetary aggregates can provide useful information over and above short-term interest rates whether or not there is a direct channel linking money to aggregate demand—a view that has become more salient following the global financial crisis.
Barnett (Reference Barnett1980) demonstrated the theoretical superiority of appropriately weighted monetary aggregates, referred to as Divisia indexes, over conventional simple-sum monetary aggregates. Divisia money measures can internalize pure substitution effects among the components of the index, whereas their simple-sum counterparts implicitly assume that the component monetary assets are all perfect substitutes for one another. Consequently, conventional monetary aggregates are poorly suited to the role envisioned for them by Nelson (Reference Nelson2003); See Barnett (Reference Barnett1980), Belongia (Reference Belongia1996), and Barnett et al. (Reference Barnett, Fisher and Serletis1992). Construction of Divisia indexes for the U.S. beginning with the seminal work of Barnett (Reference Barnett1978, Reference Barnett1980)—and more recent refinements in Anderson and Jones (Reference Anderson and Jones2011) and Barnett et al. (Reference Barnett, Liu, Mattson and van den Noort2013)—generated a large empirical literature, spanning over forty years, on the relevance of Divisia for the determination of money demand and monetary policy in the U.S. The literature has been extended to many other countries. The Bank of England, for example, has been publishing Divisia measures and underlying data for the U.K. since the early 1990s, which have been employed in a wide range of empirical studies, while continuing to update and improve its data and methodology over time; See, for example, Hancock (Reference Hancock2005).Footnote 1
While the majority of this empirical work has been done in a reduced-form framework, a few important papers establish a theoretically motivated approach to modeling the effects of monetary policy shocks that includes Divisia money measures. We focus on three papers that, in our view, constitute the most visible and widely known structural VARs in this category of structural identification with Divisia: Belongia and Ireland (Reference Belongia and Ireland2016, Reference Belongia and Ireland2018) and Keating et al. (Reference Keating, Kelly, Smith and Valcarcel2019). These three papers conduct analysis for the U.S. economy, and while their identification strategies differ to various degrees, all three focus attention on Divisia money measures. Importantly, these papers also incorporate the corresponding Divisia price duals, otherwise known as dual user cost indexes.
In this paper, we construct a Divisia index for the U.K. over a set of standard monetary components included in the Bank of England’s money measures and a corresponding dual user cost index from 1977 up to the present. As noted by Barlow (Reference Barlow2023),“[i]n the Divisia literature the opportunity cost should be the dual aggregated user cost, unfortunately the Bank of England does not provide data for this user cost.” Building on Fleissig and Jones (Reference Fleissig and Jones2023, Reference Fleissig and Jones2024)—who focused on a household-sector Divisia measure—we construct our Divisia measure and its associated dual user cost index over both households and private non-financial corporations. The Bank of England currently employs an upper envelope approach in its calculation of the benchmark rates underlying its Divisia measures. This can result in inconsistent, and counter-intuitive, treatment of some monetary components as well as to inconsistencies between the household and corporate sectors. In contrast, we employ a methodology that results in the consistent treatment of all components throughout our sample period. Our joint construction of the Divisia index and its corresponding Divisia price dual allows us to investigate identification strategies for the U.K. similar to those that Belongia and Ireland (Reference Belongia and Ireland2016, Reference Belongia and Ireland2018) and Keating et al. (Reference Keating, Kelly, Smith and Valcarcel2019) investigated for the U.S. over the longest possible sample period dating back to 1977.Footnote 2
Previously, Binner et al. (Reference Binner, Chaudhry, Kelly and Swofford2018) constructed Divisia measures for the U.S. and U.K. using data from 1998Q1 to 2013Q3 that included both standard monetary components and risky capital-uncertain assets, such as bonds, introducing forecasted returns on the risky assets. They tested groupings of monetary and financial assets for weak separability and then implemented the structural identification from Keating et al. (Reference Keating, Kelly, Smith and Valcarcel2019) using their corresponding “risky” Divisia money measures.Footnote 3 Ezer (Reference Ezer2019) constructed a Divisia index for the U.K. and estimated models based on Belongia and Ireland (Reference Belongia and Ireland2016) over two sample periods: 1978Q3 to 1990Q1 and 1993Q1 to 2011Q3. In another structural VAR framework, Ellington et al. (Reference Ellington, Michalski and Milas2022) study the impact of economic policy uncertainty and financial stress shocks on the U.K. economy over the period from January 2000 to January 2021.Footnote 4 Citing Keating et al. (Reference Keating, Kelly and Valcarcel2014) and Keating et al. (Reference Keating, Kelly, Smith and Valcarcel2019) to motivate the use of the Bank of England’s Divisia money measure as a policy indicator, they find that GDP growth is positively impacted by Divisia monetary stimulus.Footnote 5
As a preview of our results, recursive and non-recursive structures for the U.K.—of the types advanced by Belongia and Ireland (Reference Belongia and Ireland2016, Reference Belongia and Ireland2018) and Keating et al. (Reference Keating, Kelly, Smith and Valcarcel2019) for the U.S.—reveal severe price puzzles when imposing a short-term nominal interest rate as the indicator of monetary policy. On the other hand, considering our Divisia index to be the indicator of monetary policy resolves the price puzzle across multiple specifications—while also including various interest rates in the information set of our VARs. Our conclusions on the usefulness of Divisa money as an indicator—not necessarily as an instrument—of monetary policy for the U.K. are consistent with what Keating et al. (Reference Keating, Kelly, Smith and Valcarcel2019) and Chen and Valcarcel (Reference Chen and Valcarcel2021) find for the U.S., and what Colunga-Ramos and Valcarcel (Reference Colunga-Ramos and Valcarcel2025) find for Mexico.
The rest of this paper is organized as follows: Section 2 provides background on the Bank of England’s U.K. Divisia measures. Section 3 details our construction of the Divisia indexes and their duals for the U.K., which we use in our estimations. Section 4 outlines the data we employ in our models. Section 5 describes the relationship between the cyclical components of our Divisia measures and U.K. output and prices. Section 6 investigates a partially recursive identification of monetary policy shocks with the Divisia measures we constructed and compares them to a benchmark VAR specification with Bank Rate or a shadow rate as the policy indicator. Section 7 considers two alternative non-recursive identification strategies with an interest rate as the indicator of monetary policy. Section 8 offers a new alternative structural model that advances a clear separation of money demand from policy shocks with our Divisia index as the indicator of monetary policy. Section 9 concludes.
2. Background on the Bank of England’s Divisia measures
The Bank of England (henceforth, BoE) has published Divisia money measures since Fisher et al. (Reference Fisher, Hudson and Pradhan1993) with Hancock (Reference Hancock2005) detailing significant revisions to the measures.Footnote 6 At the time of Hancock’s writing, BoE published Divisia measures for the household sector, private non-financial corporations (PNFCs), and other financial corporations (OFCs), along with an aggregate constructed over all three sectors. Hancock (Reference Hancock2005) also introduced an aggregate Divisia measure for households and PNFCs that excluded OFCs.
BoE discontinued publication of both OFC Divisia and the broader aggregate Divisia measure after 2013; See Berar (Reference Berar2013). Currently, BoE publishes household-sector Divisia, PNFC Divisia, and an aggregate Divisia measure constructed over households and PNFCs. For ease of exposition, we refer to the latter as simply aggregate Divisia for the remainder of the paper. BoE’s Divisia measures are available at quarterly frequencies beginning in 1977 and at monthly frequencies beginning in 1997. As noted previously, however, BoE does not currently publish dual Divisia price (user cost) indexes corresponding to its Divisia quantity indexes, which is a crucial factor limiting how they can be employed in empirical analysis.Footnote 7
Household Divisia and PNFC Divisia both include the holdings of notes and coin and non-interest-bearing sight deposits from the respective sectors. BoE published data for banks and building societies through December 2009, and for banks (excluding mutuals) and mutuals beginning in January 2010; See Berar (Reference Berar2013). Originally, both household Divisia and PNFC Divisia included interest-bearing sight deposits at banks, time deposits at banks, and building society deposits from their respective sectors as separate components. Beginning in 1998, household-sector building society deposits were broken out into instant access accounts (sight deposits) and accounts requiring a notice period for withdrawal. BoE ceased publishing separate data, however, for mutually owned and non-mutually owned monetary financial institutions (MFIs) in 2013 and the BoE’s Divisia measures were correspondingly revised; See Bailey (Reference Bailey2014). Currently, BoE only publishes total series for MFIs. Figure 1 compares annual percentage growth rates of the BoE’s household-sector Divisia measure to the corresponding conventional monetary aggregate (MFIs’ sterling M4 liabilities to the household sector, break-adjusted).
Annual growth rates of Bank of England’s household-sector money measures for the United Kingdom: $\left ( x_{t}-x_{t-4}\right )/x_{t-4}$
as a percentage.
$\left ( x_{t}-x_{t-4}\right )/x_{t-4}$
as a percentage.
Solid series denotes household-sector Divisia and dotted series denotes break-adjusted sterling M4 liabilities to the household sector.
Source: Bank of England.

The real user costs of individual monetary assets are based on the well-known formula from Barnett (Reference Barnett1978) and Donovan (Reference Donovan1978) as follows:
 \begin{equation} u_{i,t}=\frac{R_{t}-r_{i,t}}{1+R_{t}} \end{equation}
where $R_{t}$
is a benchmark rate of return on a non-monetary asset and
$R_{t}$
is a benchmark rate of return on a non-monetary asset and $r_{i,t}$
is the own rate of return on the
$r_{i,t}$
is the own rate of return on the $i$
th monetary asset. Expenditure shares are defined as
$i$
th monetary asset. Expenditure shares are defined as $w_{i,t}=u_{i,t} m_{i,t}/\sum _{j=1}^{N}u_{j,t} m_{j,t}$
where
$w_{i,t}=u_{i,t} m_{i,t}/\sum _{j=1}^{N}u_{j,t} m_{j,t}$
where $m_{i,t}$
is the amount outstanding of the
$m_{i,t}$
is the amount outstanding of the $i$
th monetary asset. The growth rates of the BoE’s Divisia measures, denoted by
$i$
th monetary asset. The growth rates of the BoE’s Divisia measures, denoted by $DM_{t}$
, are calculated by:
$DM_{t}$
, are calculated by:
 \begin{equation} \frac{\Delta DM_{t}}{DM_{t-1}}=\sum _{i=1}^{N}\left (\frac{w_{i,t}+w_{i,t-1}}{2}\right )\frac{\Delta m_{i,t}}{m_{i,t-1}} \end{equation}
where $N$
is the number of monetary assets. For their Divisia measures, the Bank uses break-adjusted flows for
$N$
is the number of monetary assets. For their Divisia measures, the Bank uses break-adjusted flows for $\Delta m_{i}$
but non-break-adjusted levels for
$\Delta m_{i}$
but non-break-adjusted levels for $m_{i}$
, which removes the effects of breaks in the levels from the corresponding growth rates.Footnote 8 BoE employs an envelope approach to calculate the benchmark rate for each sector so that the benchmark rate is the highest tax-adjusted rate of return from among the components.Footnote 9
$m_{i}$
, which removes the effects of breaks in the levels from the corresponding growth rates.Footnote 8 BoE employs an envelope approach to calculate the benchmark rate for each sector so that the benchmark rate is the highest tax-adjusted rate of return from among the components.Footnote 9
The benchmark rate for PNFCs is the highest rate of return paid from among the PNFC monetary assets in each period. As explained by Hancock (Reference Hancock2005, pp. 41), at the time of his writing “the benchmark rate [for companies] switches over time between the rate paid on building society deposits and on bank time deposits.” This approach is problematic, because it implies that when these components are paid the highest rate they have a zero user cost and are assumed to provide no monetary services. More generally, the envelope approach can lead to components being treated inconsistently over the sample, since a component could be paid a rate below the benchmark rate in some periods, implying that it is treated as a monetary asset with a positive user cost in such periods, but the same component could be treated as the benchmark asset in other periods when it is paid the highest rate. Indeed, as Fisher et al. (Reference Fisher, Hudson and Pradhan1993, pp. 246) argued, “[a] number of problems arise when using a maximum-rate benchmark. In principle the benchmark asset should not provide monetary services and, as such, an asset that is included as money in a previous time period should not later be used as the benchmark.” As previously noted, deposits are no longer separated in this way. For the current set of components, MFI time deposits from PNFCs earn higher rates than sight deposits and, consequently, act as the benchmark asset.
Prior to Hancock (Reference Hancock2005), the BoE proxied the benchmark rate for the U.K. Divisia measures as the 3-month rate on Local Government (LG) bills plus 200 basis points. For the household sector, BoE continues to include the LG bills rate in the envelope until 1993 and includes the rate of return on Tax Exempt Special Savings Accounts (TESSAs) beginning in 1991. As Hancock (Reference Hancock2005, pp.41) explained, “since 1991 the household benchmark rate has been the TESSA or Individual Savings Accounts (ISA) rate after ISAs replaced TESSAs in 1999. This seems satisfactory: because of their tax treatment these accounts are largely held to satisfy a savings motive.” This approach can often result, however, in inconsistencies across the two sectors. For example, when TESSAs or ISAs are the benchmark asset for the household sector, the user costs of bank time deposits and building society deposits from households will both be positive, whereas for PNFCs—whenever these components are paid the highest rate from among the PNFC components—they will have a user cost of zero, as discussed above. Moreover, the ISA rate has not always served as the benchmark rate for household Divisia in subsequent periods. As explained by Berar and Owladi (Reference Berar and Owladi2013), the benchmark rate for households had, at the time of their writing, “tended to be the rate on time deposits excluding ISAs,” although they anticipated that “the ISA rate will most likely be the benchmark rate” in the future due to recent changes in the data. When the ISA rate is not the highest rate, the user cost of ISAs becomes positive implying that they are treated as a monetary asset in the index despite Hancock’s reasoning that they are held as savings, while the component with the highest rate (time deposits) becomes the benchmark asset.Footnote 10
3. Constructing a Divisia index and its price dual for the U.K.
We construct our quarterly, seasonally adjusted, aggregate Divisia index over households and PNFCs from 1977 to 2023. Importantly, we also construct a corresponding aggregation-theoretic dual user cost (price) index for our Divisia quantity index. Without a Divisia price dual, we would not be able to investigate whether structural models of the types advanced by Belongia and Ireland (Reference Belongia and Ireland2016, Reference Belongia and Ireland2018) and Keating et al. (Reference Keating, Kelly, Smith and Valcarcel2019) shed light on the U.K. economy.Footnote 11
Our Divisia indexes are constructed from quarterly, seasonally adjusted data on flows and amounts outstanding of the components using the formula (2) from the previous section. We do not include TESSAs or ISAs in our index following Bissoondeeal et al. (Reference Bissoondeeal, Jones, Binner and Mullineux2010) and Fleissig and Jones (Reference Fleissig and Jones2023, Reference Fleissig and Jones2024) and in line with Hancock’s reasoning. Following Fleissig and Jones (Reference Fleissig and Jones2023, Reference Fleissig and Jones2024), we define the benchmark rate for the household sector as the highest rate of return from among the household-sector components plus a 60 basis point liquidity premium.Footnote 12 Correspondingly, we define the benchmark rate for PNFCs as the highest rate of return from among the PNFC components plus 60 basis points. The own rates of the components and the benchmark rates are converted to after-tax terms when computing monetary asset user costs, as in Hancock (2005), based on tax rates provided to us by BoE. The corresponding benchmark rates differ for the two sectors because their tax rates differ and because the rates paid on household-sector deposits differ from the rates paid to PNFCs. However, the benchmark rates are conceptually the same for the two sectors and the user costs are always positive for all of the included components for both sectors. In this sense, the treatment of monetary assets is consistent throughout the sample period as well as across sectors.
Table 1 lists the components of our aggregate Divisia index over various time periods. Beginning in 2008, we construct our measure over holdings of notes and coin, non-interest-bearing deposits, interest-bearing MFI sight deposits, and MFI time deposits from both the household sector and from PNFCs.Footnote 13 For earlier periods, our measure includes notes and coin, non-interest-bearing deposits, interest-bearing sight deposits at banks, time deposits at banks, and building society deposits from each sector. Household-sector building society deposits are disaggregated in the index when the data permit it.
Components of aggregate Divisia index for the UK

Notes:
[a] Quarterly, seasonally adjusted data on flows and amounts outstanding are available from the Bank of England’s online database through 2013Q3.
[b] Quarterly, seasonally adjusted data on flows and amounts outstanding are available from the Bank of England’s online database through 2009Q4.
[c] Quarterly, seasonally adjusted data on amounts outstanding are available from the Bank of England’s online database beginning in 1998Q4 and the corresponding flows are available beginning in 1999Q1.
[d] Quarterly, seasonally adjusted data on flows and amounts outstanding are available from the Bank of England’s online database beginning in 1996Q3. Corresponding non-seasonally adjusted data are available beginning in 1990Q1.
While the focus of this paper is mainly on our aggregate Divisia measure, we also construct a corresponding household-sector Divisia. Figure 2 compares annual percentage growth rates of our household-sector and aggregate Divisia measures.Footnote 14 As the chart shows, the two series are quite similar. The differences between the annual growth rates of the two Divisia measures are generally within 2%. The sharpest contrast occurs in the second half of 1986 and the first half of 1987, where the growth rates differ by over 5%. The differences are also elevated during the initial stage of the global pandemic. The general similarity of the two measures reflects the fact that the expenditure share of household-sector monetary assets in aggregate Divisia is high for most of the sample—it is always above 80% from 1977 to 2016 and it is never less than 68% over the entire sample.
Annual growth rates of constructed household-sector and aggregate Divisia indexes for the United Kingdom: $\left ( x_{t}-x_{t-4}\right )/x_{t-4}$
as a percentage.
$\left ( x_{t}-x_{t-4}\right )/x_{t-4}$
as a percentage.
Solid series denotes household-sector Divisia and dotted series denotes aggregate Divisia.
Source: Authors’ calculations.

A dual user cost index, $UC_{t}$
, can be constructed for a Divisia index from weak factor reversal:
$UC_{t}$
, can be constructed for a Divisia index from weak factor reversal:
 \begin{equation} \left (\frac{UC_{t}}{UC_{t-1}}\right )\left (\frac{DM_{t}}{DM_{t-1}}\right ) ={\frac{E_{t}}{E_{t-1}}} \end{equation}
where $E_{t}=\sum _{j=1}^{N}u_{j,t} m_{j,t}$
is total expenditure on the monetary services provided by the component assets; See, for example, Bissoondeeal et al. (Reference Bissoondeeal, Jones, Binner and Mullineux2010) and Anderson and Jones (Reference Anderson and Jones2011).Footnote 15 We construct quarterly dual user cost (price) indexes for our household-sector and aggregate Divisia quantity indexes following this standard approach. We compare the dual user cost index for aggregate Divisia to Bank Rate in Figure 3. In the figure, we scale the dual user cost index so that it equals Bank Rate in 2003Q1 to facilitate comparison.
$E_{t}=\sum _{j=1}^{N}u_{j,t} m_{j,t}$
is total expenditure on the monetary services provided by the component assets; See, for example, Bissoondeeal et al. (Reference Bissoondeeal, Jones, Binner and Mullineux2010) and Anderson and Jones (Reference Anderson and Jones2011).Footnote 15 We construct quarterly dual user cost (price) indexes for our household-sector and aggregate Divisia quantity indexes following this standard approach. We compare the dual user cost index for aggregate Divisia to Bank Rate in Figure 3. In the figure, we scale the dual user cost index so that it equals Bank Rate in 2003Q1 to facilitate comparison.
Dual user cost index for aggregate Divisia and Bank Rate.
Solid series is Bank Rate and dotted series denotes the dual user cost index for aggregate Divisia.

Previously, Fisher et al. (Reference Fisher, Hudson and Pradhan1993, pp. 250) calculated a Divisia price dual for the U.K. and observed that since the dual is “based on interest differentials it is not surprising that its historical behavior bears little resemblance to the level of the base rate.” Our figure certainly reinforces that general impression over the corresponding time frame. Following the global financial crisis (GFC), deteriorating economic conditions in the U.K. resulted in a protracted period of expansionary monetary policy by the BoE. Beginning with a special MPC meeting held on October 8, 2008, BoE cut Bank Rate by 50 basis points, followed by a 1.5% cut on November 6th, and by another 1% cut on December 4th. It was subsequently cut three more times until it reached 0.5% in March of 2009, where it was held until 2016. Then, it was reduced by a further 25 basis points beginning in August 2016, but was increased by 25 basis points each in November 2017 and August of 2018. In response to the pandemic, however, it was reduced by 50 basis points and then by a further 15 basis points to 0.1% in March 2020. BoE started to increase Bank Rate beginning in December of 2021.Footnote 16 The dual user cost index had been trending upwards for several years through the end of 2008. It fell sharply thereafter before stabilizing, but then declined further starting around 2013 and continuing for a period of several years; See also Fleissig and Jones (Reference Fleissig and Jones2023). As the figure shows, the steep increase in Bank rate towards the end of our sample period is mirrored by the behavior of the dual user cost index. The remainder of this section consists of additional technical details regarding our data construction.
Following Anderson and Jones (Reference Anderson and Jones2011, pp. 331–332), our aggregate Divisia measure is constructed in segments, which are then spliced together to account for changes in the underlying data. For example, the index is constructed over interest-bearing MFI sight deposits and MFI time deposits beginning in 2008, but it is constructed over sight and time deposits at banks and building society deposits in earlier periods. To handle this change in the data, we construct an index beginning in 2008Q1 based on interest-bearing MFI sight deposits and MFI time deposits and then splice it to an index constructed up to 2008Q1 treating bank deposits and building society deposits as separate components (see Table 1 for full details).Footnote 17 We follow the same approach in 1998Q4 when disaggregated data on household-sector building society deposits becomes available.
Seasonally adjusted data on non-interest-bearing deposits are only available from the BoE’s online database beginning in 1997Q3, so we construct our index using quarterly seasonally adjusted data for flows and amounts outstanding of non-interest-bearing deposits from households and PNFCs that were previously provided by BoE for earlier periods.Footnote 18 Seasonally adjusted flows and amounts outstanding for mutuals deposits from PNFCs are only available beginning in 1996Q3, but corresponding non-seasonally adjusted data are available beginning in 1990. Consequently, we omit mutuals deposits from PNFCs from our index before 1990 due to lack of data.Footnote 19 We use the seasonally adjusted series when they are available. For the intervening period, we calculate seasonally adjusted series from the available non-seasonally adjusted data and use them to construct our index. We follow the same splicing procedure described above when each of these changes to the components occurs.
BoE derives seasonally adjusted data for flows and levels “by first seasonally adjusting a break-adjusted levels series.”Footnote 20 To seasonally adjust the data on mutuals deposits from PNFCs, we first construct a break-adjusted levels series using the available non-seasonally adjusted data from 1990 to 2013 and then seasonally adjust it to obtain multiplicative seasonal factors, $\pi _{t}$
.Footnote 21 Following ECB (2019, pp.192), we then calculate seasonally adjusted levels as
$\pi _{t}$
.Footnote 21 Following ECB (2019, pp.192), we then calculate seasonally adjusted levels as $L_{t}^{SA}=L_{t}^{NSA}/\pi _{t}$
and the corresponding seasonally adjusted flows as:
$L_{t}^{SA}=L_{t}^{NSA}/\pi _{t}$
and the corresponding seasonally adjusted flows as:
 \begin{equation} F_{t}^{SA}=\Delta L_{t}^{SA} - \left (\frac{\Delta L_{t}^{NSA}-F_{t}^{NSA}}{\pi _{t}}\right ) \end{equation}
The user costs of the components of our Divisia measure are computed using the quarterly interest rate series underlying the BoE’s Divisia measures. The only exception to this general rule involves MFI time deposits from the household sector over a brief period. Specifically, as explained by Berar and Owladi (Reference Berar and Owladi2013), data for a new effective rate for ISAs became available beginning in January 2011 and the new effective rate series was significantly higher than the previously available quoted rate series. As Berar and Owladi (Reference Berar and Owladi2013, pp.1) explain, “[t]he interest rates on household sector time deposits excluding ISAs used in the household Divisia money series are calculated by a residual based on the interest rates for all time deposits and the interest rates for ISAs. Changes to the ISA interest rate will therefore also result in changes to the interest rate for time deposits excluding ISAs and thus the household Divisia money series.” We address concerns related to this issue by employing a proxy for the household-sector time deposit rate from 2008Q1 to 2011Q1 and splicing the index accordingly.Footnote 22
4. Overview of the U.K. data
In our structural models below, we consider various interest rates. In addition to Bank Rate, shown previously in Figure 3, we also consider a long-term government bond yield and the Wu and Xia (Reference Wu and Xia2016) U.K. shadow rate.Footnote 23 The shadow rate becomes substantially negative (by construction) after 2008, during which Bank Rate was markedly low for a sustained period. In addition to various interest rates, our models include the aggregate Divisia index and its dual user cost that we constructed as explained in the previous section. As described below, we also considered replacing our aggregate Divisia index and its dual user cost index with the corresponding household-sector measures in our empirical analysis.Footnote 24 Our investigation centers on the effects of interest rates, or Divisia, on economic activity with models that include quarterly real GDP and the implicit price deflator for GDP. Seasonally adjusted GDP at current market prices and the corresponding chained volume measure are from the Office for National Statistics, and we compute an implicit GDP deflator from these series.
VARs have often yielded perverse responses of the price level to monetary policy shocks, which is commonly referred to as the price puzzle. A common justification for the occurrence of price puzzles is that the variables in the VAR do not sufficiently accommodate the full information set considered by central banks. Sims (Reference Sims1992), Bernanke and Mihov (Reference Bernanke and Mihov1998), and Christiano et al. (Reference Christiano, Eichenbaum and Evans1999), among others, argue that commodity prices serve as a good proxy for additional—more forward looking—information available to central banks. We include the Commodity Research Bureau (CRB) Index of commodity prices in all our specifications.Footnote 25
Our quarterly sample spans 1977Q1 to 2019Q4. We consider the COVID-19 shock as sufficiently different from any previous economic downturn in the U.K., that it merits its own analysis.Footnote 26 Many of the preceding recessions in the U.K., including the global financial crisis, likely had a monetary component as a potential catalyst—a proposition that is more difficult to defend for the COVID-19 shock. Nevertheless, the conclusions from our Divisia and Bank Rate specifications remain consistent when we extend the sample through 2023.Footnote 27
5. Cyclical components of money, output, and prices
Elger et al. (Reference Elger, Jones, Edgerton and Binner2008) and Bissoondeeal et al. (Reference Bissoondeeal, Karoglou and Binner2019) find that lagged real money growth rates are significant in models of detrended real GDP for the U.K. using household-sector Divisia and Divisia M4 respectively, and Fleissig and Jones (Reference Fleissig and Jones2024) find that household-sector Divisia is significant in models of detrended real consumption.Footnote 28 Belongia and Ireland (Reference Belongia and Ireland2016, Reference Belongia and Ireland2018) analyze correlations between lags of the cyclical components of U.S. Divisia aggregates and the cyclical components of real GDP and the GDP deflator.Footnote 29 In this section, we present correlations between the cyclical components of real GDP, as well as the GDP deflator, and lags of the cyclical components of the household-sector and aggregate Divisia money measures that we constructed.
Table 2 reports correlations between the $k$
-th lag of the cyclical component of money and the cyclical components of real GDP and the GDP deflator for
$k$
-th lag of the cyclical component of money and the cyclical components of real GDP and the GDP deflator for $k=0,\ldots, 14$
. For brevity, we report only the even lags. Following Belongia and Ireland (Reference Belongia and Ireland2018), the cyclical components are computed by detrending the logs of the series using a centered moving average with 12 quarterly leads and lags of the series. We lose three years on each end of the sample when computing the moving average, so the effective sample period for the Divisia measures is 1980 to 2020, although we actually computed the correlations using data from 1980 to 2019 to avoid the pandemic. We also computed correlations for the sub-sample from 1980 to 2016 to avoid any possible influence of the pandemic on the filtered series. For purposes of comparison, we also include correlations for several conventional aggregates over the same periods: MFIs’ M4 liabilities to the household sector (HH Sum) and M4 liabilities to PNFCs and households (Agg. Sum).Footnote 30
$k=0,\ldots, 14$
. For brevity, we report only the even lags. Following Belongia and Ireland (Reference Belongia and Ireland2018), the cyclical components are computed by detrending the logs of the series using a centered moving average with 12 quarterly leads and lags of the series. We lose three years on each end of the sample when computing the moving average, so the effective sample period for the Divisia measures is 1980 to 2020, although we actually computed the correlations using data from 1980 to 2019 to avoid the pandemic. We also computed correlations for the sub-sample from 1980 to 2016 to avoid any possible influence of the pandemic on the filtered series. For purposes of comparison, we also include correlations for several conventional aggregates over the same periods: MFIs’ M4 liabilities to the household sector (HH Sum) and M4 liabilities to PNFCs and households (Agg. Sum).Footnote 30
Quarterly correlations between cyclical components of Divisia and economic activity in the UK.
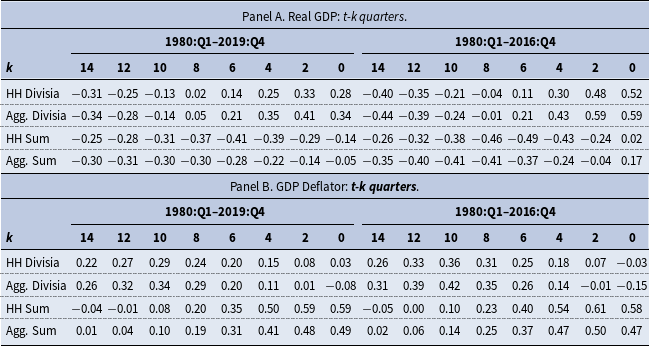
We find that the cyclical components of both of the Divisia measures are positively correlated with the cyclical component of real GDP for lags of seven quarters or less for both sample periods. At eight quarters, the signs are mixed, but the correlation is negative for lags of more than eight quarters for both measures. The absolute magnitude of the correlation coefficients is generally higher for aggregate Divisia than for household Divisia and including observations after 2016 generally reduces the absolute magnitude of the correlation coefficients for both measures. For the shorter sample period, the contemporaneous correlation is 0.59 and 0.52 for aggregate and household-sector Divisia, respectively. In contrast, the contemporaneous correlation between the cyclical components of the conventional money measures and real GDP is 0.17 for the aggregate measure and close to zero for the household-sector measure on the shorter sample period. The contemporaneous correlation is negative for both conventional measures on the longer sample period. The correlation between the cyclical components of money and real GDP is negative for both conventional measures for lags of two quarters or more in both sample periods.
The cyclical components of both Divisia measures are positively correlated with the cyclical component of the GDP deflator for lags of more than two quarters in both sample periods. The contemporaneous correlation is negative for both measures in the shorter sample period, but is positive (although close to zero) for household Divisia for the longer sample period. For the shorter sample period, the highest correlation occurs at 10 lags for aggregate Divisia with a peak value of 0.42. For the conventional measures, the correlation between the cyclical components of money and prices is positive, except at some longer lags for the household-sector measure. The highest correlation is at lags of either one or two quarters for both conventional measures in both sample periods (the peak value is not always shown in the table). The contemporaneous correlation coefficient is close to the peak value in all cases. For example, the peak value is 0.61 for the household-sector measure in the shorter sample period, while the corresponding contemporaneous correlation is 0.58.
The contemporaneous correlation between the cyclical components of the Divisia measures and the corresponding conventional measures is around 0.55 for both the household-sector and aggregate measures from 1980 to 2019. Dropping the observations after 2016 reduced the contemporaneous correlation somewhat, but removing earlier observations tended to raise the correlation between the cyclical components of the Divisia and simple-sum measures. For example, the correlation coefficients are 0.84 and 0.87 for the household-sector and aggregate measures, respectively, from 1994 to 2019. On the other hand, the correlation between the cyclical components of household-sector Divisia and aggregate Divisia is 0.944 from 1980 to 2019 and the correlation between the corresponding conventional measures is 0.946 implying that the method of aggregation is a more important factor than the distinction between the household-sector and aggregate measures.
6. Interest rates and Divisia money as alternative policy indicators
We consider various structural VAR schemes that can accommodate indicators of monetary policy based on a short-term interest rate. We then compare each approach to its analogous specification that replaces the short-term nominal interest rate with our aggregate Divisia measure as the monetary policy indicator. While we center attention on the aggregate Divisia measure, we also estimated an analog to every specification we examine in the paper by substituting our aggregate Divisia index—and its dual user cost index—with the corresponding household-sector measures. We found that the results were markedly robust to this substitution. Consequently, we omit the responses based on the household-sector measures to save space but they are available upon request.
Each specification we consider will involve a $6 \times 1$
vector of endogenous variables,
$6 \times 1$
vector of endogenous variables, $z_{t}$
. We begin with a reduced-form vector autoregression (VAR):
$z_{t}$
. We begin with a reduced-form vector autoregression (VAR):
 \begin{equation} z_{t}=B_{1}z_{t-1}+\ldots +B_{q}z_{t-q}+u_{t} \end{equation}
where $q$
is the number of lags. Each
$q$
is the number of lags. Each $B_{j}$
,
$B_{j}$
, $j=1,2\dots, q$
is a
$j=1,2\dots, q$
is a $6 \times 6$
matrix of slope coefficients and
$6 \times 6$
matrix of slope coefficients and $E(u_{t}u_{t}')=V$
is the covariance matrix of residuals.Footnote 31 The corresponding linear structural model may be written as:
$E(u_{t}u_{t}')=V$
is the covariance matrix of residuals.Footnote 31 The corresponding linear structural model may be written as:
 \begin{equation}{A_{0}}{z_{t}}={A_{1}}{z_{t-1}}+\ldots +{A_{q}}{z_{t-q}}+\Sigma{\varepsilon _{t}} \end{equation}
where $A_{0}^{-1}A_{j}=B_{j}$
, for
$A_{0}^{-1}A_{j}=B_{j}$
, for $j=1,2\dots, q$
and
$j=1,2\dots, q$
and $\Sigma$
is a diagonal matrix containing the standard deviations of the structural shocks,
$\Sigma$
is a diagonal matrix containing the standard deviations of the structural shocks, $\varepsilon _{t}$
, such that
$\varepsilon _{t}$
, such that $E({\varepsilon _{t}}{\varepsilon _{t}}{{')=I_{6}}}$
. Inspecting equations (5) and (6) shows that the vector of reduced-form innovations is related to the vector of structural shocks according to
$E({\varepsilon _{t}}{\varepsilon _{t}}{{')=I_{6}}}$
. Inspecting equations (5) and (6) shows that the vector of reduced-form innovations is related to the vector of structural shocks according to $A_{0}^{-1}\Sigma{\varepsilon _{t}}=u_{t}$
. Therefore, mapping the covariance matrices of both systems requires:
$A_{0}^{-1}\Sigma{\varepsilon _{t}}=u_{t}$
. Therefore, mapping the covariance matrices of both systems requires:
 \begin{equation} A_{0}^{-1}\Sigma \Sigma '(A_{0}^{-1})'=V \end{equation}
The most well-known approach to solving the mapping problem of equation (7) in structural VAR identification is Sims (Reference Sims1980) who requires $A_{0}$
to be lower triangular (consistent with a recursive ordering of the variables in the VAR). In another seminal paper, Christiano et al. (Reference Christiano, Eichenbaum and Evans1999) shows that a block triangular structure for
$A_{0}$
to be lower triangular (consistent with a recursive ordering of the variables in the VAR). In another seminal paper, Christiano et al. (Reference Christiano, Eichenbaum and Evans1999) shows that a block triangular structure for $A_{0}$
, which is a subset of the class of models commonly known as partially recursive, is all that is required for the identification of monetary policy shocks.Footnote 32
$A_{0}$
, which is a subset of the class of models commonly known as partially recursive, is all that is required for the identification of monetary policy shocks.Footnote 32
For our first specification, we stack the variables at each date of our quarterly sample (1977Q1 - 2019Q4) into the following $6 \times 1$
vector:
$6 \times 1$
vector:
 \begin{equation} z_{t} = [P_{t}, Y_{t}, R_{t}, DM_{t}, UC_{t}, CP_{t}]' \end{equation}
where $P_{t}$
is the GDP deflator,
$P_{t}$
is the GDP deflator, $Y_{t}$
is real chain-weighted GDP,
$Y_{t}$
is real chain-weighted GDP, $R_{t}$
is an interest rate variable (either BoE’s official Bank Rate or the Wu and Xia (Reference Wu and Xia2016) shadow rate),
$R_{t}$
is an interest rate variable (either BoE’s official Bank Rate or the Wu and Xia (Reference Wu and Xia2016) shadow rate), $DM_{t}$
is our aggregate Divisia measure,
$DM_{t}$
is our aggregate Divisia measure, $UC_{t}$
is the dual user cost of aggregate Divisia, and
$UC_{t}$
is the dual user cost of aggregate Divisia, and $CP_{t}$
is the CRB commodity price index. All variables are log transformed except for
$CP_{t}$
is the CRB commodity price index. All variables are log transformed except for $R_{t}$
and
$R_{t}$
and $UC_{t}$
. The choice of variables in our model follows Belongia and Ireland (Reference Belongia and Ireland2016).Footnote 33 The set of variables is also similar to Christiano et al. (Reference Christiano, Eichenbaum and Evans1999), replacing the monetary base (for the U.S.) with our aggregate Divisia measure for the U.K., and replacing various U.S. Treasury yields with the dual user cost index we constructed.
$UC_{t}$
. The choice of variables in our model follows Belongia and Ireland (Reference Belongia and Ireland2016).Footnote 33 The set of variables is also similar to Christiano et al. (Reference Christiano, Eichenbaum and Evans1999), replacing the monetary base (for the U.S.) with our aggregate Divisia measure for the U.K., and replacing various U.S. Treasury yields with the dual user cost index we constructed.
We impose restrictions on $A_{0}$
, following Keating et al. (Reference Keating, Kelly, Smith and Valcarcel2019). Specifically, we assume that the monetary policy indicator responds contemporaneously to a set of economic activity variables. In turn, we impose a delayed reaction of the economic activity variables to monetary policy shocks. All other variables in the model are allowed to respond contemporaneously to all economic shocks, but they only affect the policy indicator and the economic activity variables with a lag. Following Keating et al. (Reference Keating, Kelly, Smith and Valcarcel2019), the economic activity variables consist of
$A_{0}$
, following Keating et al. (Reference Keating, Kelly, Smith and Valcarcel2019). Specifically, we assume that the monetary policy indicator responds contemporaneously to a set of economic activity variables. In turn, we impose a delayed reaction of the economic activity variables to monetary policy shocks. All other variables in the model are allowed to respond contemporaneously to all economic shocks, but they only affect the policy indicator and the economic activity variables with a lag. Following Keating et al. (Reference Keating, Kelly, Smith and Valcarcel2019), the economic activity variables consist of $P_{t}$
,
$P_{t}$
, $Y_{t}$
, and
$Y_{t}$
, and $CP_{t}$
. Initially, we designate
$CP_{t}$
. Initially, we designate $R_{t}$
as the policy indicator.Footnote 34 Given our ordering of the variables in equation (8), the innovations in the third element of the
$R_{t}$
as the policy indicator.Footnote 34 Given our ordering of the variables in equation (8), the innovations in the third element of the $\varepsilon _{t}$
vector can be interpreted as a monetary policy shock
$\varepsilon _{t}$
vector can be interpreted as a monetary policy shock $\varepsilon _{t}^{MP}$
in the following structural equation:
$\varepsilon _{t}^{MP}$
in the following structural equation:
 \begin{equation} a_{31}P_{t} + a_{32}Y_{t} + R_{t} + a_{36}CP_{t} =\sigma _{33}\varepsilon _{t}^{MP} \end{equation}
where $a_{ij}$
is the coefficient from row
$a_{ij}$
is the coefficient from row $i$
and column
$i$
and column $j$
of
$j$
of $A_{0}$
and
$A_{0}$
and $\sigma _{33}$
is the third element along the diagonal of
$\sigma _{33}$
is the third element along the diagonal of $\Sigma$
. Here, and throughout the paper, we omit the lagged values of
$\Sigma$
. Here, and throughout the paper, we omit the lagged values of $z_{t-j}$
for
$z_{t-j}$
for $j=1,2\dots, q$
from equations like (9) to center attention on the contemporaneous relationships among the variables of the system.
$j=1,2\dots, q$
from equations like (9) to center attention on the contemporaneous relationships among the variables of the system.
This equation is consistent with a Taylor-style monetary policy rule (Taylor (Reference Taylor1993)), where the central bank adjusts the short-term rate in response to aggregate prices and output. However, equation (9) departs from the traditional Taylor (Reference Taylor1993) specification by augmenting the rule with commodity prices, which follows reasoning offered in Christiano et al. (Reference Christiano, Eichenbaum and Evans1999) and Keating et al. (Reference Keating, Kelly, Smith and Valcarcel2019) to expand the information set of the central bank in its interest rate setting equation. Importantly, all our analysis is grounded on the subtle, yet critical, difference between what constitutes an indicator versus what constitutes an instrument of monetary policy. We take equation (9) as descriptive of the stance of monetary policy, rather than a prescriptive rule for setting interest rates by the central bank. We abjure any characterization of any given single variable to act as the instrument of monetary policy. Our analysis is more in line with Christiano et al. (Reference Christiano, Eichenbaum and Evans1999), who consider competing specifications between the Federal funds rate, M2, or non-borrowed reserves, as possible indicators of monetary policy for samples that ended in the mid-1990s.
6.1. Short-term interest rates as a monetary policy indicator
We begin our analysis using BoE’s official Bank Rate. Figure 4(a) shows impulse responses to a one-standard-deviation increase in Bank Rate governed by equation (9)—and consistent with a partially recursive specification of $A_{0}$
in the mapping (7) described above—for the system of endogenous variables in (8). The response of real GDP shows a delayed reaction consistent with a New Keynesian prediction of slow real adjustment to a contractionary monetary policy shock before it turns negative in a familiar hump-shaped fashion with the peak response at around 10 quarters. Aggregate Divisia contracts following the exogenous interest rate hike, and the dual user cost increases in tandem with Bank Rate. Both of these suggest a strong liquidity effect is at play in the U.K. for our sample. These responses are economically sensible. The price level response, however, is highly problematic. It lacks the expected gradual price adjustment to a monetary policy shock that is typical of a New Keynesian dynamic. Importantly, the contractionary monetary policy shock leads the price level to a statistically significant and persistent increase, which remains above zero for roughly four years post shock. Given that Bank Rate was generally held at very low levels from the GFC through the onset of the pandemic, we also estimate models employing the Wu and Xia (Reference Wu and Xia2016) shadow rate. Figure 4(b) shows that the impulse responses are very robust to this change and, in particular, the price puzzle is not mitigated in this specification.
$A_{0}$
in the mapping (7) described above—for the system of endogenous variables in (8). The response of real GDP shows a delayed reaction consistent with a New Keynesian prediction of slow real adjustment to a contractionary monetary policy shock before it turns negative in a familiar hump-shaped fashion with the peak response at around 10 quarters. Aggregate Divisia contracts following the exogenous interest rate hike, and the dual user cost increases in tandem with Bank Rate. Both of these suggest a strong liquidity effect is at play in the U.K. for our sample. These responses are economically sensible. The price level response, however, is highly problematic. It lacks the expected gradual price adjustment to a monetary policy shock that is typical of a New Keynesian dynamic. Importantly, the contractionary monetary policy shock leads the price level to a statistically significant and persistent increase, which remains above zero for roughly four years post shock. Given that Bank Rate was generally held at very low levels from the GFC through the onset of the pandemic, we also estimate models employing the Wu and Xia (Reference Wu and Xia2016) shadow rate. Figure 4(b) shows that the impulse responses are very robust to this change and, in particular, the price puzzle is not mitigated in this specification.
Monetary policy shock: Partially recursive identification.
Panels (a,b) show responses to a one-standard-deviation increase in a short-term interest rate (Identification a-la Keating et al. (2019)). Shaded areas correspond to 68% confidence bounds.

This perverse price reaction has been a common empirical finding in many studies of monetary policy in the U.S. (see Balke et al. (Reference Balke and Emery1994) and Den Haan et al. (Reference Den Haan, Sumner and Yamashiro2007), among others), other developed economies (see Sims (Reference Sims1992) and Eichenbaum and Evans (Reference Eichenbaum and Evans1995), among others), as well as in the context of open economy models (Cushman and Zha (Reference Cushman and Zha1997)) and in high dimensional VARs (Bernanke et al. (Reference Bernanke, Boivin and Eliasz2005)). Our specification shows a puzzling response of the price level for the U.K. despite including commodity prices in our system. This is consistent with evidence in Den Haan et al. (Reference Den Haan, Sumner and Yamashiro2007) who show commodity prices do not solve the incidence of the price puzzle in a pre-2008 sample of a VAR for the U.S. with the Federal funds rate as the monetary policy indicator. Keating et al. (Reference Keating, Kelly, Smith and Valcarcel2019) show that, while inclusion of commodity prices lessens the virulence of the price puzzle for some postwar U.S. sub-samples, it does not resolve it.
6.2. Divisia as a monetary policy indicator
We now turn to an alternative specification similar to Keating et al. (Reference Keating, Kelly, Smith and Valcarcel2019). In this specification, the log of our aggregate Divisia measure, $DM_{t}$
, becomes the policy indicator. To simplify exposition, we define a new variable ordering (10) by interchanging
$DM_{t}$
, becomes the policy indicator. To simplify exposition, we define a new variable ordering (10) by interchanging $DM_{t}$
and
$DM_{t}$
and $R_{t}$
in
$R_{t}$
in $z_{t}$
such that
$z_{t}$
such that
 \begin{equation} z_{t} = [P_{t}, Y_{t}, DM_{t}, R_{t}, UC_{t}, CP_{t} ]' \end{equation}
We maintain the same partially recursive structure given the new variable ordering, so that (9) is replaced by a new policy indicator in equation (11):
 \begin{equation} a_{31}P_{t} + a_{32}Y_{t} + DM_{t} + a_{36}CP_{t} =\sigma _{33}\varepsilon _{t}^{MP} \end{equation}
In this specification, the interest rate is allowed to respond contemporaneously to all economic shocks, but it is assumed to only affect the Divisia index and the activity variables with a lag.
Figure 5 shows responses to an exogenous reduction in the log of our aggregate Divisia measure as the policy shock, with Bank Rate as the interest rate measure. The responses to Divisia innovations as the indicator of contractionary monetary policy shocks are more sensible than those of the interest rate specifications. Bank Rate and dual user cost responses to the monetary contraction exhibit the expected liquidity effect at short horizons—although the positive effect dissipates within one year. The GDP response in Figure 5 displays the appropriately negative hump-shaped response to a contractionary shock in monetary policy. The peak output response is reached at around six quarters. Importantly, the price response is consistent with a gradual price adjustment, where the price level reaction takes about five quarters before the textbook negative response to the monetary contraction takes hold. The impact of the monetary shock on both real output and prices is highly persistent. We find that the impulse responses to a Divisia shock are nearly identical when we replace Bank Rate with the shadow rate as the interest rate variable.Footnote 35
Responses to Divisia monetary policy shocks: Partially recursive identification.
Responses to a one-standard-deviation reduction in the log of Divisia balances (Identification a-la Keating et al. (Reference Keating, Kelly, Smith and Valcarcel2019)). Shaded areas denote 68% confidence bounds.

Our results for the U.K. parallel those of Keating et al. (Reference Keating, Kelly, Smith and Valcarcel2019), which identified monetary policy for the U.S. with Divisia monetary aggregates. The identification in Keating et al. (Reference Keating, Kelly, Smith and Valcarcel2019) is similar in spirit to Christiano et al. (Reference Christiano, Eichenbaum and Evans1999), which was once the standard model of empirical analysis of monetary policy. Overall, we find a partially recursive identification strategy of our six-variable system for the U.K., elicits sensible and robust responses when following a structural equation (11) that considers Divisia money to be the monetary policy indicator. Moreover, we find this conclusion not to be sensitive to a five-variable specification that removes commodity prices from (10).
In contrast, the specification (9) that considers a short-term rate to be the indicator of monetary policy shows puzzling responses for the price level. Overall, our findings are consistent with similar conclusions in modern samples for the U.S. (see Keating et al. (Reference Keating, Kelly, Smith and Valcarcel2019) and Chen and Valcarcel (Reference Chen and Valcarcel2021)), Canada (see Haan et al. (Reference Haan, Sumner and Yamashiro2009)), and Mexico (see Colunga-Ramos and Valcarcel (Reference Colunga-Ramos and Valcarcel2025)), among other economies.
7. Distinguishing monetary policy from money demand shocks
In the previous section, we demonstrated that our aggregate Divisia measure performs well as an indicator of monetary policy for the U.K., whereas innovations in Bank Rate, or the shadow rate, give rise to a pronounced price puzzle, despite the common fix of including commodity prices. The identification strategy focused exclusively on monetary policy shocks, alternating between Divisia money or an interest rate as the indicator of policy, and is otherwise silent on the identification of other structural shocks including money demand shocks. An alternative would be to consider the joint usefulness of interest rates and Divisia money. For example, analyzing the systematic component of monetary policy, Arias et al. (Reference Arias, Caldara and Rubio-Ramirez2019) interpret one of their restriction strategies as signifying that both the short-term rate and the money supply respond to Federal Reserve actions in the U.S., and therefore, both variables are important in describing the effects of monetary policy on the economy.
In this section, we consider alternative identification schemes that identify money demand shocks separately from monetary policy—by considering a structural equation for monetary policy in which the policy rate can respond contemporaneously to prices, real output, and to our aggregate Divisia index. This enriches the monetary policy specification while allowing us to structurally pin down money demand in terms of the aggregation-theoretic dual. Our analysis in this section closely follows Belongia and Ireland (Reference Belongia and Ireland2016) and Belongia and Ireland (Reference Belongia and Ireland2018) who provide a thorough analysis to differentiate monetary policy from money demand shocks.Footnote 36
As previously noted, the set of variables in our model follows Belongia and Ireland (Reference Belongia and Ireland2016). Here, we revert back to our original ordering (8) reflecting the status of the interest rate as the policy indicator.Footnote 37 Following Belongia and Ireland (Reference Belongia and Ireland2016), we consider generalized Taylor (Reference Taylor1993) rules of the form:
 \begin{equation} a_{31}P_{t} + a_{32}Y_{t} + R_{t} + a_{34}DM_{t} =\sigma _{33}\varepsilon _{t}^{MP} \end{equation}
See Ireland (Reference Ireland2001). This equation accommodates a monetary policy shock with simultaneous movements in short-term interest rates and money as prescribed by Leeper and Roush (Reference Leeper and Roush2003), although they only considered simple-sum monetary aggregates. In this specification, we do not impose a negative sign on the $a_{34}$
coefficient, which would result in opposite impact responses of the interest rate and Divisia to a contractionary monetary policy shock, thereby letting the data speak for itself on this issue. We note that even if
$a_{34}$
coefficient, which would result in opposite impact responses of the interest rate and Divisia to a contractionary monetary policy shock, thereby letting the data speak for itself on this issue. We note that even if $a_{31}=a_{32}=0$
, the backward-looking nature of the VARs, equations (5) and (6) would still make a lagged response of the short-term rate to economic activity feasible.
$a_{31}=a_{32}=0$
, the backward-looking nature of the VARs, equations (5) and (6) would still make a lagged response of the short-term rate to economic activity feasible.
We now turn to a money demand specification as follows:
 \begin{equation} a_{42}Y_{t} + (DM_{t} - P_{t}) + a_{45}UC_{t} =\sigma _{44}\varepsilon _{t}^{MD} \end{equation}
which relates real Divisia to its dual user cost and real output. Money demand equations often incorporate short-term or long-term interest rates, instead of dual user costs. However, the user cost measures the “price” of monetary services in a way that is consistent with the theoretical foundation established by Barnett (Reference Barnett1978) and Barnett (Reference Barnett1980)—a point argued by Belongia (Reference Belongia2006). As Belongia and Ireland (Reference Belongia and Ireland2016) explain, “the interest rate variables that are more typically included in statistical money demand equations reflect, instead, the price of bonds as money substitutes.” Inspection of equations (12) and (13) reveals that monetary policy operates on nominal money balances ( $DM_{t}$
) and rates (
$DM_{t}$
) and rates ( $R_{t}$
), whereas money demand reflects preferences for real Divisia (
$R_{t}$
), whereas money demand reflects preferences for real Divisia ( $DM_{t} - P_{t}$
) given user costs (
$DM_{t} - P_{t}$
) given user costs ( $UC_{t}$
).
$UC_{t}$
).
Ezer (Reference Ezer2019) estimated models for the U.K. based on Belongia and Ireland (Reference Belongia and Ireland2016) over two sample periods: 1978Q3 to 1990Q1 and 1993Q1 to 2011Q3. He considered policy equations for Bank Rate in the form of (12), including variants that impose either $a_{31}=a_{32}=0$
or
$a_{31}=a_{32}=0$
or $a_{34}=0$
, and a money demand equation in the form of (13). Ezer calculates a Divisia index using a benchmark rate based on an envelope that includes the three-month Treasury bill rate plus 250 basis points, building on Bissoondeeal et al. (Reference Bissoondeeal, Jones, Binner and Mullineux2010), but he includes the spread between Bank Rate and a weighted average return on the components of his index,
$a_{34}=0$
, and a money demand equation in the form of (13). Ezer calculates a Divisia index using a benchmark rate based on an envelope that includes the three-month Treasury bill rate plus 250 basis points, building on Bissoondeeal et al. (Reference Bissoondeeal, Jones, Binner and Mullineux2010), but he includes the spread between Bank Rate and a weighted average return on the components of his index, $R_{t} - R^M_{t}$
, in his model rather than the aggregation-theoretic Divisia price dual,
$R_{t} - R^M_{t}$
, in his model rather than the aggregation-theoretic Divisia price dual, $UC_{t}$
, as in Belongia and Ireland (Reference Belongia and Ireland2016). Following Belongia and Ireland (Reference Belongia and Ireland2016), he also estimated a triangular specification that produces a policy equation in the form of (9). He finds that including his money measure in the policy equation helps resolve the price puzzle over the two sample periods.
$UC_{t}$
, as in Belongia and Ireland (Reference Belongia and Ireland2016). Following Belongia and Ireland (Reference Belongia and Ireland2016), he also estimated a triangular specification that produces a policy equation in the form of (9). He finds that including his money measure in the policy equation helps resolve the price puzzle over the two sample periods.
Given our ordering of the variables, the following mapping matrix to our system is nearly identical to Belongia and Ireland (Reference Belongia and Ireland2016) except that we do not assume $a_{31}=a_{32}=0$
. Belongia and Ireland (Reference Belongia and Ireland2016) cite earlier work showing that while these assumptions do not affect their model’s empirical performance, excluding money from the policy equation (
$a_{31}=a_{32}=0$
. Belongia and Ireland (Reference Belongia and Ireland2016) cite earlier work showing that while these assumptions do not affect their model’s empirical performance, excluding money from the policy equation ( $a_{34}=0$
) “results in statistically significant deterioration in the model’s overall fit.” In contrast, Belongia and Ireland (Reference Belongia and Ireland2018) found that that the constraints excluding prices and output from the policy equation were “rejected quite decisively” using data from 2000 to 2016. Our identification is summarized by the following mapping matrix:
$a_{34}=0$
) “results in statistically significant deterioration in the model’s overall fit.” In contrast, Belongia and Ireland (Reference Belongia and Ireland2018) found that that the constraints excluding prices and output from the policy equation were “rejected quite decisively” using data from 2000 to 2016. Our identification is summarized by the following mapping matrix:
 \begin{equation} A_{0}=\left [\begin{array}{c@{\quad}c@{\quad}c@{\quad}c@{\quad}c@{\quad}c} 1 & 0 & 0 & 0 & 0 & 0\\ a_{21} & 1 & 0 & 0 & 0 & 0\\ a_{31} & a_{32} & 1 & a_{34} & 0 & 0\\ -1 & a_{42} & 0 & 1 & a_{45} & 0\\ -a_{51} & 0 & a_{53} & a_{51} & 1 & 0\\ a_{61} & a_{62} & a_{63} & a_{64} & a_{65} & 1 \end{array}\right ] \end{equation}
The first two equations in (14) maintain a recursive structure consistent with a delayed reaction of output and the price level to monetary shocks. The third and fourth equations are the monetary policy indicator and money demand equations respectively as detailed above. Belongia and Ireland (Reference Belongia and Ireland2016) relate the fifth equation in (14) to DSGE models that “show how an increase in the federal funds rate gets passed along to consumers of monetary services in the form of a higher user cost,” while allowing “the quantity of real monetary services created to affect the user cost as well, as it would if banks’ costs rise as they expand their scale of operation.” The equation plays the same role in our model for the U.K. banking system and the BoE based on our aggregate Divisia measures. The sixth equation simply allows commodity prices to respond to every innovation within the quarter.
Belongia and Ireland (Reference Belongia and Ireland2018) innovate over Belongia and Ireland (Reference Belongia and Ireland2016) on several fronts: First, they consider the Wu and Xia (Reference Wu and Xia2016) shadow Federal funds rate as well as the two-year Treasury yield to represent $R_{t}$
in equation (9). Second, they replace commodity prices (
$R_{t}$
in equation (9). Second, they replace commodity prices ( $CP_{t}$
) in (8) with the Gilchrist and Zakrajšek (Reference Gilchrist and Zakrajšek2012) excess bond premium measure. Those authors make a persuasive argument that the excess bond premium may provide good information to condition against financial stress before, during, and after the U.S. Great Recession. Nevertheless, for more direct comparability across our various identification strategies in this paper, we opt to investigate the same set of variables given by (8), while imposing an alternative
$CP_{t}$
) in (8) with the Gilchrist and Zakrajšek (Reference Gilchrist and Zakrajšek2012) excess bond premium measure. Those authors make a persuasive argument that the excess bond premium may provide good information to condition against financial stress before, during, and after the U.S. Great Recession. Nevertheless, for more direct comparability across our various identification strategies in this paper, we opt to investigate the same set of variables given by (8), while imposing an alternative $A_{0}$
matrix to accomplish the mapping in (7). Specifically, we impose a similar identification strategy to Belongia and Ireland (Reference Belongia and Ireland2018) described by the following impact matrix:Footnote 38
$A_{0}$
matrix to accomplish the mapping in (7). Specifically, we impose a similar identification strategy to Belongia and Ireland (Reference Belongia and Ireland2018) described by the following impact matrix:Footnote 38
 \begin{equation} A_{0}=\left [\begin{array}{c@{\quad}c@{\quad}c@{\quad}c@{\quad}c@{\quad}c} a_{11} & 0 & 0 & 0 & 0 & 0\\ a_{21} & a_{22} & 0 & 0 & 0 & 0\\ a_{31} & a_{32} & a_{33} & a_{34} & 0 & 0\\ -a_{44} & -a_{44} & 0 & a_{44} & a_{45} & 0\\ -a_{51} & 0 & a_{53} & a_{51} & a_{55}& 0\\ a_{61} & a_{62} & a_{63} & a_{64} & a_{65} & a_{66} \end{array}\right ] \end{equation}
The third equation in (15) is essentially the same monetary policy reaction function as that of equation (12)—up to a normalization of the size of the impact shock. The fourth equation, however, presents a more tightly parameterized money demand relationship than the previous specification and it deserves more elaboration:
 \begin{equation} a_{44}(DM_{t} - P_{t} - Y_{t}) + a_{45}UC_{t} =\varepsilon _{t}^{MD} \end{equation}
Comparing this specification of money demand with our previous parameterization in equation (13) reveals that both specifications incorporate real money balances, but (16) imposes an additional constraint of a unitary income elasticity of money demand as in Cushman and Zha (Reference Cushman and Zha1997). Belongia and Ireland (Reference Belongia and Ireland2018) argued that “though not essential for identification, this constraint also helps distinguish between money demand and money supply, is not rejected by the data, and is consistent with theories of money demand that predict a stable relationship between monetary velocity and an opportunity or user cost variable.”
In accordance with equation (12), Figure 6 shows responses to an exogenous contractionary hike in the Wu and Xia (Reference Wu and Xia2016) shadow rate as a monetary policy shock outlined within the structure in (14). Figure 7 shows the corresponding responses according to the structure in (15). The responses seem largely consistent across both non-recursive identification strategies we present in this section. The output responses exhibit the expected delayed hump-shaped contraction. Monetary services, as measured by Divisia, also decline and there are congruent hikes of the dual user costs in both (14)-(15) schemes. Similar to Figure 4, Figures 6 and 7 show a pronounced and persistent price puzzle following an exogenous increase in the shadow rate. As such, this non-recursive specification (14) seems to be dominated by the specification from the previous section in which Divisia money is the policy indicator—shown in Figure 5. Here again, our finding of the price puzzle is robust to lag length as well as to including or not including commodity prices in the system.Footnote 39
Monetary policy shock: Non-recursive identification from mapping matrix (14).
Responses to a one-standard-deviation increase in the Wu and Xia (Reference Wu and Xia2016) shadow rate. Shaded areas denote 68% confidence bounds.

Monetary policy shock: Non-recursive identification from mapping matrix (15).
Responses to a one-standard-deviation increase in the Wu and Xia (Reference Wu and Xia2016) shadow rate. Shaded areas denote 68% confidence bounds.

Figure 8 collates the price responses to exogenous hikes in various interest rates under all of the specifications we consider. The figure shows that contractionary shocks from exogenous interest rate increases in each non-recursive scheme here—as well as in the partially recursive specification from the previous section—yield a significant and protracted price puzzle in the U.K., across all of the interest rates we examine.
Price level responses to various interest rate hikes under partially recursive (eq: 9) and non-recursive (eqs: 14, 15). The dark area around the point estimates corresponds to the 68% confidence bound for the first specification (Shock to Bank Rate—Partially recursive). The lighter area is constructed as the distance between the maximum and minimum values at each horizon from all the confidence bounds across all nine models.

8. Divisia as the monetary policy indicator with identified money demand
Given the consistency of our findings—that innovations in various interest rates give rise to persistent price puzzles—we now turn to a non-recursive specification that considers our Divisia money measure as the indicator of monetary policy. The fact that a broad Divisia index incorporates both quantity and price information—from a wider range of money markets than a more segmented inter-bank market—implies it carries a larger information set as it relates to monetary dynamics. Here, our choice follows the spirit of the message in Keating et al. (Reference Keating, Kelly, Smith and Valcarcel2019) that a broad Divisia index is capable of capturing a wider array of monetary information than a short-term rate.
We return to the specification of endogenous variables in equation (10), which places Divisia balances in third place as the indicator of monetary policy, and we impose the following non-recursive structure:
 \begin{equation} A_{0}=\left [\begin{array}{cccccc} 1 & 0 & 0 & 0 & 0 & 0\\ a_{21} & 1 & 0 & 0 & 0 & 0\\ a_{31} & a_{32} & 1 & 0 & 0 & 0\\ a_{41} & a_{42} & a_{43} & 1 & a_{45} & a_{46}\\ -a_{51} & a_{52} & a_{51} & 0 & 1 & 0\\ a_{61} & a_{62} & a_{63} & a_{64} & a_{65} & 1 \end{array}\right ] \end{equation}
At first glance, one distinguishing factor from our non-recursive identification here over our two previous ones in Section 7, is that the mapping matrix (17) is consistent with a just-identified scheme as it contains 15 restrictions in a six-variable system, whereas (14) and (15) contain 17 and 18 restrictions respectively, making the structures locally over-identified. We view this as a minor issue, however, given that our primary interest is in the identification of monetary policy shocks. We were relatively agnostic, for example, about the economic interpretation of the other shocks in our partially recursive identification scheme. Moreover, while the more restrictive scheme (15) may be locally over-identified, Belongia and Ireland (Reference Belongia and Ireland2018) show that it is globally identified and just-identified for monetary policy shocks in accordance with Rubio-Ramirez et al. (Reference Rubio-Ramirez, Waggoner and Zha2010).
The more economically meaningful difference between (17) and our previous non-recursive specifications lies in its approach to cleanly extract money demand and monetary policy shocks from the Divisia index. The first two rows are the same as in the previous non-recursive schemes. The third row in (17), however, corresponds to a structural equation for our Divisia measure as the monetary policy indicator:
 \begin{equation} a_{31}P_{t} + a_{32}Y_{t} + DM_{t} =\sigma _{33}\varepsilon _{t}^{MP} \end{equation}
Essentially, this is a more restrictive version of (11) from the structure we discussed in Section 6, where Divisia does not respond to commodity prices within the quarter. Empirically, we find our conclusions do not change if we allow Divisia to respond to commodity prices within the quarter.Footnote 40 This is notionally consistent with—but less restrictive than—Keating et al. (Reference Keating, Kelly and Valcarcel2014) and Colunga-Ramos and Valcarcel (Reference Colunga-Ramos and Valcarcel2025) who consider systems that exclude commodity prices altogether from their specifications and find no material difference in the ability of shocks to Divisia to provide a resolution to the price puzzle in the U.S. and Mexico, respectively.
The fifth row of (17) corresponds to a money demand equation with the following parameterization:
 \begin{equation} a_{52}Y_{t} + a_{51}(DM_{t} - P_{t}) + UC_{t} =\sigma _{55}\varepsilon _{t}^{MD} \end{equation}
We return, here, to a money demand specification in terms of real money balances, but not imposing any assumptions about the income elasticity parameter. Money demand continues to depend on the user cost of money in line with aggregation theory as discussed previously (see Belongia (Reference Belongia2006)). Finally, in the specification given by (17), the interest rate and commodity prices are both allowed to respond contemporaneously to all economic shocks, but they only affect the policy indicator and the economic activity variables with a lag.Footnote 41
Figure 9 shows responses to exogenous contractions in our Divisia measure governed by equation (18) under the non-recursive specification (17) with Bank Rate as the interest rate. This specification finds a delayed response of the price level to an exogenous reduction in Divisia money along with a sensible response of real output. The contraction also yields an immediately positive response of Bank Rate as well as the dual user cost, consistent with a liquidity effect at short horizons. These results here are generally consistent with those shown earlier in Figure 5. Our conclusions remain unchanged when replacing Bank Rate with the shadow rate or the long-term bond yield in the model.
Responses to Divisia monetary policy shocks: Non-recursive identification from mapping matrix (17).
Responses to a one-standard-deviation reduction in the log of Divisia balances. Shaded areas denote 68% confidence bounds.

Finally, Figure 10 summarizes all price and output responses across our specifications. The upper two panels show the price level responses and the lower two panels show the real output responses. The left hand side panels show the partially recursive identifications based on an interest rate as the policy indicator as well as the non-recursive identification schemes from the previous section. The right hand side panels show the partially recursive identifications based on aggregate Divisia as the policy indicator as well as the non-recursive identification scheme from this section. For all specifications, responses are shown using Bank Rate, the shadow rate, and the long-term bond yield. The bottom two panels reveal that GDP responds similarly across both sets of models. However, the responses to the Divisia shocks shown in the bottom right panel have their peak impact on real output at around six to eight quarters, while the shocks shown in the bottom left panel peak at around 11 to 12 quarters. The finding that the impact of Divisia shocks on real GDP peak about a year earlier than the GDP responses to interest rate shocks was also evident in earlier figures. Output responses are highly persistent in all cases. The upper right panel of Figure 10 shows a small positive response of the price level to a contractionary Divisia shock. The small positive response nearly reaches statistical significance for some specifications, four quarters post shock, before propagating through to the textbook prediction at longer horizons. In sharp contrast, the upper left panel of Figure 10, which is identical to Figure 8, shows large and protracted price puzzles across all specifications.
Responses to all specifications: Responses to a one-standard-deviation reduction in the log of Divisia balances or a one-standard-deviation increase in various rates. The dark area around the point estimates corresponds to the 68% confidence bound for the first specification (Shock to Bank Rate—Partially Recursive on the left column; Shock to Divisia with Bank Rate—Partially Recursive on the right column). The lighter area is constructed as the distance between the maximum and minimum values at each horizon from all the confidence bounds across all relevant specifications.

9. Concluding remarks
Following the end of the monetarist experiment, monetary economists largely shifted their attention from monetary aggregates to short-term interest rates in the characterization of monetary policy. The more recent literature has, however, revisited the use of information from monetary aggregates in monetary models within the New Keynesian framework of the types we consider in this paper. An important contribution of this research is that we construct aggregate and household-sector Divisia indexes for the U.K. and their corresponding Divisia price duals employing a consistent methodology. Divisia price duals have been featured in the literature—particularly for U.S. models—but are currently unavailable for the Bank of England’s Divisia measures.
We find that shocks to the official Bank Rate give rise to price puzzles under various structural identifications. The protracted period of low interest rates following the GFC complicates using short-term policy rates as the primary indicator of monetary policy. In that regard, employing a shadow rate—which in principle could provide a better signal of the excess monetary accommodation over the period—does not mitigate the incidence of the price puzzles in our specifications. On the other hand, contractionary shocks to the aggregate Divisia index we constructed lead to sensible responses of both output and prices, as well as liquidity effects, in our structural VARs. Moreover, our empirical results are extremely robust.
Our conclusions for the U.K. are consistent with similar findings reported for the U.S. A clear parallel between the U.S. and the U.K. is a likely regime change in the role that monetary aggregates have played in the economy after the GFC. Since 2008, both the Bank of England and the Federal Reserve swelled their balance sheets in a transition from a system of bank reserve scarcity to one of ample reserves. While the post-COVID inflationary period has seen substantial interest rate hikes in both countries, we posit that—going forward—economic models that ignore the information content from monetary aggregates likely miss an important component of the monetary transmission mechanism. Our research highlights the importance of both Divisia monetary indexes and their corresponding dual Divisia price indexes when analyzing the impact of monetary policy over long sample periods.
Acknowledgements
The authors thank the Editor, Associate Editor, and two anonymous referees for helpful comments that improved the paper. We also thank participants at the Society for Economic Measurement, Atlanta, 2024 and at the Annual Money Macro Finance Research Society Conference, Manchester, 2024 for helpful comments. We, are grateful to Rajveer Berar, Jessica Chan, Nick Ross, Daniel Williams, and others at the Bank of England for help with the data. Author ordering conveys no information. It was agreed that attribution should follow a strict alphabetical ordering. Any residual errors and all interpretations remain with--and are equally shared by--the authors.


 Open access