


1 Introduction
Charitable giving is shaped by many things including regulatory and institutional arrangements such as inheritance and tax policies for donors, the degree of social safety nets, the efficacy of organizations supplying public goods, and the preferences of donors.Footnote 1 These factors impact what List (Reference List2011) describes as the market for charitable giving, which is comprised of three key actors: donors, charitable organizations, and government. A plethora of empirical studies have examined how government regulations affect donor behavior through a cost/benefit channel.Footnote 2 We explore the importance of the cost/benefit motive for giving by altering the time horizon over which donors evaluate costs and benefits in a public goods experiment. We find significantly higher contributions to the public good when donors face a known probability of future interactions with the same group of participants compared to interactions with a finite endpoint. This finding that more open-ended interactions facilitate sustained cooperation among groups has implications for fund raising campaigns.
Public goods experiments have been used extensively to study prosocial behavior in the laboratory. Much attention has been devoted to studying experimental design features that influence the ability of subjects to coordinate in linear public goods experiments with a finite endpoint. Some of the variables that have been explored include partners versus strangers, the use of punishment for free riders, communication, group size, the number of rounds, provision points, inequality and cultural norms. A common feature of many laboratory environments is a known endpoint to the interaction, which is a distinct departure from most naturally occurring human interactions. We contribute to this literature by studying a public goods game with a probabilistic endpoint.
A typical linear public goods experiment offers subjects the option to keep any number of lab tokens for their full worth or donate them to a public good for a fraction of that amount, with that fraction to be shared with the others in the group. Full contribution to the public good is the efficient outcome, since the net benefit of a token donated to the group exceeds the private value of the token. At the other extreme, the one-shot Nash equilibrium prediction is zero tokens contributed to the public good. In multiple round games with a known endpoint, backward induction from the last round of the experiment leads to the same outcome. Thus, standard models predict an inefficient outcome in both one-shot and finite multiple round games. Contrary to theory, the general body of research shows that subjects contribute a non-trivial fraction of their tokens to the public good in early rounds of play. This cooperation, however, is not sustained over multiple rounds of play. With a finite endpoint, contributions fall to near-zero levels as subjects approach the end of the game.Footnote 3 We turn our attention to a public goods game that is conducive to cooperation. Specifically, in infinitely repeated public goods games, efficient cooperative outcomes can be sustained as a Nash equilibrium.
Unlike most of the experimental design features previously studied in the context of public goods games, introducing infinity via a probabilistic stopping rule for the game may result in cooperation becoming a Nash equilibrium. The experimental literature on random stopping rules includes trust games, prisoner's dilemma games and public goods games. There are significant differences across these games in terms of the complexity of the task and the way the decision is framed. Thus, it should come as no surprise that the evidence is mixed regarding the effect of probabilistic stopping rules. For example, Engle-Warnick and Slonim (Reference Engle-Warnick and Slonim2004) report similar levels of trusting behavior between finite and random endpoint treatments in early rounds of trust experiments. However, there is significantly less trusting behavior in later rounds of the experiment with a finite endpoint than with a random stopping point. Dal Bó (Reference Dal Bó2005) reports greater levels of cooperation in prisoner's dilemma games with a random stopping rule compared to finitely repeated games, but Normann and Wallace (Reference Normann and Wallace2012) report no significant difference in cooperation rates across prisoner's dilemma games with known, unknown, and probabilistic endpoints. In a recent survey of this growing literature and analysis of the metadata, Dal Bó and Fréchette (Reference Dal Bó and Fréchette2018) conclude that cooperation is generally higher with random stopping rules, and this effect is amplified as subjects play more rounds of the game.
A common feature of these prisoner's dilemma and trust experiments is that they have relatively simple decision tasks; subjects are paired and make binary decisions to cooperate or not cooperate. By comparison, the linear public goods framework involves subjects interacting in a group and having a rich choice set, rather than a binary choice to cooperate or not. Furthermore, Lugovskyy et al. (Reference Lugovskyy, Puzzello, Sorensen, Walker and Williams2017) present evidence that framing the decision as a contribution to a group account results in significantly more cooperation than a prisoners dilemma framing. For these reasons, we focus our comparison on two studies of public goods games with “infinite” (random) and finite endpoints.
Tan and Wei (Reference Tan and Wei2014) perform two treatments of two supergames each. The first treatment has three fixed groups of five subjects who participate in a 10-round game. At termination, subjects are informed that they will play another 10 rounds in the same groups. The second treatment holds the same parameters, but with a 90% probability of continuation for all subjects between each round, based on the draw of a red ball from a bingo cage. Thus, the two treatments have the same expected number of rounds. Tan and Wei (Reference Tan and Wei2014) find that average contributions in the finite and random treatments are not significantly different over all rounds of play. However, they note a steep drop off in contributions observed in the latter rounds of the finite endpoint treatment but not in the random treatment.
Lugovskyy et al. (Reference Lugovskyy, Puzzello, Sorensen, Walker and Williams2017) study public goods games with groups comprised of two or four players. Subjects participate in 15 supergames, with subjects regrouped between each sequence. In the finite endpoint treatment, subjects are told that there are five rounds per game. In the random endpoint treatment, subjects are told that the chance of playing each additional round is 0.80. The authors report that cooperation rates over all treatments and rounds of play are not significantly affected by having a random stopping rule relative to a known finite endpoint.Footnote 4 However, in their treatment that most closely matches our study (with four subjects per decision making group), they report higher average contributions with the random endpoint compared to the known endpoint.
When focusing on early rounds of play and on late rounds of the game, we report results that are generally consistent with these two existing studies: There is no significant difference in cooperative behavior across finite endpoint and random endpoint treatments in early rounds of play. Conversely, all studies provide some evidence of higher cooperation rates in late rounds of play with a random endpoint relative to a finite endpoint. The evidence is more mixed when aggregating over all rounds of play, where we find more cooperation overall with a probabilistic endpoint than a finite endpoint treatment. Tan and Wei (Reference Tan and Wei2014) and Lugovskyy et al. (Reference Lugovskyy, Puzzello, Sorensen, Walker and Williams2017) do not find significantly more cooperation overall with a random stopping point than with a finite known endpoint.
Finding some differences in results is not surprising considering that the studies vary in terms of parameters that have been shown to affect behavior in other public goods games. A notable difference between the design of these studies and ours is that our subjects only participate in one supergame compared to multiple supergames with multiple rounds. In a review of the literature from prisoner's dilemma games with random stopping rules, Dal Bó and Fréchette (Reference Dal Bó and Fréchette2018) note that the probability of engaging in future interactions has a larger positive effect on cooperation rates in studies with multiple supergames as opposed to a single game. Thus, one might expect this feature of our study to understate the effect of the random stopping rule related to the other two studies. Alternatively, our divergent results might be due to differences in other parameters which we discuss in further detail below. The remainder of this document is organized as follows. In the next section we discuss the experimental design. Next, we discuss theoretical predictions from our public goods game, and in the following section we turn to our results. We conclude with a discussion of our findings.
2 Experimental design
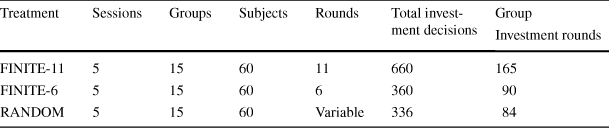
All of the experiments were conducted at William & Mary using undergraduate students as subjects. Table 1 provides details related to the experimental design. A total of 180 subjects were recruited from large introductory-level courses to participate in a voluntary contribution mechanism (VCM) experiment. Subjects were organized into fixed groups of four people each and were told that the composition of the group was the same for the entire experiment. At the start of each decision making round, subjects were given five tokens that could be kept or invested. Everyone earned money in the same manner: $1.00 for each token kept, $0.50 for each token invested, and $0.50 for each token invested by the three other people in their group. Thus, our marginal per capita return (MPCR) from the public good was fixed at 0.50 for the entire game. The experiments were run by hand, but the instructions for the experiment were adapted from the Veconlab website at the University of Virginia (http://veconlab.econ.virginia.edu). Instructions for the experiment are available in Appendices 1 and 2.
Observation counts by treatment
|
Treatment |
Sessions |
Groups |
Subjects |
Rounds |
Total investment decisions |
Group |
|---|---|---|---|---|---|---|
|
Investment rounds |
||||||
|
FINITE-11 |
5 |
15 |
60 |
11 |
660 |
165 |
|
FINITE-6 |
5 |
15 |
60 |
6 |
360 |
90 |
|
RANDOM |
5 |
15 |
60 |
Variable |
336 |
84 |
In the RANDOM treatment, the endpoint of the experiment was determined randomly by the throw of a 6-sided die at the end of each round. If the result of the die throw was 1, 2, 3, 4, or 5, the experiment continued for another round. If the result of the die throw was 6, then the experiment ended for that group.Footnote 5 Subjects watched as we conducted a separate die throw every round for each of the four groups in each session of the experiment. Thus, the length of the experiment varied across the groups and ranged from 1 to 13 rounds.
In the FINITE-6 treatment, the experiment ended with certainty after six rounds of decision making. This information was provided to subjects at the beginning of the experiment. We set the length of the game at six rounds to match the expected number of rounds in the RANDOM treatment. This was also the average number of rounds subjects played in the RANDOM treatment (5.9 rounds). In the FINITE-11 treatment, subjects were told that the experiment ended with certainty after 11 rounds of decision making. We chose 11 rounds because that was the longest number of rounds subjects played with the 5/6 continuation probability in the RANDOM treatment. For each of the three treatments, we ran five sessions with 12 subjects (three fixed groups of decision makers) in each session, for a total of 60 subjects per treatment and 180 subjects for the entire study. At the end of each session, subjects completed a survey that collected demographic information and asked subjects questions related to charitable donations and risky behaviors. Survey questions are available in Appendix 3.
The session length varied by group and treatment and ranged from 30 to 90 min. Subjects were paid a $5 show up fee and all of the money they earned in the public goods game. Earnings averaged $7.62 per round ($44.30 total) for the RANDOM treatment, $7.26 per round ($43.58 total) for the FINITE-6 treatment and $6.88 per round ($75.72 total) for the FINITE-11 treatment.
3 Predictions
First, consider the stage game described above. As long as the value of a token kept (v) is greater than the private value of a token invested (i.e., contributed to the group account) (c) there is a unique dominant strategy Nash equilibrium to keep all tokens. Furthermore, for any group of size N, if the total value of a token contributed to the group account, N ∗ c, is greater than v, full investment is the efficient outcome. Note that for our parameters, N ∗ c > v > c, since N = 4, c = 0.50 and v = 1. By backward induction, this result also holds for the FINITE-6 and FINITE-11 treatments since the subjects know the endpoint of the game. Thus, the unique subgame perfect Nash equilibrium outcome in the two FINITE treatments is zero tokens invested in all rounds.
It is straightforward to show that zero tokens invested is also a subgame perfect Nash equilibrium in the RANDOM treatment (with the probabilistic endpoint). But there are additional subgame perfect Nash equilibria in the treatment with a random stopping point. In fact, the socially optimal outcome of full investment in the public good can be supported as an equilibrium outcome as well. Lugovskyy et al. (Reference Lugovskyy, Puzzello, Sorensen, Walker and Williams2017) present the general proof of existence for the full investment equilibrium. Here, we outline the case for full investment as one equilibrium for our parameterization of the probabilistic endpoint game.
Recall that each group consists of four players who earn $1 by keeping a token and $0.50 by investing a token. Additionally, every member of the group earns $0.50 for every token invested. To simplify calculations, assume subjects have 1 token to keep or invest in the public account. It is reasonable to expect that subjects might adopt strategies that depend on the prior actions of other group members. Assume that all players begin by investing and following the grim trigger strategy: invest as long as all other players invest. And if any player deviates from investing, choose not to invest for the duration of the game. To show that this is an equilibrium, we need to demonstrate that player i will not defect from the invest strategy in the next round, t. The benefit to player i of defecting (i.e., keeping her token) in round t is equal to the payoff if the three other players invest their tokens and she keeps her token (= $2.50) minus the payoff if the three others invest their tokens and she invests her token (= $2.00). Thus, the gain from this defection is $0.50. Because all players use the grim strategy, the defection will trigger others to defect for the rest of the game. Thus, instead of earning $2.00 in all future rounds, player i will earn $1. Since the probability of playing another round is 5/6 (= 0.83),Footnote 6 the expected loss in round t + 1 more than offsets the $0.50 gain from defecting in round t. Furthermore, this loss will be compounded in every subsequent round. Thus, player i will not choose to defect in round t.
In the analysis that follows, we compare behavior to the two corner solutions discussed above: zero investment in the public good and full investment in the public good. These benchmarks represent the extremes of earnings in the game, since zero investment minimizes earnings and full investment maximizes earnings. However, the main focus of the analysis is a comparison of behavior between the games with finite and random endpoints.
4 Results
In the following analysis, we explore the experimental data using two approaches. First, we examine group investment behavior and present summary statistics and formal tests across treatments and whether group decisions vary by game round. Next, we examine individual investment decisions using a regression model for formally examining how decisions are impacted by the stopping rule as well as other covariates, such as the group's prior investment decisions. Finally, we investigate individual heterogeneity in public goods investment using a second-stage regression that decomposes individual fixed effects according to individual characteristics. This allows us to investigate the central questions in this paper: do differences in endpoint treatments matter for public goods investment decisions, are the effects we observe due to length of game or endpoint effects, and do differences in individual behavior matter for investment in public goods?
4.1 Group-level analysis
Since individual investment decisions within groups are not independent, we first characterize the investment behavior of the group across game rounds. Figure 1 shows mean group investment in the public good, which can range from 0 to 5, by round for each treatment. A visual inspection of how average group investment varies across game rounds shows that investment starts near 2.5 tokens on average in all three treatments. This is consistent with the general pattern in the VCM literature of subjects contributing about half of their endowment to the public good in early rounds of play. Both finite endpoint treatments reveal a decline in investment over time that seems to fall faster as the known endpoint is approached. In contrast, the random endpoint treatment remains relatively constant but with a noticeable decline in round 5. It is possible that since there is a 5/6 chance of the game continuing in that treatment subjects may conclude that they will probably play about 6 rounds, so they are more likely to defect in round 5. For those continuing beyond this, there is a realization that they need to consider a longer probabilistic time horizon, and they return to higher investment levels.
Average group investment by round and treatment
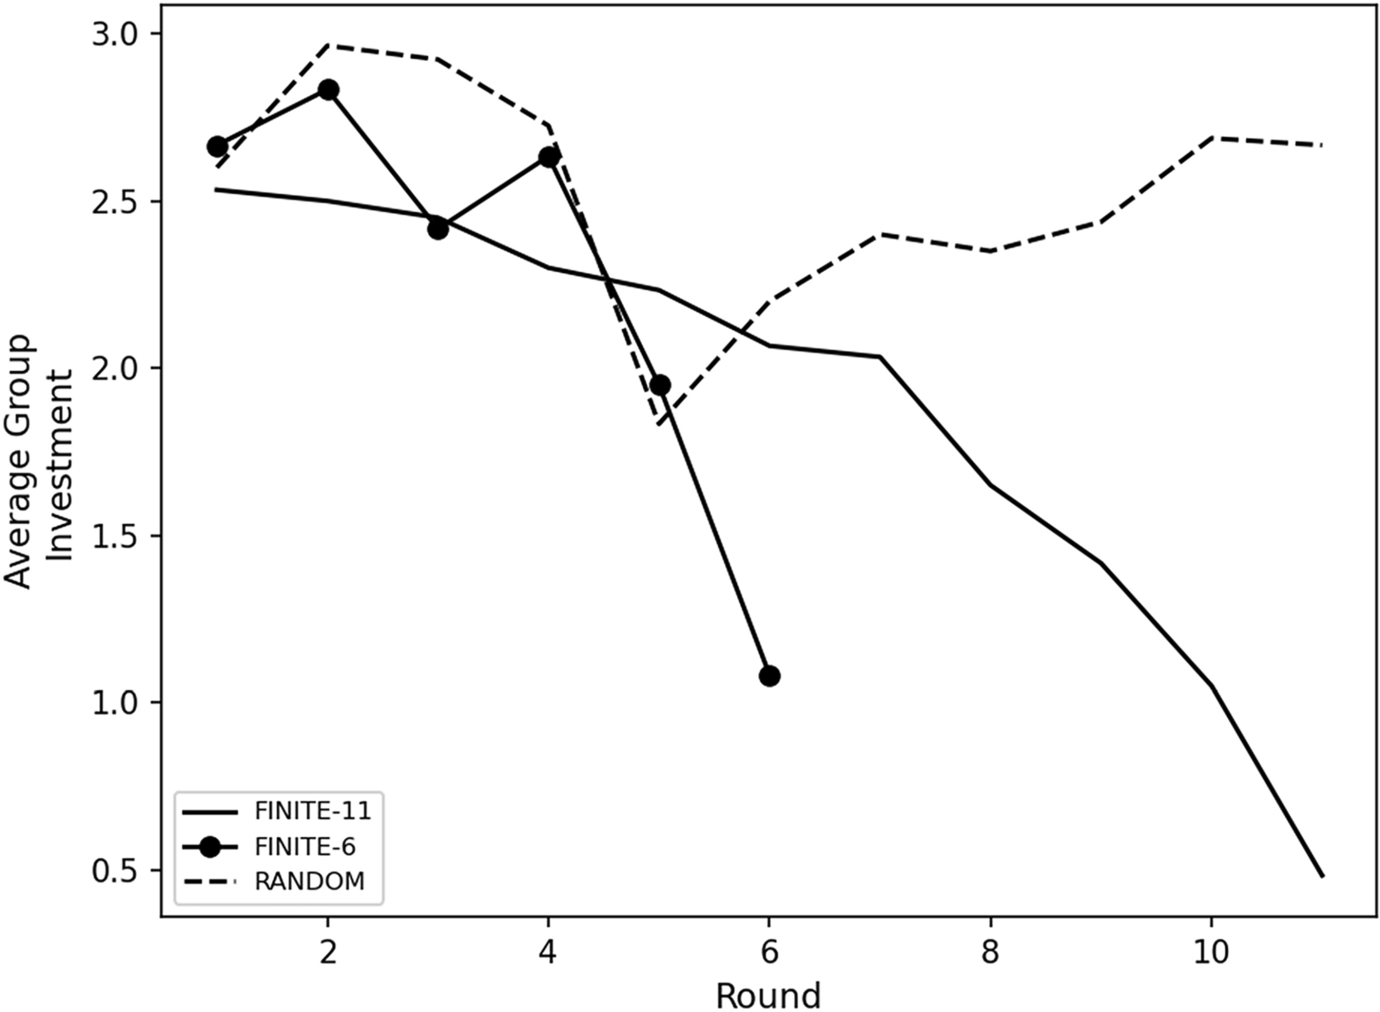
Notice that until round 5 we see similar investment patterns across treatments, ranging from approximately 2.4–3 tokens invested. In round 6, investment for FINITE-6 falls precipitously, whereas the other two treatments remain at similar levels of around 2.2 tokens. After round 7, we see larger differences in investment as the RANDOM treatment rebounds close to the 2.5 tokens invested in early rounds of play, whereas the FINITE-11 treatment drops to approximately 0.5 tokens.
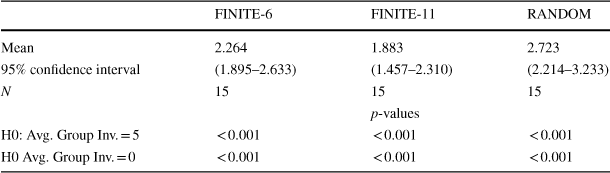
Table 2 examines if either investment corner solution outcome outlined in the predictions section (no cooperative behavior or full cooperation) is consistent with the data. Recall that complete free riding is supported as an equilibrium in every treatment. Alternatively, full contribution (the efficient outcome) is also an equilibrium in the RANDOM treatment. Formal testing using t tests reveals that investment choices are significantly different from the corner solution of zero contributions for every treatment and the full cooperative outcome of five contributions in all three treatments.Footnote 7
Average group investment and theoretical predictions
|
FINITE-6 |
FINITE-11 |
RANDOM |
|
|---|---|---|---|
|
Mean |
2.264 |
1.883 |
2.723 |
|
95% confidence interval |
(1.895–2.633) |
(1.457–2.310) |
(2.214–3.233) |
|
N |
15 |
15 |
15 |
|
p-values |
|||
|
H0: Avg. Group Inv. = 5 |
< 0.001 |
< 0.001 |
< 0.001 |
|
H0 Avg. Group Inv. = 0 |
< 0.001 |
< 0.001 |
< 0.001 |
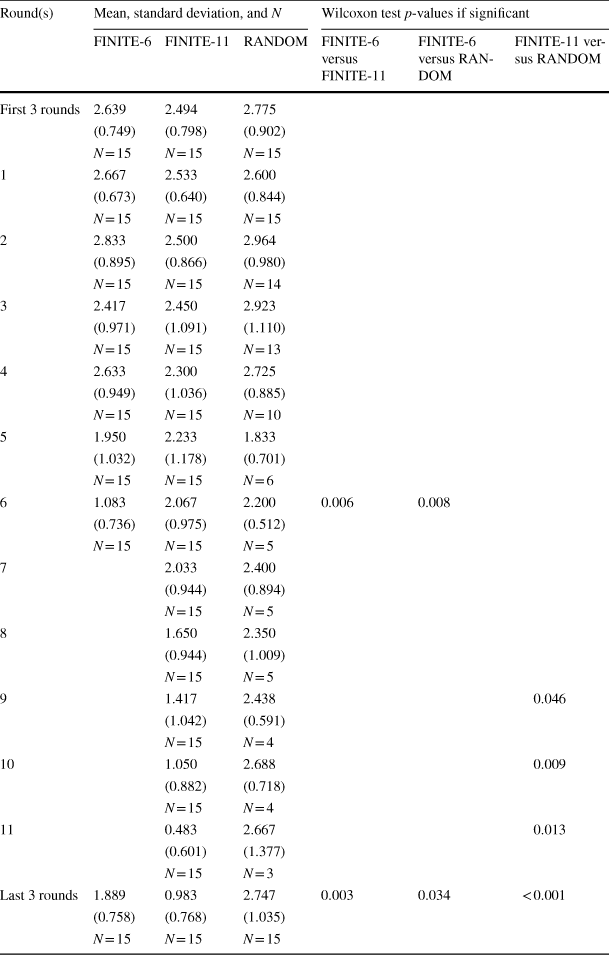
Table 3 provides additional details on investment levels by round and treatment. In the first three columns of Table 3, we report average group investment, the standard deviation of mean group investment, and the number of groups playing for each round and treatment. Following the existing two studies in this area, we include a focus on early game and end game behavior.Footnote 8 In the first row of the table, we combine rounds 1 through 3 for a given treatment, and the final row of the table combines the group's final 3 rounds for each treatment. The averages reported in Table 3 mirror Fig. 1. Recall that for FINITE-6 there are no rounds observed past round 6 by construction.
Average group investment by treatment and round
|
Round(s) |
Mean, standard deviation, and N |
Wilcoxon test p-values if significant |
||||
|---|---|---|---|---|---|---|
|
FINITE-6 |
FINITE-11 |
RANDOM |
FINITE-6 versus FINITE-11 |
FINITE-6 versus RANDOM |
FINITE-11 versus RANDOM |
|
|
First 3 rounds |
2.639 |
2.494 |
2.775 |
|||
|
(0.749) |
(0.798) |
(0.902) |
||||
|
N = 15 |
N = 15 |
N = 15 |
||||
|
1 |
2.667 |
2.533 |
2.600 |
|||
|
(0.673) |
(0.640) |
(0.844) |
||||
|
N = 15 |
N = 15 |
N = 15 |
||||
|
2 |
2.833 |
2.500 |
2.964 |
|||
|
(0.895) |
(0.866) |
(0.980) |
||||
|
N = 15 |
N = 15 |
N = 14 |
||||
|
3 |
2.417 |
2.450 |
2.923 |
|||
|
(0.971) |
(1.091) |
(1.110) |
||||
|
N = 15 |
N = 15 |
N = 13 |
||||
|
4 |
2.633 |
2.300 |
2.725 |
|||
|
(0.949) |
(1.036) |
(0.885) |
||||
|
N = 15 |
N = 15 |
N = 10 |
||||
|
5 |
1.950 |
2.233 |
1.833 |
|||
|
(1.032) |
(1.178) |
(0.701) |
||||
|
N = 15 |
N = 15 |
N = 6 |
||||
|
6 |
1.083 |
2.067 |
2.200 |
0.006 |
0.008 |
|
|
(0.736) |
(0.975) |
(0.512) |
||||
|
N = 15 |
N = 15 |
N = 5 |
||||
|
7 |
2.033 |
2.400 |
||||
|
(0.944) |
(0.894) |
|||||
|
N = 15 |
N = 5 |
|||||
|
8 |
1.650 |
2.350 |
||||
|
(0.944) |
(1.009) |
|||||
|
N = 15 |
N = 5 |
|||||
|
9 |
1.417 |
2.438 |
0.046 |
|||
|
(1.042) |
(0.591) |
|||||
|
N = 15 |
N = 4 |
|||||
|
10 |
1.050 |
2.688 |
0.009 |
|||
|
(0.882) |
(0.718) |
|||||
|
N = 15 |
N = 4 |
|||||
|
11 |
0.483 |
2.667 |
0.013 |
|||
|
(0.601) |
(1.377) |
|||||
|
N = 15 |
N = 3 |
|||||
|
Last 3 rounds |
1.889 |
0.983 |
2.747 |
0.003 |
0.034 |
< 0.001 |
|
(0.758) |
(0.768) |
(1.035) |
||||
|
N = 15 |
N = 15 |
N = 15 |
||||
We also examine whether the average group investments observed across treatments are likely drawn from the same distribution using the Wilcoxon Rank-Sum test. The Wilcoxon test results are reported in the final three columns of Table 3 as p-values from paired treatment comparisons. To avoid clutter, we only report significant differences (at a p-value less than 0.1), so blank values are not significantly different.Footnote 9 The p-value reflects the likelihood of the null hypothesis: that the samples from two treatments in a given round (e.g., round 3 for RANDOM vs FINITE-6) are drawn from the same distribution. Using a p-value cut-off for rejecting the null hypothesis of 10%, we do not find significant differences in investment levels for the three pairwise comparisons in the first 3 rounds of decision making combined. Looking at individual rounds, there are no significant differences in observed investment behavior through the first five rounds of play. Comparing RANDOM, FINITE-11, and FINITE-6, we see that in the final round of the FINITE-6 treatment, there are significant differences between both the FINITE-11 and RANDOM treatments, with investment being higher than in the final round of the FINITE-6 treatment. Comparing the FINITE-11 to the RANDOM treatment in later rounds (rounds 7–11), we see an increasing divergence in average investment across treatments. The FINITE-11 average group investment drops from approximately 2 to 0.5 while the RANDOM treatment remains relatively constant at around 2.5. These differences become significant after round 8. There are also significant differences across all three comparisons when results are aggregated over the last 3 rounds of play.Footnote 10 Finally, while not included in Table 3, Wilcoxon tests reveal that contributions aggregated over all rounds of play are higher with a RANDOM endpoint than with a FINITE endpoint.Footnote 11
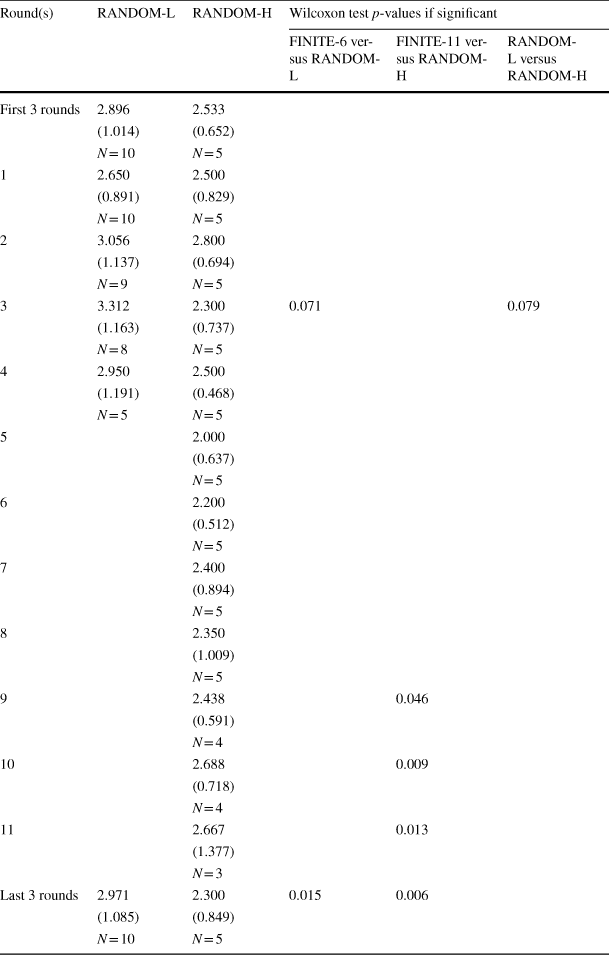
Perhaps the significant difference we see in rounds 9, 10, and 11 when comparing the RANDOM and the FINITE-11 results in Table 3 is due to a type of selection bias. As groups are randomly dropped in the random endpoint game, it might be that remaining groups differ in their propensity to invest in the public good, and this occurs completely due to chance (since the selection mechanism is a die roll). As a robustness check on our results we include Table 4, where we partition our RANDOM treatment group into those groups remaining from round 7 or onwards (denoted RANDOM-H) and those that were randomly selected out of the game by round 7 (denoted RANDOM-L). If we fail to see systematic differences in investment behavior for the lower rounds (rounds 1–6) between these groups, then it is unlikely that the random selection mechanism is driving the differences between treatments as reported in Table 3. Additionally, we include the first and last three rounds as in Table 3. The robustness check reveals only one round-level significant difference (round 3) in the RANDOM subjects partitioned by number of rounds played. For round 3, subjects who played fewer rounds invested significantly more tokens on average than subjects who played more rounds. Notice in the top and bottom rows of the table, even if we aggregate investment for the first or last three rounds, we do not see significant differences in the RANDOM-L and RANDOM-H groups. Furthermore, when we compare RANDOM-L and RANDOM-H over all rounds of play, we still do not see significant differences between the two groups.Footnote 12 Thus, the finding of higher investment in late rounds by subjects in the RANDOM group relative to the FINITE-11 group is not likely the result of a selection effect whereby subjects who are predisposed to invest more in the public good end up playing more rounds of the game in the RANDOM treatment.
Average group investment by round for RANDOM treatment by game length
|
Round(s) |
RANDOM-L |
RANDOM-H |
Wilcoxon test p-values if significant |
||
|---|---|---|---|---|---|
|
FINITE-6 versus RANDOM-L |
FINITE-11 versus RANDOM-H |
RANDOM-L versus RANDOM-H |
|||
|
First 3 rounds |
2.896 |
2.533 |
|||
|
(1.014) |
(0.652) |
||||
|
N = 10 |
N = 5 |
||||
|
1 |
2.650 |
2.500 |
|||
|
(0.891) |
(0.829) |
||||
|
N = 10 |
N = 5 |
||||
|
2 |
3.056 |
2.800 |
|||
|
(1.137) |
(0.694) |
||||
|
N = 9 |
N = 5 |
||||
|
3 |
3.312 |
2.300 |
0.071 |
0.079 |
|
|
(1.163) |
(0.737) |
||||
|
N = 8 |
N = 5 |
||||
|
4 |
2.950 |
2.500 |
|||
|
(1.191) |
(0.468) |
||||
|
N = 5 |
N = 5 |
||||
|
5 |
2.000 |
||||
|
(0.637) |
|||||
|
N = 5 |
|||||
|
6 |
2.200 |
||||
|
(0.512) |
|||||
|
N = 5 |
|||||
|
7 |
2.400 |
||||
|
(0.894) |
|||||
|
N = 5 |
|||||
|
8 |
2.350 |
||||
|
(1.009) |
|||||
|
N = 5 |
|||||
|
9 |
2.438 |
0.046 |
|||
|
(0.591) |
|||||
|
N = 4 |
|||||
|
10 |
2.688 |
0.009 |
|||
|
(0.718) |
|||||
|
N = 4 |
|||||
|
11 |
2.667 |
0.013 |
|||
|
(1.377) |
|||||
|
N = 3 |
|||||
|
Last 3 rounds |
2.971 |
2.300 |
0.015 |
0.006 |
|
|
(1.085) |
(0.849) |
||||
|
N = 10 |
N = 5 |
||||
4.2 Individual-level analysis
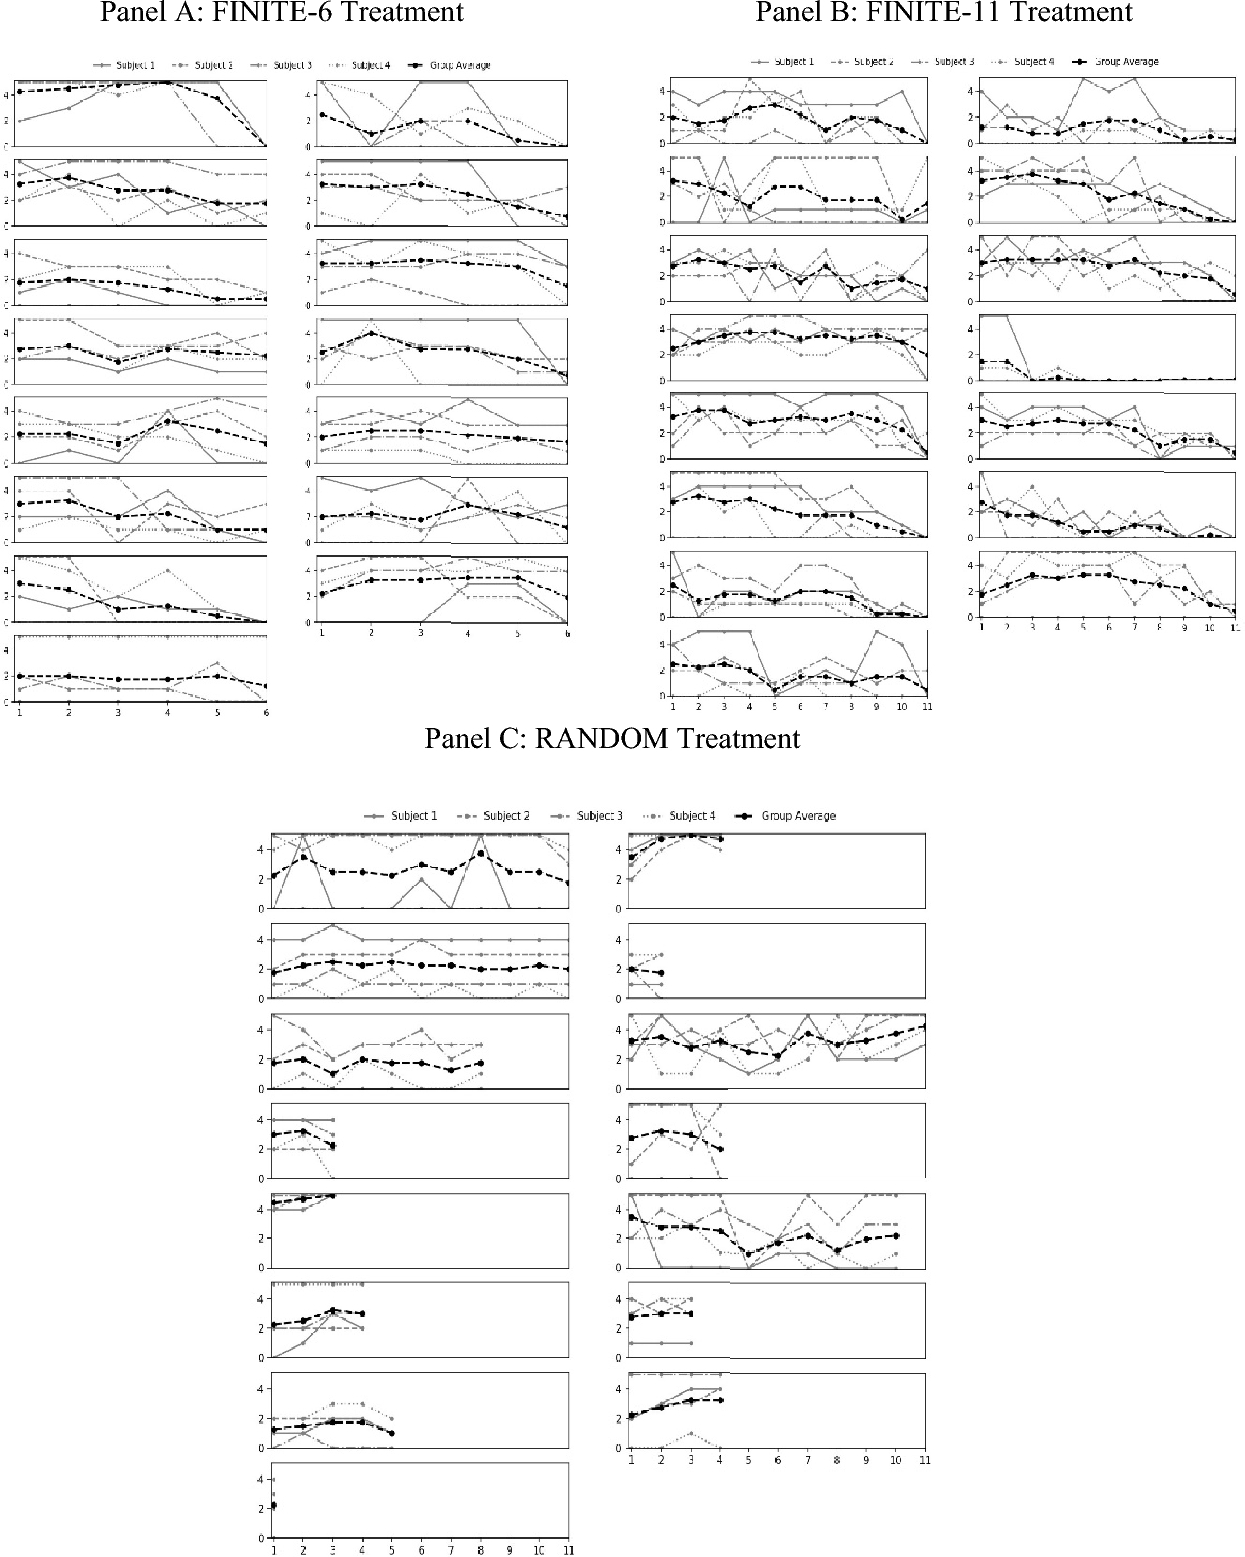
In the previous section, we show that groups sustain significantly higher overall levels of contributions in public goods experiments when the endpoint of the session is randomly determined. We also note that, regardless of the endpoint treatment, investment in the public good generally falls somewhere between full free riding and full investment. Furthermore, there is considerable variation in investment across groups. Figure 2 shows investment organized by individual subject, group, and treatment. Note that there is variation in individual behavior across all treatments.
Investment levels by subject, group and treatment
To better understand variation in behavior, we next turn to a formal model of the investment decisions of individual subjects. The model focuses on how investment is shaped by past group behavior after controlling for several factors including subject fixed effects, constants for each round, and past investment decisions made by the individual. For each treatment, we estimate a model of individual investment decisions
 for each individual i in group g and round r as:

where
 is investment made by individual i, a member of group g in round r in treatment T and
 is average group investment (excluding individual i) for an individual group in the prior round, and
 and
and
 are individual and group fixed effects which are round invariant within individual.Footnote 13 Our specification allows for investment decisions to have "stickiness" (since lagged own investment is included) and to test for tit-for-tat strategies by subjects who might condition their own current investment on cooperation rates of other group members (since lagged group investment is included). The round-varying intercept δ
r, allows us to test the hypothesis of round and end-point effects once we control for the aforementioned effects.Footnote 14 We also estimate a simpler version that drops round-by-round intercept shifters, specified as
are individual and group fixed effects which are round invariant within individual.Footnote 13 Our specification allows for investment decisions to have "stickiness" (since lagged own investment is included) and to test for tit-for-tat strategies by subjects who might condition their own current investment on cooperation rates of other group members (since lagged group investment is included). The round-varying intercept δ
r, allows us to test the hypothesis of round and end-point effects once we control for the aforementioned effects.Footnote 14 We also estimate a simpler version that drops round-by-round intercept shifters, specified as

This latter specification still allows for round-specific differences from past behavior to influence investment decisions but drops the round specific effects. Note that both of these models allow for fixed effects that deals with unobserved group and individual heterogeneity.Footnote 15 This simplest specification allows us to examine if investment behavior is independent of endpoint effects and is solely being driven by actions taken by the individual and group in the preceding round.
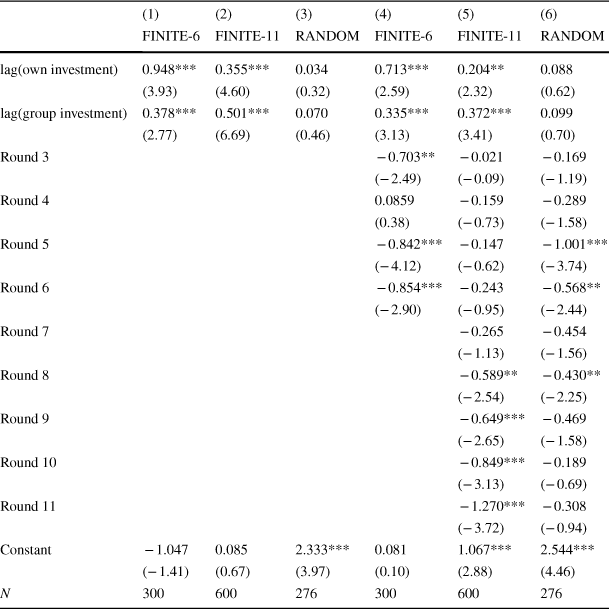
Since the models above include lagged values of the dependent variable, we estimate the model using dynamic panel models (Arellano & Bond, Reference Arellano and Bond1991) as standard fixed effects methods may suffer from bias for small T panels when lagged dependent variables are included (Nickell, Reference Nickell1981). Table 5 contains the estimated model results, with columns (1)–(3) corresponding to the restricted version of the model with no round constants as defined in Eq. (2) and models (4)–(6) corresponding to the full model specified in Eq. (1).Footnote 16 For each of the FINITE treatments, we see that cooperative behavior of other group members [lag(group investment)] is positively and significantly correlated with a subject's investment decision. We do not see this in the RANDOM treatments as the coefficients are not significant. A positive coefficient indicates that if group members cooperate in the prior period, subjects are more likely to invest more in the current period. The positive coefficient on lag(own investment) in the FINITE treatments indicates that subjects tend to increase investment from the prior period. Whereas for the RANDOM treatment, this effect is not significant. The specification in the first 3 columns of Table 5 assumes that all round-by-round variation is driven by decisions made in the prior round and a subject's investment decision would not vary due to the timing of the round itself.
Subject-level investment decisions
|
(1) |
(2) |
(3) |
(4) |
(5) |
(6) |
|
|---|---|---|---|---|---|---|
|
FINITE-6 |
FINITE-11 |
RANDOM |
FINITE-6 |
FINITE-11 |
RANDOM |
|
|
lag(own investment) |
0.948*** |
0.355*** |
0.034 |
0.713*** |
0.204** |
0.088 |
|
(3.93) |
(4.60) |
(0.32) |
(2.59) |
(2.32) |
(0.62) |
|
|
lag(group investment) |
0.378*** |
0.501*** |
0.070 |
0.335*** |
0.372*** |
0.099 |
|
(2.77) |
(6.69) |
(0.46) |
(3.13) |
(3.41) |
(0.70) |
|
|
Round 3 |
− 0.703** |
− 0.021 |
− 0.169 |
|||
|
(− 2.49) |
(− 0.09) |
(− 1.19) |
||||
|
Round 4 |
0.0859 |
− 0.159 |
− 0.289 |
|||
|
(0.38) |
(− 0.73) |
(− 1.58) |
||||
|
Round 5 |
− 0.842*** |
− 0.147 |
− 1.001*** |
|||
|
(− 4.12) |
(− 0.62) |
(− 3.74) |
||||
|
Round 6 |
− 0.854*** |
− 0.243 |
− 0.568** |
|||
|
(− 2.90) |
(− 0.95) |
(− 2.44) |
||||
|
Round 7 |
− 0.265 |
− 0.454 |
||||
|
(− 1.13) |
(− 1.56) |
|||||
|
Round 8 |
− 0.589** |
− 0.430** |
||||
|
(− 2.54) |
(− 2.25) |
|||||
|
Round 9 |
− 0.649*** |
− 0.469 |
||||
|
(− 2.65) |
(− 1.58) |
|||||
|
Round 10 |
− 0.849*** |
− 0.189 |
||||
|
(− 3.13) |
(− 0.69) |
|||||
|
Round 11 |
− 1.270*** |
− 0.308 |
||||
|
(− 3.72) |
(− 0.94) |
|||||
|
Constant |
− 1.047 |
0.085 |
2.333*** |
0.081 |
1.067*** |
2.544*** |
|
(− 1.41) |
(0.67) |
(3.97) |
(0.10) |
(2.88) |
(4.46) |
|
|
N |
300 |
600 |
276 |
300 |
600 |
276 |
t statistics in parentheses
*p < 0.10, **p < 0.05, **p < 0.01
In columns (4)–(6) of Table 5, we allow for average investment to differ by round (by way of round constants) as described in model (1). We continue to see for the FINITE treatments that there is evidence of conditional cooperation. Subjects who observe their group investing more in the prior round tend to invest more in the current period. However, we see that this effect is not significant in the RANDOM treatment. As for how a subject's strategy evolves through time based on their past investments, we see that participants in the FINITE treatments tend to increase their investment amounts over the prior round with the effect being strongest in FINITE-6 followed by FINITE-11.
The round constants for the model in Eq. (1) in columns (4)–(6) show that for both FINITE endpoint treatments, investment declines relative to earlier periods as the FINITE endpoint nears, even after accounting for the strategic behavior of others in the game [via lag(group investment)] and the stickiness associated with an individual's own investment strategy [via lag(own investment)]. This occurs in round 3 with no significant effect in round 4 and returns with largest magnitude in the final two periods of the FINITE-6 treatment and begins in round 8 and accelerates in the FINITE-11 treatment. There is no such endpoint effect observed in the RANDOM treatment. While there are significantly declining investments in rounds 5, 6 and 8, this may be due to subjects’ irrationally anticipating the game ending after 6 rounds due to the
 continuation rule. These effects are smaller compared to the corresponding round effects in either FINITE treatment and it does not continue through to the final rounds.
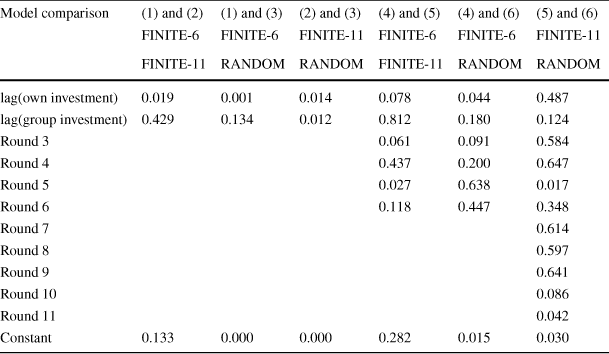
We formally conduct tests of pairwise coefficient equality across treatments for all parameters in Table 5 and present those in Table 6. The results show that for the models with no round dummies in Eq. (2), we have significant differences in lagged own and lagged group investment across all treatments (except for differences comparing FINITE-6 and FINITE-11 lagged group investment).Footnote 17 For the model in Eq. (1), we see similar round constants when comparing the FINITE-6 and FINITE-11with some significant differences in round 3 and round 5. Finally, comparing the RANDOM and FINITE-11 treatments, we see significant differences in the final two periods of the FINITE-11 game.
Tests for parameter differences across treatments (p-value from Z-test reported)
|
Model comparison |
(1) and (2) |
(1) and (3) |
(2) and (3) |
(4) and (5) |
(4) and (6) |
(5) and (6) |
|---|---|---|---|---|---|---|
|
FINITE-6 |
FINITE-6 |
FINITE-11 |
FINITE-6 |
FINITE-6 |
FINITE-11 |
|
|
FINITE-11 |
RANDOM |
RANDOM |
FINITE-11 |
RANDOM |
RANDOM |
|
|
lag(own investment) |
0.019 |
0.001 |
0.014 |
0.078 |
0.044 |
0.487 |
|
lag(group investment) |
0.429 |
0.134 |
0.012 |
0.812 |
0.180 |
0.124 |
|
Round 3 |
0.061 |
0.091 |
0.584 |
|||
|
Round 4 |
0.437 |
0.200 |
0.647 |
|||
|
Round 5 |
0.027 |
0.638 |
0.017 |
|||
|
Round 6 |
0.118 |
0.447 |
0.348 |
|||
|
Round 7 |
0.614 |
|||||
|
Round 8 |
0.597 |
|||||
|
Round 9 |
0.641 |
|||||
|
Round 10 |
0.086 |
|||||
|
Round 11 |
0.042 |
|||||
|
Constant |
0.133 |
0.000 |
0.000 |
0.282 |
0.015 |
0.030 |
These significant differences in round constants support our findings from the earlier tests looking at group means in Sect. 4.1. Taken together, these results show the same patterns emerging from the experimental data and underscore the finding that significant differences in investment are occurring and those differences are attributable to the stopping rule of the public goods games. Further, results from the models of individual investment decisions highlight that those differences are not due to changing group or individual investment strategies as those are controlled for in the regression models.
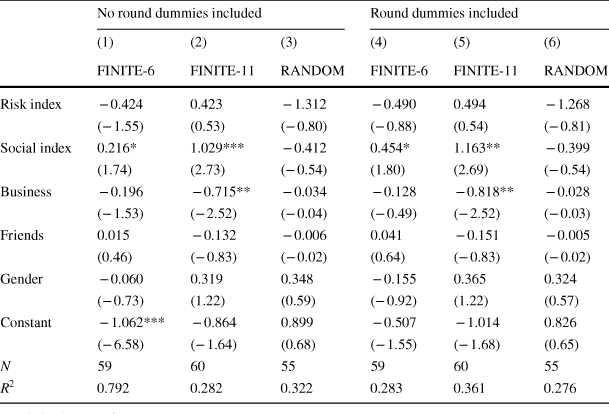
Even after controlling for endpoint treatment and subjects’ experiences in the game, there remains unexplained heterogeneity in behavior. Some studies report correlations between demographic characteristics and prosocial behavior in experiments.Footnote 18 As a robustness check, we incorporate personal characteristics captured from a survey subjects completed at the end of each session. For investigating whether risk preferences matter, we construct a risk index ranging from 0 to 1 (with 1 being the most risk loving) by examining responses to questions about actual risk-related behaviors like seatbelt use, smoking, gambling behavior, and whether the individual drives over the speed limit. The risk index uses the average of dummy variables for each of these activities coded as 1 if the individual often engages in the risky activity. We use similar methods to construct a prosocial index (with 1 being most pro-social, 0 being least pro-social) defined over the survey data collected on recycling behavior, social group membership, and environmental group membership.Footnote 19 We also include dummy variables for the respondent's gender and whether they have an interest in business as a major.
For recovering how individual-specific factors influence investment decisions, we note the following observations. The dynamic panel models in the previous sections do not allow for the identification of time-invariant factors such as individual characteristics. Consequently, we proceed in an exploratory fashion by recovering the fixed effects for each of the models estimated above and perform a second stage regression for decomposing the fixed effect by individual specific data.Footnote 20 This decomposition uses the following regression

where
 are the combined estimated fixed effect (comprised of individual and group fixed effects) from the previous section,
 are group specific fixed effects for individual
 , and
, and
 are the unobserved errors.
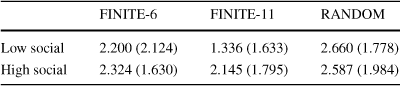
Results are presented in Table 7. We present the decomposition results for each model in Table 5, so for example, column (1) in Table 7 uses the fixed effects recovered from model (1) in Table 5. For the RANDOM treatment, we see no evidence that any of the individual factors influence investment behavior. In the FINITE-11 treatment we see that subjects who are interested in business tend to contribute less. For the FINITE-6 and FINITE-11 treatments, being prosocial tends to be correlated with higher investments relative to individuals who are not prosocial, and this holds even if the first-stage model contains round specific dummy variables (columns 4–6).Footnote 21 To further evaluate the magnitudes of these differences, Table 8 computes mean group investment by the highest and lowest social index score.Footnote 22 We see a relatively small increase in investment in the FINITE-6 treatment when moving from subjects in the lowest to highest social index. The RANDOM treatment shows a slight decline in investment for the highest social index contributors. The most striking result is from the FINITE-11 treatment, with a relatively large difference in investment comparing the highest social index subjects to the lowest.
Decomposition of fixed effects using individual characteristics
|
No round dummies included |
Round dummies included |
|||||
|---|---|---|---|---|---|---|
|
(1) |
(2) |
(3) |
(4) |
(5) |
(6) |
|
|
FINITE-6 |
FINITE-11 |
RANDOM |
FINITE-6 |
FINITE-11 |
RANDOM |
|
|
Risk index |
− 0.424 |
0.423 |
− 1.312 |
− 0.490 |
0.494 |
− 1.268 |
|
(− 1.55) |
(0.53) |
(− 0.80) |
(− 0.88) |
(0.54) |
(− 0.81) |
|
|
Social index |
0.216* |
1.029*** |
− 0.412 |
0.454* |
1.163** |
− 0.399 |
|
(1.74) |
(2.73) |
(− 0.54) |
(1.80) |
(2.69) |
(− 0.54) |
|
|
Business |
− 0.196 |
− 0.715** |
− 0.034 |
− 0.128 |
− 0.818** |
− 0.028 |
|
(− 1.53) |
(− 2.52) |
(− 0.04) |
(− 0.49) |
(− 2.52) |
(− 0.03) |
|
|
Friends |
0.015 |
− 0.132 |
− 0.006 |
0.041 |
− 0.151 |
− 0.005 |
|
(0.46) |
(− 0.83) |
(− 0.02) |
(0.64) |
(− 0.83) |
(− 0.02) |
|
|
Gender |
− 0.060 |
0.319 |
0.348 |
− 0.155 |
0.365 |
0.324 |
|
(− 0.73) |
(1.22) |
(0.59) |
(− 0.92) |
(1.22) |
(0.57) |
|
|
Constant |
− 1.062*** |
− 0.864 |
0.899 |
− 0.507 |
− 1.014 |
0.826 |
|
(− 6.58) |
(− 1.64) |
(0.68) |
(− 1.55) |
(− 1.68) |
(0.65) |
|
|
N |
59 |
60 |
55 |
59 |
60 |
55 |
|
R 2 |
0.792 |
0.282 |
0.322 |
0.283 |
0.361 |
0.276 |
t statistics in parentheses
*p < 0.10, **p < 0.05, ***p < 0.01
Mean investment by social index score (standard deviation in parentheses)
|
FINITE-6 |
FINITE-11 |
RANDOM |
|
|---|---|---|---|
|
Low social |
2.200 (2.124) |
1.336 (1.633) |
2.660 (1.778) |
|
High social |
2.324 (1.630) |
2.145 (1.795) |
2.587 (1.984) |
5 Discussion and conclusion
We contribute to a large literature that explores prosocial behavior in the context of a public goods experiment. Unlike many of the previously studied design features, we use an experimental design that opens the possibility for full contribution to the public good in equilibrium. We study the effect of the time horizon on the propensity of donors to contribute to a laboratory public good by varying the stopping rule for the game. While many studies examine the effect of a random stopping rule in prisoner's dilemma games, to our knowledge, only two other studies have directly compared behavior in public goods experiments with finite and random stopping rules.
We find that the determination of the endpoint of the game matters for prosocial behavior in a public goods setting by considering three endpoint treatments: two finite endpoints with differing lengths (6 or 11 rounds) and a random endpoint (with 5/6 probability of continuing each round). The experiment uncovers three important findings. First, prosocial behavior is highest when the endpoint is randomly determined. Second, this difference is driven primarily by endpoint effects rather than length of game effects. We isolate the effect of the endpoint by comparing a finite 6-round game to a finite 11-round game. In a similar manner, we never observe consistently declining prosocial behavior in the random endpoint treatment, even among subjects who are randomly assigned to long games. Finally, we find that contributions to the public good are remarkably similar across all three treatments as long as the endpoint is not near, as no systematic differences in prosocial behavior are found until subjects are within a few rounds of the known endpoint. Once subjects (in both the 6-round and 11-round games) are within a few rounds of the known endpoint, prosocial behavior declines with group contributions falling in a similar manner for both finite endpoint treatments but not in the random endpoint treatment.
As we note in the introduction, our findings match previous studies in some dimensions: there is no evidence that cooperation in early rounds of play is correlated with the stopping rule. And the random stopping rule appears to foster more cooperation in late rounds relative to late rounds with a known endpoint. Conversely, our finding of significant differences in contributions across all rounds of play with finite verses a random endpoint is somewhat at odds with results reported in Tan and Wei (Reference Tan and Wei2014) and for some of the treatments in Lugovskyy et al. (Reference Lugovskyy, Puzzello, Sorensen, Walker and Williams2017). Differences in results are unsurprising given differences in experimental design features. Our probability of the game continuing (5/6) lies between the continuation probabilities used in Tan and Wei (9/10) and Lugovskyy et al. (8/10). Our marginal per capita return from contributing to the group account (0.5) is identical to the value used in Tan and Wei and lies between the two values considered in Lugovskyy et al. (0.3 and 0.6). Our group size is 4, compared to either 2 or 4 in Lugovskyy et al., while Tan and Wei study 5-person groups. In contrast to these two studies, we include an additional finite endpoint treatment that is equal to the longest realized random endpoint game (11 rounds). But we do not find significant differences between our two finite endpoint treatments, so it seems unlikely that this is related to our different findings.
Another design difference between these two studies and our study is the number of supergames subjects play. Our subjects play one supergame, while subjects in the Tan and Wei (Reference Tan and Wei2014) experiment play 2 supergames, and subjects in the Lugovskyy et al. (Reference Lugovskyy, Puzzello, Sorensen, Walker and Williams2017) experiment play 15 supergames. Repetition generally depresses contributions in public goods games with known endpoints. Thus, one might reasonably expect our relatively shorter finite endpoint games to display more cooperation than the exiting studies with multiple supergames.Footnote 23
Several studies have examined the effect of multiple supergames on cooperative behavior and report significant interactions between the number of supergames, the continuation probability in the game and the (randomly determined) number of rounds played in prior supergames. A review of prisoner's dilemma games with random stopping rules reveals that studies with a single supergame generally find a smaller behavioral response to increasing the continuation probability than studies with multiple supergames (Dal Bó & Fréchette, Reference Dal Bó and Fréchette2018). Mengel et al. (Reference Mengel, Orlandi and Weidenholzer2021) revisit data from Lugovskyy et al. (Reference Lugovskyy, Puzzello, Sorensen, Walker and Williams2017) and report that the length of prior supergames is positively correlated with cooperative behavior in subsequent public goods games. Hence, it might be the case that cooperative behavior is depressed in their random endpoint treatment if subjects experience a lower than expected number of rounds in early supergames. Mengel et al. (Reference Mengel, Orlandi and Weidenholzer2021) also analyze the prisoner's dilemma metadata from Dal Bó and Fréchette (Reference Dal Bó and Fréchette2018) and report that the realized duration of prior supergames has a significant effect on cooperation in later games. Similar results have been reported in a variety of games [see, for e.g., Engle-Warnick and Slonim (Reference Engle-Warnick and Slonim2006), Dal Bó and Fréchette (Reference Dal Bó and Fréchette2011) and Dal Bó and Fréchette (Reference Dal Bó and Fréchette2018)]. But existing evidence suggests that this is a small effect: for example, Dal Bó and Fréchette (Reference Dal Bó and Fréchette2018) estimate that the probability of cooperation increases by six percentage points when the length of the prior supergame lasts for 15 rounds compared to five rounds.
Further, an analysis of endgame effects in public goods experiments is complicated by the “reset effect” of multiple supergames, as investment tends to rebound at the start of a new supergame. Tan and Wei (Reference Tan and Wei2014) and Lugovskyy et al. (Reference Lugovskyy, Puzzello, Sorensen, Walker and Williams2017) report that reset effects are not symmetric across finite and random endpoint treatments. Nonetheless, we conclude that the issue of single verses repeated supergames might explain some of the disparity in findings across studies and is a fruitful area for future research. Another detail that warrants further attention is the large variance in payoffs across the three studies. Subjects in our study earned an average of over $7 per round, compared to the $0.50 or less per round earned in the other two studies.Footnote 24
Acknowledgements
Financial support was provided for the research experiments through a Charles Koch Foundation student research grant. The Charles Koch Foundation played no role in the study design, collection, analysis or interpretation of data or in the writing of this manuscript. We thank the editor and two anonymous reviewers for many helpful suggestions.
Funding
Funding was provided by Charles G. Koch Charitable Foundation.
Data availability
The replication material for the study is available at https://scholarworks.wm.edu/economics_facwork/1/.
Appendix 1: Instructions for public goods experiment with FINITE endpoint
Matchings: The experiment consists of a series of rounds. You have been randomly assigned to a group with a total of 4 people—you and 3 other people. In each round, you will be matched with the same group of 3 other people. The decisions that you and the other 3 people make will determine the amounts earned by each of you. The identities of the other people in your group will never be revealed to you.
Investments: You begin each round with a number of "tokens", which may either be kept or invested. The 3 people you are matched with will decide how many of their tokens to keep, and how many to invest. You will not be able to see the others’ decisions until after your decision is submitted.
Earnings: The payoff to you will equal: $1.00 for each token you keep, $0.50 for each token you invest, and $0.50 for each token invested by the 3 other people who you are matched with.
Subsequent Matchings: You will be in the same group of 4 participants in all subsequent rounds, so the 3 other people you are matched with in one round are the same people that you are matched with in the next round.
Examples: Suppose you have only two tokens for the round, and the earnings from tokens kept, invested, and invested by the others are $1.00, $0.50, and $0.50 respectively.
• If you keep both tokens, then your earnings will be: $1.00 × 2 = $2.00 from the tokens kept, plus $0.50 times the number of tokens invested by the other people in your group.
• If you invest both tokens, then your earnings will be: $0.50 × 2 = $1.00 from the tokens invested, plus $0.50 times the number of tokens invested by the other people in your group.
• If you keep one and invest one, then your earnings will be: $1.00 × 1 = $1.00 from the token kept, plus $0.50 × 1 = $0.50 for the token invested, plus $0.50 times the number of tokens invested by the other people in your group.
Note: In each of the 3 above cases, what you earn from the others’ investments is: $0.00 if the others invest 0 tokens, $0.50 if the other people invest 1 token (in total) and keep the rest, $1.00 if the other people invest 2 tokens (in total), etc.
You begin each round with an endowment of 5 tokens, each of which can either be kept or invested. The 3 other people in your group will also have 5 tokens.
Everybody earns money in the same manner: $1.00 for each token kept, $0.50 for each token invested, and $0.50 for each token invested by the 3 other people.
Once all investment decisions are recorded for a round, we will collect your decision sheet, calculate the total amounts invested in each group of 4 people, fill in your earnings information for the round, and return your decision sheets and earnings to you.
You will play 6 (or 11) rounds and at the start of each new round, you will be given a new endowment of 5 tokens. You are free to change the numbers of tokens kept and invested from round to round.
Instructions summary.
• You will be matched with the same group of 3 other people in each of 6 (or 11) rounds.
• All people will begin with 5 tokens which they may keep (and earn $1.00 each) or invest (and earn $0.50 each), knowing that they will also earn $0.50 for each token invested by other people in the group.
• You will begin each round with a new endowment of 5 tokens, irrespective of how many tokens you may have kept or invested in previous rounds.
Appendix 2: Instructions for public goods experiment with RANDOM endpoint
Matchings: The experiment consists of a series of rounds. You have been randomly assigned to a group with a total of 4 people—you and 3 other people. In each round, you will be matched with the same group of 3 other people. The decisions that you and the other 3 people make will determine the amounts earned by each of you. The identities of the other people in your group will never be revealed to you.
Investments: You begin each round with a number of "tokens," which may either be kept or invested. The 3 people you are matched with will decide how many of their tokens to keep, and how many to invest. You will not be able to see the others' decisions until after your decision is submitted.
Earnings: The payoff to you will equal: $1.00 for each token you keep, $0.50 for each token you invest, and $0.50 for each token invested by the 3 other people who you are matched with.
Subsequent Matchings: You will be in the same group of 4 participants in all subsequent rounds, so the 3 other people you are matched with in one round are the same people that you are matched with in the next round.
Examples: Suppose you have only two tokens for the round, and the earnings from tokens kept, invested, and invested by the others are $1.00, $0.50, and $0.50, respectively.
• If you keep both tokens, then your earnings will be: $1.00 × 2 = $2.00 from the tokens kept, plus $0.50 times the number of tokens invested by the other people in your group.
• If you invest both tokens, then your earnings will be: $0.50 × 2 = $1.00 from the tokens invested, plus $0.50 times the number of tokens invested by the other people in your group.
• If you keep one and invest one, then your earnings will be: $1.00 × 1 = $1.00 from the token kept, plus $0.50 × 1 = $0.50 for the token invested, plus $0.50 times the number of tokens invested by the other people in your group.
Note: In each of the 3 above cases, what you earn from the others' investments is: $0.00 if the others invest 0 tokens, $0.50 if the other people invest 1 token (in total) and keep the rest, $1.00 if the other people invest 2 tokens (in total), etc.
You begin each round with an endowment of 5 tokens, each of which can either be kept or invested. The 3 other people in your group will also have 5 tokens.
Everybody earns money in the same manner: $1.00 for each token kept, $0.50 for each token invested, and $0.50 for each token invested by the 3 other people.
Once all investment decisions are recorded for a round, we will collect your decision sheet, calculate the total amounts invested in each group of 4 people, fill in your earnings information for the round, and return your decision sheets and earnings to you.
Then we will throw a 6-sided die to determine whether or not there will be another round of decision making. If the throw of the 6-sided die is 1, the experiment will end. If the throw of the 6-sided is 2, 3, 4, 5 or 6, a new decision making round will begin.
At the start of each new round, you will be given a new endowment of 5 tokens. You are free to change the numbers of tokens kept and invested from round to round.
Instructions summary
• You will be matched with the same group of 3 other people in each round.
• All people will begin with 5 tokens which they may keep (and earn $1.00 each) or invest (and earn $0.50 each), knowing that they will also earn $0.50 for each token invested by other people in the group.
• You will begin each round with a new endowment of 5 tokens, irrespective of how many tokens you may have kept or invested in previous rounds.
• At the end of each round we will throw a 6-sided die to determine whether or not there will be another decision making round. If the throw of the die is 1, the experiment will end. Otherwise, there will be another decision making round.
Appendix 3: Survey questions
General questions
1. What is your gender?
Male
Female
I prefer to not answer this question.
2. How many people participating in this experiment today do you consider to be your friend?
3. What is your primary academic interest area/major area?
Sciences
Social Sciences
Arts and Humanities
Business
I prefer not to answer this question.
Questions used in the pro-social index
4. How often do you recycle?
Nearly all the time (every day)
Frequently (a few times a week)
Occasionally (a few times a month)
Never I prefer not to answer this question.
5. During the past two years have you been a member, contributed time, or contributed money to a social organization (for example, soup kitchens or Big Brother-Big Sister).
Yes
No
I prefer not to answer this question.
6. During the past two years have you been a member, contributed time, or contributed money to an environmental organization (for example, a campus environmental group of the Nature Conservancy).
Yes
No
I prefer not to answer this question.
Questions used in the risk-index
7. How often do you wear a seatbelt when driving or riding in a car?
Always, or almost always
Most of the time
Some of the time
Never, or almost never
I prefer to not answer this question.
8. Do you smoke cigarettes every day, some days, or not at all?
Every day
Some days
Not at all
I prefer to not answer this question.
9. If you drive a car, how often do you drive over the speed limit?
Always, or almost always
Most of the time
Some of the time
Never, or almost never
Not applicable; I don't drive a car
I prefer to not answer this question.
10. How often have you gambled or purchased lottery tickets in the last year?
Never
Once or twice
Between three and twelve times
More than 12 times
I prefer to not answer this question.


 Open access