

1 Introduction
To say that COVID-19, the disease caused by the severe acute respiratory syndrome coronavirus 2 (SARS-CoV-2), threw the world into disarray throughout 2020 is not overstatement. COVID-19 has infected over 549 million people across the world and at the time of this writing has caused 6.33 million deaths, confronting the general population with a level of uncertainty and risk unprecedented in the developed world for a generation. The disease is contagious before its symptoms manifest, so people can spread it before they even know they are infected themselves, and catch it from others who appear healthy. Epidemiological knowledge of the virus developed gradually, resulting in changeable and sometimes conflicting directions from public health officials about the appropriate measures to take. To slow transmission of the disease, governments around the world implemented measures ranging from social distancing in public to home confinement, and variation in these procedures across jurisdictions and over time seemed to compound the sense of uncertainty. Even contracting the disease felt like a lottery, some dying in a matter of days while others remained entirely asymptomatic.
The pandemic also unleashed a torrent of social science research, providing an unprecedented test bed for studying everything from fake news to social solidarity. This paper enters the chorus of COVID-19 research with several variations on the theme. First, our original empirical contribution is based on three waves of incentivized questionnaires administered in “partial panel” approach to French business school students, aged 18–24.Footnote 1 While not representative, we would argue that this population, sheltered from the worst of the crisis both through their educated, relatively high-income social status and also their youth, offers insights into the pandemic’s psychological impacts, and serves as a kind of control for material costs. Second, our methodology follows Reference Schleich, Gassmann, Meissner and FaureSchleich et al. (2019), and uses a subset of their same Horizon 2020 BRISKEE project data gathered before the crisis on a comparable population, to measure changes in risk aversion, time preferences, present bias, ambiguity aversion and prudence all together. We also measure various sociodemographic variables, locus of control, and ask some questions about the expected and experienced disruption of “normal life” caused by the crisis. Even in the increasingly crowded world of COVID-19 research, the simultaneous estimation of our parameters and the repeated nature of the data leaves our results an interesting contribution to a still unsettled field.
Third, we position our results with respect to a comprehensive summary of 56 empirical research results investigating the effect of exposure to previous generalized catastrophic events on a similar selection of preference parameters. This previous literature is remarkably varied, and our findings related to COVID-19 provide an interesting point of comparison, both in the similarities and the differences (see, e.g., Reference Ayton, Bernile, Bucciol and ZarriAyton et al., 2020 for a recent literature review). With respect to COVID-19, our basic results tell the story of an initial shock, then gradual readjustments, mirrored over nearly all variables measured. More specifically, measured prudence among our subjects significantly increased during the lockdown, while both patience and aversion to risk and ambiguity decreased. Then each of these variables slowly moved back towards its pre-pandemic level, without reaching it three months later. This apparent resilience to the initial shock helps to understand the sensitivity of preferences to environmental factors, and helps to scale the COVID-19 pandemic relative to other previous catastrophes. While we will say more later, by way of indication Reference MoyaMoya (2018) describes a similar temporary quality to the increase in ambiguity aversion due to exposure to terrorist violence in Colombia, while Reference Kim and LeeKim and Lee (2014) measure increases in risk aversion in communities particularly hard hit by the Korean War 50 years later. Such differences probably reflect the fact that the general impact of the disease was more about uncertainty than about actual loss – while acknowledging the tragedy of human loss that occurred, few villages were razed from the earth by the pandemic.
A final interesting subsidiary finding from our study concerns questions on locus of control (Reference RotterRotter, 1966), a psychometric measure roughly corresponding to the extent to which people feel that they themselves, rather than external forces, direct events in their lives. We find our results are particularly driven by subjects with an external locus of control, meaning that they feel outside forces are largely determinant in the outcomes they face. Those who have a predisposition to consider their lives to be under autonomous control are less affected by the pandemic in our results.
2 Literature Review
2.1 External shocks and individual preferences
This project fits into a stream of literature that seeks to investigate preference change by using historical events such as recessions, floods, earthquakes, volcanic eruptions and war as natural experiments. The pandemic in our context presents a useful counterpoint to this literature, separating emotional responses from income shocks or changes in beliefs about the probability of future disasters (see Reference Cassar, Healy and Von KesslerCassar et al., 2017). COVID-19 has what might be called a very high social presence – the World Health Organization has referred to an “infodemic” that accompanied the epidemiological phenomenon, and Reference Aslam, Awan and SyedAslam et al. (2020), analyze a sample of 141,208 COVID-19-related headlines from the 25 top global English-language news sources between January and June 2020. Yet through the time period we investigate and for the young, educated population from which we sample, it likely does not truly bear comparison with violent conflict or major earthquakes as a disruptive force.
2.2 COVID-19 and individual preferences
As alluded to above, the COVID-19 “infodemic” was arguably not limited to the popular press. Scientific articles on the topic have also been common – and nearly as hard to parse cleanly. Perhaps unsurprisingly, risk aversion has been the most-studied individual preference parameter in this emerging literature, with some articles suggesting that that the first wave of COVID-19 significantly increased risk aversion (Reference Bäckman, Brown, Fisman, Heimer, Keloharju and PursiainenBäckman et al., 2020; Reference Bu, Hanspal, Liao and LiuBu et al., 2021; Reference Li, Huang, Tam and HongLi et al., 2021), while others found no effect (Reference Angrisani, Cipriani, Guarino, Kendall and Ortiz de ZarateAngrisani et al., 2020; Guenther et al., 2020; Reference Drichoutis and NaygaDrichoutis and Nayga, 2021,) or even a decrease (Reference Shachat, Walker and WeiShachat et al., 2021; Reference Harrison, Hofmeyr, Kincaid, Monroe, Ross, Schneider and SwarthoutHarrison et al., 2022; Reference Tsutsui and Tsutsui-KimuraTsutsui and Tsutsui-Kimura, 2022). Results on time preferences have not been less equivocal: one article showed that the first wave of COVID-19 increased patience (Reference Harrison, Hofmeyr, Kincaid, Monroe, Ross, Schneider and SwarthoutHarrison et al., 2022), one found no effect (Reference Drichoutis and NaygaDrichoutis and Nayga, 2021) and another one, an opposite effect (Reference Li, Huang, Tam and HongLi et al., 2021).
2.3 Natural disasters, war, violence and individual preferences
The lack of consensus in the COVID-19 literature both indicates the continued usefulness of studies such as ours, and also suggests that a comparison with the more mature literature on behavioral responses to other traumatic events might be useful. It appears, however, that this wider literature yields no clearer message. Table 8 in the Appendix summarizes the effects that have been identified in the previous literature, classifying the existing papers according to the type of event whose effects are measured, and the direction of the estimated effect.Footnote 2 The modal class of previous studies investigates changes in behavioral risk preferences. Of those, the greater part finds that exposure to traumatic events increases risk aversion, but there is striking variation. For instance Reference Eckel, El-Gamal and WilsonEckel et al. (2009), Reference Page, Savage and TorglerPage et al. (2014), Reference Shupp, Loveridge, Skidmore, Lim and RogersShupp et al. (2017) and Reference Cassar, Healy and Von KesslerCassar et al. (2017) present results pointing towards a decrease in risk aversion after exposure, while Reference Callen, Isaqzadeh, Long and SprengerCallen et al. (2014), Reference Cameron and ShahCameron and Shah (2015), and Reference Beine, Charness, Dupuy and JoxheBeine et al. (2020) find the contrary. Others, such as Reference Hanaoka, Shigeoka and WatanabeHanaoka et al. (2018), who find increased risk seeking only among men or Reference Eckel, El-Gamal and WilsonEckel et al. (2009), who on the contrary find that increased risk-seeking to be particularly driven by women, uncover still more complex relationships (see also Reference Willinger, Bchir and HeitzWillinger et al., 2013 and Reference Said, Afzal and TurnerSaid et al., 2015).
A similarly conflicting picture emerges with respect to time discounting. Reference Cassar, Healy and Von KesslerCassar et al. (2017), Reference Beine, Charness, Dupuy and JoxheBeine et al. (2020), Reference Hanaoka, Shigeoka and WatanabeHanaoka et al. (2018), and Reference Sawada, Kuroishi, Sawada and OumSawada and Kuroishi (2015) show that individuals express significantly more impatience after having been exposed to tsunamis, earthquakes, and floods. On the other hand, Reference CallenCallen (2015) found that Sri-Lankan exposed to the Indian Ocean Earthquake tsunami have higher levels of patience, a result again replicated in Reference Chantarat, Chheng, Minea, Oum, Samphantharak and SannChantarat et al. (2015) among Cambodian rice farmers following a flood.
We found just three papers studying the effect of catastrophic events on ambiguity aversion. On the basis of this limited sample, however, ambiguity aversion appears to have the clearest record of the three, with exposure to both natural disasters and violent conflict resulting in increased aversion (Reference Cavatorta and GroomCavatorta and Groom, 2020; Reference MoyaMoya 2018; Reference Shupp, Loveridge, Skidmore, Lim and RogersShupp et al., 2017).
These varied findings may relate to a variety of causal mechanisms. For instance, increased risk seeking can be “explained” as a generalized loss framing (Reference Page, Savage and TorglerPage et al., 2014), while increased aversion is consistent with the claim that “individuals who recently experienced a natural disaster perceive the world to be a riskier place” (Reference Cameron and ShahCameron and Shah, 2015, p. 485). Alternatively, the differences may underscore a diversity of the phenomena themselves. Overall, the message is that many effects remain possible, and a “silver bullet” factor that cleanly separates the results is elusive. Control groups, to take one example, are necessarily limited by the fundamentally unexpected nature of the events in question. Several studies turn this unexpectedness into a benefit, arguing that it can generate quasi-random distribution of exposure (e.g. Reference Page, Savage and TorglerPage et al., 2014; Reference Kim and LeeKim and Lee, 2014; Reference Samphantharak and ChantaratSamphantharak and Chantarat, 2015). However, most compare individuals with different levels of exposure to the events, at some time distance removed from when they occurred, often relying on more targeted matching between affected areas and “comparable” non-affected ones (e.g., Reference Eckel, El-Gamal and WilsonEckel et al., 2009; Reference Cameron and ShahCameron and Shah, 2015; Reference Li, Huang, Tam and HongLi et al., 2021). One might therefore think that the differences in results are tied to differences in methodology. However, “within-population” studies that compare more or less affected individuals, and “between population” studies that attempt to identify comparable non-affected groups appear equally mixed in their results.
Another potential, yet ultimately disappointing dimension of variation is the extent of personal loss in the event. Reference Page, Savage and TorglerPage et al. (2014), Reference Said, Afzal and TurnerSaid et al. (2015) and Reference Cassar, Healy and Von KesslerCassar et al. (2017) all study individual loss finding that it decreases, increases, and has no effect on risk aversion, respectively.
Logistical issues also result in sometimes large time lapses between the event and measurement (e.g. Reference Said, Afzal and TurnerSaid et al., 2015; Reference Hanaoka, Shigeoka and WatanabeHanaoka et al., 2018; Reference van den Berg, Fort and Burgervan den Berg et al., 2009). Although papers such as Reference Kim and LeeKim and Lee (2014) intentionally investigate long-past events to study lasting effects of conflict, the time lapse should be taken into account as a mediating factor. It is only in rare “fortuitous” studies such as Reference Beine, Charness, Dupuy and JoxheBeine et al. (2020), who happened to be conducting unrelated risk-relevant research in Albania when two major earthquakes hit, that valid comparisons of the same population can be made. And yet this factor also fails to significantly clarify the overall results. For instance, Reference Page, Savage and TorglerPage et al. (2014) report losses one month after a flood, finding that they suppress risk aversion, while Reference Cameron and ShahCameron and Shah (2015) also look at recent experience and find the inverse.
2.4 Locus of control
A person’s locus of control describes whether they feel that events in their lives are determined more “internally,” in the sense of being self-directed and subject to intentional influence, or “externally”, in the sense of driven by forces that do not respond to individual wishes, such as fate, chance, and the effect of other powerful forces in the environment. It is one of three dimensions in the Attributional Style questionnaire (Reference Peterson, Semmel, Von Baeyer, Abramson, Metalsky and SeligmanPeterson et al., 1982).
Many previous studies (e.g., Reference Gore and RotterGore and Rotter, 1963; Reference HigbeeHigbee, 1972; Reference Cohen, Sheposh and HillixCohen et al., 1979; Reference AhmedAhmed, 1985; Reference Terry, Galligan and ConwayTerry et al., 1993; Reference Salminen and KlenSalminen and Klen, 1994; Reference You, Ji and HanYou et al., 2013) investigate the effect of locus of control on strategies for coping with uncertainty. As Reference ElkindElkind (2008) puts it: “Those persons who believe that they are able to prevent injury or health problems think differently about risk and intend to behave differently than persons who believe that the potential for injury is out of their control” (p. 16). And indeed, this literature has already touched upon the subjects of natural disasters (Reference Scott, Carper, Middleton, White, Renk and Grills-TaquechelScott et al., 2010; Reference López-Vásquez and MarvánLópez-Vásquez and Marván, 2012) and COVID-19 (Reference Diotaiuti, Valente, Mancone, Falese, Bellizzi, Anastasi and AndradeDiotaiuti et al., 2021), finding generally that internal-locus individuals take more active coping strategies involving less denial and avoidance, and “can better deal with emergency situations because they feel they are an active part in the management of the situation” (Reference Diotaiuti, Valente, Mancone, Falese, Bellizzi, Anastasi and AndradeDiotaiuti et al. 2021, p. 15).
The mediating effect of locus of control to the COVID-19 pandemic is, however, ambiguous and an interesting empirical question. On the one hand, particularly in light of the link to attributional style, an individual with an internal locus can experience self-blame when faced with a difficult context, which an external locus would diminish (Reference Miller and MulliganMiller and Mulligan, 2002). To this extent, we would expect objectively uncontrollable risks to be psychologically harder – and hence have greater effects – on those with an internal locus. On the other hand, wholly uncontrollable risks may be rare. To the extent that such events present a variety of risks of various degrees of controllability, those that appear to be controllable will have less impact on individuals with more internal loci of control, and so the overall level of perceived risk might be lower for internals than externals. In addition, even if the risks themselves are not controllable, those with a disposition to feel that they have power over their outcomes (i.e., with internal loci) seem likely better equipped to maintain a positive disposition, in that they believe they can avoid getting sick.
3 Methodology
3.1 Experimental protocol
Our questionnaire had five main sections. The first four were incentivized, using standard tools to measure (1) time preference and present bias; (2) risk aversion; (3) ambiguity aversion; and (4) prudence.Footnote 3 The last section included non-incentivized questions on risk attitudes, patience, locus of control, demographics and experience in the COVID-19 pandemic.
The incentive scheme was constrained to match the baseline incentives used in the BRISKEE project, as those data were used as our pre-pandemic reference point; see Reference Schleich, Gassmann, Meissner and FaureSchleich et al. (2019) for more details of the original design. The value of each incentivized choice was between €0 and €222. Subjects were told that they had a one in 100 chance of being selected to have one of their choices paid, in addition to a fixed, €3 participation fee. In the end, 5 out of 595 subjects were randomly drawn for payment, winning a total of €165. Subjects received payment through Lydia, an electronic payment service using a cellular phone number.
All incentivized questions were presented in a fixed sequence using the Multiple Price List (MPL) format. That is, subjects saw a table where each row was an independent choice, and the columns indicated options for that choice. In general, one column was constant across all choices, while the other was monotonically increasing or decreasing in value. For example, in the first list, MPL1, the fixed option was “Receive 100€ in 6 months” and the variable option went from “Receive 98€ today” to “Receive 55€ today” in steps of increasing size (98, 94, 90, 86, 80, 70, 55), shown in 7 rows of the table. Values were calibrated so that at one end, the variable option was likely to be more attractive than the constant, while at the other end it was likely to appear worse. This feature of the MPL was highlighted to subjects in order to minimize confusion from the design, and any attendant noise in the results (see instructions in Appendix A.4). In principle, rational respondents should have unique switching points in any MPL, which reveal preferences to within some interval. Table 1 shows the MPLs used for reference in the results section below.
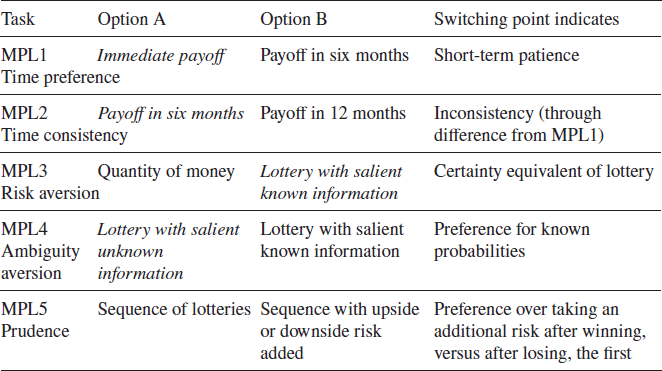
Note: MPL1 and MPL2 had fixed quantities of money at different points in time. Lotteries with salient known information were binary chances to win one of two positive amounts, framed as draws of marbles from an urn of known composition; the lottery with salient unknown information was framed as betting on the color of marbles in an urn containing just one unknown color. Upside and downside risk were framed as pairs of coin flips, with a second introduced after a win or a loss on the first, respectively.
3.2 Sociodemographic and psychometric variables
In addition to sociodemographic questions such as age, gender, field of study, city of current residence, and country of origin, we collected several non-incentivized psychometric controls. First, we include a series of attitude questions.Footnote 4 To control for subjects’ level of patience, we included WTWait, which is calculated as the z-score of their response to the following item (Reference Dohmen, Falk, Huffman and SundeDohmen et al., 2010): “How willing are you to give up something that is beneficial for you today in order to benefit more from that in the future?” Response categories ranged from 1 (= “not at all willing”) to 5 (= “very willing”). To control for individual risk attitude, we included WTRisk, the following item (Reference Dohmen, Falk, Huffman and SundeDohmen et al., 2010): “In general, how willing are you to take risks?” Response categories ranged from 1 (= “not at all willing”) to 5 (= “very willing”). Individual impulsiveness was measured with the following six items of the Barratt impulsiveness scale (BIS-11, Reference Patton, Stanford and BarrattPatton et al., 1995): “I plan tasks carefully”; “I am self-controlled”; “I am a careful thinker”; “I save regularly”; “I like to think about complex problems”; “I am more interested in the present than the future” (reversed order). Subjects were asked to rate these items on a scale from 1 (= “almost never”) to 5 (= “almost always”). To construct BIS-11, we calculated the z-score of the sum of the individual ratings for these six items. These variables were also collected in the Pre-COVID study.
We also included a 13-item measure (not in the Pre-COVID-19) of locus of control (Reference RotterRotter, 1966). The measure we used is a shortened version of the original Reference RotterRotter (1966) forced choice instrument. The shorter version was first validated by Reference Greenberger, Strasser, Cummings and DunhamGreenberger et al. (1989), and has also been used by Reference Howell and AvolioHowell and Avolio (1993). Each item has two possible answers, one consistent with an internal locus and the other with an external. The measure is equal simply to the count of “external” answers, giving a scale from 0 (wholly internal) to 13 (wholly external).
Last, the survey included several optional questions about the subject’s direct experience with COVID-19. Subjects were invited to complete five items: “How would you rate the likelihood of you being infected by COVID-19?” (Likert scale, 1 = “not at all” to 5 = “certainly”); “How would you rate the current world health situation?” (1 = “not at all frightening” to 5 = “very frightening”); “Are you currently in quarantine?” (Yes/No); “Have you been infected by COVID-19?” (Yes/No) “Is someone close to you infected by COVID-19?” (Yes/No). Finally, we controlled for the subjects’ perception of normality. Subjects completed the question “Please evaluate your current situation with regards to the following activities, as compared to before the COVID-19 crisis” (1 = “worse than normal”; 3 = “back to normal”; 5 = “better than normal”) for the following items: Relationship with your family, Relationship with your friends, Recreation (parties, dinners, …), Revenue (salary, allowance, …), Spending (shopping, bills, …), Work (job, studies, …).
This finished the questionnaire. Subjects were then informed that the computer had randomly generated a number between 1 and 100, and were asked to also choose a number in the same range. If the numbers were the same, the computer would then select one of the incentivized questions randomly, and pay out the amount chosen, subject to the rules of the selected question.
4 Data and results
4.1 Pre-COVID-19 survey
Our basic design uses the data from the BRISKEE project (Reference Schleich, Gassmann, Meissner and FaureSchleich et al., 2019) as a baseline for the different risk and uncertainty attitudes we measure. This original dataset, collected by Ipsos GmbH between July and August, 2016, included more than 15,000 subjects selected from major European countries using quota sampling to be demographically representative of each country. Because of the limited demographics of the new data target population, we kept only a subsample of the original BRISKEE data: the 128 French students between 18 and 25 years of age (hereafter Pre-COVID-19).Footnote 5 We note that in the original design, subjects were randomly allocated to either the prudence or the ambiguity task (all completed the time and risk preferences tasks), while in the later waves described next, each subject completed all tasks.
4.2 Waves during and after the pandemic
The available window to gather new data was more limited; lockdown in France (from 17/03/2020 to 11/05/2020) ruled out lab experiments, as did time and budget constraints for a full replication of the original study. Instead, we adapted the Reference Schleich, Gassmann, Meissner and FaureSchleich et al. (2019) design to a Qualtrics questionnaire, using the same incentive-compatible tasks and payment levels. The experiment was distributed online to students at the Burgundy School of Business. We collected a total of 595 student responses in 3 different waves: one during Lockdown (01/05/2020), one just Post-Lockdown (17/05/2020 to 18/05/2020) and one 4 months Later (11/09/2020 to 17/09/2020).Footnote 6 In all, 217 subjects took part in the first wave, 189 in the second and 189 in the third. Our selection of subjects allows students to participate freely to the experiment, and could therefore participate to multiple waves. Amongst the 595 students in Lockdown, Post-Lockdown and Later waves 107 were double participation and 51 were triple participation. We checked for any self-selection bias by simply running again our estimations on the subsample of subjects who participated multiple times. The results are reported in Appendix Table 10. As the results were similar, we use all subjects for the remaining of our estimations.
Summary statistics from our different waves of questionnaire are presented in Table 2. This indicates the age, gender, an aggregate measure of behavior for each preference measure, and the average score obtained on the Locus of Control across our experimental waves. Our subjects are young students, with a slight majority of women. Overall, the average gender and age characteristics of our samples are similar across the different time periods.Footnote 7 In the following section, we use t-tests on the patterns of choice to further investigate the effect on preferences of the COVID-19 crisis. For a robust joint maximum likelihood estimation see Appendix A.2. and A.3.
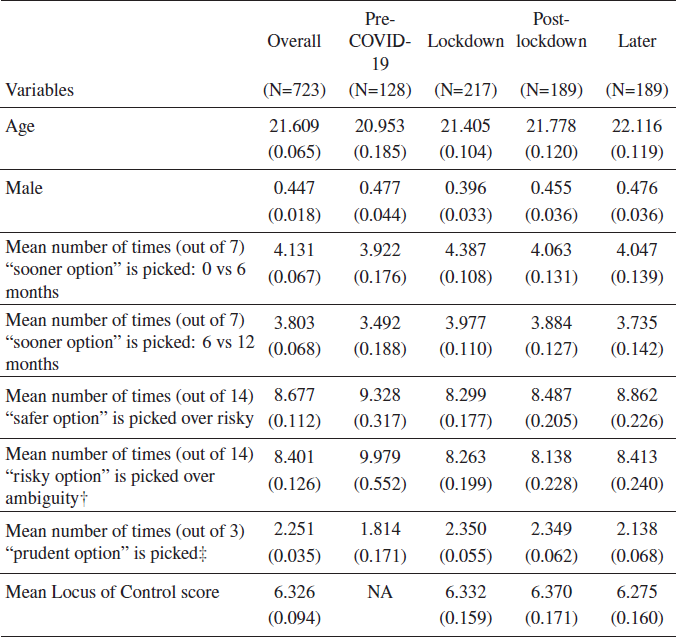
Notes: Standard errors are reported in parentheses.
† In the Pre-COVID-19 sample only 49 subjects were randomly assigned to the ambiguity task.
‡ In the Pre-COVID-19 sample only 43 subjects were randomly assigned to the prudence task.
4.3 Means differences tests
In this section we consider the mean of the numbers of times the left-hand column on the MPL table was chosen, called Option A. This was always the “sooner” option in MPL1 and MPL2, the “safer” option in MPL3, the “less ambiguous” option in MPL4 and the “more prudent” option in MPL5. To infer, for instance, changes in time preferences due to the pandemic, we compare means for MPL1 and MPL2 using standard Student’s t-test across waves. Similar comparisons for the risk, ambiguity, and prudence measures are constructed from their respective indexes. Time inconsistency is measured by the difference between the two “sooner” indexes, as one referred to values immediately or in six months, while the other compared six months to one year. Table 3 reports pairwise average differences and p-values for the set of experimental waves, including Pre-COVID 19, Lockdown, Post-lockdown, and Later.
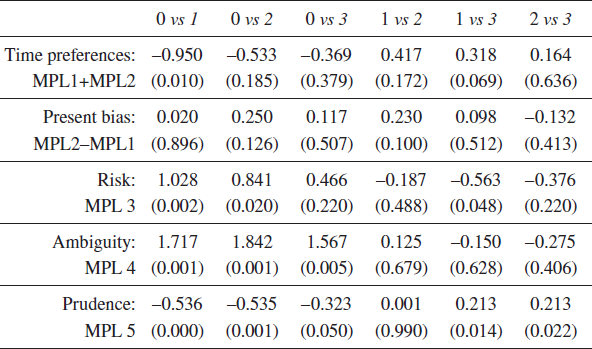
The table shows the differences of the means and the p-values of the differences in brackets. Waves are coded as 0=Pre-COVID 19, 1=Lockdown, 2=Post-Lockdown and 3=Later.
Time preferences:
Subjects were significantly more impatient during Lockdown than Pre-COVID 19 , and slightly (at 10% level) more impatient during the Lockdown than Later. There is no significant difference between Pre-COVID 19 and Post-Lockdown or Later. Overall, these results suggest a slight surge of the level of impatience level during the lockdown that slowly disappears.
Present bias:
We do not observe any significant differences in the level of present bias across waves: present bias appears to be a stable trait on average.
Risk aversion:
We observe that subjects were less risk averse during Lockdown or Post-Lockdown compared to Pre-COVID 19. Then we observe a decrease in risk aversion during the Lockdown compared to Later. Overall, subjects became less risk averse during the Lockdown, but this effect attenuated over time.
Ambiguity aversion:
Tests show significant differences between Pre-COVID 19 and Lockdown or Post-Lockdown or Later. Overall, these results suggest that subjects became more ambiguity tolerant during the Lockdown, and that this effect has not vanished yet.
Prudence:
Tests show significant differences between Pre-COVID 19 and Lockdown or Post-Lockdown or Later. Also we observe a significant differences between Lockdown and Later; and between Post-Lockdown and Later. Overall, these results suggest that subjects became more prudent during the Lockdown and Post-Lockdown and the effect has not yet completely attenuated.
In summary, we observe an effect of the Lockdown period on our subjects’ preferences, but one which diminishes over time. However, several limitations should be addressed. The estimation method of counting the number of times Option A is selected offers the advantage of model independence, but by the same token is sub-optimal for many common models. For example, to the extent that the preferences we seek to describe can be modeled as curvature of the utility function, this is not taken into account in the time-discounting tasks MPL1 and MPL2. Similarly, risk aversion may also play into the choice between risky and ambiguous options in MPL4 and prudent and imprudent ones in MPL5, and we do not incorporate the information we get from MPL3 in that comparison. The method of testing time inconsistency (through the difference between the “sooner” indexes), while it remains close to the data, is also relatively crude. To address all these limitations, we propose a structural utility model in Appendix A.2. and a joint maximum-likelihood estimation in A.3. Within this appendix we also further investigate on the role played by Locus of Control, by running the estimation on two sub-samples: subjects the highest 25% and the lowest 25% scores. Overall the more refined estimation method highlights a similar story than the one described above. We also find that these results seems to be mainly driven by subjects with the highest score of locus control. Finally, we address a plausible self-selection bias in Appendix A.4.
4.4 Additional results
In this section we further investigate the effect of the pandemic on our subjects. We first consider different attitude scales, then the perception of normality of our subjects and the impact of the social distance to the disease on preferences.
4.4.1 Attitude scales
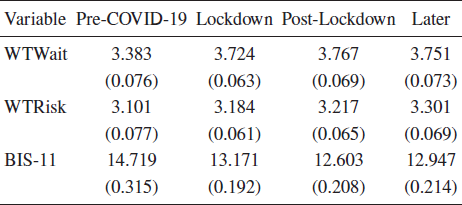
In this subsection we present the responses for the following scales: WTWait, WTRisk, BIS-11. As a reminder, WTWait measures the level of patience, WTRisk the willingness to take risks and BIS-11, impulsiveness.
In Table 4, there are no significant differences in average for the attitudinal variables across the time periods: the previous differences in terms of risk and time preferences are not perceptible here. We interpret these results as evidence that our results are not driven by selection of different kinds of subjects in the different waves of our questionnaire. Basic risk, patience and impulsiveness attitudes do not change over time, while behavior does. This is indirect, corroborating evidence that the changes we find indicate the response of behavioral preferences we sought to identify.
4.4.2 Distance to COVID-19 and normality assessment
Our results suggest that the initial effect of the lockdown measures attenuates over time. The next logical step would have been to control whether the subjects’ preferences were impacted by direct experience of contracting the disease, either themselves or someone close; however, the estimations are impossible to run because at the time of the survey not enough subjects reported being in this case (<1%). In this section, we look for possible explanations behind the shift back towards the Pre-COVID-19 level. Specifically, we consider the well-known indeterminacy in choice under uncertainty between preferences and beliefs. We can ask, in other words, whether the attenuation of the observed effect is due to a reduction in the emotional effect of the pandemic (a “behavioral preference” based effect), or whether might it be due to some form of growing denial or underestimation of the impact of COVID-19, an effect due to (possibly motivated) beliefs. This is also related to the three potential channels for the effect of traumatic events that were raised by Reference Cassar, Healy and Von KesslerCassar et al. (2017), regarding income shocks, beliefs about future events, and the emotional response. Our basic interpretation of the results works mainly through the third of these, but if subjects’ beliefs change about the risks over time, then this interpretation may not be valid.
To investigate this, we consider the responses to the following questions: “Likelihood infection”: How would you rate the likelihood of you being infected by COVID-19? (1 = “not at all”, 5 = “certainly”), “Current situation”: How would you rate the current world health situation? (1 = “not at all frightening”, 5 = “very frightening”), “Infection yourself”: Have you been infected by COVID-19? (Yes/No), “Infection other”: Is someone close to you infected by COVID-19? (Yes/No). A reduction in the first or improvement in the others would constitute another explanation for our results and undermine our interpretation that the effect was due to the effect of the pandemic on behavioral preferences. We report average score on these questions across time periods in Table 5.
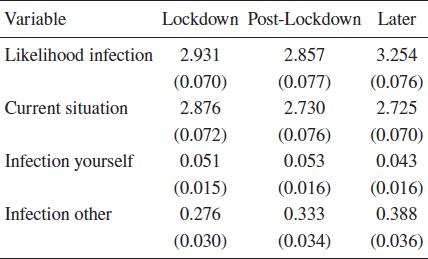
Table 5 shows that on average subjects state (a) that they are more likely to be infected by COVID-19 (Mann-Whitney test: Lockdown vs Later, p<0.001; Post- Lockdown vs Later, p<0.001); (b) that the world health situation remains as frightening during each period; (c) that they believe there are similar level of actual infection; and (d) that they have more close relationships with infected people as time passes (Mann-Whitney test: Lockdown vs Later, p=0.017). Denial, or more generally a change in beliefs, therefore does not appear to be a confound for our results, as subjects clearly perceived the increasing likelihood of being infected, the objective impact on their close ones, and they remain as worried about the world health situation.
To further investigate this point, we report the score of our “back to normality” assessment. Subjects were asked to evaluate their “current situation with regards to the following activities, as compared to before the COVID-19 crisis:” (1=worse than normal; 3=back to normal; 5=better than normal). The same evaluation was performed for six domains: Relationship with your family, Relationship with your friends, Recreation (parties, dinners, …), Revenue (salary, allowance, …), Spending (shopping, bills, …), Work (job, studies, …). Adding the score obtained to each item, we compute an overall score increasing in the evaluation of the situation, with a value of 18 indicating that “on average” the situation was “back to normal”. Scores below (above) 18 are interpreted to mean that overall, the subject was in a worse (better) state than normal. For each component, similar interpretations are with respect to an answer of 3. These questions were not in the Pre-COVID-19 survey, and were in fact only added during the last two waves of measurement Post-Lockdown and Later. Average scores of these items are presented in Table 6.
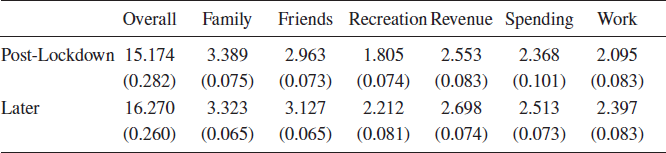
Notes: Average values (standard errors) for questions relating to “return to normality”. Questions not asked in the Pre-COVID-19 or Lockdown waves of the questionnaire. For specific domains, a value of 3 indicates that the situation is “back to normal”; overall scores are summed across the other domains.
In Table 6 we can see further evidence that subjects feel less bad about their situation in the Later than in the Post-Lockdown period, despite the higher objective risks identified earlier, and still with the caveat that things are not generally “back to normal” (Mann-Whitney test of overall score Post-Lockdown vs Later, p < 0.001). To this extent, the results in Table 6 correspond well with the estimations above showing that behavioral preferences are moving back towards their Pre-COVID-19 levels. It is particularly interesting perhaps that the situation for Family, and also that for Friends in the Later period, are on average better than normal. Although this is outside the scope of our study, it has been found (e.g., Dussaillant and Guzman, 2014) that natural disasters can potentially increase social capital through the enhancement of family ties and interaction between affected individuals. Potentially here again we have evidence that “pulling together” can somehow increase social ties during times of adversity.
To sum up, the trends in all items are showing some improvements over time, subjects are going back to a new “normality” in which they learned to live with COVID-19. These results add color and informal justification to our interpretation of the tendencies observed on time preferences, risk and ambiguity aversion which are slowly going back to previous level.
5 Discussion
In this article we jointly measured time preferences, present bias, risk aversion, prudence, and ambiguity aversion during the COVID-19 crisis in France. Our results show that subjects became more impatient, but less risk and ambiguity averse at the heart of the first wave of COVID-19, and that they are slowly going back to pre-COVID levels as time passes. We also show that the observed phenomenon is even stronger for subjects with an external locus of control and might be explained by subjects’ getting used to this new reality.
The COVID-19 crisis was distinctive in the literature on the effect of traumatic experience on so-called behavioral preferences, because at least through the period we study, its effects were omnipresent – completely dominating the media and imposing severe restrictions on normal behavior – but its material consequences, though potentially very serious at an individual level, were arguably less extreme than those of other studies. For instance, the COVID-19-related deaths have been heavily skewed towards the older demographics, while our subjects are exclusively young adults. Further, figures on total daily deaths in France from INSEE, the French national statistics organization, show that even taken overall, while excess deaths in the country ballooned between mid-March and mid-April, averaging 41.9% higher in 2020 than in 2019 between March 13 and April 16, after April 16 the rates were essentially identical in 2020 to the previous two years. Figure 1 illustrates.
Daily death rates in France, 01/03/2020 – 31/07/2020. Source: INSEE.
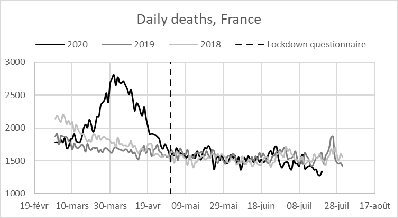
Therefore, while the toll is high for COVID-19, by the time our post-COVID questionnaires began the death rates had fallen to normal levels. The ongoing stress was real, but the cause was in large part due to uncertainty. The effect on behavioral preferences likely tied more to emotional, psychological reactions than to the points raised by Reference Cassar, Healy and Von KesslerCassar et al. (2017) concerning income shocks or changes in the perception of future risks. While this may appear to weaken the generalizations we can make, we feel that it also opens interesting insights, suggesting potential mechanisms for the differences between our results and those in the previous literature. For instance, recall that our results on impatience are in line with the majority of the previous literature on generalized traumatic events, while those on risk and ambiguity aversion are less common. The suggestion would be that COVID-19 is different in the specific aspect of such experiences that causes increased risk and ambiguity aversion. For instance, tied to current, and beliefs about future, income shocks perhaps. This would tell us something new not only about COVID-19, but also shed light on the conflicting previous evidence. We note that such a result would be in line with the predictions of risk vulnerability (Reference Beaud and WillingerBeaud and Willinger, 2015).
Naturally, our study also has many limitations. First, we state the difficulty of interpreting our results as preference change, properly speaking. The Stigler-Becker-style gustibus is very resistant to falsification; to the extent that behavioral changes can be explained, they do more to reinforce the model than threaten it. Our interpretation of the results turns more on emotional responses to the events, although we do not attempt to describe the specific emotional mechanisms driving the result, for instance, the relative importance of fear, anger and frustration in the effect. Emotions are transitory by nature, and therefore unstable in a sense. We suspect that “stable preferences” in the Reference Stigler and BeckerStigler and Becker (1977) sense would imply only a stable relationship between emotion and behavior: if the same emotion reliably elicits the same behavior, then preferences are stable. Our data do not allow us to address this. A related limitation lies in the fact that we do not consider the impact of the further waves of contamination that might come. This avenue, which might go some distance to address the stability question, is left open for future research for obvious reasons.
We also acknowledge certain potential limitations related to our sample. Like much of the existing literature, our Pre-COVID-19 treatment is what we called “between populations”, consisting of previous data on a comparable population (French youth between 18 and 25 years old). There might exist differences between this sample and our sample of students from a business school, although we underline again that (1) no significant differences appeared when considering age and gender (cf. Table 2); (2) the results were robust to excluding non-students from the Pre-COVID-19 wave, and so not driven by the “most different” elements of the two groups; and (3) our “within population” later waves provide evidence of the attenuation component of our “shock and attenuation” effect, which corroborates our interpretation of the “shock” as causal. Finally, regarding the restricted demographic profile, as we mentioned, our young, educated and arguably relatively wealthy business student sample should if anything be more insulated than the average person from the economic and emotional uncertainty of the crisis. As an addition, Reference Meissner, Gassmann, Faure and SchleichMeissner et al. (2022) found in their literature review that younger subjects were different in several ways from others. Specifically, they were less risk averse, slightly less patient, and more present biased. As a result, the changes we observe could be different depending on the population considered. Our results could well be conservative and even more salient with a more general population.
Our results have several implications in terms of public policies concerning emergency measures for managing the health crisis. Central to our message throughout the paper is that the effects we observe represent emotional responses to the uncertainty of the situation. One might say, we study the “panic in pandemics”. We find, moreover, that this effect is non-negligible, and not particularly positive. Overall, our results on more impatient, less risk- and ambiguity-averse subjects could be described as a decrease in responsible behavior. This combines usefully with a study on the framing of public information alluded to in the introduction (Reference Aslam, Awan and SyedAslam et al., 2020), which found that positive messages about COVID-19 result in larger behavioral shifts than negative ones. Our study suggests that this is not an artefact of the lab, but that such “infodemic” effects are widespread in the population. This therefore has strong implications in terms of how public authorities should design messaging about the disease. First, fear and uncertainty may have wider unwanted social effects, and therefore a positive message is key. Second, the results on locus of control indicate that an internal locus reduces the behavioral effects of the crisis. Faced with a seemingly uncontrollable world, people can respond by even further abdicating their efforts to control it. This suggests that messaging that highlights ways in which people can take control of their own outcomes, by “nudging” an internal locus, may at the same time reduce stress and attenuate the attendant behavioral effects of the crisis.


 Open access