


1. Introduction
The post-World War II era saw a religious revival in various regions around the globe (Scheve et al., Reference Scheve and Stasavage2006; De La O and Rodden, Reference De La and Rodden2008; Grzymala-Busse, Reference Grzymala-Busse2015). Contrary to predictions that economic development and poverty reduction would gradually lead to low levels of religious attachment (Weber, Reference Weber2002; Troeltsch, Reference Troeltsch2017), secularization remains far from a dominant trend across societies (Ranger, Reference Ranger2008; Schewel, Reference Schewel, Schewel and Wilson2019; Huber and Mohamed, Reference Huber and Mohamed2021; Pulejo, Reference Pulejo2023).
Religious revival spans various faith traditions, including Christianity, Islam, Hinduism, and Buddhism (Hefner, Reference Hefner1998; Pollack and Rosta, Reference Pollack and Rosta2017), and is often marked by charismatic leaders who attract large followings through dynamic preaching, a focus on personal transformation, and promises of salvation or enlightenment (Stolz and Novak, Reference Stolz and Novak2023). Reflecting the diversity of global religious landscapes, different regions of the world have witnessed the revival of distinct religions. The rapid growth of Christian evangelicals in Africa and Latin America (Lehmann, Reference Lehmann1992; Freston, Reference Freston2004; Eriksen et al., Reference Eriksen, Blanes and MacCarthy2019; Kirkpatrick, Reference Kirkpatrick2019) contrasts with the swift expansion of Islamism in Southeast Asia (Case, Reference Case2013) and Eastern Europe (Ramadan, Reference Ramadan2012).
This paper focuses on the evangelical boom—the significant growth and influence of evangelical Christianity—and its implications for electoral politics. The proliferation of information and communication technologies facilitated the exchange of ideas and religious materials, enabling evangelical movements to reach a global audience (Wuthnow and Offutt, Reference Wuthnow and Offutt2008). Simultaneously, missionary efforts funded by the United States (US) and European nations played a pivotal role in the worldwide expansion of evangelicalism (Martin, Reference Martin1999; Nunn, Reference Nunn2010; Stanley, Reference Stanley2013). The rise of televangelism and the use of media platforms, such as radio and television, further allowed evangelical preachers to reach vast audiences, both domestically and internationally (Schultze, Reference Schultze2003; Bruce, Reference Bruce2019). This media exposure accelerated the spread of evangelical churches and heightened public awareness of the movement across the globe (Ranger, Reference Ranger2008; Bekkering, Reference Bekkering2011; Thomas and Lee, Reference Thomas and Lee2012). Christian evangelicals now make up a significant share (and in some cases, the majority) of the population in various democracies worldwide (Bellofatto and Johnson, Reference Bellofatto and Johnson2013; Somma et al., Reference Somma, Bargsted and Valenzuela2017), with Australia, Botswana, Brazil, Costa Rica, El Salvador, Ghana, Latvia, Nigeria, and South Korea standing out as prominent examples.
Efforts to examine the impact of religious cleavages in politics are not new to the literature. Even in highly secularized societies such as those in Western Europe, electoral behavior scholars have long highlighted the critical role of religiously motivated voting (Lipset and Rokkan, Reference Lipset and Rokkan1967). More recent studies confirm that affiliation with Protestantism and other Christian-rooted religions remains a key predictor of voters’ party choices (Van der Brug et al., Reference Van der Brug, Hobolt and De Vreese2009; Tilley, Reference Tilley2015, Reference Tilley2023). In the United States (US), numerous studies indicate that religion and moral conviction have gained importance and predict election outcomes as effectively as self-reported ideology (e.g., Green, Reference Green2007; Skitka and Morgan, Reference Skitka and Morgan2014; Garrett and Bankert, Reference Garrett and Bankert2020).
Significant advancements have also been made in the study of non-Western democracies. For example, cross-country research pointed to increasing levels of political mobilization among Christian evangelicals across Latin America (e.g., Freston, Reference Freston1998, Reference Freston2008; Stoll, Reference Stoll2023) and sub-Saharan Africa (e.g., Ranger, Reference Ranger2008; McClendon and Riedl, Reference McClendon and Riedl2019; Frahm-Arp, Reference Frahm-Arp2021). More recent studies outline the conditions under which this religious group is likely to engage in formal electoral politics (e.g., Boas, Reference Boas2023; Smith and Boas, Reference Smith and Boas2024), to induce partisan shifts and electoral realignment (e.g., Smith and Boas, Reference Smith and Boas2024), and to adopt moral-reasoning strategies to mobilize the “People of God” (e.g., Grossman, Reference Grossman2015; Smith, Reference Smith2019; Ferreira and Fuks, Reference Ferreira and Fuks2021).
While previous work investigates the appeal of evangelical candidates in elections (e.g., Reich and dos Santos, Reference Reich and dos Santos2013; Boas, Reference Boas2014; Netto and Speck, Reference Netto and Speck2017; Rodrigues-Silveira and Cervi, Reference Rodrigues-Silveira and Cervi2019; Ferreira, Reference Ferreira2022), we know far less about the impact of Christian evangelicals on key structural dimensions of electoral politics, such as competition, conservatism, and polarization. In this paper, I remedy this gap in the existing literature by examining a context of religious dominance shift, where Christian evangelicals have evolved from a small minority to a significant portion of the electorate. In Brazil, Christian evangelicals have experienced exponential growth over recent decades. In the early 1960s, population census data recorded only 5% of Christian evangelicals; by 2022, they represented roughly 35% of the Brazilian population. This growth is expected to persist, with evangelicals projected to become the largest religious group by 2040, ending over five centuries of dominance by the Roman Catholic Church in Brazil (Alves et al., Reference Alves, Cavenaghi, Barros and Carvalho2017).
The potential political implications of this religious shift have not gone unnoticed. For instance, the rise of the extreme right in Brazil has been attributed to the growing conservatism of evangelicals. Indeed, prior studies link Jair Bolsonaro’s 2018 victory to his substantial electoral support among evangelicals (e.g., Amaral, Reference Amaral2020; Rennó, Reference Rennó2020; Ferreira and Fuks, Reference Ferreira and Fuks2021; Layton et al., Reference Layton, Smith, Moseley and Cohen2021). Yet, somewhat surprisingly, there is little robust evidence connecting evangelicals to structural transformations in politics.Footnote 1 Does the growth of religious minorities, such as the evangelical boom in Brazil, transform electoral politics? To explore this question, I combine novel, granular data on the expansion of evangelical churches across municipalities (Araújo, Reference Araújo2023) with indicators of participation, competition, polarization, and conservatism in Brazilian elections held between 1994 and 2018 (Power and Rodrigues-Silveira, Reference Power and Rodrigues-Silveira2019).
To account for time-invariant factors that could drive changes in political behavior across municipalities, I use regression models with unit and year-fixed effects to estimate the magnitude and direction of the impact of evangelical churches on electoral politics. This empirical approach incorporates a broad sample of Brazilian municipalities, encompassing both urban and rural areas. While this enhances external validity, it comes at the cost of lower internal validity: since the expansion of evangelicals across Brazil is not exogenous, these regression coefficients cannot be interpreted as causal.
In this paper, I address this common trade-off in studies using observables by leveraging an exogenous and discontinuous increase in evangelical churches prompted by the Luz para Todos (henceforth LPT) program, a large-scale rural electrification initiative launched in Brazil in 2004 and largely uninterrupted since (Araújo et al., Reference Araújo, Arretche and Beramendi2024). As in other parts of the Global South, evangelical churches in Brazil often begin in modest settings such as garages, living rooms, or small rented spaces (Birman and Machado, Reference Birman and Machado2012; da Cunha, Reference da Cunha2021). This grassroots model enables aspiring pastors and religious leaders to establish their ministries with minimal resources and infrastructure (Spyer, Reference Spyer2020). By connecting millions of rural households to the electrical grid, the LPT created favorable conditions for the expansion of evangelical Christianity in Brazil.
As a core rule, a municipality qualified for the LPT if fewer than 85% of its households had access to electricity, based on the 2000 Brazilian census. My identification strategy operates as follows: around the 85% threshold, municipalities are comparable in their observable pretreatment characteristics, but the arrival of electricity triggered a discontinuous increase in the number of evangelical churches in municipalities more likely to receive this intervention, i.e., those below the 85% cutoff. Consequently, posttreatment changes in the electoral outcomes of interest can be attributed to the rise of evangelicals in these targeted municipalities.
Results from fixed-effects models reveal a negative impact of evangelical churches on voter turnout. A one-standard-deviation increase in the number of churches per 100,000 inhabitants corresponds to an average reduction of 1.8 percentage points in turnout. Estimates also provide some evidence of increasing conservatism in municipalities with higher concentrations of evangelical churches, particularly in national and local elections held from 2012 onward. In this case, a one-standard-deviation increase in the number of churches per 100,000 inhabitants shifts the electorate by 0.0331 units to the right on the ideological scale, which corresponds to an average increase of roughly 17% in the level of conservatism. These findings suggest that the expansion of evangelical Christianity is gradually transforming electoral politics, though not across all observed dimensions: I find no consistent evidence that evangelical churches influence competition or polarization levels in Brazilian municipalities.
Fuzzy regression discontinuity (FRD) estimates that leverage the exogenous and discontinuous growth of evangelical Christianity corroborate findings from baseline fixed-effects estimates on the negative impact of the growth of Christian evangelicals on voter turnout. However, they reveal no statistically significant effects of the evangelical boom on levels of competition, conservatism, or polarization. This set of findings is persistent across several robustness and falsification tests.
These novel and robust findings contribute to the growing body of scholarship highlighting the role of expanding religious minorities in politics (e.g., Blair, Reference Blair1973; Madeley, Reference Madeley2000; Freston, Reference Freston2008; Imtiyaz, Reference Imtiyaz2014; Boas, Reference Boas2023; Stoll, Reference Stoll2023), as well as to prior studies (e.g., Brown and Brown, Reference Brown and Brown2003; Weber and Thornton, Reference Weber and Thornton2012; Smith, Reference Smith2019) suggesting minimal influence of evangelical leaders on their followers. My findings urge caution in attributing the rise of Christian evangelicals to increasing levels of polarization across democracies.
2. Christian evangelicals and electoral politics
The rise of evangelicals is anticipated to influence societies in various ways. In this paper, I focus on four structural dimensions considered crucial for the quality of democracy: voter turnout, electoral competition, electoral conservatism, and electoral polarization. Voter turnout and electoral competition are often regarded as core components of democratic legitimacy (Przeworski et al., Reference Przeworski, Stokes and Manin1999; Anderson et al., Reference Anderson, Blais, Bowler, Donovan and Listhaug2005). In contrast, increasing conservatism and polarization could raise concerns about the functioning of representative democracy (Gidron et al., Reference Gidron, Adams and Horne2020; Wagner, Reference Wagner2021).
Focusing on these four aspects of elections does not imply that evangelicals cannot influence other critical political dimensions. Indeed, prior research suggests that the prominence of Christian evangelicals has noticeable effects on public opinion and policymaking (e.g.,Lax and Phillips, Reference Lax and Phillips2009; Scheitle and Hahn, Reference Scheitle and Hahn2011; Grzymala-Busse, Reference Grzymala-Busse2015, Reference Grzymala-Busse2016). However, for the sake of parsimony and empirical tractability, I limit my analysis to aggregate-level dimensions directly related to electoral politics.Footnote 2 This section outlines the rationale for the hypotheses linking the expansion of Evangelical Christianity to changes in the four aforementioned dimensions of electoral politics.
2.1. Voter turnout
Numerous studies document evangelicals’ involvement in political activism, organizing grassroots campaigns, and advocating for specific policies or legislation (Elisha, Reference Elisha2008; Reich and dos Santos, Reference Reich and dos Santos2013; Margolis, Reference Margolis2020). For instance, the “Religious Right” conservative movement in the US has significantly shaped the country’s political landscape since its emergence in the 1970s and remains highly influential in anti-abortion and pro-gun activism (e.g., Knuckey, Reference Knuckey1999; Bernstein and Jakobsen, Reference Bernstein and Jakobsen2010; Whitehead et al., Reference Whitehead, Schnabel and Perry2018). Conversely, evangelical churches operating on the opposite side of the ideological spectrum in the US have also achieved success, playing a pivotal role in recruiting and registering non-white and female voters (Deckman, Reference Deckman2014; Han and Arora, Reference Han and Arora2022).
During Brazil’s transition from an authoritarian regime to democracy (1985–1988), evangelical churches played a pivotal role in securing the approval of a new Magna Carta. In the 1986 constitutional election, millions of Christian evangelicals cast their votes for the first time, responding to a campaign led by evangelical leaders urging their followers to support the “People of God” (Sylvestre, Reference Sylvestre1986). In recent years, mobilization within evangelical churches has contributed to the growing political engagement of low-income women (e.g., Teixeira and Reis, Reference Teixeira and Reis2023).
In Argentina and Uruguay, new grassroots civil society movements have also emerged from Christian evangelical churches (Sotelo and Arocena, Reference Sotelo and Arocena2021). Similarly, the expansion of Evangelical Christianity has introduced previously marginalized populations into electoral politics across sub-Saharan Africa, as evidenced in South Africa (Frahm-Arp, Reference Frahm-Arp2021), Zambia (Sperber and Hern, Reference Sperber and Hern2018), and Nigeria (Burgess, Reference Burgess2014).
Evangelicalism is, of course, not a monolithic movement (Freston, Reference Freston2001, Reference Freston2004, Reference Freston2008), and there are varying degrees of political involvement and diversity of views within evangelical churches (e.g., Gallagher, Reference Gallagher2004; Danielsen, Reference Danielsen2013). Moreover, the extent and nature of political participation among Christian evangelicals can differ across countries and regions (Schwadel, Reference Schwadel2017). Nevertheless, evangelical churches are often characterized as spaces of political mobilization. Based on this reasoning, I hypothesize that:
• H1: As the number of evangelical churches increases, voter turnout increases.
2.2. Electoral competition
The expansion of Evangelical Christianity may influence electoral competition through three key mechanisms: the emergence of new political parties, the coalition-building process, and the growing demand for single-issue political platforms in elections.
In contexts where Christian evangelicals were once a small minority but now form a significant portion of the electorate, new political movements or parties have emerged to represent their interests. The African Christian Democratic Party (ACDP) serves as a notable example. Unlike Western European Christian Democratic parties, which are rooted in Roman Catholic doctrine (Esping-Andersen, Reference Esping-Andersen2017; Gottfried, Reference Gottfried2007), the ACDP was designed to capitalize on the growth of Evangelical Christianity in South Africa (Balcomb, Reference Balcomb2004).
Regardless of the emergence of Christian Democratic parties, contexts of religious dominance shift may lead established political elites to engage in coalition building to secure the support of evangelical voters. This often involves making concessions on certain policy issues or including evangelical candidates on their electoral tickets to appeal to this constituency.Footnote 3 The political party Republicanos in Brazil exemplifies this process. Although not officially a Christian party, its candidates are typically selected by leaders of the Universal do Reino de Deus, one of Brazil’s most prominent evangelical churches (Lehmann, Reference Lehmann2021). In such cases, political parties trade part of their agenda-setting power for churches’ ability to mobilize voters during elections (Cerqueira, Reference Cerqueira2021).
By identifying, training, and supporting potential candidates to run for office, evangelical churches can influence the nature of competition in elections. Leveraging their spiritual authority, pastors or church leaders may publicly endorse candidates from the pulpit or through other channels, such as church newsletters or social media platforms. While acknowledging that a church leader’s endorsement does not guarantee electoral victory (Boas, Reference Boas2014; Smith, Reference Smith2019), facing opposition from growing religious groups in contexts with low levels of secularization can undoubtedly generate animosity and rejection in elections.
The expansion of Evangelical Christianity has also been linked to the increasing prominence of morality politics in democracies. Established political elites rooted in traditional socioeconomic cleavages now face competition from newcomers aligned with religious values, such as opposition to abortion, support for traditional marriage, or advocacy for religious freedom. This rising demand for morality politics and single-issue candidates has been well documented in Latin American (Smith, Reference Smith2019; Smith and Boas, Reference Smith and Boas2024; Boas, Reference Boas2023) and sub-Saharan democracies (Grossman, Reference Grossman2015; McClendon and Riedl, Reference McClendon and Riedl2015). As these outsiders compete for votes in constituencies previously dominated by secular, established political elites, electoral competition may intensify.
• H2: As the number of evangelical churches increases, electoral competition increases.
2.3. Electoral conservatism
Evangelical churches are well known for their active role in advocating their positions on moral and social issues, such as opposition to abortion, support for religious freedom, and concerns about the erosion of traditional values (Hoover et al., Reference Hoover, Martinez, Reimer and Wald2002). As the emphasis on traditional family values aligns with conservative ideologies, Christian evangelicals are generally more inclined toward preserving the status quo (Robinson, Reference Robinson2010).
Evangelical churches have formed alliances with right-wing political parties and conservative movements in many democracies. In the United States, for example, evangelicals have been closely associated with the Republican Party. The support Donald Trump received from evangelical voters in the 2016 and 2020 presidential elections solidified a trend that began in the 1980s. In 2016, approximately 80% of White evangelical Christians voted for Trump, a level of support that remained consistent in 2020. This strong alignment between evangelicals and the Republican Party has its roots in the 1980s, when evangelical political involvement increased significantly, particularly during Ronald Reagan’s presidency (Alberta, Reference Alberta2023). This alliance has continued to shape the political landscape, with evangelical support playing a crucial role in Republican electoral successes.
Across nations, the alignment between Christian evangelicals and conservative movements reflects the popularization of new evangelical theologies developed to counter more progressive views on gender identities, political identities, and multiculturalism (Forster, Reference Forster2019). On this point, Smith and Boas (Reference Smith and Boas2024) argue that where alliances between elites and social movements fostered discussions on sexuality politics, Christian evangelicals responded with heightened conservatism in electoral politics. This “culture war” in Brazil and other parts of Latin America created conditions for electoral realignment, characterized by a tactical partnership between Christian evangelicals and right-wing candidates. In line with this argument, the success of far-right candidate Jair Bolsonaro in Brazilian presidential elections is largely attributed to his strong support among Christian evangelicals (Amaral, Reference Amaral2020; Rennó, Reference Rennó2020; Layton et al., Reference Layton, Smith, Moseley and Cohen2021).Footnote 4
Of course, not all evangelicals identify as conservative or align solely with conservative political ideologies (Alencar, Reference Alencar2020; Spyer, Reference Spyer2020). However, more left-leaning evangelicals tend to constitute a minority within the broader evangelical movement (Gallagher, Reference Gallagher2004). I, therefore, hypothesize that:
• H3: As the number of evangelical churches increases, support for conservative parties increases.
2.4. Electoral polarization
Christian evangelicals often hold views that differ from those of more liberal or progressive segments of society, and these ideological differences can intensify polarization as opposing groups become more entrenched in their positions (Hoover et al., Reference Hoover, Martinez, Reimer and Wald2002). However, whether these ideological differences lead to polarization depends on other critical factors.
For example, evangelicals often use the “culture war” narrative to justify their stance against perceived secularism, moral decline, and liberal values (Smith, Reference Smith2019; Smith and Boas, Reference Smith and Boas2024). When employed, this narrative can reinforce an “us versus them” mentality, further polarizing society by framing the conflict as a battle between believers and non-believers or good and evil in electoral politics (Grossman, Reference Grossman2015).
Evangelical churches also foster a strong sense of social identity and community among their members (Campbell, Reference Campbell2004; Mariano, Reference Mariano2016). This dynamic can create heightened loyalty and solidarity within the group, sometimes at the expense of empathy and understanding toward those outside the evangelical community. In such cases, polarization may arise from an in-group versus out-group identity dynamic (Johnson et al., Reference Johnson, Rowatt and LaBouff2012).
Third, evangelical churches can contribute to polarization through media consumption habits. For instance, members of evangelical churches may rely on the same media outlets, which, in turn, reinforce their beliefs and values, creating echo chambers where opposing viewpoints are marginalized or dismissed (Lee Rogers and Powe, Reference Lee Rogers and Powe2022). This dynamic can exacerbate polarization. These three potential mechanisms point to an increase in electoral polarization. Therefore, I hypothesize that:
• H4: As the number of evangelical churches increases, polarization increases.
I test these four hypotheses using detailed municipal-level data from Brazil, a paradigmatic example of religious dominance shift in recent decades.
3. Methods and data
In this paper, I use two identification strategies to estimate the impact of Christian evangelicals on electoral politics in Brazil. The first employs regression fixed-effects models to assess whether an increase in the number of evangelical churches per 100,000 inhabitants—or the share of Christian evangelicals—correlates with changes in voter turnout, electoral competition, polarization, and conservatism. The second focuses on a smaller sample of municipalities near the threshold used to implement LPT, a large-scale electrification program that connected millions of households and other facilities to the electrical grid in Brazil. Although this approach has arguably lower external validity, the as-if-random discontinuous growth of Christian evangelicals in municipalities targeted by the LPT allows for a causal interpretation of their impact on electoral politics.
3.1. Fixed-effects models
To examine whether Christian evangelicals influence a set of electoral outcomes, I employ regression fixed-effects models to account for unobservable context-specific factors across units and over time. Following recent contributions in the literature (Mummolo and Peterson, Reference Mummolo and Peterson2018; Imai and Kim, Reference Imai and Kim2019), I interpret my estimated coefficients as correlations, without assigning causal meaning. In this analysis, I use a repeated cross-section of municipalities (i) over a period of time (t). The fixed-effects model to be estimated is represented by the general equation:
 \begin{equation}
Y_{it}+\beta _{0}+\beta _{1}X_{1,it}+\beta_{k}X_{k,it}+\beta _{1}X_{1,it}+Y_{n}E_{2}+Y_{n}E_{n}+\delta _{t}T_{2}+\delta _{t}T_{t}+u_{it}
\end{equation}
\begin{equation}
Y_{it}+\beta _{0}+\beta _{1}X_{1,it}+\beta_{k}X_{k,it}+\beta _{1}X_{1,it}+Y_{n}E_{2}+Y_{n}E_{n}+\delta _{t}T_{2}+\delta _{t}T_{t}+u_{it}
\end{equation}where
Yit is the outcome of interest, where i = municipality and t = election-year; $X_{k,it}$ represents a set of municipal-level attributes;
βk is the coefficient for the municipal-level attributes included in the specification;
uit is the error term;
Y 2 is the coefficient for the binary regressors;
T 2 is time as dummy variable (dummy), so I have t − 1 time periods;
δt t is the coefficient for the binary time regressors.
Across specifications, I adjust standard errors by clustering municipal-level variation at the group level, specifically at the state level. This approach is standard in correlational models when there is no explicit intervention (treatment) affecting one or more units in the panel dataset (Cunningham, Reference Cunningham2021).
3.2. FRD design
Aiming to eliminate electricity exclusion in Brazil’s most impoverished areas (Pereira et al., Reference Pereira, Sena, Freitas and Silva2011), the LPT program was officially launched in 2003, during the first year of Luiz Inácio Lula da Silva’s (Workers’ Party, PT) presidency. The Ministry of Mines and Energy coordinated the program, which was implemented by state-level electric power companies and rural electrification cooperatives across Brazilian states. Between 2004 and 2015, the federal government invested over 15 billion reais (approximately 3 billion dollars) to connect more than 3.2 million households and facilities to the existing but underutilized electrical grid (Slough et al., Reference Slough, Urpelainen and Yang2015). Since 2016, the LPT has continued to operate at a slower pace without being discontinued (Araújo et al., Reference Araújo, Arretche and Beramendi2024).
As documented in this paper, the arrival of electricity played a significant role in enabling the establishment and expansion of evangelical churches in areas impacted by the LPT. Unlike the rigid and centralized modus operandi of the Roman Catholic Church, the Christian evangelical landscape operates with significantly less regulation (Cerqueira and Tuñón, Reference Cerqueira, Tuñón, Wagner, Morisi, Thompson and Dalton2019). Starting a church in a garage or small residential space greatly reduces initial costs, making it accessible to individuals or small groups with limited financial resources.Footnote 5
A municipality became eligible for the LPT program if fewer than 85% of its households had access to electricity, based on data from the 2000 Brazilian census. This threshold, largely technical in nature, was proposed by staff at the Brazilian Ministry of Mines and Energy to reflect the national average level of household electricity coverage at the time (Slough et al., Reference Slough, Urpelainen and Yang2015). A second, complementary criterion gave priority to communities with low levels of human development, a higher presence of marginalized ethnic groups (such as indigenous populations), and/or the existence of traditional territories of descendants of enslaved peoples (quilombos). While such communities were generally more likely to fall within municipalities below the 85% threshold, some targeted areas were located in municipalities exceeding this cutoff (Pereira et al., Reference Pereira, Sena, Freitas and Silva2011).
To address this imperfect compliance, I use the percentage of households with access to electricity in 2000 (i.e., the running variable) to predict the number of evangelical churches in municipalities affected by the LPT. In my reduced-form estimates, I rely on these predicted values from the first stage to evaluate the impact of evangelical churches on electoral outcomes. This as-if random treatment assignment serves as an instrument for treatment status, consistent with a typical FRD design (Hahn et al., Reference Hahn, Todd and Van der Klaauw2001).
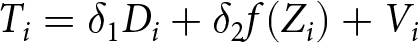
In my framework, an instrumental variable (IV) approach combined with the RD design employs the exogenous assignment as an instrument for the number of evangelical churches. The IV exclusion restrictions are satisfied by design, as the assignment is strongly correlated with the establishment of evangelical churches and uncorrelated with the error term in the outcome equation, given that the assignment was exogenously determined by the LPT cutoff. In the context of a standard regression analysis, the first-stage regression can be expressed as:
 \begin{equation}
T_{i} = \delta_{1} D_{i} + \delta_{2} f(Z_{i}) + V_{i}
\end{equation}
\begin{equation}
T_{i} = \delta_{1} D_{i} + \delta_{2} f(Z_{i}) + V_{i}
\end{equation}and the outcome response is related to the treatment via the equation:
 \begin{equation}
Y_{i} = \beta_{1} \hat{T} + \beta_{2} f (Z_{i}) + \varepsilon_{i}.
\end{equation}
\begin{equation}
Y_{i} = \beta_{1} \hat{T} + \beta_{2} f (Z_{i}) + \varepsilon_{i}.
\end{equation}In this case, β represents the reduced-form estimator of the causal effect of evangelical churches on electoral outcomes. Specifically, this IV strategy estimates the local average treatment effect (LATE), capturing the impact of evangelical churches on the electoral outcomes of interest in municipalities below the 85% cutoff. In this analysis, I employ the standard data-driven procedure developed by Calonico et al. Reference Calonico, Cattaneo and Farrell(2020) to select an optimal bandwidth around this cutoff. As is typical in regression discontinuity designs, this estimated effect is confined to units with forcing variable values near the threshold, i.e., the subpopulation of compliers (Imbens and Lemieux, Reference Imbens and Lemieux2008).
This identification strategy assumes that the LPT was implemented under quasi-experimental rules. Accordingly, the analysis depends on the assumption that the 85% threshold can be treated as exogenous. Although this assumption cannot be tested directly, I explore its plausibility through a range of strategies
First, I test for selection around the 85% threshold. In this context, self-selection is highly unlikely because the primary rule for allocating the program was based on the Brazilian census conducted in 2000. Local politicians (i.e., mayors and council members) could not have anticipated the rules under which the program would be implemented when the LPT began in 2004. Nonetheless, I conduct a manipulation test using a polynomial density estimation to address this concern. Appendix B presents a visual representation of the continuity test approach used by Cattaneo et al. Reference Cattaneo, Jansson and Ma(2018). The test shows the actual density estimate with a shaded 95% confidence interval of the running variable (i.e., the percentage of households with electricity in 2000). The density estimates for targeted and non-targeted municipalities at the cutoff are similar, and the confidence intervals overlap. The value of the statistical test is 1.453, and the associated p-value is 0.146, indicating no evidence of self-selection (manipulation) near the 85% threshold under the continuity-based approach.
Second, I use data from the 2000 Brazilian census to examine pretreatment differences among municipalities near the threshold. As expected, there is no evidence of discontinuity around the 85% threshold prior to the program’s implementation (see Appendix C). On average, there are no statistically significant differences in observables such as fertility rate, human development, inequality, income per capita, and urbanization.
Third, I test for the possibility of partisan-biased targeting. As prior studies indicate, conservative parties were dominant in rural areas of Brazil in the mid-2000s (Mainwaring et al., Reference Mainwaring, Meneguello and Power2000; Alves and Hunter, Reference Alves and Hunter2017). My exogeneity assumption for the 85% threshold would be violated if the Worker’s Party (PT) had used the LPT to undermine its political rivals in the countryside, implying that constituencies controlled by conservative parties were more likely to be targeted. However, regression discontinuity estimates in Appendix C reveal no evidence that municipalities controlled by conservative parties (i.e., PFL, PMDB, and PTB) were disproportionately likely to fall below the 85% threshold. Another common form of partisan-biased targeting involves favoring political allies (Brollo and Nannicini, Reference Brollo and Nannicini2012; Bueno, Reference Bueno2018). In this scenario, the PT might direct the LPT toward municipalities led by PT mayors. Reassuringly, I find no evidence that such constituencies benefited disproportionately from the LPT, as shown in Appendix C.
4. Data
My panel dataset comprises 71,012 municipal-level entries. These observations span the period from 1994 to 2018, covering six local elections (1996, 2000, 2004, 2008, 2012, and 2016) and seven national elections (1994, 1998, 2002, 2006, 2010, 2014, and 2018). For my FRD estimates, the main analysis uses election years from 2004 to 2018, while election years from 1994 to 2002 (i.e., the period before LPT) are employed for the placebo test. Appendix D provides descriptive statistics for all variables used in this study. Below, I outline the set of variables used in the statistical analyses.
4.1. Number of evangelical churches
To measure the salience and assess the growth of Christian evangelicals, I use the dataset compiled by Araújo Reference Araújo(2023), which relies on official data from the Brazilian Fiscal Bureau, the Receita Federal, to calculate the number of evangelical churches across Brazilian municipalities.Footnote 6
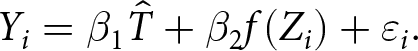
Figure 1 presents the number of evangelical churches from 1960 to 2019, the last year data were collected.Footnote 7 The expansion of evangelicals in Brazil began in the 1970s and accelerated by the late 1980s. Since then, Christian evangelicals have experienced consistent growth, particularly after 2003, when the federal government approved new regulation (Law No. 10.825, 2003) exempting religious institutions from various legal obligations. This change effectively facilitated the establishment of new worship spaces, increasing the number of evangelical churches across states and municipalities (Cerqueira and Tuñón, Reference Cerqueira, Tuñón, Wagner, Morisi, Thompson and Dalton2019). In 1980, Brazil had 7,129 evangelical churches. Approximately four decades later, in 2019, data indicate the existence of nearly 110,000 evangelical churches, marking a 1400% net growth during this period (Araújo, Reference Araújo2023).
Number of registered evangelical churches in Brazil (1960–2019).
To ensure comparability, I follow the author’s approach by weighting these raw data by the population size of existing municipalities in a given year, resulting in the number of evangelical churches per 100,000 inhabitants. This information is available from 1960 to 2019, as shown in Figure 1. For my statistical analysis, I use a reduced time series of this variable spanning 1994 to 2018. This corresponds to the period for which the dataset—compiled and published by Power and Rodrigues-Silveira Reference Power and Rodrigues-Silveira(2019)—with municipal-level indicators of polarization and conservatism is available.
4.2. Estimated share of Christian evangelicals
To estimate the share of Christian evangelicals across municipalities, I used Brazilian census data to calculate the percentage growth of this religious group from 2000 to 2010. I then applied the estimated growth rate for each municipality to approximate the number of Christian evangelicals over time. Specifically, I used these projections to update the absolute and relative numbers (the share) of Christian evangelicals for all Brazilian municipalities for each year from 2000 to 2018. In this process, I assumed a constant and fixed growth rate between election years and that actual growth across municipalities after 2010 would mirror or closely resemble the growth observed between 2000 and 2010. Although this approach likely underestimates the number of Christian evangelicals after 2010,Footnote 8 it should provide a reasonable approximation of the growth observed from 2000 to 2010. Reassuringly, these estimates positively correlate with the number of evangelical churches per 100,000 inhabitants used in my baseline estimates, as reported in Appendix E.
4.3. Voter turnout
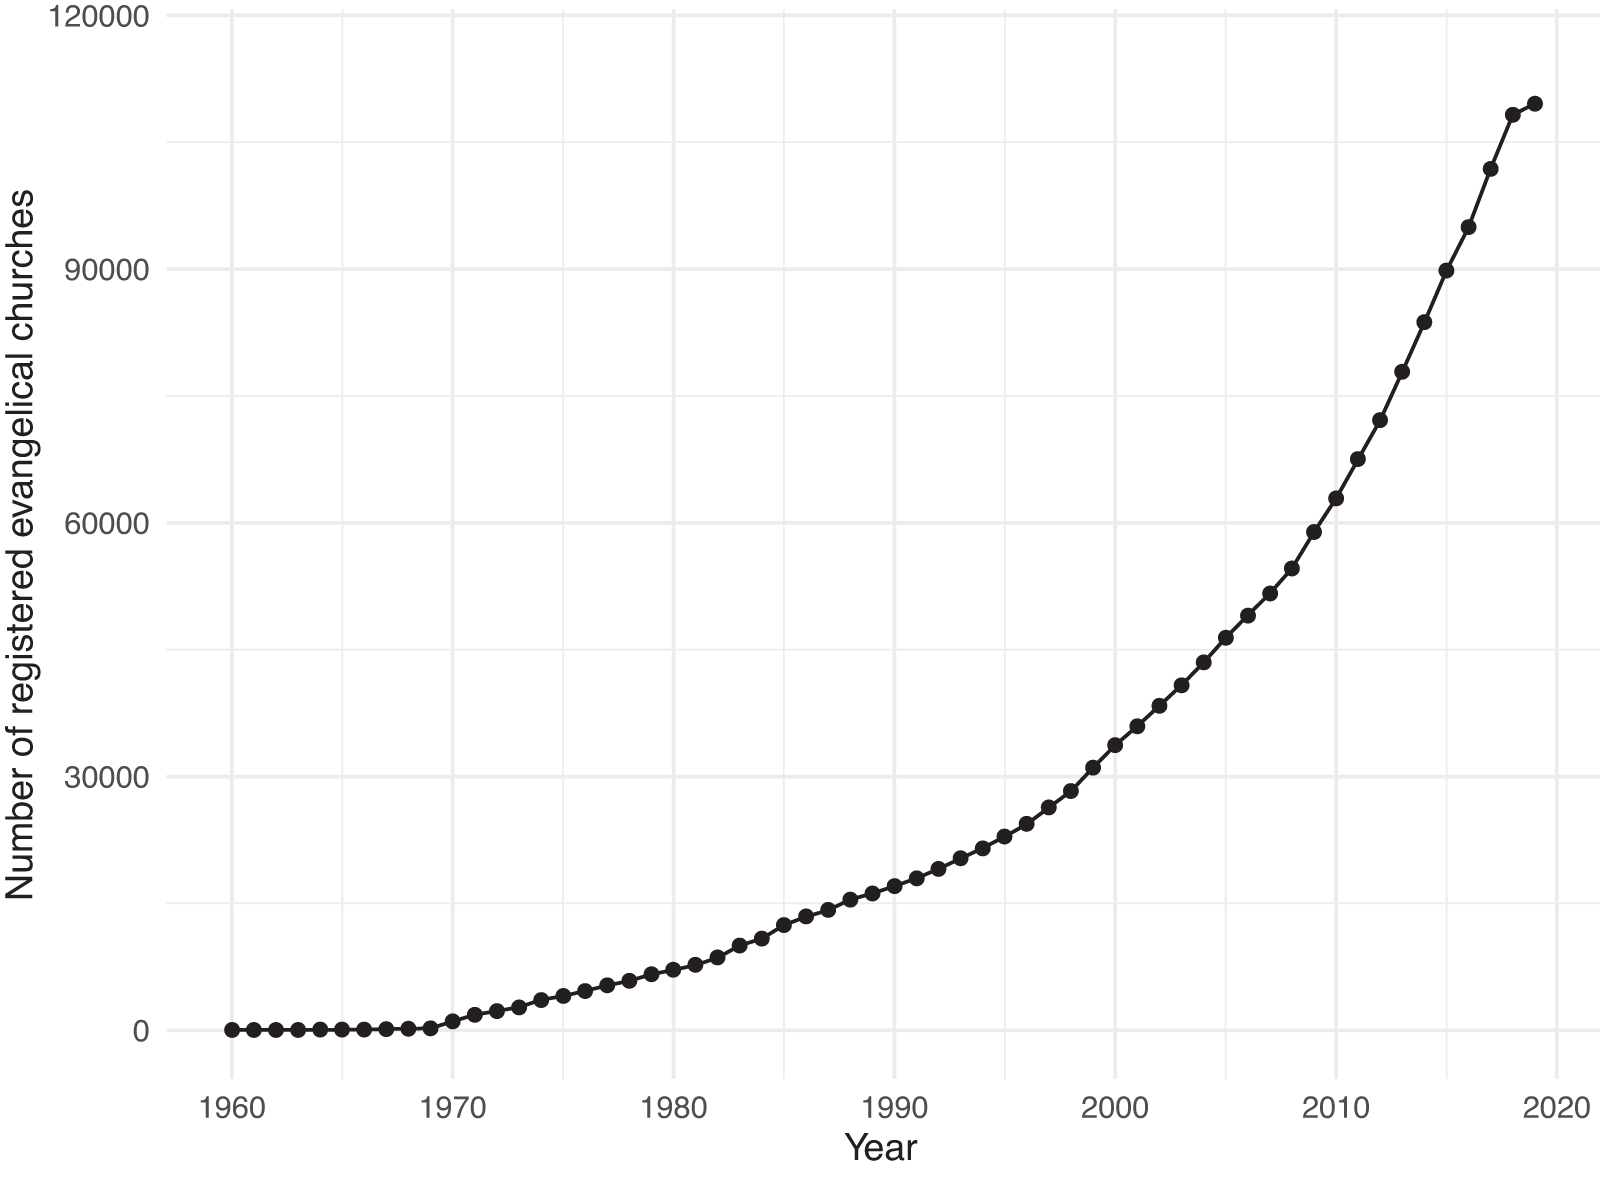
As a proxy for political participation, I use the standard measure of voter turnout, calculated as the ratio of the total number of votes (valid, blank, and null) to the total number of registered voters in each election (Power and Rodrigues-Silveira, Reference Power and Rodrigues-Silveira2019). This measure, derived from data provided by the Brazilian Electoral Court (Tribunal Superior Eleitoral, TSE), ranges from 0 to 1, where 1 indicates the highest level of participation—see Figure 2 (Panel A).
Outcome variables descriptive statistics.
4.4. Electoral competition
To measure electoral competition, I calculate the difference between the vote shares of the two candidates or parties that received the most votes in a given election.Footnote 9 This indicator has been used in prior studies (e.g., Power and Rodrigues-Silveira, Reference Power and Rodrigues-Silveira2019) and ranges from 0 (completely competitive; tied elections) to 1 (not competitive)—see Figure 2 (Panel B).
4.5. Electoral conservatism
To approximate voters’ level of conservatism in elections, I use an index representing the average ideological position of a given constituency, as estimated by Power and Rodrigues-Silveira Reference Power and Rodrigues-Silveira(2019). To compute this measure for each Brazilian municipality, the authors used parties’ left-right ideological scores from the Brazilian Legislative Surveys (BLS), an elite-based study conducted since 1993 with representatives in the Brazilian Congress (Power and Zucco, Reference Power and Zucco2012). The BLS relies on self-reported ideological classifications collected through structured interviews to position political parties on the left-right continuum.
In this proxy for conservatism, the ideological contribution of each party in a given electoral year is calculated as the product of its proportion of votes and its ideological score for that year. Consequently, the greater the proportion of votes a party receives, the stronger its influence on the final indicator. For instance, the score will be high and positive if a right-wing party wins a substantial share of votes. The index ranges from approximately −1 to 1—see Figure 2 (Panel C). Positive values indicate that voters in a given municipality lean ideologically to the right, while negative values reflect stronger support for left-wing parties. By definition, zero represents the ideological center.
4.6. Electoral polarization
I use the measure proposed by Power and Rodrigues-Silveira Reference Power and Rodrigues-Silveira(2019) to assess polarization in multi-party systems. This indicator assumes that party politics is structured along a left-right dimension and captures the variation from the center of the political spectrum for each party competing in elections (Dalton, Reference Dalton2008). As before, parties’ ideological scores are derived from the BLS (Power and Zucco, Reference Power and Zucco2012).
Rather than measuring existing levels of affective polarization,Footnote 10 this index captures ideological divisions in the electorate by analyzing the distribution of votes within a constituency. The final polarization index is 0 (no polarization) when all voted parties occupy the same position on the left-right scale and 10 (extreme polarization) when the voted parties are distributed at opposite ends of the scale (i.e., the highest possible level of electoral polarization)—see Figure 2 (Panel D).
5. Results
In this section, I present and discuss the results from both fixed-effects models and FRD estimates. I also conduct a series of robustness tests to validate these findings.
5.1. Fixed-effects models
To account for time-invariant factors that could drive changes in political behavior at the municipal level, I use ordinary least squares (OLS) models with unit (i.e., municipality) and election-year fixed effects. This empirical approach captures the average impact of changes in the number of evangelical churches on the outcomes of interest, conditional on a set of observables. While this method does not provide a causal interpretation of the regression coefficients, it helps to understand the magnitude and direction of the impact of evangelical churches on electoral politics.
Table 1 presents my preferred estimates, pooling data from national and local elections (refer to the column “All”). This approach benefits from greater statistical power, thereby increasing the likelihood of detecting an effect when one exists. However, some may prefer to examine the estimated impact separately, whether voters are casting ballots for a mayor or local council members (local elections) or for a president or congressional representatives (national elections).
Correlation between the number of evangelical churches per 100,000 inhabitants and a set of electoral outcomes (1994–2018)
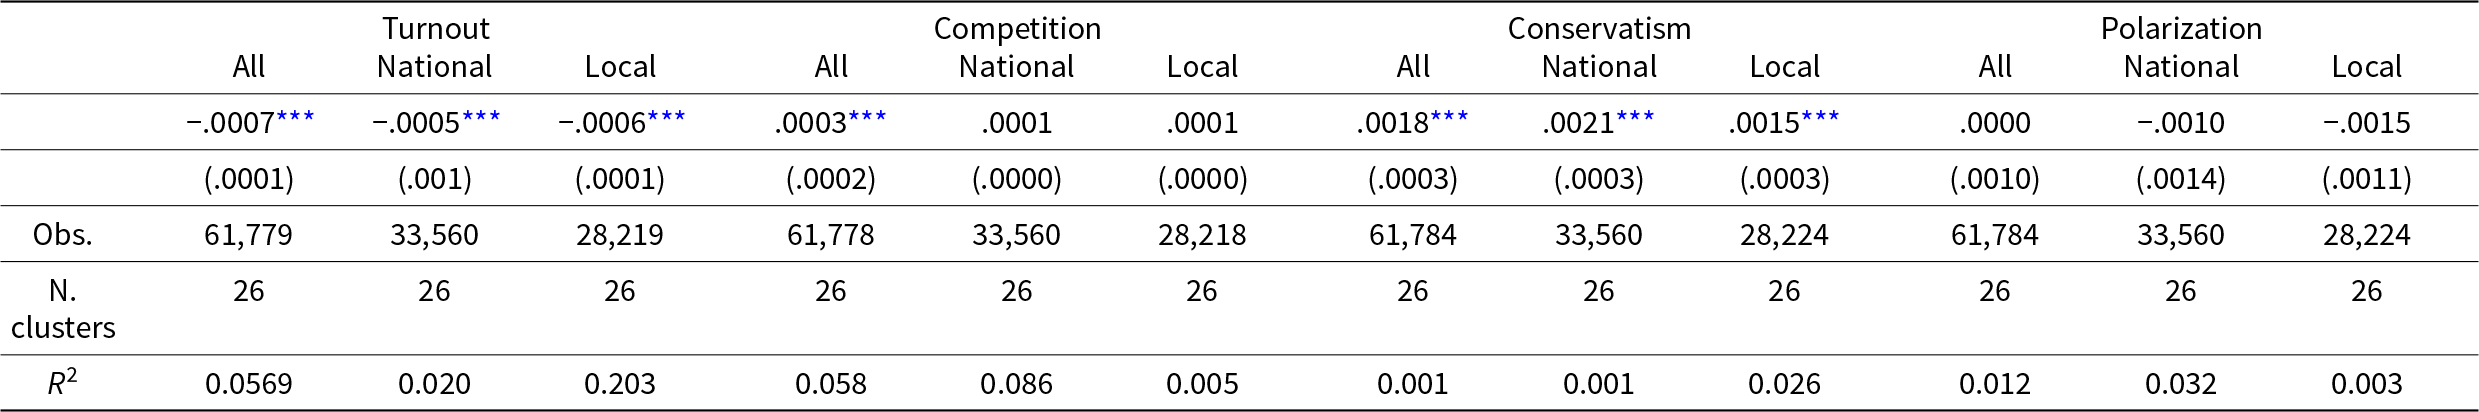
* Notes: p < 0.1, ** p < 0.05, *** p < 0.01.
The unit of analysis is the municipality. Table 1 presents OLS models with district and election-year fixed effects, including the following controls: human development index, log of population size, and log of electorate size. The primary explanatory variable is the number of evangelical churches per 100,000 inhabitants (churches per 100,000). Standard errors are clustered at the state level. The dependent variables are voter turnout (turnout), electoral competition (competition), electoral conservatism (conservatism), and electoral polarization (polarization).
As shown in Table 1, the number of evangelical churches per 100,000 inhabitantsFootnote 11 does not predict changes in electoral polarization levels. There is some evidence that an increase in the number of churches reduces competition, but this effect is not consistent across models. Similarly, a higher number of evangelical churches per 100,000 inhabitants does not appear to encourage greater electoral participation. On the contrary, I found a negative and statistically significant correlation between the number of churches and voter turnout: a one-standard-deviation increase in the number of churches per 100,000 inhabitants corresponds to an average reduction of 1.8 percentage points in turnout. Table 1 also indicates a positive impact of evangelical churches on levels of conservatism. Specifically, a one-standard-deviation increase in the number of churches per 100,000 inhabitants shifts the electorate 0.0331 units to the right on the ideological scale. Using the mean conservatism score in my sample as a reference, this represents an average increase of roughly 17%.
Models accounting for heterogeneity over time largely confirm this pattern. Specifically, I replicate the baseline fixed-effects models—as described in equation (1)—for sub-samples grouped by the following electoral periods: 1994–2000, 2002–2010, and 2012–2018.Footnote 12 Results reported in Appendix G suggest that the documented effects of evangelical churches on turnout and conservatism are primarily driven by voting behavior in more recent elections (2012–2018). While the negative effect on turnout warrants further investigation in future work, the observed impact of evangelicals on conservatismFootnote 13 aligns with prior research suggesting that the rising conservatism in Brazil is a response by Christian evangelicals to the increasing salience of sexuality politics issues in recent years (Smith, Reference Smith2019; Smith and Boas, Reference Smith and Boas2024; Boas, Reference Boas2023).
5.2. FRD design
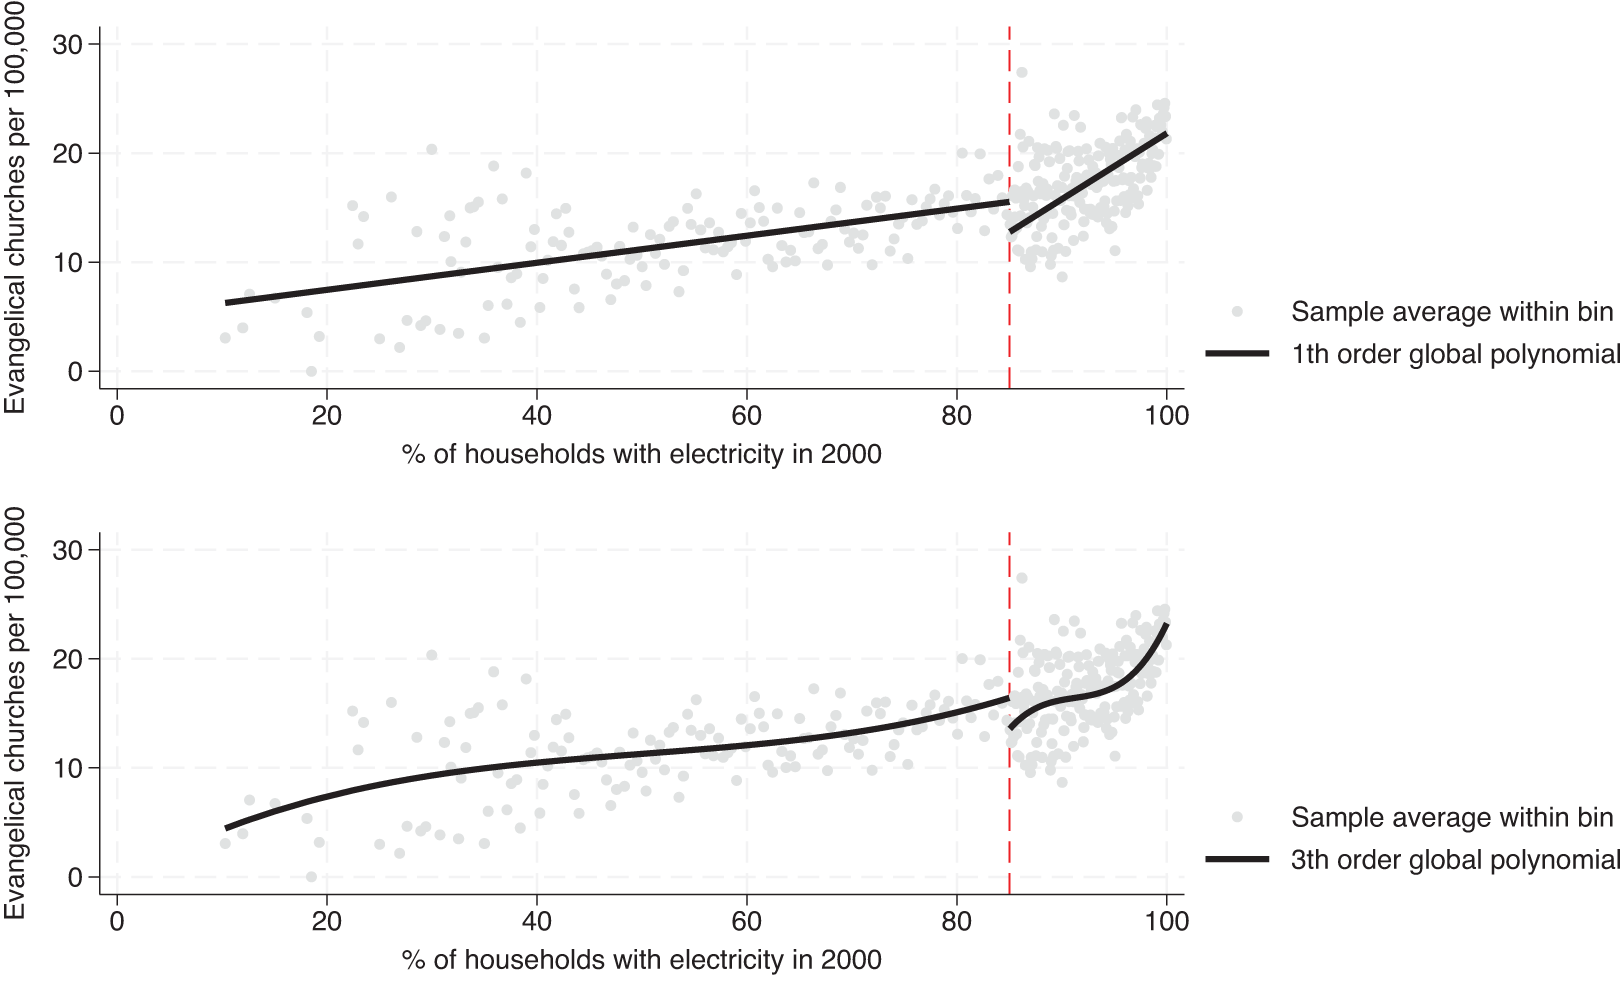
In this section, I examine whether the growth of evangelicals driven by the LPT translated into changes in electoral politics in targeted municipalities. Interpreting regression discontinuity design results is straightforward and can be effectively illustrated graphically, so I begin with the descriptive evidence presented in Figure 3. The figure demonstrates a discontinuous jump in the number of evangelical churches per 100,000 inhabitants at the LPT cutoff. In the posttreatment period (2004–2018), there is a higher concentration of evangelical churches in targeted municipalities below the 85% cutoff—those more likely to have benefited from the electrification scheme. Even when varying the polynomial (linear or cubic) used to plot the first stage, the evidence consistently shows that the number of evangelical churches per 100,000 inhabitants increased in municipalities more likely to be exposed to the LPT.
RD plot of the first-stage: the number of evangelical churches per 100,000 inhabitants given the value of the running variable—i.e., the percentage of households with electricity in 2000.
Point estimates using a local linear fit confirm this finding. Table 2 (Panel A) demonstrates that the number of evangelical churches decreases as the percentage of households with electricity in 2000 (i.e., the running variable) increases. Specifically, municipalities below the 85% cutoff had, on average, three more evangelical churches per 100,000 inhabitants. Compared to municipalities within the same bandwidth used to compute this effect, this represents a net growth of 37% in the posttreatment period (2005–2018).
The impact of evangelical churches on electoral politics (2004–2018)
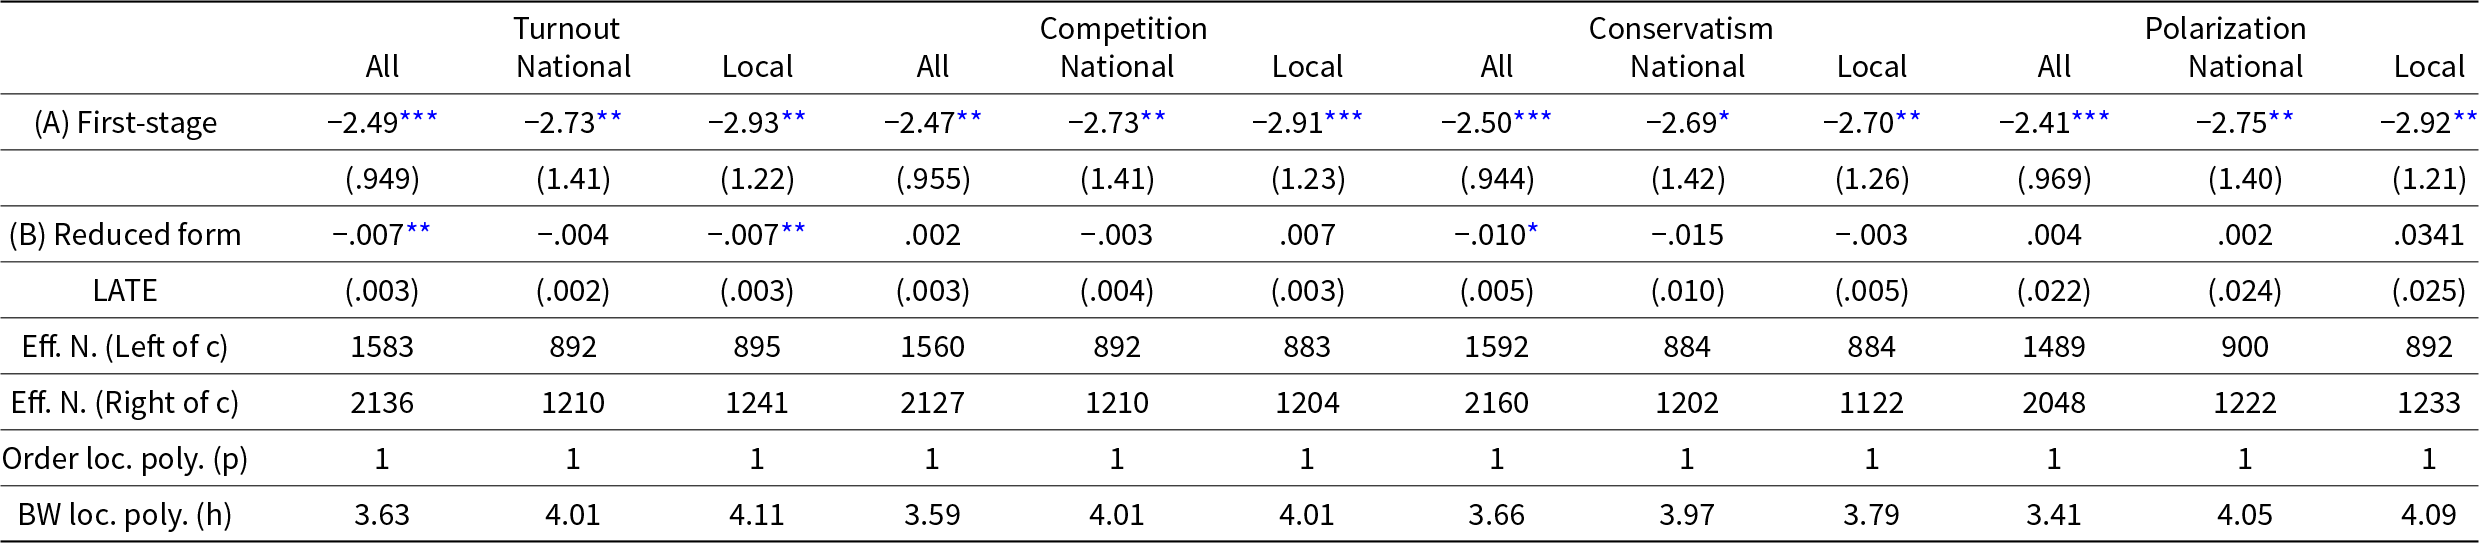
* Notes: p < 0.1, ** p < 0.05, *** p < 0.01.
The unit of analysis is the municipality. Figure 2 presents FRD local linear estimates using the optimal bandwidth selection method proposed by Calonico et al. Reference Calonico, Cattaneo and Farrell(2020). I use the percentage of households with electricity in 2000 (i.e., the running variable) to predict the number of evangelical churches per 100,000 inhabitants in targeted municipalities (Panel A). This as-if random treatment assignment estimates the LATE in reduced-form estimates (Panel B). My outcome variables in the reduced-form estimates are voter turnout (turnout), electoral competition (competition), electoral conservatism (conservatism), and electoral polarization (polarization).
Crucially, placebo estimatesFootnote 14 reported in Appendix I provide further reassurance: prior to the arrival of electricity caused by the LPT (1994–2003), there is no evidence of more evangelical churches below the 85% cutoff. As expected, in the absence of the intervention, first-stage estimates consistently fail to reach conventional levels of statistical significance. This result supports my interpretation that the LPT did indeed cause an increase in the number of evangelical churches in municipalities exposed to the program.
Still, my identification strategy hinges on the assumption that the LPT increased the number of evangelical churches and created favorable conditions for recruiting new members. The rationale is that with electricity, evangelical churches can organize and conduct outreach activities more effectively. They can use electric-powered sound systems for outdoor events, multimedia presentations for evangelistic campaigns, and digital platforms for online services. As prior research has documented, evangelical churches in rural Brazil often host community events, workshops, and classes, which become easier to conduct with electricity, attracting more participants and fostering a strong community around the church. Moreover, evangelical churches in rural Brazil frequently engage in social work, offering educational programs, literacy classes, and other community services (Spyer, Reference Spyer2020). With electricity, these initiatives can not only be carried out in the evenings but can also incorporate audiovisual aids, computers, and other tools, increasing their effectiveness and making the church a valuable community resource. The critical question is whether this expanded outreach translated into new members and supporters.
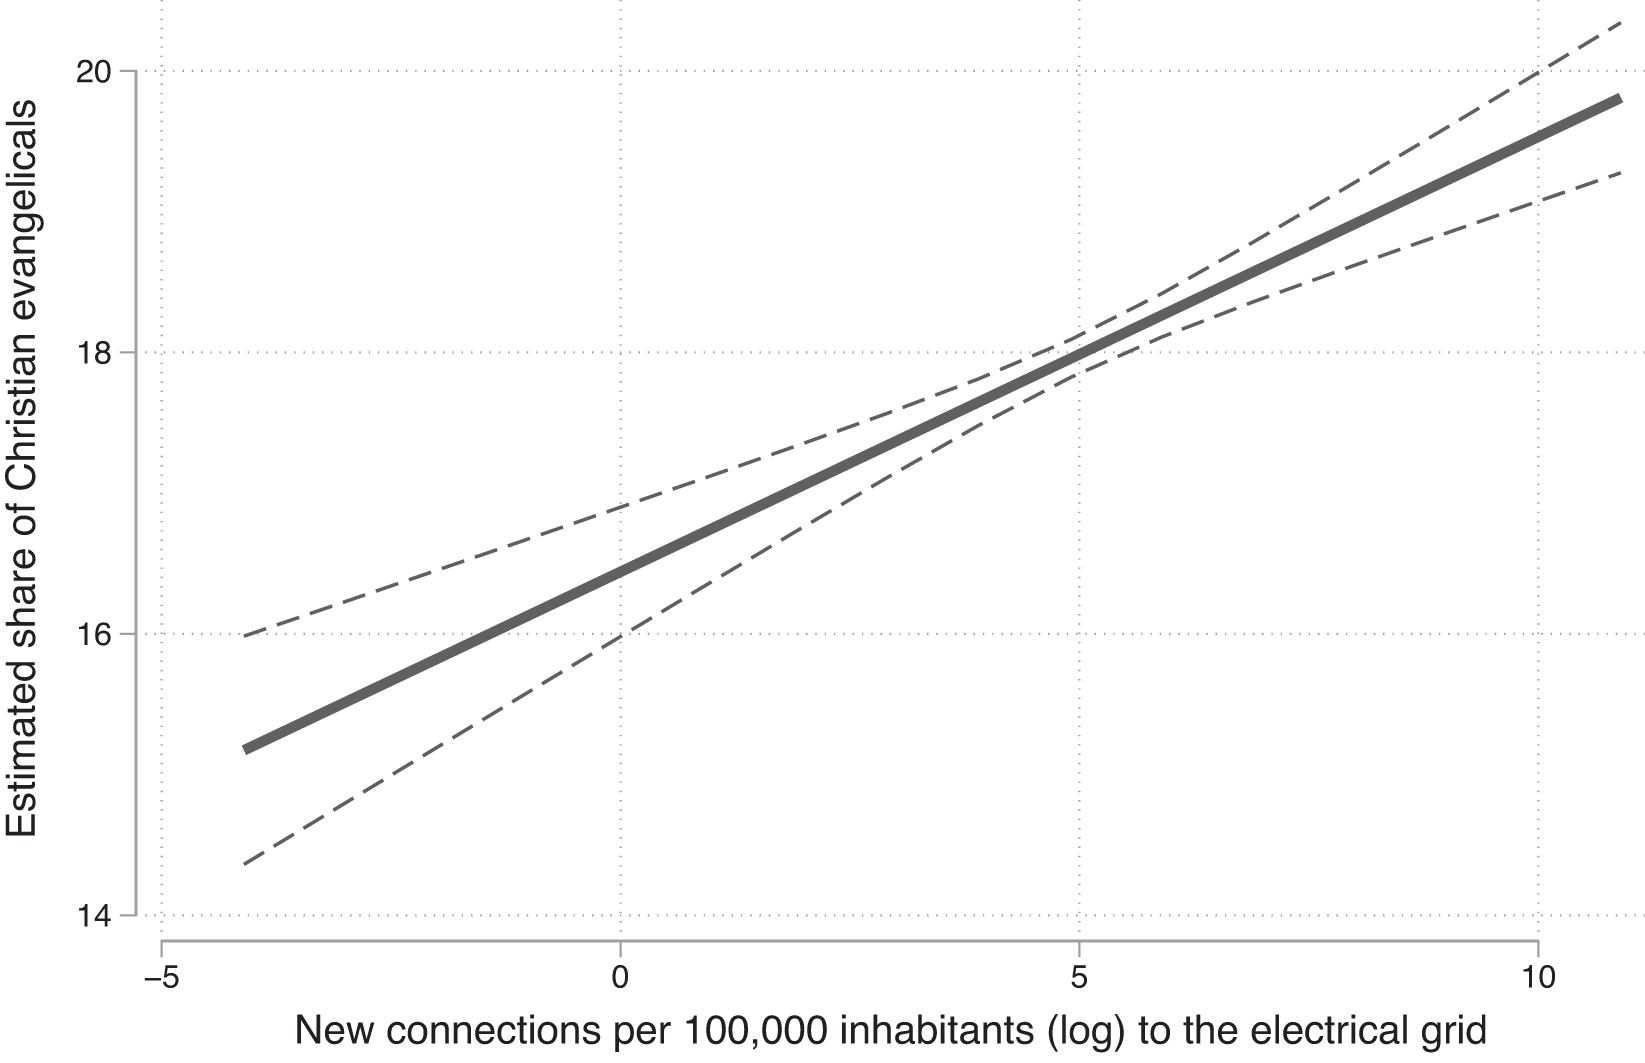
Figure 4 shows a strong positive correlation between the number of new connections (per capita) to the electrical grid through the LPT and the estimated share of Christian evangelicals across Brazilian municipalities from 2004 to 2018. This robust correlation indicates that electrification significantly facilitated the expansion of Evangelical Christianity. Reassuringly, fixed-effects models, sharp regression discontinuity, and intention-to-treat estimates reported in Appendix J confirm this general finding: Evangelical Christianity grew faster in municipalities targeted by the LPT. In the most conservative estimate, I document a difference of at least two percentage points in the share of Christian evangelicals posttreatment.
The predicted share of Christian evangelicals given the per capita number (log) of new connections to the electrical grid through the LPT (2004–2018).
Does this growth of Christian evangelicals induced by the LPT cause changes in electoral politics? Figure 5 (Panels A–D) summarizes my reduced-form estimates. A quick visual inspection reveals lower levels of voter turnout in municipalities targeted by the LPT, i.e., those below the 85% cutoff. Beyond that, there is a consistent pattern of continuity (i.e., no observable discontinuity at the 85% threshold) around the cutoff for other electoral outcomes of interest. Importantly, this pattern holds across different polynomial fits (i.e., linear and cubic), suggesting that my findings are not model-specific.
The visual effect of evangelical churches on voter turnout (A), electoral competition (B), electoral conservatism (C), and electoral polarization (D).
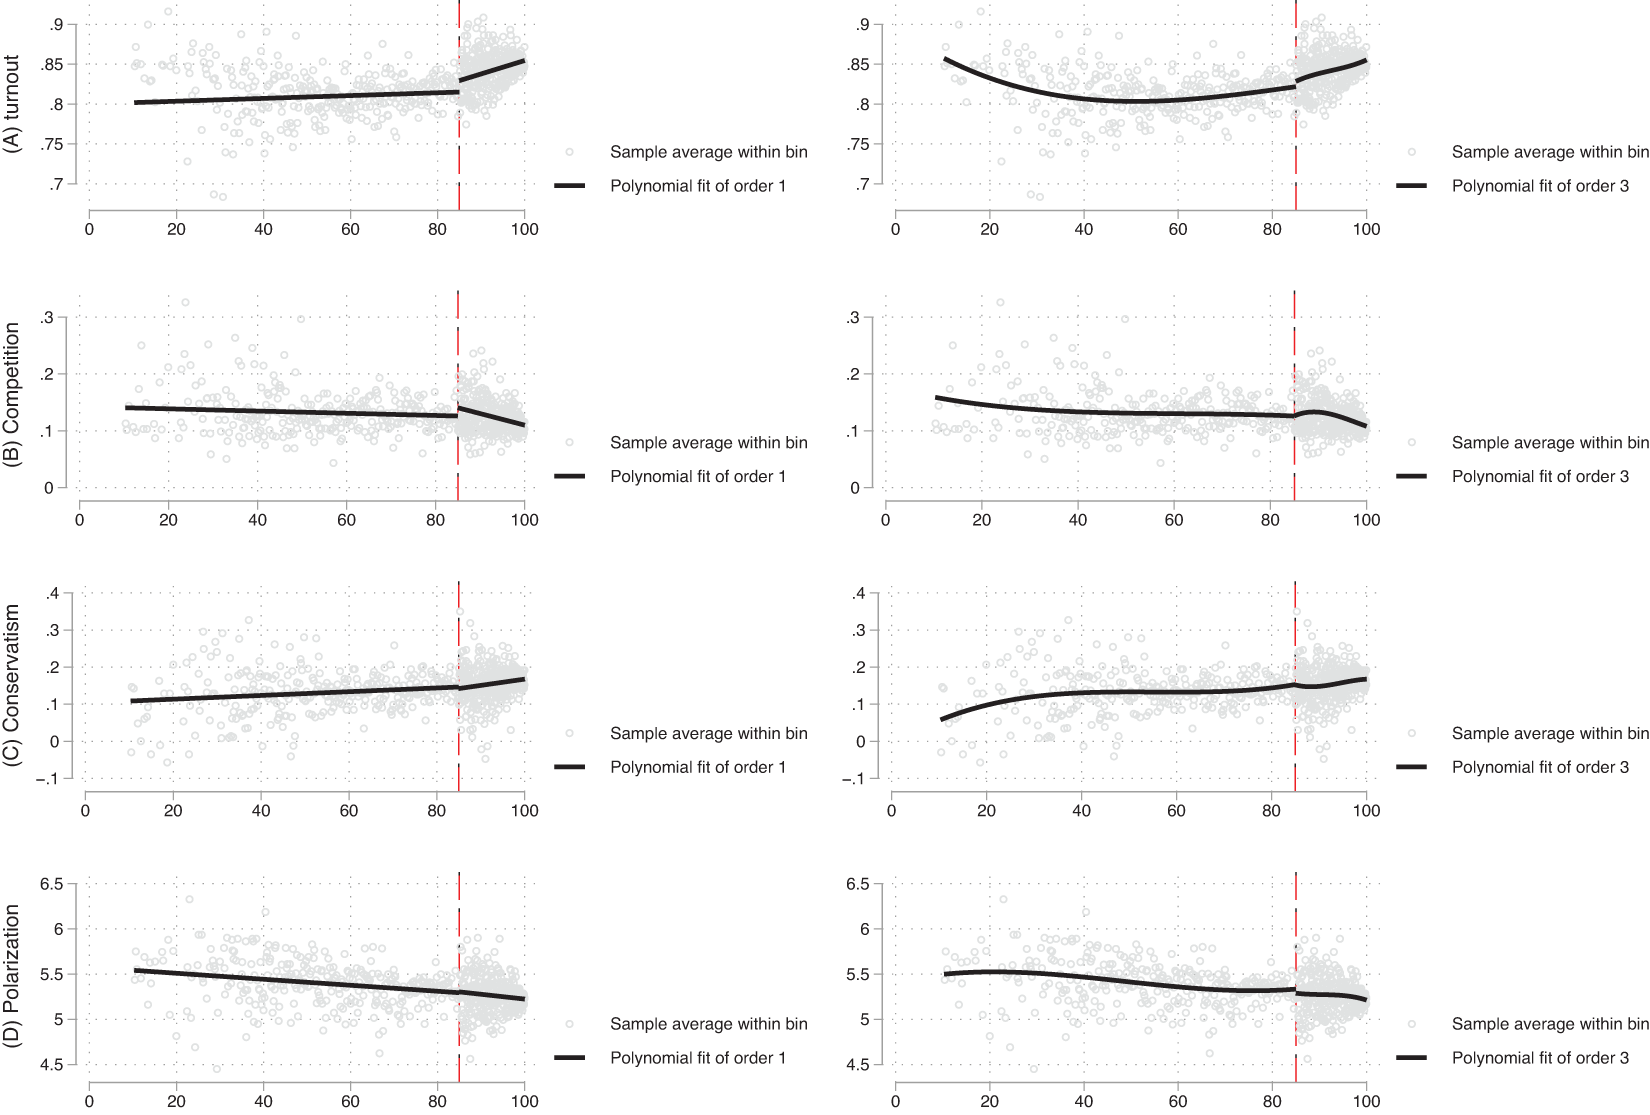
Table 2 complements this visual description with point estimatesFootnote 15 of the local impact of evangelical churches on the electoral outcomes of interest (see Panel B; reduced-form estimates). Contrary to H1 but consistent with results from fixed-effects models, the LATE coefficients produced by Models 1–3 are negative, indicating a negative impact of evangelical churches on voter turnout. On average, voter turnout was 0.30 percentage points higher in municipalities that were more likely to be affected by the LPT. As shown in Table 2, this documented effect was even larger (0.40 percentage points) in local elections held after the arrival of electricity.
Meanwhile, none of the coefficients estimating the effect of evangelical churches on electoral competition (Models 4–6) reach conventional levels of statistical significance, thereby rejecting H2.
My previous analyses found support for H3. Yet, as indicated by the LATE coefficients in Models 7–9, the regression discontinuity design provides no evidence that the expansion of evangelicals caused an increase in conservatism.Footnote 16 It is worth noting that my fixed-effects estimates encompass most Brazilian municipalities, while the regression discontinuity design focuses on a more restricted and less urbanized set of municipalities near the LPT cutoff. These differences in sample composition may account for the contrasting results.
Finally, contrary to H4, Models 10–12 show no positive impact of evangelical churches on electoral polarization. Importantly, across all models, first-stage estimates are statistically significant, indicating that the absence of results in the reduced form is not due to lack of power in the instrument used to predict changes in the outcome variables.
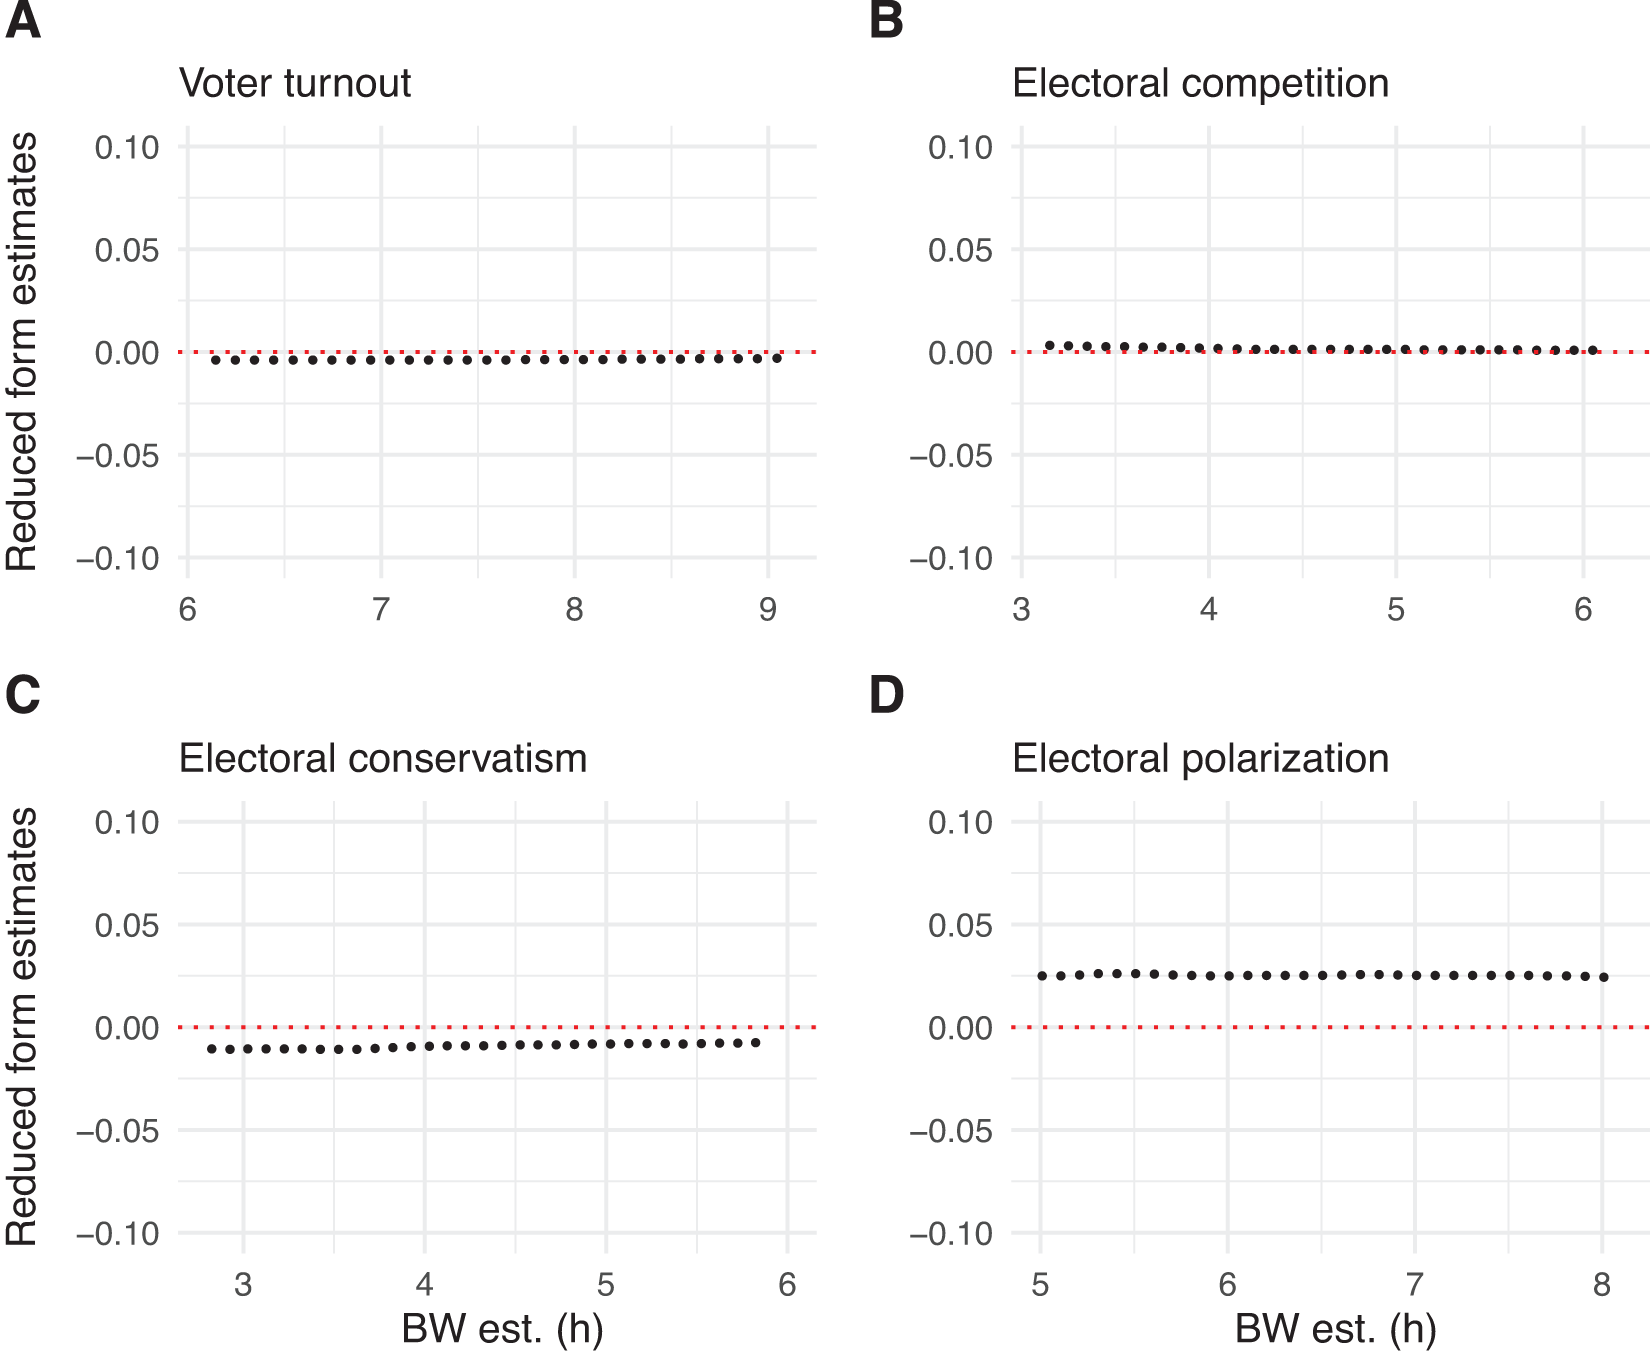
Selecting the bandwidth around the cutoff in which one estimates the LATE is crucial in regression discontinuity designs because the results and conclusions are typically sensitive to this choice (Bueno and Tuñón, Reference Bueno and Tuñón2015). Therefore, I replicate my estimates using several new values slightly smaller and larger than the optimal bandwidth (Calonico et al., Reference Calonico, Cattaneo and Farrell2020). Figure 6 shows that the estimated null impact in my reduced form estimates is consistent across several bandwidth choices.
BW est. (h) sensitiveness of reduced form estimates.
Another concern could be that rural electrification boosted the growth not only of Christian evangelicals but also of other religious groups. I would not expect the arrival of electrification to have the same positive effect on the expansion of Roman Catholics as they have a well-established network of churches in rural areas, reflecting its historical dominance in Brazil (Azevedo, Reference Azevedo2002). It is also unlikely that the LPT caused a proliferation of worship places of Spiritist and Afro-Brazilian religions such as Candomblé and Umbanda. Rural areas in Brazil have notably been dominated by Christian denominations, particularly Catholicism and Evangelicalism (Pierucci, Reference Pierucci2008). Spiritism has historically been more prevalent among urban middle-class populations (Stoll, Reference Stoll2002; Signates, Reference Signates2019). Afro-Brazilian traditions also have significant roots in urban centers such as Salvador, Rio de Janeiro, and Porto Alegre (Silva, Reference Silva2022). In addition, Afro-Brazilian religious practices usually rely on rituals, gatherings, and oral traditions that do not require electricity (Silva, Reference Silva2002; Reference Silva2022). Therefore, the arrival of electricity may not have been a transformative factor for these religious practices as they have been for evangelicals.
Still, to further rule out this possibility, I used the dataset created by Araújo Reference Araújo(2023) to calculate the number of non-evangelical religious facilities per 100,000 inhabitants in each municipality. This classification captures the salience of all non-evangelical religious temples across Brazilian municipalities. Appendix L reports my results using this residual measurement of religious salience. Reassuringly, there is no consistent evidence of a discontinuity in the number of non-evangelical facilities in municipalities below the 85% threshold. In other words, the LPT did not lead to an increase in worship spaces other than those attended by Christian evangelicals. Additionally, my reduced-form estimates are not statistically significant at conventional levels, as expected in this context.
Despite the consistency of my estimates across all models, it is possible that the LPT also influenced other variables relevant to the outcomes of interest, potentially affecting the validity of the identification strategy. To my knowledge, two studies have assessed the impact of the LPT on socioeconomic and political outcomes.
The first study finds that the arrival of electricity through the LPT reduced crime rates in targeted municipalities (Arvate et al., Reference Arvate, Falsete, Ribeiro and Souza2018). According to the authors, this effect is not explained by changes in the labor market or other development outcomes but rather by individuals staying home more often, reducing their exposure to violent crimes. I do not expect this documented channel to confound my findings. If anything, the arrival of electricity’s reduction in crime should result in an increase in voter turnout. The second study shows that the LPT improved the supply of education in rural areas (Araújo et al., Reference Araújo, Arretche and Beramendi2024). According to secularization theory, higher levels of development and education should reduce the propensity to engage in religious activities. However, this theory has proven insufficient to explain church attendance trends across many middle- and low-income countries (e.g., Grzymala-Busse, Reference Grzymala-Busse2012; Huber and Mohamed, Reference Huber and Mohamed2021; Pulejo, Reference Pulejo2023), including Brazil (Freston, Reference Freston, Miller and Morgan2019). Indeed, my estimates indicate that the arrival of electricity through the LPT contributed to the expansion of Evangelical Christianity, again, the opposite of what this theory would have predicted.Footnote 17 Critically, neither of these documented findings in the literature suggest that my estimates are confounded by other factors potentially influenced by the LPT.
6. Conclusion
Theories predicting increased secularization due to economic development and reduced vulnerability have proven controversial. The religious revival across democracies suggests that this cleavage has gained salience in recent decades (e.g., Grzymala-Busse, Reference Grzymala-Busse2012; Huber and Mohamed, Reference Huber and Mohamed2021). The global evangelical boom is a significant manifestation of this ongoing societal change (Freston, Reference Freston2001; Somma et al., Reference Somma, Bargsted and Valenzuela2017). In several low- and middle-income countries, Christian evangelicals are on the verge of becoming the largest religious group and, consequently, the majority of the electorate.
This paper has aimed to examine whether the expansion of Evangelical Christianity is reshaping electoral politics in Brazil. Results from fixed-effects models spanning over two decades of elections, combined with a regression discontinuity design leveraging an exogenous increase in the number of evangelical churches, paint a nuanced picture: the evangelical boom appears to be linked to lower voter participation and greater conservatism in elections. However, I found no evidence that the growth of Christian evangelicals in Brazil over recent decades has resulted in higher levels of competition or polarization in elections. Whether these findings hold in other contexts remains an open question for future research to explore.
As is often the case, the results presented in this paper are limited by data availability. Episodes of religious minority growth, such as the one ongoing in Brazil, could well influence individual-level outcomes not captured in my empirical analyses. Recent studies suggest that evangelicals are more likely to consume and spread conspiracy theories (Gonzalez et al., Reference Gonzalez, James, Bjorklund and Hill2021) and engage with fake news (Sacramento and Paiva, Reference Sacramento and Paiva2020; Lee Rogers and Powe, Reference Lee Rogers and Powe2022). Additionally, the expansion of Christian evangelicals is likely to affect attitudes rooted in voters’ political psychology, such as antipartisanship and affective polarization. Given the rapid growth of Evangelical Christianity in recent decades, studying how it shapes attitudes and fosters the creation of echo chambers presents a valuable area for future research.
Last but not least, this study does not address potential changes in candidates’ profiles driven by the expansion of Christian evangelicals. As the share of this electorate grows, more candidates representing the interests of evangelicals are likely to run for office. Consequently, evangelical voters may shift their support from secular elites to new candidates who are more aligned with their interests and willing to engage more actively with this emerging religious identity. Investigating these and other electoral dynamics could help anticipate structural changes in contexts with growing religious minorities.
Supplementary material
The supplementary material for this article can be found at https://doi.org/10.1017/psrm.2025.10025. To obtain replication material for this article, please visit https://doi.org/10.7910/DVN/AN44BQ?.
Acknowledgements
I am grateful to Malu Gatto, Daniel Levine, Taylor Boas, Amy Erica Smith, Philipp Kerler, and the participants of the MPSA panel Frontiers in Religion and Politics in Latin America for their valuable feedback. I also thank the three anonymous reviewers for their excellent comments, which significantly improved the quality of the manuscript. All remaining errors are my own.


 Open access