

Introduction
One goal of the Canadian contribution to the International Hydrological Decade (I.H.D.), 1965–74, was to link the synoptic-scale atmospheric circulation to the mass balance of a glacier (Reference Løken and DemersLøken, [1971]). Although a few studies have applied the synoptic climatological approach to glacier mass balance in the Canadian High Arctic (Reference Jacobs, Jacobs, Andrews, Barry, Bradley, Weaver and WilliamsJacobs and others, 1973; Reference AltAlt, 1975, Reference Alt1978, Reference Alt1979), there are no comparable studies on glacierized areas of the topographically more complex Canadian Cordillera. Outside Canada, studies relating synoptic processes to glacier mass balance have been carried out for areas of Europe (Reference HoinkesHoinkes, 1968), the Soviet Union (Reference Krenke, Danilina and KapitsaKrenke, 1971), the southern Indian Ocean (Reference Radok and WattsRadok and Watts, [1975]), and Alaska (Reference Fahl, Weller and BowlingFahl, [c1975]). In this paper, an objective synoptic climatology of two mountain glaciers in south-western Canada is presented. The results of the synoptic climatology are used to demonstrate the relationship between observed variations in mass balance and the atmospheric circulation over the region.
The Setting
The climate of the south-western Canadian Cordillera is dominated by the westerly flow of maritime airstreams (Reference Wendland and BrysonWendland and Bryson, 1981). The northerly portion of this flow crosses the Pacific Ocean from Asia and is most prominent in winter, while the southern portion is associated with the Pacific Anticyclone and is most prominent in summer. Northern Pacific westerlies are cool, with a near-moist adiabatic lapse rate and a high moisture content through a considerable depth. The warm summer anticyclonic airstream is stable and arrives at the British Columbian coast with a shallow moist layer.
Eastward-travelling cyclonic disturbances embedded in the westerly flow bring heavy precipitation to the south-western coast of British Columbia. The core area affected by the storms varies from about lat. 45°N. in the winter months to about lat. 54°N. in summer (Reference Hare, Hay, Bryson and Hare,Hare and Hay, 1974). The cyclones are usually near the peak of their development upon reaching coastal British Columbia, especially in winter. Summer cyclones are less frequent and vigorous, and several warm anticyclonic spells may be expected during the summer months. The net result of the intense cyclonic activity and the rugged topography of the Coast Mountain Range is large annual deposits of snow that, because of sudden orographic uplift and frictional drag associated with the change from ocean to land surface, increase dramatically with elevation (Reference WalkerWalker, 1961).
After a storm strikes the Coast Mountains, the low-level flows are disrupted, but the mid-tropospheric trough associated with the surface fronts usually continues eastward across the Cordillera (Reference HobbsHobbs, 1978). Although it is difficult to follow surface fronts across the complex topography of the interior, the passage of a system shows itself in the observed weather (Reference Hare, Hay, Bryson and Hare,Hare and Hay, 1974). A front may produce little or no precipitation in the deep valleys or upland plateaus, but the higher mountain ranges (the Purcell, Monashee, Selkirk, Cariboo, and Rocky Mountains) do receive heavy falls of rain and snow, especially in winter. Summer convective storms are common in all interior areas experiencing a midtropospheric disturbance.
In those locations where altitude or topography limit the amount of energy available for ablation of the winter snow-pack, excess accumulation has led to the formation of mountain glaciers. During the I.H.D., five glacierized mountain basins were studied on an east-west transect from the Rocky Mountains to the Coast Range in south-western Canada (Reference ØstremØstrem, 1966). Of these, Peyto and Sentinel Glaciers (Fig. 1) received the most intense glaciological and meteorological study due to their accessibility and to their presumed representativeness of nearby glaciers. Summaries of the I.H.D. programs at Peyto and Sentinel Glaciers and basic data are given by Reference Young, Stanley and Peyto GlacierYoung and Stanley ([c1977]) and Reference Mokievsky-Zubok and StanleyMokievsky-Zubok and Stanley (1976) respectively.
Location of Peyto and Sentinel Glaciers.
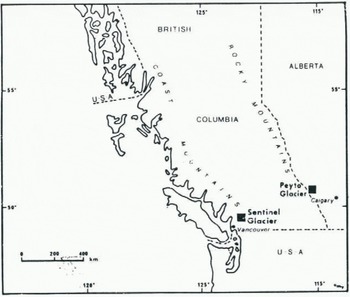
Peyto Glacier is influenced by a relatively continental climate. It is located in the Waputik Ranges of the Rocky Mountains of Alberta at lat. 51°40’N., long. 116°35’W. Peyto Glacier has an area of approximately 13.4 km2, ranges in altitude from 2100 m to 3200 m a.s.l., and has an average slope of 13° and a north-easterly orientation. It is a major outlet of the Wapta Icefield. The basic mass-balance program at Peyto Glacier during the I.H.D. involved monitoring mass-balance changes at 38 stakes on the glacier and extrapolating these point measurements to the whole glacier (Reference YoungYoung, 1976). Accounting for errors in measurement and errors in the extrapolation algorithm, a conservative standard error of estimate for annual balances for the entire glacier is 0.05 m water equivalent (Reference YoungYoung, 1981).
During the summer months, a meteorological station was maintained at Peyto Glacier base camp, located on a lateral moraine at 2200 m a.s.l., and about 100 m from the glacier. Weather conditions at the base camp appear to reflect local-scale conditions for the basin as a whole. Reference YoungYoung ([1978]) has perfomed a factor analysis on the 11 meteorological variables routinely monitored at Peyto. Not unexpectedly, approximately 70% of the total variance in these data is described by a temperature factor and a precipitation factor, thereby suggesting that daily temperature and precipitation data are useful measures of the meteorological environment of Peyto Glacier.
Sentinel Glacier is located at lat. 49°54’N., long. 122°59’W., in the Coast Mountains of British Columbia. The maritime climate of the region produces winter snow cover on the glacier that usually exceeds 9 m at higher elevations. The relatively small, uneven glacier covers about 2 km2, ranges from 1550 m to 2100 m a.s.l., and has an average gradient of 17° and a northerly orientation. The combination of steep gradient, small area, heavy snow cover, and variability in surface topography present difficulties in assessment of mass balance at Sentinel Glacier (Reference Mokievsky-ZubokMokievsky-Zubok, 1973[b], Reference Mokievsky-Zubok1974). However, three methods of mass-balance determination consistently produced similar results (Mokievsky-Zubok, 1973[a]). Standard errors of estimate are not given for Sentinel Glacier, but are probably greater than those for Peyto Glacier because of measurements problems and high accumulation and ablation totals.
A meteoroloical program similar to the one at Peyto Glacier was carried out at Sentinel Glacier. The main base-camp weather station is located at 1550 m a.s.l., and about 400 m down-valley from the glacier. Like Peyto Glacier, a principal components analysis suggests the expected association between glacier melt and temperature and precipitation events in the basin (Reference Fogarasi and Mokievsky-ZubokFogarasi and Mokievsky-Zubok, 1978).
Data and Methods Used
The primary goal of synoptic climatological research is to associate local climate with atmospheric circulation (Reference Barry and PerryBarry and Perry, 1973). In this study, mass-balance and daily-mean temperature data from nine glaciological years (1 October 1965 to 30 September 1974) of the I.H.D. programs at Peyto and Sentinel Glaciers are used to represent local conditions. Unfortunately, the meteorological record from the glaciers varies from year to year. Therefore, it is necessary to use data from nearby weather stations to represent the meteorological environment of the glaciers (Reference YoungYoung, [1978]). Daily maximum temperature data from Banff, Alberta, and Alta Lake, British Columbia, explain 83% and 81% of the variance in daily-mean temperatures during the summer months at Peyto and Sentinel Glaciers, respectively, at the 0.001 significance level and are used in the analysis. Daily precipitation data from Lake Louise, Alberta, and Alta Lake account for only 15% and 51% of the variance in summertime precipitation at Peyto and Sentinel Glaciers, respectively, at the 0.001 significance level. These relatively low levels of explanation are believed to be the result of the observational problems associated with mountain precipitation (Reference BarryBarry, 1981) and the high spatial variability of summer convective activity in mountainous regions. It is assumed that the winter precipitation is the result of vigorous fronts and orographic lifting of the air masses associated with those fronts (Reference Hobbs, Hobbs, Houze and MatijkaHob@s and others, 1975), thus providing the spatial coherence needed to relate meso-scale precipitation to glacier accumulation. Subsequent analysis supports this assumption.
For association with these ground-based data, daily 1200 GMT synoptic-scale 500 mbar pressure grids are compiled from the 1977-point National Meteorological Center (NMC) grid of the Northern Hemisphere produced by the National Center for Atmospheric Research (NCAR; Reference JenneJenne, 1975). The mid-tropospheric 500 mbar pressure surface is used because it is above the direct topographic influence of the Cordillera of south-west Canada.
Climatological and glaciological analyses generally use fixed-length seasons or key months to represent seasons. However, interannual variability in the length, first day, and last day of a season are important elements of the climate that affect glacier mass balance. Therefore, in this paper the natural seasons at Peyto and Sentinel Glaciers are used for analysis (Reference YarnalYarnal, in press [c]).
The objective sums-of-squares technique proposed by Reference KirchhoferKirchhofer (1974) is used to classify the synoptic types. This approach has been employed by Reference KirchhoferKirchhofer (1976) for Switzerland, by Reference Barry, Keen, Barry, Barry and JacobsBarry and Keen (1978), Reference MoritzMoritz (1979), Reference Bradley and EnglandBradley and England (1979), and Reference KeenKeen (1980) for areas of the North American Arctic, and by Reference BarryBarry and others (1981) for the American west.
The classification procedure is applied to two 500 mbar data sets. First, a synoptic-scale set of 27 contiguous NMC grid points is used to synthesize 30 equally spaced points of latitude and longitude with grid spacings of approximately 350 km (Small-grids). Then, a large, more generalized, synoptic-scale set is created in which every other grid point from an 11 by 10 section of the NMC grid is extracted to produce another 30-point matrix with grid spacings of approximately 700 km (Biggrids). Latitude and longitude are not considered for Biggrids. By using 5 by 6 matrices for both Smallgrids and Biggrids, the same computer algorithm (Reference YarnalYarnal, in press [b]) is applied to both data sets, thus facilitating comparison of the climatologies for each synoptic scale.
To apply the Kirchhofer technique, the gridded data sets are first normalized using the Z-transformation.

where Z is the normalized value at grid point i, Xi the data value at grid point i, x the mean of the N-point grid, and s the standard deviation of the grid. Each normalized grid is compared to all other grids by the sums-of-squares equation:
where S is the Kirchhofer score, Zai the normalized grid value at point i on day a, Zbi the normalized grid value at point i on day b, and N the number of data points. It is possible for a comparison of any two grids to generate a low S value, denoting overall statistical similarity, and yet have widely varying patterns in specific sectors of the map. Therefore, to ensure pattern similarity in all areas of the grids, sub-score values for each row and column of the 5 by 6 matrices are calculated using Equation (2).
Grids are considered similar if S < 15 (in other words, 0.5N) and row and column scores SR and SC < 1.0NR and 1.0NC where NR and NC are the number of points in the row or column, respectively. Mean sea-level-pressure surfaces using the Kirchhofer method (such as Reference MoritzMoritz, 1979) have used thresholds for S of 1.0N and for row and column scores of 1.8NR and 1.8NC. However, to provide a comparable number of patterns and a high percentage of classified days, a lower threshold score must be used for upper air maps (Reference BarryBarry and others, 1981).
Due to computer-storage limitations and cost considerations (Reference YarnalYarnal, in press [b]), it is necessary to use a sample of the days of the nine-year study period. A statistical evaluation (Reference YarnalYarnal, in press [a]), using a confidence level of 95% (z = 1.96), confidence limits of ±2%, and an estimated variability of 50%, suggests a sample of four of the nine years is suitable. The glaciological years 1965–66, 1966–67, 1969–70, and 1973–74 are chosen as the four sample years following a subjective assessment of the mass-balance characteristics of Peyto and Sentinel Glaciers. It is assumed that the widest range of synoptic weather patterns occurred during these years.
S, SR, and SC values are calculated for every pair of grids in the sample. If the previously-mentioned threshold requirements are met, the pair of grids is considered significantly similar and the S value is entered into memory. The daily grid with the most S values associated with it is designated Keyday 1. A keyday is taken to be the single day that best represents the mean atmospheric conditions associated with a given 500 mbar pattern. Keyday 1 is removed from the analysis along with all grids associated with the keyday and all days associated with those days. This process is repeated to determine subsequent keydays until all days are classified into m groups of five days or more. Remaining days are termed “unclassified”.
In the final step, S, SR, and SC values are again calculated, this time for each of the m keydays with each day of the total population of daily grids. The lowest significant Kirchhofer score is recorded for each daily grid, with the associated keyday denoting the synoptic type of the day. Because it is possible for any day to be related significantly to more than one keyday, days mis-classified by early removal during the keyday determination procedure described above are reclassified.
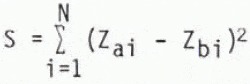
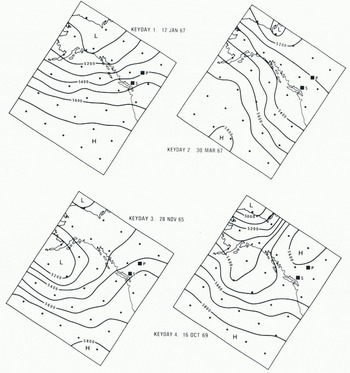
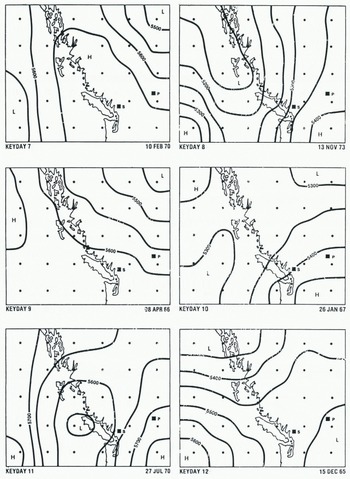
Table I summarizes the results of the synoptictype classifications. The 18 Smallgrids synoptic types recognized account for 93.7% of the days in the study period. The first eight types account for over 77% of the days, with higher-order synoptic types being much less important in terms of frequency. The Smallgrids keyday maps are shown in Figures 2 to 4. Eight Biggrids synoptic types accounting for 94.5% of the study period are identified. The first four types acount for 87% of the days. Keydays for the Biggrids synoptic types are illustrated in Figures 5 and 6.

500 mbar pressure distributions on Smallgrids Keydays 1 to 6.
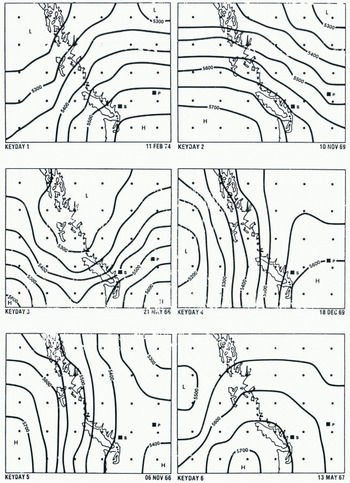
500 mbar pressure distributions on Smallgrids Keydays 13 to 18.
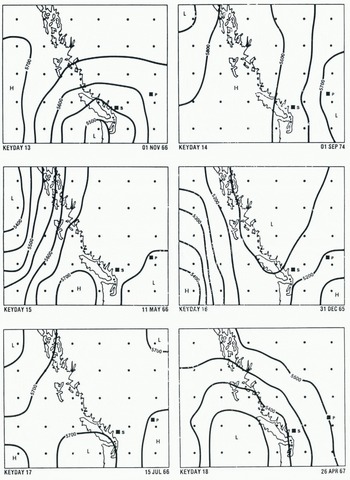
500 mbar pressure distributions on Biggrids Keydays 1 to 4.
500 mbar pressure distributions on Biggrids Keydays 5 to 8.
A cross-tabulation of Smallgrids and Biggrids synoptic types is performed to determine the nature of the relationship between the two synoptic scales (Table II). Although no clear relationships emerge upon inspection of the contingency table (not shown), a chi-squared analysis of the first six rows and columns suggests that observed frequencies are not chance variations. However, chi-squared does not indicate how strongly the variables are related. Asymmetric lambda (λb) measures the strength of this association for cross-tabulations based on nominal-level data (Reference Mueller, Mueller, Schueseler, Costner, Boston and Houghton MifflinMueller and others, 1977). Using asymmetric lambda to measure the ability to predict Smallgrids types given knowledge of the frequencies of Biggrids types shows only a 2.8% improvement in prediction. No improvement is found using Smallgrids to predict Biggrids types. Therefore, there is very little direct statistical relationship between the two synoptic type classifications used in the present study.

These results can be attributed to the filtering of data during the compilation of Biggrids. At that time, approximately 73% of the original 110 data points were removed. Consequently, a great deal of small-scale synoptic variation may take place over south-western Canada without these changes being evident in the Biggrids types. Biggrids are related to the long-wave patterns of the Northern Hemisphere, while Smallgrids are high-wavenumber, migratory perturbations imbedded in the Biggrids flow.
The Relationship Between Glacier Mass Balance and The Synoptic Types
Ridge regression (Reference Hoerl and KennardHoerl and Kennard, 1970[a], [b]) is used to evaluate the contribution of Smallgrids and Biggrids synoptic types to accumulation and ablation components of mass balance. This objective technique is applied to eliminate correlated predictor variables from the data (Reference Yarnal and BurnabyYarnal, unpublished). Winter-balance measurements are used as the criterion variable representing annual accumulation. Although choice of an appropriate variable or variables to represent annual ablation is not straightforward, temperature data can be used to represent the variables of the energy balance and summer balance (Reference BraithwaiteBraithwaite, 1981). Models of summer balance using temperatures from local stations have been developed by Reference Hoinkes and SteinackerHoinkes and Steinacker ([1975]), Reference BraithwaiteBraithwaite, (unpublished), Reference YoungYoung ([1978]), and Reference TangbornTangborn (1980). Thus, mean daily maximum temperatures from Banff and Alta Lake are used as criterion variables representing annual ablation at Peyto and Sentinel Glaciers, respectively.
Due to deyrees-of-freedom limitations, multiple linear regression cannot be carried out if:
where P is the number of predictor variables and N the number of cases of the criterion variable. In this study, the m synoptic types (P) exceed the (N − 1) seasons available for analysis in nearly every situation. Thus, the synoptic types must be collapsed into climatologically meaningful groups. The frequencies of certain synoptic-type characteristics, based on criteria established by Reference Bradley and EnglandBradley and England (1979), are used for this purpose. Wet synoptic types are those types associated with more precipitation than the expected amount in a given season. Any Smallgrids type providing more than 5.6% (one-eighteenth) and any Biggrids type providing more than 12.5% (one-eighth) of the seasonal total precipitation are considered wet. Dry types are those with seasonal totals below 5.6% for Smallgrids and 12.5% for Biggrids. Efficient bearers of precipitation are types associated with larger seasonal precipitation totals than their relative frequency of occurrence. For example, a synoptic type that occurs 10% of the time and delivers 10% or more of the periods’s precipitation is considered efficient. Inefficient bearers of precipitation are associated with lower seasonal precipitation totals than their relative frequencies alone would suggest. A synoptic type that occurs 10% of the time but delivers less than 10% of the period’s precipitation is considered inefficient. Cool and warm types are synoptic types associated with seasonal mean daily maximum temperatures below or above normal.
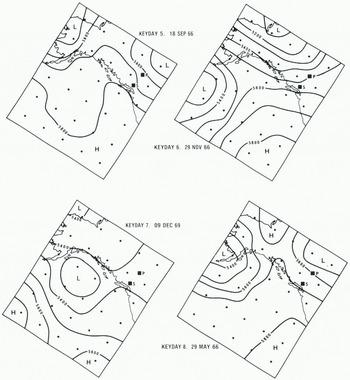
Table III is a simplified summary of the regression analysis. These results suggest that elements of the mass balance of Peyto and Sentinel Glaciers are related to synoptic-scale circulation, but that changes in the synoptic, scale and level of information used in the weather maps influence the results (Reference YarnalYarnal, in press [a]). At Sentinel Glacier, winter balance is predicted well by the Smallgrids synoptic types and not by Biggrids types. Biggrids synoptic types are more closely related to Sentinel Glacier summer balance, but again not as closely as Smallgrids types are related to summer balance. Therefore, it appears that Sentinel Glacier mass balance may be controlled by small-scale, high-wavenumber synoptic activity.
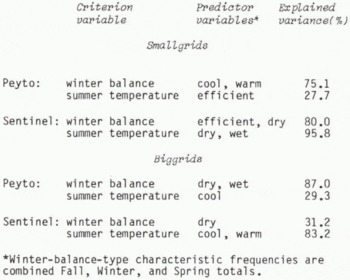
At Peyto Glacier, better explanation of the total variance in winter balance is given by Peyto Biggrids than Peyto Smallgrids synoptic types. This suggests that accumulation at Peyto Glacier may be more dependent on long-wave control than in the Sentinel situation. Much of the moisture available to Sentinel Glacier results from south-south-westerly flow below the approximate average height of the Cordilleran ranges and the subsequent orographic lifting of that flow (Reference Hobbs, Hobbs, Houze and MatijkaHobbs and others, 1975). This tongue of warm maritime air is readily identifiable in Smallgrids Keydays 1 and 4 (Fig. 2). However, because it possesses a very weak westerly wind component, the low-level moist air is unable to flow over the Cordillera. With the cutting off of this low-level moisture source west of the mountains, upon reaching Peyto Glacier, the effect of small-scale synoptic variation is subsumed by the more general longwave mid-tropospheric flow of cold maritime air off the North Pacific (see Keyday 1 in Figure 5).
Neither the Smallgrids nor Biggrids synoptic-type frequencies seem to be related to summer temperature at Banff. This lack of correlation is explained by the location of the Banff weather station relative to that of Peyto Glacier: Banff is found in a broad valley just inside the mountain front at an elevation of 1400 m a.s.l., while Peyto Glacier is a mountain site at 2200 m a.s.l. Banff, being located at the eastern edge of both grids, is affected by shallow continental polar air masses that may not reach to 500 mbar and which are brought in by 500 mbar systems that are, for the most part, east and north of either grid. As suggested by the work of Reference Stenning, Stenning, Banfield and YoungStenning and others (1981), Peyto Glacier summer balance appears to be under the control of mid-tropospheric flow coming off the Pacific Ocean.
Based on the above, the relationship between synoptic-scale circulation and both Sentinel Glacier mass balance and Peyto Glacier accumulation can be described. Synoptic types with cyclonic curvature favor glacier accumulation, while anticyclonic types inhibit build-up of the regional snow-pack. Although previous research in the Arctic has found net radiation to be higher on cloudy days (Reference Jacobs, Jacobs, Andrews, Barry, Bradley, Weaver and WilliamsJacobs and others, 1973; Reference AmbachAmbach, 1974), ablation is suppressed in south-western Canada by synoptic types associated with cloudy days and/or low temperatures, and is enhanced by types associated with warm, sunny days. Reference Fogarasi and Mokievsky-ZubokFogarasi and Mokievsky-Zubok (1978) found that mean daily cloudiness at Sentinel Glacier is positively correlated with precipitation and global radiation and negatively correlated with run-off, temperature, sunshine, and global radiation. Net radiation was not recorded at Sentinel, Cloudy conditions are associated with south-westerly cyclonic flow types (such as Smallgrids Keydays 1 and 4, Fig. 2, or Biggrids Keyday 1, Fig. 5), while clear skies prevail with north-westerly anticyclonic airflows (such as Smallgrids or Biggrids Keyday 2, Figs 2 and 5, respectively).
80% of the variance in Sentinel winter balance is explained by Smallgrids efficient and dry types. Nearly 60% of the variance is explained by efficient bearers of precipitation, suggesting that strongly positive accumulations of snow are a function of the frequency of heavy precipitation events that occur in a given accumulation season (Reference YarnalYarnal, in press [c]). Each of the important efficient types (Keydays 1, 3, 4, 8, and 10; Figs 2 and 3) has a south-westerly component to its airflow allowing it to pick up moisture over the Pacific before reaching Sentinel Glacier. Advection of moist sub-tropical air into the area, when combined with upward vertical motions and orographic uplift, produces heavy precipitation. Low accumulation totals are related to a decrease in heavy precipitation events accompanied by an increase in days with little to no precipitation. Approximately 20% of the variance in winter balance is explained by dry-type characteristics. Especially important to years with low accumulation totals are those types with northerly flows (Keydays 5, 9, 14, 15, and 17; Figs 2–4) and those with 500 mbar ridges over Sentinel Glacier (Keydays 7 and 15; Figs 3 and 4)
500 mbar pressure distributions on Smallgrids Keydays 7 to 12.
Nearly 96% of the variance in summer temperature at Alta Lake is explained by Smallgrids dry and wet types. Dry types, which explain 74% of the variance, enhance ablation at Sentinel Glacier. In most cases, dry types are inefficient bearers of precipitation with above-average temperatures. Especially important dry types are represented by Keydays 2 and 6 (Fig. 2), each occurring frequently with above-average temperatures and clear skies. These two types are both associated with subsidence and northerly airflow over Sentinel Glacier. Wet types explain 22% of the variance and can be important in suppressing ablation at Sentinel Glacier. These four types (Keydays 1, 3, 4, and 8; Figs 2 and 3) are all associated with south-westerly flow and upward vertical motions ahead of a trough of marine air. Although types 1 and 4 have above-average temperatures, ablation is partially suppressed by cloudy skies. Types 3 and 8 are associated with wet, cool conditions. Rainfall is not important to ablation at Sentinel Glacier (Reference Fogarasi and Mokievsky-ZubokFogarasi and Mokievsky-Zubok, 1978).
87% of the variance in winter balance at Peyto Glacier is explained by Biggrids synoptic types. Of this, 76% is explained by dry types. Dry types, as represented by Keydays 2, 3, and 4 (Fig. 5), are important in terms of frequency and are also inefficient bearers of precipitation, meaning relatively little precipitation is delivered by these flow patterns. Type 2 is associated with subsiding north-westerly flow, while type 4 days place a ridge of high pressure over Peyto Glacier. Type 3 finds Peyto Glacier just at that point in the long-wave pattern where anticyclonic vorticity decreases are accompanied by upper-level convergence and consequent downward vertical motions. 11% of the variance in Peyto Glacier winter balance is explained by type 1 (Keyday 1, Fig. 5), the only Biggrids type in the wet category.
Summary
Although the number of years available for analysis is limited, a significant statistical relationship exists between the synoptic-scale atmospheric circulation over south-western Canada and aspects of the mass balance of Peyto and Sentinel Glaciers. Winter balance at Sentinel Glacier appears to be controlled mainly by the number of Smallgrids synoptic types associated with heavy precipitation that occur during the accumulation season. On the other hand, summer melt at Sentinel Glacier is largely a function of the frequency of those Smallgrid patterns bringing high temperatures and clear skies to the region. Peyto Glacier accumulation seems to be more closely related to Biggrids patterns. This suggests, along with the disruption by the mountains of the low-level moisture source that delivers heavy precipitation to Sentinel Glacier, that friction induced by the Cordillera dampens some of the high-frequency mid-tropospheric oscillations embedded within the slow-moving baroclinic zones associated with long-wave disturbances in winter. Neither synoptic scale used in this analysis is closely associated with ablation at Peyto Glacier. This result is explained by the fact that the meso-scale temperature data used to represent Peyto Glacier summer energy-balance conditions is from a station that is influenced more by continental air masses than by maritime airflows.
Acknowledgements
I wish to acknowlege the following persons: Brian Sagar, Simon Fraser University, for supervising this research; Roger Barry, University of Colorado, and an anonymous reviewer for suggesting improvements to the manuscript; Gordon Young and Oleg Mokievsky-Zubok, Snow and Ice Division, National Hydrology Research Institute of Canada, for proving glaciometeorological data for Peyto and Sentinel Glaciers, respectively; John Knox, University of British Columbia, for providing the NCAR 500 mbar data; Careen Mackay Yarnal for producing the figures; and Coleen Wagner for typing the manuscript. Research expenses were covered by the Department of Geography, Simon Fraser University, and production costs were paid by the Graduate College, University of Northern Iowa.


