

Introduction
Approaching historic cartographies of the physical environment from a contemporary epistemological context of hyper-precision in terms of scale and projection, it is all too easy to perceive inaccuracy, first and foremost, in past works that do not emulate such levels of Cartesian perfection. If a work is not precise in such familiar terms, we might easily conclude that it cannot be effective in facilitating self-location and wayfinding in the real world. A Kachchhi-Gujarati chart of the Red Sea and Gulf of Aden held at the Royal Geographical Society–Institute of British Geographers (henceforth, RGS) in London, probably from the eighteenth or early nineteenth century,Footnote 1 challenges this perspective: its effectiveness lies not in precise mathematical projection but in its documentation of a cognitive knowledge system of navigation based on stellar observation, acquired knowledge of landscape, and the familiarities of practice. Often maligned in the past, the chart is evidence of an effective system of navigation that enabled trade and exchange between India, Arabia, and the Horn of Africa in the age of sail, before the uptake of a more abstract, instrument-based navigation.
The manuscript
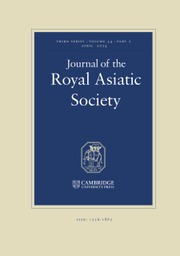
The chart forms the recto of a 195 x 24.5 cm paper manuscript, catalogued by the RGS as ‘A native Indian chart of the coast of Arabia and the Red Sea’, borrowing from a note handwritten on it by its donor, Alexander Burnes (1805–1841; Figure 1).Footnote 2 The note continues:
drawn by an inhabitant of Cutch [Kachchh]
and used by pilots at the present
time in that navigation.
Given to me by a pilot.
Cutch, June 1835 Alex [Alec?] Burnes
The recto (l) and verso (r) of the Kachchhi-Gujarati manuscript (mr Asia S.4) donated to the Royal Geographical Society in 1835 by Alexander Burnes under the English title: ‘A native Indian chart of the coast of Arabia and the Red Sea drawn by an inhabitant of Cutch and used by pilots at the present time in that navigation.’ The recto comprises the chart in question, and the verso a series of ten texts on papers pasted onto the back of the chart to reinforce it. Source: Royal Geographical Society–Institute of British Geographers.

There is no corresponding Devanagari title.
An additional 21 x 24.5 cm-long piece of paper pasted at the right-hand end of the chart stabilises the manuscript’s tattered edge (Figure 2); it repeats the title and adds the following:
AB. The writing pasted on the
back of the chart has no reference to the chart,
it is sent as I received it,
an obvious original in
every way.
AB
‘A native Indian chart of the coast of Arabia and the Red Sea’. Alexander Burnes’s note attached to the right-hand end of the RGS chart. Source: Royal Geographical Society–Institute of British Geographers.

In its present archival context, the manuscript is folded for storage, leaving transverse creases at 56 cm, 119 cm, and 174 cm from the left margin. The rightmost fold corresponds to the edge of Burnes’s added paper, suggesting that the folding post-dates Burnes’s acquisition. This, together with the document’s 5:39 aspect ratio, its eroded right edge, and light creases running transversally along its entire length all suggest that folding was not the original storage method, but rather that the document was originally a scroll, rolled from left to right, thereby leaving the right edge vulnerable to the wear it clearly exhibits. This change in method of stowing the document materialises its transition from navigator’s chest to imperial storehouse.
The manuscript’s recto (Figures 1 and 3) presents a navigational chart of the Red Sea south of Jeddah, and of the Gulf of Aden as far east as the island of Socotra. Its verso (Figure 4) comprises ten sheets of pasted paper arranged in three rows, applied as reinforcement. Each contains text, mostly fragmentary, in one of two scripts (see the ‘Verso texts’ section below).
The RGS chart of the southern Red Sea and Gulf of Aden, with annotations indexing its Devanagari and English toponyms, rhumbs, coastal profiles, buildings, flags and identifiable-but-unnamed places. The numerals in the margins indicate Polaris altitudes. Source: (image) Royal Geographical Society–Institute of British Geographers; (annotations) the authors.

The verso of the RGS chart, with annotations indexing the individual sheets of paper (T1–10) bearing texts. The arrows indicate the overlaying of the sheets: the base of the arrow denotes the overlaid sheet and the point its underlaid counterpart. The texts relate broadly to commercial and property matters (Table 6); they make no direct reference to the chart. Source: (image) Royal Geographical Society–Institute of British Geographers; (annotations) the authors.

The focus of our attention is the chart, which is drawn and annotated in black ink, with red ink highlighting features such as coastal outlines, flags, buildings, detail of ships, etc. A third colour, today appearing as ochre, is also used to colour some ships’ sails. The chart remains unfinished at its left end, with the image reducing to outlines north of what we identify as Shiʿb al-Jeffin (TD9; 20°16′N) on the Arabian coast and Suakin (L50; 19°07′N) on the African. The damaged right-hand edge leaves the original eastward extent of the cartography unknown.
The chart arranges the Red Sea and Gulf of Aden along a common axis, rather than setting these basins at an angle of circa 90° to each other in the Cartesian manner: the Arabian coast thus appears as a continuous line of scalloped bays along the chart’s upper edge, with the African coast arrayed along the lower. The cartographer depicts over 180 islands, together with reefs and other features. Crucially, the chart includes 66 Devanagari toponyms along with the 21 English toponyms that Burnes added in June 1835 (Figure 3, TD1–66 and TE1–21 respectively).Footnote 3 It also presents 19 coastal profiles in the Gulf of Aden indicating significant landmarks (Figure 3, P1–19), while numerous lesser ones appear throughout. The chart depicts three religious buildings (Figure 3, B1–3) and nine flags (Figure 3, FL1–9).
As B. Arunachalam first noted,Footnote 4 numbers inscribed along the margins of the chart indicate latitude in terms of the altitude of Polaris, the pole star (Figure 3). The easily observable fact that Polaris appears at a higher altitude to an observer at a more northerly latitude, and lower to one further south, informs a long-standing Indian Ocean navigational tradition of establishing latitude according to this variation.Footnote 5 The numbers comprise a scale of whole numerals, with quarter divisions indicated by tally marks (I, II, III). The tacit unit is the standardised thickness of a finger—iṣbaʿ in the Arabic traditionFootnote 6—measured simply using the fingers of an outstretched hand or hands, or with a kamāl, a small wooden board fixed to the end of a string.Footnote 7 The numbers appear on the chart along both coasts of the Red Sea, but only along the Arabian shore of the Gulf of Aden, for reasons discussed below. We also identify three further ‘spot’ altitudes within the chart itself: two are on the island of Socotra—one halfway down its ‘vertical’ coast and one at its southern point; the third is at Ra’s Filuk (TD53) on the Somali coast.
Confirmation that these numbers are indeed Polaris-altitude markers comes from the appearance alongside most of the arrow-like symbol ![]() for Polaris used in regional stellar compasses (Figures 3 and 5). The absence of this symbol from the African coast north of Massawa (TD61) reflects a sketchier notational approach in this portion of the chart generally. Elsewhere, however, there appears a certain precision of intent in their positioning: one of the numbers—7(III) on the Arabian coast—has been correctively repositioned (Figure 3).
for Polaris used in regional stellar compasses (Figures 3 and 5). The absence of this symbol from the African coast north of Massawa (TD61) reflects a sketchier notational approach in this portion of the chart generally. Elsewhere, however, there appears a certain precision of intent in their positioning: one of the numbers—7(III) on the Arabian coast—has been correctively repositioned (Figure 3).
The chart also shows 29 stellar sailing rhumbs (Figure 3, R1–29), all but four of which have a ship depicted as if sailing along them. In most cases, the ends of each rhumb terminate with a symbol representing a direction on the western-Indian star compass (Figure 5). This is usually accompanied by one of two Devanagari letters: ઉ (u) is an abbreviation of Gujarati ugman, meaning ‘rising’, while the letters ![]() (ā) and
(ā) and ![]() (a) are abbreviations of āstaman, meaning ‘setting’.
(a) are abbreviations of āstaman, meaning ‘setting’.
“Star compass” diagram summarising the sailing directions indicated on the RGS chart. The outer circle indicates whether the directions are based on the rising (right) or setting (left) positions of the star (or stellar group) in question, with N and S notionally stationary. The segmented circle within shows the symbol for each stellar direction as given on the chart, together with its western-Indian name and notional azimuth, based on equal divisions of the circle. The inner portion shows the astronomical names of the stars/stellar groups indicated by these symbols, together with their actual rising and setting azimuths: note the discrepancies between notional and astronomical azimuths, which are most stark for stars in the southern sky. Source: John P. Cooper.

The ‘compass’ in question is not an instrument, but rather an intangible knowledge system based on celestial observation whereby a navigator uses the known rising and setting azimuths of 15 stars (or star clusters) on the horizon, as well as the almost-stationary Polaris and a notional due-south point, to establish direction of travel. The compass-card diagram itself is simply an aide memoire. Figure 5 is our own version of such a card, consolidating the information found on the RGS chart. The outer portion of the card presents each stellar symbol alongside the name attributed to it in the western-Indian tradition, as well as its notional rising and setting azimuths, implicit in the geometry of an equally segmented circle.Footnote 8 Meanwhile, the inner circle provides the astronomical names of the stars those symbols represent, together with their true azimuths, drawing on both ArunachalamFootnote 9 and Hasan Shihab.Footnote 10
Some rhumbs also have numerals written alongside them, roughly midway along their length. These are, implicitly, journey time/distance measurements in the jām unit, a hypothetical measure of time/distance representing the typical sailing distance covered by an ocean-going vessel under favourable conditions during a standard three-hour watch.Footnote 11 It equates to a change of one-eighth of a finger-width on the Polaris-altitude scale when sailing due north–south, or some 20 km.Footnote 12 The division of the day into eight jāms appears to be linked to the eight Indian pahars, by which the nautical watch was counted.Footnote 13
Acquisition history
The chart transitioned from working navigational document to imperial trophy through Burnes’s acquisition of it in May 1835.Footnote 14 A lieutenant in the East India Company Service and assistant to the British Resident in Kachchh,Footnote 15 Burnes had by that time won celebrity through his 1832 imperial expedition across Central Asia, which had resulted in a best-selling book,Footnote 16 honours from London learned societies, including the RGS,Footnote 17 and an audience with King William IV.Footnote 18 It was soon after returning to Kachchh following these adventures that Burnes made his acquisition. His declaration that it would ‘form a specimen of naval surveying … unequalled in any of the cabinets of Europe’Footnote 19 underlines the reciprocity of imperial endowment inherent in his donation of it to the RGS; it was one of several such gifts he gave to London learned societies, including the Royal Asiatic Society.Footnote 20
Of the acquisition, Burnes writes: ‘I procured it from the “moalum”Footnote 21 (pilot) of a boat which had just finished the voyage, and in which I myself sailed from Bombay to Kutch [Kachchh].’ He declines to name the pilot, though he remembers that of the vessel: the 30 t Veerasil had sailed from Mandvi, Kachchh, in early 1835, commanded by ‘a Mahommedan’ with ‘a crew of five Moslems, three Rajpoots and a young negro boy’Footnote 22—all terms exposing Burnes’s colonial gaze. The ‘voyage’ in question had ‘stretched out at once to the sea, made the coast of Arabia, and touched at Sere [=al-Shihr], Maculla [=al-Mukalla], and Aden, disposing of […] goods as they proceeded, till they reached Barbar[a] [=Berbera], in the sea of Babool-Mandeb [=Bab al-Mandab], and outside the Straits of that name’.Footnote 23 Berbera was the site of an annual fair attracting around 100 Indian vessels, he says.Footnote 24 Burnes does not relate the vessel’s itinerary thereafter, but he reports that the chart had successfully ‘served the purpose of the voyage’.Footnote 25
Dating
Burnes’s 1835 acquisition provides a secure terminus ante quem for the manuscript’s production.Footnote 26 Previous scholars have suggested composition dates in the late eighteenth or early nineteenth centuries without offering rationales,Footnote 27 but their view is tacitly supported by Burnes’s report that it had been a working document used on board ship—an environment that does not make for the longevity of a work on paper. Norbert Weismann suggests an eighteenth-century date, based on the illustrated ship types.Footnote 28
Palaeographic evidence broadly concurs. The chart’s toponyms are written in a script that retains the shirōrēkhā, suggesting it was written before the nineteenth century, by which time Gujarati script had largely dropped this feature.Footnote 29 Retention of the shirōrēkhā in a nineteenth-century document would suggest an official or elite document—uncharacteristic of this chart. Moreover, the Devanagari is archaic in other ways: for example, the letter ‘a’ appears as ![]() , rather than evolved Devanagari अ.Footnote 30
, rather than evolved Devanagari अ.Footnote 30
Establishing a terminus post quem for the chart is more challenging. A typological comparison with other Kachchhi-Gujarati nautical documents enables us to place it within a wider regional chart-making tradition, conventions of which were already in place in the seventeenth century.Footnote 31 Arunachalam describes two manuscripts in India’s National Archives, one (m.s. 82.263) dated to VS 1720 (1663–1664) and the other to VS 1836 (1785–1786). The former contains five charts, covering Karnataka, Kerala, southern Tamil Nadu, and Sri Lanka;Footnote 32 the latter includes a single chart of the island of Diu, off Gujarat.Footnote 33 These show multiple similarities with the RGS manuscript that Joseph Schwartzberg describes as ‘striking’.Footnote 34 They include schematic coastlines, Polaris-altitude indicators, stellar rhumbs with associated jām measures, ship illustrations, coastal profiles, flags, and symbolic conventions for coastal trees, islands, reefs, and shoals. Meanwhile, the treatment of Diu in the second manuscript is almost identical to the RGS chart’s treatment of the island of Socotra. The same (second) manuscript also presents a star-compass card that uses stellar symbols similar to those of the RGS chart.Footnote 35 However, the symbologies appearing in the other manuscripts do differ somewhat;Footnote 36 for example, the charts of m.s. 82.263 indicate bathymetry and use an anchor symbol to signify an anchorage.Footnote 37
In contrast, a manuscript chart at St John’s College, Oxford, dating from circa 1750Footnote 38 and reported by Samira Sheikh,Footnote 39 demonstrates a distinct, albeit contemporary, western-Indian approach to marine cartography. Part of a sailor’s manual, this representation of the Gulf of Khambat is projected onto a graticule, north uppermost, a feature that Sheikh interprets as a product of European–Indian knowledge exchange in the cosmopolitan context of Gujarati ports.Footnote 40 Its depiction of a mosque at Khambat city nevertheless resonates with the portrayal of Islamic buildings on the RGS chart.
Further intimations of the terminus post quem for the chart—or an earlier version from which it might have been copied—come from its treatment of the city of al-Mukha. The name the chart gives to the city is Bandar Baṣā, or ‘Port of (the) Pasha’ (TD33), reflecting, possibly retrospectively, Ottoman control of the city from 1538 to 1636.Footnote 41 More specifically, the toponym given might reference Hasan Pasha (d. 1607), an Ottoman governor of Yemen who developed al-Mukha port significantly and who in 1590–1591 ordered the expansion of al-Shādhilī mosque and tomb, likely the building complex depicted on the chart (see the ‘Buildings’ section below).Footnote 42
The backing papers of the manuscript offer little further insight into the dating of the chart, since they make no reference to it (see the ‘Verso texts’ section below) and could have existed for any duration before being attached: we know only that they were in place when Burnes acquired it.
Past treatments
Since Burnes, the main interpreters of the RGS chart have been: Albert Kammerer in 1947, assisted by Edgar Blochet, who mainly transcribed and proposed some toponymic identifications; B. Arunachalam in 1987 and 2002,Footnote 43 who focused on its navigational qualities; and Norbert Weismann in 2012,Footnote 44 who restricted his interpretation to the depicted ships. The chart has also featured in a riposte by Lieutenant Dickinson to Burnes’s 1836 JRGS article,Footnote 45 in broader surveys of Indian cartography by Susan Gole,Footnote 46 Joseph Schwartzberg,Footnote 47 and Jean Deloche,Footnote 48 and by Samira Sheikh as a comparator to her Oxford manuscript.Footnote 49 It has also appeared in a volume celebrating India’s maritime heritage prepared for the Indian navy by Sadashiv Gorakshkar and Kalpana Desai,Footnote 50 and in a 2012 British Museum exhibition on the Hajj, there supporting a maritime-Hajj narrative.Footnote 51 More recently, Joy Slappnig has interpreted it as an artefact of imperial encounter with indigenous mapping traditions. Footnote 52
In concurrence with Burnes’s early characterisation of the chart as ‘rude’,Footnote 53 several (Western) scholars have overlooked the chart’s navigational affordances. As recently as the 1980s, both DelocheFootnote 54 and GoleFootnote 55 echoed Burnes’s counterfactual claimFootnote 56 that the chart is ‘without any reference to longitude and latitude’. Kammerer, meanwhile, noticed that the coasts on the chart are ‘divided into equal intervals with signs of numeration marking distances or serving as a scale’, without realising that these are Polaris-altitude indicators—hence, the very latitude indicators that he too claimed were absent.Footnote 57 Burnes, Deloche, and Gole are correct that the chart does not indicate longitude directly—but again the stellar rhumbs and jām measures written alongside provide important east–west dimensionality.
Following Burnes,Footnote 58 and followed himself by GoleFootnote 59 and Schwarzberg,Footnote 60Kammerer also claims that the chart is presented ‘without taking into account the 90° angle that the axis of the Red Sea makes with the Gulf of Aden’ (our italics).Footnote 61 While it is true that the Arabian and African coastlines are drawn on the same alignment, the chart nevertheless does account for the angle: the Polaris-altitude scale along the Arabian coast ascends numerically as one heads in both directions from the Bab al-Mandab Strait, hence indicating the coastal inflection. Meanwhile, the directions indicated by the chart’s stellar rhumbs—particularly those indicating the main coastal and mid-sea trends (see the ‘Rhumbs’ section below)—further emphasise that angle. Kammerer incorrectly describes these rhumbs as ‘unusable’.Footnote 62
Deloche, meanwhile, acknowledges the presence of rhumbs (his ‘marked bearings’) on the chart, but he singularly fails to see their significance to astronomical navigation. This failure leads him to conclude that ‘it was the coast which served as the primary reference’ for the region’s navigators and that their wayfinding skills were limited to ‘going from a recognizable promontory via such-and-such a rock formation to another cape’—in other words, not straying far out of sight of land.Footnote 63 Bizarrely, he argues that Kachchhis did resort to astronomical and/or magnetic navigation—but only once they were in the open ocean ‘[b]eyond [i.e. east of] the Soqoṭrā islands’.
It was Arunachalam who first recognised the astronomical affordances of the chart.Footnote 64 His relatively brief treatment does not delve into toponymy, but he does present a projection of the chart that takes into account its Polaris-altitude and stellar-azimuth data as well as jām measurements which, he argues, ‘speaks for itself of the richness and precision of detail’ of the work.Footnote 65 His contextualisation of the chart within a western-Indian manuscript tradition, and with it an intangible knowledge tradition, informs our interpretation.
Identifying and locating the chart’s Devanagari toponyms has been the principal focus for a number of researchers, albeit with limited success. Burnes’s English notations identify 13 of these—about a fifth. Kammerer later presents Blochet’s attempted Latin transliterations of them all:Footnote 66 between italicisations in Blochet’s list denoting ‘identified’ locations and the marginal notes appearing on accompanying plates, Kammerer claims, implicitly, to have identified the real-world locations of more than one third. Yet he does not detail these in his publication. Arunachalam’s 1987 projectionFootnote 67 identifies a further two locations—Jabal Fartak (TD45) and Maydh Island (TD54). In sum, previous works have left some 55 per cent of the chart’s Devanagari toponyms unidentified and without real-world locations—with more still lacking precision. The results of our efforts, presented in the ‘Devanagari toponyms’ section below, propose coordinates using the WGS84 system for all 66 toponyms, improved transcriptions of the Devanagari script, and contemporary names for all but two of them (TD6 and TD7).
Methodology
Our approach began with a reading and new transcription of the chart’s Devanagari toponyms, all of which proved tolerably legible (see the ‘Devanagari toponyms’ section below). This allowed some obvious identifications, such as Jeddah (TD1) and Massawa (TD61) but left many others pending real-world identification. Partly in order to facilitate the identification process, we then transcribed the Polaris altitudes, tabulating the distribution of the Devanagari and English toponyms relative to them (Table 1). The distribution on this scale of toponyms with known real-world locations allowed a broad calibration of the chart’s latitude system: this in turn supported the identification of further toponyms—and also, later, unnamed features—by bounding potential search areas between known toponyms and latitudes.

Meanwhile, the first step in understanding the chart’s rhumbs was to identify the stellar symbols depicted at their termini and transcribe the jām measurements written alongside them where present. This analysis allowed us to introduce an east–west dimensionality into our interpretation of the chart. Applying the azimuths and jām measurements indicated on those rhumbs alongside the already established Polaris altitudes enabled a projection of the chart in the manner of ArunachalamFootnote 68 but with the added advantage of a full set of identified toponyms.
Our identification and location of the toponyms in the real world was helped significantly by access to online geospatial resources. We compared the transcribed toponyms with locations on Google Earth Pro,Footnote 69 online hydrographic and landscape-elevation websites,Footnote 70 pilot guides, and other historic cartography. We established primary correlations based on linguistic similarities, corroborated through relative locations. The real-world location for toponyms that had no obvious linguistic correlation to a contemporary place was sometimes suggested by candidate landscape features between known toponyms, often aided by linguistic elements within the toponym. For example, ‘Maras…’ (e.g. TD14, TD16), suggests the Arabic marsā, or ‘anchorage’, and ‘Rāsal…’ (e.g. TD4, TD9), suggests the Arabic ra’s al-…, or ‘headland (of)’. Further iterations of the identification process used the termini of stellar rhumbs, nearby depictions of coastal panoramas, and the drawn characterisation of a given location on the chart (e.g. as coastal settlement, island, or reef).
The most prominent landmark profiles of the chart (Figure 3) were identified primarily with reference to adjacent toponyms, sometimes corroborated through comparison with profile sketches in other historical sources (see the ‘Landmark profiles’ section below). More subtly, a number of profiles without associated toponyms could be identified, albeit sometimes tentatively, using online remote sensing and landscape-elevation resources, assisted again by the suggestions of the chart’s pole-star altitude indications, stellar rhumbs, and location relative to identified toponyms.
Inferences made possible by the above methods also allowed us to propose identifications for numerous unnamed features drawn on the chart—some 50 in total (see the ‘Unnamed locations’ section below). This was particularly the case for the many islands and archipelagos but also for reefs, lagoons, and headlands. This took the number of identified locations on the chart to 116.
Finally, comparison of other tacit symbology (e.g. reefs, trees, shallows) with other Indian and Gujarati navigational manuscripts enabled an augmented understanding of abstract symbology used on the chart (see the ‘Symbology’ section below). We also sought to identify the three buildings drawn on the chart with reference to historical sources (see the ‘Buildings’ section below).
Regarding the verso texts, we limited our efforts to appraising the extent to which they might inform our understanding of the chart itself—particularly around dating. We therefore sought to verify previous assertions by Burnes (cf. his note on the attached paper), and later GoleFootnote 71 and Slappnig,Footnote 72 that the texts are unrelated to the chart in terms of subject matter, while also seeking evidence in palaeography and content that might help us date it.
Analysis
We now discuss the outcomes of the application of these methodologies.
Polaris altitudes
The Polaris-altitude scale on the chart ranges from a low of 4(II), at Socotra (TD48) and Ra’s Filuk (TD53), to a high of 11 at Jeddah (TD1). On the Red Sea’s African side, the scale’s upper limit is 9(II), considerably further north than the most northerly toponym there (Difnen, TD65). Numerals along the Arabian coast of the Gulf of Aden ascend to 7(II), just north of the al-Qara mountains in modern-day Oman (TD47). Table 1 shows the distribution of Polaris-altitude indicators on the chart relative to the toponym sequences.
The particular importance of the altitude of Polaris in north–south navigation is reflected in the presence of this scale on both of the Red Sea coasts and on the Arabian coast of the Gulf of Aden, all of which display a pronounced north–south trend. The scale is not depicted along the primarily east–west oriented Somali coast: the single marker at Ra’s Filuk (TD53) reflects the headland’s northerly projection into the Gulf of Aden, and suggests that sailors sought to hold that latitude while sailing east to clear the Horn of Africa and make the Socotra archipelago on their return voyage to India. The more northerly of the two points marked on Socotra, meanwhile, provides a latitude-keeping reference both to navigators heading east and those using the north-east monsoon to enter the Gulf of Aden from across the Arabian Sea: were a ship to veer further south, it might make landfall south of the Horn of Africa and be pushed off course down the African coast by the Somali current and monsoon winds.Footnote 73 Meanwhile, the lower of the Polaris-altitude indicators on Socotra indicates the latitude to maintain for vessels leaving Socotra for Cape Guardafui (TD52).
Rhumbs
The chart’s 29 rhumb lines serve three main purposes: establishing the principal trend of a coastline (rhumbs R9–11, R22, R27–28 in Figure 3); indicating a direction of travel across open water (R6–8, R12–21, R23–26, R29); and, in possibly two cases (R1 and R5), showing safe passage into and out of port. The information contained in these rhumbs is summarised in Table 2.
Summary of the 29 stellar rhumbs depicted on the chart, arranged by region and showing stellar azimuths and their geographical termini

* Although the rhumb is effectively bidirectional, we seek to avoid ambiguity by designating as 'bearing' the direction of travel shown by the ship drawn alongside the rhumb in question. The 'recipriocal' is, by definition, the reverse. Where no ship is depicted, we assign the leftmost end of the rhumb as the bearing, or the upper end of an absolutely vertical rhumb.
In most cases, as Figure 5 shows, some deviation occurs between the notional and real azimuths of a given stellar indicator in the star-compass system, particularly for stars in the south: Agasi (α-Eridani), for example, diverges a full –18.75° from its notional direction of 168.75°. Setting aside the fact that this situation reveals a poverty of indicators for directions tending south, this may initially appear more of a problem for diagrammatic representations of the compass than for its practical application—after all, seafarers derived actual direction from sighting actual stars, not from abstract diagrams. However, the problem becomes real when comparing the symbols at each end of the same rhumb. In principle, each of these should constitute a reciprocal bearing of the other. For example, setting (and rising) Uttadi appears on the star-compass card as the reciprocal of rising (and setting) Toran. In reality, the stars signified by the former, α(β)-Cassiopeiae, has an azimuth of –35.4°, and hence a reciprocal of 144.6°. Yet the true azimuth of αβ-Centauri, the stars signifying Toran, is 149.1°. Such a 4.5° deviation would put a vessel 4 NM off course after sailing 50 NM, when compared to sailing on the true azimuth of Toran. For rhumb 25, representing a 321 NM sailing between Ra’s Filuk (TD53) and Sadil (TD46), sailing on a true reciprocal would generate a deviation of some 113 NM compared to sailing on the stellar azimuth for that direction as the chart stipulates. This cannot be explained away by claiming that this was an attempt by the author(s) to compensate for the effects of wind and current: all but three of the complete rhumbs depicted on the chart have pairings of stellar symbols that are reciprocals of each other, in accordance with star-compass convention. The few exceptions are rhumbs R4, R19, and R20. In the first two of these, setting Ghosgir (α-Lyrae) is paired unconventionally with rising Sravan (α-Aquilae). Far from being mutual reciprocals, these azimuths intersect at 134°. On rhumb R20, meanwhile, Kritika (Pleiades) is presented at both ends: here the intersection is an angle of 157.5°. These might be errors on the part of the chart’s creator(s), or they might constitute some form of correctivefor wind and current, even though such corrections are not applied to other rhumbs. What we must conclude in any case is that navigators were able to mitigate the errors inherent in the star-compass system by recourse to complementary situational wayfinding methods.
In addition to providing directional information, nine of the rhumbs guiding open-water crossings in the Gulf of Aden are accompanied by jām measurements written alongside them in numerical form (R16–21, R23–25; Table 2).Footnote 74 In contrast, the chart applies no jām measurements to rhumbs in the Red Sea. Further, all those jām measurements in the Gulf of Aden inform open-sea crossings: those rhumbs without jāms are either coastally aligned or incomplete due to damage. We argue, contra Arunachalam,Footnote 75 that the reason for this is not that the creator(s) of the chart knew the Red Sea less well, but rather that dependence on the relatively inaccurate jām system was restricted to open-water crossings with a marked east–west component, making landfall on coastlines with a marked east–west trend. In coastal sailing generally, navigators could rely upon landmarks to mark progress. On routes with a significant north–south component, such as in the Red Sea, they could additionally draw upon Polaris altitudes. It was only when no other corroborating information was available that navigators had recourse to the jām system.
The two information systems of Polaris altitudes and rhumbs should not be seen as always operating in isolation from each other. For example, it should be noted that the northern ends of Red Sea rhumbs R2, R3, R4, and R8 (Figure 3) do not end at named destinations. Indeed, two of them terminate mid sea. This suggests that they were intended to deliver the navigator safely north to a desired latitude rather than to a specific location, after which decisions on where to go next could be made. A passage from Kachchhi sailing manual m.s. 82.263 of 1663–1664 (VS 1720) suggests how this worked.Footnote 76 It describes how a ship reaching a latitude of 6.5 ‘fingers’ when sailing north from the Bab al-Mandab Strait should head on a bearing of setting Pohi to reach Kamaran Island (TD30), while taking a bearing on setting Uttadi at a latitude of 8 fingers would lead to Jizan (TD18).
The spatial data provided by the rhumbs, taken alongside the Polaris elevations, allows us to attempt a spatial projection of the chart (Figure 6). This projection prioritises Polaris-altitude data and uses the stellar azimuths of key rhumbs to establish the central axis of the Red Sea and the trajectory of coastlines as well as triangulating the latitude of points on the Somali coast where no latitude data is available. We project each rhumb according to the stellar symbol at its more northerly end. Where following a stellar azimuth generates an obviously inaccurate outcome, we anchor the rhumb instead to the known toponyms at each end. The projection that emerges stands a refutation of those authors who claim, in Burnes’s words, that the chart was effectively ‘without any reference’ to latitude or longitude.Footnote 77
A projection of the spatial information represented on the chart based on Polaris altitudes and stellar rhumbs, together with the contemporary places indicated by its Devanagari toponyms. The projection privileges Polaris-altitudes where these clash with rhumbs. It uses the stellar azimuths indicated by rhumbs to establish the axis of the Red Sea as well as coastal trends, where available. Rhumbs indicating sea crossings that appear contradictory are reconciled with reference to toponyms and Polaris altitudes. Source: John P. Cooper.

Devanagari toponyms
The Devanagari toponyms locate sites of navigational, economic, and political relevance to Kachchhi-Gujarati seafarers in the southern Red Sea and Gulf of Aden: a complete inventory appears in Table 3, alongside our identifications of their real-world locations, including WGS84 co-ordinates.
Summary of the Devanagari and English toponyms depicted on the chart, transcribed and correlated with real-world identificationsa

*Key: A. Resemblance to contemporary toponym; B. Toponym and location indicated in historic cartography/pilot guides; C. Position in toponymic sequence; D. Position on Polaris-altitude scale; E. Location at terminus of rhumb.
a R. Kirk, Kotumbool bearing E, pencil drawing, 6 x 17.5 cm (Picture Store, RGS-IBG Collections, 1831); Survey of Egypt, Farisan Bank: Northern Portion and Approaches to Lith (Cairo, 1917); J. B. B. D’Anville, Africa, performed by the Sr. Danville under the Patronage of the Duke of Orleans, revised and Improved by Mr Bolton (London, 1774); G. H. Richards, Harbours and Anchorages in the Red Sea (London, 1873), T. Elwon and H. Pinching, Chart of the Islands and Outer Reefs from Ghesan to Cameran (London, 1804); R. Kirk, Loheia, Red Sea, ink, wash and sepia drawing, 10.5 x 10 cm (Picture Store, RGS-IBG Collections, 1852); R. Kirk, Jibul Teer, watercolour, 14 x 27 cm (Picture Store, RGS-IBG Collections, 1841); W. J. L. Wharton, Kamaran Passage and Southern Approaches (London, 1919); R. Kirk, Jibul Zugger S by W, 25 miles volcanic, pencil drawing, 6.5 x 15 cm (Picture Store, RGS-IBG Collections, 1833); J. De Castro, Tábuas dos roteiros da Índia (Biblioteca Geral da Universidade de Coimbra, 15–); Admiralty, A Rough Plan of Sheikh Syed near Bab-El-Mandeb by the Officers of H.M.S. Nassau (London, 1870); J. Walker, Chart of the Gulf of Aden, Surveyed by Captain Haines, Lieuts Barker and Grieve, Indian Navy (London, 1847); S. al-Mahrī, ‘al-Minhāj al-Fākhir fī ʿIlm al-Baḥr al-Zākhir,’ in al-ʿUlūm al-Baḥriyya ʿInd al-ʿArab: Taḥqīq wa-Taḥlīl, (ed.) I. Khūrī (Damascus, 1970); S. B. Haines, Chart of the South East Coast of Arabia on Mercator’s Projection, Compiled from a Trigonometric Survey (London, 1858); A. Lasor a Varea, Universus Terrarum Orbis Scriptorum (Patavii, 1713); R. Kirk, Island Howakel, Island African Coast, SW 1/2 S, 12 Miles, pencil drawing, 10 x 24.5 cm (Picture Store, RGS-IBG Collections, 1832); W. J. L. Wharton Anchorages of the Coast of Arabia (London, 1888); F. J. Evans, Musawwa’ Channel, Surveyed by Captain T. Elwon and Commander R. Moresby I.N. 1830–34 (London, 1876); F. J. Evans, Musawwa’ Harbour (London, 1878).
Arabian coast: Jedda to Kamaran Island (TD1–27, TD30)
This circa 800 km stretch of the Arabian coast encompasses over 40 per cent of the chart’s Devanagari toponyms—reflecting both the knowledge of its creator(s) and the region’s complex marine topography. The sector’s many reefs, shoals, and islands demand careful navigation, not least around the Farasan Bank, the Farasan Islands, and the islands of Yemen north of Kamaran. The region also includes the prominent ports of Jeddah (TD1), al-Qunfudha (TD13), Jizan (TD18), Farasan (TD19), al-Luhayya (TD22), and Kamaran (TD30). Lesser havens are intimated in the Devanagari toponyms beginning ‘Maras…’: from north to south, these correspond to today’s Marsa Mujayrama (TD8), Marsa Qishran (TD10), Khawr al-Qahma (TD14), and Khawr al-Harida (TD16)—khawr being the Arabic word for an inlet. Four headlands (TD4, TD7, TD9, TD17) are also highlighted: the reef-fringed Ra’s al-Aswad (TD4) heralding imminent arrival at Jeddah, with Rāsal Japhan (TD9) and Ra’s al-Tarafa (TD17) probably signalling anchorage opportunities nearby, the former at Marsa Mujayrama (TD8) or Marsa Qishran (TD10)Footnote 78 and the latter Khor Abu al-Saba (also known as Dana Bay) (Figure 3).
Of the plethora of islands along this section of coast, the chart names only 11 but depicts over 50. Two of the toponyms are the already mentioned Kamaran and (Greater) Farasan. Of the others, a tight cluster of six (TD21, TD23–27) are clearly important in the approach to al-Luhayya: broadly the same group is noted in the cartography of Jean-Baptiste-Nicolas-Denis d’Après de MannevilletteFootnote 79 and Louis de la Rochette.Footnote 80 The southernmost two of these islands, al-Bawdi (TD26) and ‘Uqban (TD27), also form the northern fringe of a safe channel into what the 1892 Red Sea and Gulf of Aden Pilot calls ‘the remarkably fine’ Kamaran Bay.Footnote 81 The other three named islands are Jabal al-Lith (TD11), Sirrayn (TD12), and Jabal Kadambal (TD15). All are highly visible due to their elevations and isolation. The Red Sea and Gulf of Aden Pilot describes Jabal al-Lith (a.k.a. Abulat Island) as having ‘a high and very conspicuous rock’ on its western side.Footnote 82 As ‘the northernmost island in the Far[a]san bank’, it signalled a transition between the relatively clear waters to the north and a proliferation of shoals to the south. Meanwhile, Sirrayn sits at the northern end of a 50 km island chain running north–south, largely comprising the Kefil and Fara islands.Footnote 83 It therefore signals the northern entry point to an ‘inner channel’ route between al-Lith and Kamaran.Footnote 84 Finally, Jabal Kadambal heralds proximity of the navigator to the anchorages of Khalij al-Qahma (TD14) for those heading north and Khawr al-Harida (TD16) for those southbound. Hence, all the named islands served important navigational functions.
Of the myriad reefs along this coast, the chart names just four—Shi’b Mismari (TD2), ‘Irq al-Ghurab (TD3), Shi’b Qubbayn (TD5), and a reef called Gāphāt/Gārāt (TD6) in Devanagari on the chart, for which we can offer no contemporary toponym but do suggest a location (Table 3). The first three reefs are in themselves unremarkable surface-breaking reefs of modest dimension (between 570 m and 670 m). They are, however, just 12 km apart and as such act as landmarks on the approach to Jeddah Bay: an associated rhumb (R1) shows the stellar azimuth to follow from Shi’b Mismari when approaching Jeddah harbour (and vice versa). These three reefs are noted as navigationally significant as far back as the fifteenth century; they are mentioned by both Ibn Mājid (d. circa 1500) and, later, Sulaymān al-Mahrī (d. 1550).Footnote 85 Ibn Mājid names Shi’b Mismari as a point of choice between two southbound routes for vessels departing Jeddah. Sulaymān al-Mahrī provides an onward bearing from there to ‘Irq al-Ghurab.Footnote 86 The reefs are also noted on eighteenth-century European charts, including those of d’Après de Mannevillette,Footnote 87 de la Rochette,Footnote 88 and nineteenth-century British Admiralty charts.Footnote 89 We locate Gāphāt/Gārāt (TD6) on the basis of its Polaris altitude, position relative to other toponyms, and its drawn representation; we suspect it is the ‘Gaban’ of d’Après de Mannevillette.Footnote 90
Kamaran to the Bab al-Mandab Strait, Arabian coast (TD30–31, TD33–37)
The chart provides far less toponymic detail along the 300 km of Arabian coast from Kamaran Island to the Bab al-Mandab Strait. Here, ships were no longer restricted to an inner channel fringed to seaward by shoals and islands and so required less cartographic detail. The local toponymy includes the region’s two major coffee ports—al-Hodeida (TD31) and al-Mukha (TD33). As noted above, the latter appears as Bandar Baṣā.Footnote 91
We identify the almost identical toponyms Nākhala and Nakhala (TD34 and TD35), as derived from the Arabic nakhla, meaning ‘(date) palm’, and hence referring to palm groves visible from the sea. We associate these collectively with the coastal plain between the villages of Wahiyah and Quddam, comprising the alluvial zone of the Wadi Mawza’. The presence of these groves is corroborated on John Outhett’s Red Sea chartFootnote 92 and a 1902 Anglo-Turkish border agreement map.Footnote 93
The Devanagari toponym Makām Mēśan (TD36) appears just north of the Bab al-Mandab Strait. The first part of this name suggests a sheikh’s tomb (Ar. maqām or ‘shrine’). We interpret it as signifying Sheikh Saʿīd, a name historically associated with the Bab al-Mandab peninsula, with a small headland on it, and with an adjacent inlet today called Khawr al-Ghureira.Footnote 94 We discuss the building associated with this toponym in the ‘Buildings’ section below.
The final toponym in this sequence is Bābanā Cōṭī'ā (TD37), the initial Bāb referencing the Arabic for ‘gate’ or ‘door’ and hence the Arabic toponym Bāb al-Mandab (‘Gate of Tears’). We interpret the remaining portion as referencing the Gujarati and Kachchhi word cōṭī, signifying a summit, and hence one of the peaks of the Bab al-Mandab peninsula—Sakhrat al-Aydrus or Jabal al-Manhali. It is also plausible that this part of the toponym could reference the Urdu and Hindi word for ‘small’, and hence the narrower of the two channels of the Bab al-Mandab Strait, called in English the ‘Short Strait’.
The mid-channel Red Sea islands (TD28–29, TD32)
The chart names three islands along the central axis of the Red Sea: Jabal al-Tayr (TD28); Saba Island (TD29) in the Zubair archipelago, and Jabal Zuqar (TD32). All three were highly significant waypoints for mid-sea sailing—a fact emphasised on the chart by the convergence of rhumbs on them. The elevations of Jabal Zuqar (614 m) and Jabal al-Tayr (244 m), as well as the latter’s active volcanic status, underline their visibility from afar. Saba Island is in reality hidden from sailors heading north by the 189 m Jabal Zubair, which goes unnamed; however, the former offered better anchorage opportunities.
The Bab al-Mandab Strait to Jabal al-Qara, Arabian coast (TD38–47)
The chart offers just ten Devanagari toponyms for the entire 1,100 km stretch of the Arabian coast of the Gulf of Aden. Compared to the Red Sea, these coastal waters are much more open and less treacherous.
Heading east from the Bab al-Mandab Strait, the first toponym indicates the anchorage of Khawr ‘Umayra (TD38).Footnote 95 Next is the anchorage at Ra’s ‘Imran (TD39): the initial ‘Hasana…’ of the Devanagari perhaps reflects the Arabic ḥiṣn (fort), and hence, perhaps, the fortification on nearby Abu Shammah Island. Next along the coast is Samasana (TD40), suggesting the mountain of Jabal Shamsan on the Aden peninsula; its panoramic profile (P5) is also clearly depicted (see ‘Landmark profiles’ section below): interestingly, the chart does not name Aden itself, despite Burnes’s addition of that toponym in English (TE8). We identify TD41 (Dārajhīn), with less confidence, as the coastal settlement of Hawra, based on its pole-star altitude and the adjacent coastal profile (P7). The St John’s College manuscript also lists a Dārcīno in a broadly similar location—but it also names the next settlement on its list as Enanhavar, perhaps a better candidate for Hawra.Footnote 96 Next, TD42 signifies the ancient port site of Qana;Footnote 97 the adjacent anchorage of Bandar Husn Ghurab comprises ‘a small, secure, and well-sheltered bay’.Footnote 98 Next, the bay at Burum (TD43) represents a ‘secure anchorage during the southwest monsoon’.Footnote 99 Notably, the chart does not indicate the port of al-Mukalla (TE9), which again Burnes marks in English. The next toponym indicates al-Shihr (TD44; TE10), a town with a fort and ‘open roadstead’.Footnote 100 Beyond the important landmark of Ra’s Fartak (TD45), the toponymy leads us into modern Oman. Here the two remaining toponyms are not ports or anchorages but high coastal mountain ranges: Sadil (TD46) signifies highlands between al-Fatk and Kharfat rising to 1,228 m, while Karī'ā (TD47) signifies the 754 m Jabal al-Qara range behind the port of Salalah, which, curiously, is not named.
The Socotra archipelago (TD48–51)
The chart identifies the four principal islands of the Socotra archipelago—Socotra (TD48), Darsa (TD49), Samha (TD50), and ‘Abd al-Kuri (TD51)—as well as unnamed minor islands discussed in the ‘Unnamed locations’ section below.
Cape Guardafui to the Bab al-Mandab Strait, African coast (TD52–56)
The chart indicates just five Devanagari toponyms along the circa 1,000 km African coast of the Gulf of Aden. Four of these are prominent and unique landmarks, discussed further in the ‘Landmark profiles’ section below: Cape Guardafui (TD52), Ra’s Filuk (TD53), Maydh Island (TD54), and the main island of the Sawabi’ Islands group (TD56). We identify Maydh Island on the basis of its island character, location, and position at the end of stellar rhumbs inbound from known locations. The toponym Hitva (TD56) might derive from the Persian word for ‘seven’, reflecting the Arabic name for the islands of the Sawabi’ group. The main island of the group is not only high and visible from 48 km off; it also offers ‘an excellent boat-harbour protected from all winds except those between North and East’.Footnote 101
The Bāb al-Mandab Strait to Massawa, African coast (TD57–61)
The circa 500 km of Red Sea African coast between the Bab al-Mandab Strait and the major port of Massawa (TD61) contains no toponyms in its southern half. Meanwhile, all those in its northern portion are islands. We identify the latter as the island of Kordumu'it (TD57), the Hawakil Bay islands of Hawakil (TD58) and Dahaila Kebir (TD59), and finally the major island of Dahlak Kebir (TD60), which flanks the channel northward to Massawa (TD61). Kordumu'it is significant as the last of a series of islands and peninsulas punctuating the African coast on the northward journey from the Bab al-Mandab Strait, and the first when heading south after a circa 100 km stretch of coast featuring almost none. Meanwhile, Hawakil is the most prominent island in Hawakil Bay, with dark volcanic hills rising to 194 m and ‘scanty wells’;Footnote 102 it was notable enough to prompt the surgeon-artist Rupert Kirk (1806–1852) to sketch its profile during his Red Sea travels.Footnote 103 It also heralds the approach to the channel leading to Massawa between the Dahlak archipelago and the mainland. Dahaila Kebir’s inclusion on the chart appears to be due to its extensive mangroves, still extant today, which are indicated on the chart with tree symbols. As well as making the island visually unique, the mangroves may have offered timber for firewood or ship repairs. Finally, the appearance of Dahlak as a toponym is no surprise, given that it refers to both the largest island on the Red Sea’s African coast and its attendant archipelago.
North of Massawa, African coast (TD62–66)
If we interpret the chart as depicting the African coast of the Red Sea to the same latitude as Jeddah on the Arabian side, then the section north of Massawa (TD61) represents some 700 km of coastline, the southern 300 km of which the Red Sea and Gulf of Aden Pilot describes as ‘almost devoid of easily recognisable landmarks’.Footnote 104 The chart provides only five toponyms for this coast, all of which appear along 120 km of the featureless southern portion. Three are mainland locations and two islands: collectively they flank what modern pilots and charts refer to as the North Massawa Channel,Footnote 105 which avoids the worst of the Dahlak Bank shoals. Having cleared Ra’s Harb (TD62) heading northbound, the island of Dohul (TD63) flanks the channel to the east; it may also have been a prompt for navigators to put in for water at Ra’s Turrec (TD64), which in the nineteenth century was the site of large cisterns.Footnote 106 We interpret this as the location corresponding to the Devanagari toponym Pāṇīvāmahatana. The initial pāṇī of the Devanagari reflects the Gujarati and Kachchhi word for ‘water’. Alternatively, the name could also be read as ‘pāṇī vām 6 ta[?] 7’ (i.e., ‘the water is 6–7 vām (fathoms) deep’).Footnote 107 If true, this is the only instance in the entire chart of a reference to water depth. Further north, the prominent island of Difnen (TD65) indicates the northern limit of the Dahlak Bank.Footnote 108 Its appearance also signals the presence on the mainland shore at that latitude of ‘two small boat anchorages’ at Marsa Mubarak (TD66) and Marsa Ibrahim.Footnote 109
English toponyms
Burnes’s English toponymy (Figure 3; Table 3) comprises 21 additions to the chart and constitutes a first attempt to orientate the document for a new, European-colonial readership. These are written in two distinct styles: a cursive script of variable neatness identifies ‘The Red Sea’ (TE20) and ‘Straits of Babool Mandeb’ (TE21) as well as the regional ports of ‘Hodeida’ (TE3), ‘Mocha’ (TE5), ‘Maculla’ (TE9), ‘Sere’ (TE10), and ‘Musooah’ (TE19): all have flags and/or buildings to underscore their prominence. The only other English toponym written cursively is ‘Barbara’ (TE18)—again a port, but not one that is noted at all in Devanagari, even though the last-ever practical use of the chart, on the Veerasil, included a visit there. The navigationally important islands of ‘Jabbul Zekir’ (TE4) and ‘Abdool Curia’ (TE13) are noted in the same hand. The remaining 11 English toponyms are written in a cruder block script; all but two (‘Perim Island’ (TE6) and ‘Aden’ (TE8)) have Devanagari correlates. Again, all of these represent ports or locations of primary navigational significance—‘Jedda’ (TE1), ‘Kamran Island’ (TE2), ‘Perim Island’ (TE6), ‘Aden’ (TE8), ‘Sadil’ (TE11), ‘Socotra/Socotra groupe’ (TE12/TE14), and (for a second time) ‘Barbara’ (TE18).
It is noteworthy that almost all of the English toponyms identifying locations appear at the ends of rhumbs. This might suggest a first-pass attempt by Burnes to understand the chart, led by its rhumbs and flags, and presumably assisted by his uncredited informants.
Landmark profiles
The importance of terrestrial landmarks—islands, headlands, and mountains—in the wayfinding strategies of Indian Ocean sailors is abundantly apparent from the chart. Identifiable by their unique outlines, often visible from far offshore, such elevations offer definitive visual confirmation of location. The inclusion of such landmark profiles is widespread within western-Indian manuscripts,Footnote 110 Arab pilot-books,Footnote 111 and European cartography, including British East India Company and Admiralty charts. Footnote 112 The orographic formation of stationary cap clouds above high peaks can make these locations apparent long before they are directly visible.
Amid the generic, lobular, black-and-red indication of mountainous topography suggested along all coasts, the chart also individuates specific headlands, mountains, and individual islands by way of distinct drawn profiles—mostly in black silhouette edged with red. The most prominent of these are in the Gulf of Aden (features P1–19; see Table 4 and Figure 3). Nine are shown as the landfalls of rhumb-guided open-sea crossings and the rest as confirmatory waymarkers along coastal routes. Of the landfalls, Mayyun Island (P1, 65 m) and Ra’s Bab al-Mandab (P2) with the adjacent Jabal Manhali (232 m) signify arrival at the pivotal Bab al-Mandab Strait,Footnote 113 while Jabal Khawz (P3, 805 m) and Jabal Shamsan (P5, 541 m) indicate the safe Yemeni-coast harbours of Khawr ‘Umayra (TD38) and Aden (TE8), respectively.Footnote 114 Cape Guardafui (P18, 276 m) marks the critical inflection point of the Horn of Africa,Footnote 115 and the lofty Hajir mountains (P14, 1,519 m) and ‘Abd al-Kuri Island (P17, 571 m) confirm landfall at the main islands of the Socotra archipelago.Footnote 116 Maydh lsland (P19, 125 m) is the only prominent island along some 950 km of Somali coast; as well as a highly visible waymarker, a ‘remarkable cove’ there offers anchorage.Footnote 117 The remaining landfall indicator is the ‘very conspicuous’ Hawf mountain range (P12), which rises to almost 1,400 m.Footnote 118 Coastal profiles not occurring at the end of rhumbs include Ra’s ‘Imran (P4, 202 m), Jabal al-Dabab (P8, 392 m) and Jabal Dabdab (P9, 285 m), these indicating proximity to the significant Arabian ports of Aden, al-Mukalla, and al-Shihr, respectively;Footnote 119 the others are the prominent coastal headlands of Ra’s Fartak (P11, 901 m) and the twin ‘Ass’s Ears’ sugarloaf peaks near Ra’s Sharwayn (P10, 581 m).Footnote 120 Also represented are the exceptionally high mountain ranges of Jabal Yafai (P6, >1,980 m), the first range on the Arabian coast east of Aden,Footnote 121 and Jabal Fadli (P7, 1,659 m), further east again,Footnote 122 as well as Darsa and Samha, the lesser islands of the Socotra archipelago (P15, P16).
Identifications of coastal profiles depicted on the charta

a R. Kirk, Aden, ink drawing, 22.5 x 36.5 cm (Picture Store, RGS-IBG Collections, 1841); R. Kirk, Jebul Dabab NNE, ink drawing, 6.5 x 18.5 cm (Picture Store, RGS-IBG Collections, 1832); R. Kirk, Jibel Dabab bearing E, pencil drawing, 7 x 15.5 cm (Picture Store, RGS-IBG Collections, 1832).
The chart does also present individual landmark profiles in the Red Sea, but none are represented as major landfalls—a fact reflecting the north–south orientation of the sea and resultant lack of dependence on coastal features for rhumb-based open-sea crossings. Reflecting the sea’s topography, and in contrast to the Gulf of Aden, all profiles on the Red Sea are islands. Indeed, a great many of the circa 147 islands depicted in the sea are drawn with a sense of individuality—for example, as rectangles or with distinct numbers of lobes, suggesting various shapes and hence real, distinguishable, islands. The fact that some are shown with black fill and others unfilled presumably suggests the visual characteristic of the island in question: this certainly holds for the dark geology of Hawakil (TD58)—although hardly for Dahlak (TD60).
It is curious, meanwhile, that the chart apparently shows the major islands of the central Red Sea—Jabal Zuqar (TD32) and Jabal al-Tayr (TD28)—in plan view: it does the same for key reefs marking the approaches to Jeddah—Shi’b Mismari (TD2) and Gāphāt/Gārāt (TD6). Since it is otherwise uncharacteristic of the chart to depict features in plan, it might be that these suggest a borrowing from contemporary European charts, where plan views were standard.
Unnamed locations
Our identification and real-world location of the toponyms and landmark profiles allow us next to consider individual features on the chart that are represented but not labelled with toponyms, proposing identifications by virtue of their positions relative to these now-identified locales, as well as Polaris altitudes, the termini of rhumbs, and their drawn appearances.
The features in question are predominantly islands but also include reefs, shoals, promontories, and sea-bottom features. In some of the cases we present here, we have been able to identify individual features; in others, we have assigned names to groups of features belonging, for example, to an archipelago or a less-readily defined sequence of islands. Table 5 offers our identifications for 50 such ‘features’.
Proposed identifications of unnamed features (and groups of features) depicted on the charta

a H. P. Douglas, Farasan Islands, principally from a compilation by Lieut. G.M. Stitt, R.N. (London, 1929); R. Kirk, Jibul Zugger S by W. 25 miles volcanic. pencil drawing, 6.5 x 15 cm (Picture Store, RGS-IBG Collections, 1833); J. Washington, Sketch of Perim Island by Lieutenant H. Lamb I.N. 1857 (London, 1858); J. Walker, Chart of the Gulf Aden, surveyed by Captains Haines & Harless, Lieutenants Barker and Grieve, Indian Navy, Sheet 2 (London, 1853); A. Day, Gulf of Aden and Southern Part of the Red Sea (London, 1952).
Unsurprisingly, given the Red Sea’s navigationally challenging topography, almost four-fifths of these unnamed feature-groups occur there (L1–21; L33–50). On the Arabian side, these can be summarised (north to south) as reefs on the approaches to Jeddah (L1 and L2, located alongside named reefs TD2, TD3, and TD5); the many reefs and islands of the Farasan Bank (L5–8); islands of the Farasan archipelago (L9–14); shoals and islets north of Kamaran Island (L15); the Katib peninsula (L17) and associated shallows (L18) north of Hodeida; the peninsula and Tarafa islands that bound Khawr Ghulayfiqa (L18), terminating at Ra’s al-Mujamila; and hazards on the approaches to the bay of al-Mukha (L19).
Examination of these features helps explain their inclusion. The many reefs of Jeddah Bay often required the expertise of local pilots for successful navigation.Footnote 123 According to the Red Sea and Gulf of Aden Pilot, ‘being acquainted with the reefs and anchorages from eyesight, [these pilots] are always able to take a vessel among them with safety’.Footnote 124 As already noted, it was at Shi’b Mismari (TD2) that de la Rochette says such pilots boarded inbound ships.Footnote 125 Further south, the many shoals and islands of the Arabian coast (L5–16), particularly those of the Farasan Bank and Islands, as far south as Kamaran (L15), remain challenging to this day. Elaine Morgan and Stephen Davies warn that even contemporary charts are inaccurate and counsel sailors to ‘always navigate […] with circles of probable error […] of at least 2 miles’ and to ‘make daylight landfalls’.Footnote 126 At Kamaran, the shoals indicated on the chart at the northern side of the island should be understood as those fringing the southern edge of the same channel leading to Kamaran Bay that is bounded to the north by the islands of ‘Uqban (TD27) and al-Bawdi (TD26), discussed above. Further south, the peninsula spit and associated islands of Katib (L17) waymark the northern approaches to Hodeida: the enclosed bay there ‘is both irregular and shoal’.Footnote 127 Below al-Hodeida, a second spit, ending in Ra’s al-Mujamila, encloses Khawr Ghulayfiqa (L18), which the Red Sea and Gulf of Aden Pilot considers a good anchorage, albeit with a difficult entrance.Footnote 128 Finally, at al-Mukha, the chart is careful to note what the Red Sea and Gulf of Aden Pilot calls the ‘North’ and ‘South’ shoals (L19) flanking the al-Mukha roads.Footnote 129 Morgan and Davies also note the challenges posed there by strong south-east winds and dust storms. Footnote 130
On the African side of the Red Sea, this time moving from south to north, the chart indicates the complex inshore islands around Assab Bay (L33), Beraisole (L36), and Hawakil Bay (L40), together with those fringing Marsa Ibrahim and Marsa Mubarak (L47)—although not those around Khawr Nawarat further north. Other unnamed markers include the distinct and isolated volcanic peak of Sanahbor Gadir island (L34), the chain of volcanic islands between Beraisole and Halaba (L38), the low chain of islands between Ra’s Ardadda and Tio (L39), the islands near the tip of the Hartau peninsula (L41), and the myriad islands of the Dahlak group (L42–46). Offshore island groups include the Muhabbakah and Hanish Islands (L35 and L37), the islands of the Suakin Group (L48), and the island scatter including Talla Saghir, Talla Kabir, Taimashiya, and Dar Ah Teras (L49). These islands are clearly relevant to navigation out of sight of the coast; at least two—fringing features L37 and L48—seem directly related to rhumbs R4, R12, and R13 (Figure 3). Finally, our identification of L50 as the island-port of Suakin is certainly speculative, albeit following Kammerer,Footnote 131 and is based on our interpretation of the rosette-like symbol at that location.
The simpler coastal topography of the Gulf of Aden results in far fewer and more easily identified unnamed features than in the Red Sea. On the Arabian side, islands are limited to the small Shaikh Malu or Oyster Island (L20) close by Ra’s Bab al-Mandab, and the cluster of inshore islands by Qana (L23, TD42) that sit on the chart at the terminus of a rhumb. Meanwhile, the chart’s depiction of dot-stippling within bays such as Ghubbat al-Haykah (L21), Ghubbat Seilan (L22), Ghubbat al-Qamr (L25), and the bay at Salalah (L26), alert the navigator to sandy shallows and perhaps overfalls. On the African coast, the chart depicts just three unnamed features. Of these, the Khor Galweni lagoon (L30), near the landfall of Ra’s Filuk (TD53; also at the terminus of a rhumb) was accessible to larger vessels at high tide, with fresh water, cattle, and firewood available within.Footnote 132 The chart also indicates coastal shoals south of Zeila (L31, TD55), and the individual, lofty islands of the Sawabi’ group (L32; TD56), five of which the Red Sea and Gulf of Aden Pilot notes are visible from up to ‘30 miles [48 km] distant’.Footnote 133
Within the Socotra group, unnamed locations include the small but navigationally prominent Sabuniya Island (L27) and the Ka’l Fir’awn pillars (L28); both features appear white from afar, their colour and height (circa 50 m and 86 m, respectively) making them visible from up to 30 km away.Footnote 134
Buildings
The chart presents illustrations of three built structures, all of which we interpret as Islamic buildings—two mosques (or mosque-tomb complexes) and a maqām, or tomb-shrine. The mosque-tomb complexes appear at the major ports of al-Mukha and Massawa, and the maqām on the Arabian shore of the Bab al-Mandab Strait.
Views and charts of the city of al-Mukha in the early modern period often depict several minarets.Footnote 135 Yet there seems little doubt that the building intended on the chart (B1, Figure 3; enlarged in Figure 7) is the mosque-tomb complex of the fifteenth-century patron sheikh of the city, Shams al-Dīn ʿAlī bin ʿUmar al-Qarashī al-Shādhilī (d. 1424). We interpret the image as comprising (l–r) a two-balconied minaret, a prayer hall, and two tombs. Hasan Pasha’s already mentioned commission of 1590–1591 comprised a grand nine-domed structure—the mosque we see today—named after al-Shādhilī. In addition to the mosque and al-Shādhilī’s tomb, the complex also included the tombs of his son ʿAbd al-Raʾūf (d. 1453), the religious scholar Aḥmad b. Muḥammad al-Zabīdī al-Muqrī (d. 1505), and an Ottoman governor of Yemen, Sinan Pasha Kaykhiya (d. 1607).Footnote 136 Al-Shādhilī’s tomb was destroyed in 2017 amid Yemen’s civil war, apparently by a Salafi group, but the mosque survives.Footnote 137
Details from the RGS chart showing the buildings it depicts: (A) the mosque-tomb complex of Shams al-Dīn ʿAlī bin ʿUmar al-Qarashī al-Shādhilī at al-Mukha; (B) a mosque-tomb complex at Massawa, which we interpret as that of Shaykh Jamāl bin ʿUmar bin Ṣiddīq al-Anṣārī; (C) a maqām (tomb-shrine) on the Arabian coast, very close to the Bab al-Mandab, perhaps that of Sheikh Saʿīd, after whom a headland on the Bab al-Mandab peninsula is named. Source: Royal Geographical Society–Institute of British Geographers.

The Sufi al-Shādhilī school enjoyed regional renown, and the site inspired frequent visitation and incremental expansion of the tomb complex, culminating in Hasan Pasha’s construction of the adjacent mosque. Local legend connects al-Shādhilī to the earliest uses of coffee, a beverage that established the city’s fame in the mid sixteenth century, solidifying his legacy in a port that became synonymous with this commodity.Footnote 138
Meanwhile, the building depicted at Massawa (B2, Figure 3; enlarged in Figure 7) comprises three adjacent domed buildings, the centre one being the larger. The absence of a minaret suggests that it represents a tomb, although such venerated structures, as in al-Mukha, often prompted the construction of an adjacent mosque, which in turn took the name of the entombed person.
The identity of the Massawa building remains uncertain. The significant growth of Islam in the town during the second half of the nineteenth century brought the number of mosques there to some 65 by the early twentieth century,Footnote 139 thereby complicating our search in what is a poorly researched field. We regard it as unlikely that the representation is of the town’s oldest Islamic building, the al-Ṣaḥāba mosque, which is reputed to have been established around the 620s by early Muslim migrants, thereby constituting Africa’s first mosque.Footnote 140 It is a low and therefore inconspicuous structure, despite being on the seaward edge of Massawa’s outer Bats’i’i Deset Island. There are, moreover, no historical records suggesting it was a focus of visitation or pilgrimage. Another candidate is the tomb and associated mosque of ʿAbd al-Qādir al-Jīlānī (1077–1166), founder of the Qadiriyya Sufi order. Local legend holds that he spent time in Massawa, and a tomb commemorating him was erected after his death.Footnote 141
Our favoured candidate, however, is the Sheikh Jamāliyya mosque, named after JamālFootnote 142 b. ʿUmar b. Ṣiddīq al-Anṣārī (d. circa 1500), whose tomb was located alongside it.Footnote 143 Entirely rebuilt in recent decades, the structure is also referred to as the Ḥanafī mosque, reflecting the Islamic Hanafi legal school’s influence during the Ottoman occupation of Massawa (1557–1865).Footnote 144 This identification aligns more closely with other markers of Ottoman identity found elsewhere on the chart, including the al-Mukha mosque.
We have already noted in our discussion of the Makām Mēśan toponym (TD36) the depiction of a shrine-like building on the Sheikh Saʿīd headland in a 1914 Ottoman–British border agreement.Footnote 145 This appears as a simple, small-domed structure (B3, Figure 7; TD36, Figure 3). It might be that this shrine was built in honour of a local Sufi saint named Sheikh Saʿīd,Footnote 146 but we have found no other evidence for the shrine itself.
It is the case, however, that multiple small local shrines occurred along the South Arabian coast, often serving as spiritual and navigational landmarks for mariners. The 1853 East India Company chart of ‘the Southeast Coast of Arabia’ depicts several such shrines along the Gulf of Aden coast (e.g. ‘Sheikh Othman’, ‘Sheikhe Marbat’, ‘Sheika Hamrba[?]’, and ‘Shaikh Abderaman Baddas’) plus generic markers such as ‘tomb’ and ‘mosque’. Just two years before Burnes’s acquisition of the chart, Rupert Kirk sketched the interior of just such a small tomb-shrine on the Yemeni Red Sea island of Antufash (our TD23). Footnote 147
The chart’s particular interest in Islamic buildings cannot simply be a product of their respective navigational prominences: those at al-Mukha and Massawa were not particularly close to the shore and would have largely blended into their overall townscapes when viewed from the sea. Likewise, the shrine at Sheikh Saʿīd would have been dwarfed by the mountains around it. We must infer, therefore, that their function on the chart was primarily social and/or religious, even if we remain circumspect in attributing a clearly Islamic identity to the creator(s), and still less the intended users, of the chart.
Flags
In addition to buildings, the chart also depicts several pole-mounted flags—nine in total—at locations along the African and Arabian coasts (Figure 3). Always shown flying towards the right, these are pennant (FL1–2, FL6, FL9), double-pennant (FL3, FL8), and rounded-pennant (FL4, FL5) in shape. The single pennants all show a smaller chevron overlaying the field, broadly in the proportions of the flag itself; sometimes there is a further chevron embedded within. Most single pennants (FL1–2, FL6) show variations of block red and uncoloured space alternating between the field and the chevron(s), although the pennant at Massawa comprises red dots on an uncoloured field. The same dotted colouring is applied to both the chart’s double pennants (FL3, FL8), although flag FL8 additionally has a black-outlined circle at the hoist of each pennant. The two rounded pennants are each distinct: the elaborate one at al-Mukha (FL4) has alternating chevrons overlaying a red-dotted field, with alternating black and uncoloured bands at the fly; the other, at Aden (FL5), comprises a red field with two overlayed chevrons alternating between red and uncoloured.
As Arunachalam suggests with respect to other Indian charts,Footnote 148 the flags probably signify political authority, given their general association with ports such as Kamaran (FL1), al-Hodeida (FL2), al-Mukha (FL4), Aden (FL5), al-Shihr (FL6), and Massawa (FL9). We take flag FL7 to signify Salala (L26) in modern Oman, albeit unnamed, and FL8 to signify the vicinity of Barbara or Zaila. We have not been able to associate the designs directly with regional polities contemporary to the chart. All those in the Red Sea (FL1–4, FL9) fall within the space of Ottoman influence yet are mutually distinct. It may be that the designs themselves are an invention of the chart’s creator(s).
Symbology
Beyond its toponymy and individuated features, we note the application within the chart of a relatively standardised set of symbological conventions (Figure 8). Indeed, it is these features that allow us to claim stylistic similarities between the chart and other Kachchhi-Gujarati manuscripts.Footnote 149
Tentative summary of the abstract symbology of the Red Sea and Gulf of Aden chart. Source: John P Cooper.

Most striking of all of these is the representation of the coastline, which by default comprises consecutive bays with a scalloped black line representing the shoreline and black lobes with red edging representing the landward side. Interspersed along this generic coast are the already discussed coastal profiles; these are in black silhouette and usually red-fringed. Islands take diverse forms, alluding, as noted above, to their actual shapes in some cases. Reefs (or shoals) are presented either as elongated polygons with dotted outlines (e.g. L8, Figure 3), or with a combination of dotted and solid lines (e.g. most reefs in L1), the latter perhaps indicating surface-breaking reefs. Occasionally, spits are indicated as linear protuberances from the shore (e.g. L2, L41), comprising solid and/or dotted lines, again distinguishing between submerged and breaking features. Some bays are stippled with dots—all black, or black and red—suggesting shallows or overfalls. Meanwhile, in a region of few trees, navigationally useful palms (e.g. TD34, TD35, L26) and mangroves (TD59, L43) are indicated with conventionalised symbols for each species. Flags, as we have noted, indicate a political presence. A military presence is perhaps indicated by rectangular symbols. We know that forts existed where these are depicted at Farasan (TD19)Footnote 150 and Kamaran (TD30),Footnote 151 although not at Sirrayn (TD12). Finally, two rosette-like features occur, one in the bay of Massawa (TD61) and the other at what we identify as Suakin (L50), albeit partly based on this feature. Both ports have islands—Bats’i’i Desēt and Suakin Island, respectively—around which ships moored. The symbol might signify this, or perhaps a lighthouse or something else related to political control of these ports.
The verso texts
The manuscript verso comprises ten distinct pieces of paper pasted onto the back of the chart, presumably to reinforce it. All have text written on them, primarily in Gujarati using Devanagari script (Figure 4). They appear to have been pasted systematically: three bands of papers run the length of the manuscript, with the central band overlaying the two outer ones. The individual papers comprise fragmentary texts that are often partly pasted over or truncated; there is no consistency in their orientation. The texts are written in more than one script: in most cases, the shirōrēkhā line is present, while in others it has been omitted. As Burnes and later authors note, the texts have little to contribute with respect to the chart itself, or to navigation more generally.Footnote 152 The broad subject matter of each is summarised in Table 6.
Indicative descriptions of the ten texts on the verso of the chart

Discussion
Our close reading of the RGS chart evidences a rich and effective navigational reference work: its latitude-fixing Polaris-altitude system; its stellar sailing directions; its detailed toponymy; its plethora of unnamed yet identifiable features; its coastal profiles signifying waymarkers and landfalls; its religious buildings; its flags suggesting nodes of political and fiscal action; and its abstract symbology. Through triangulation of these various data, we have presented a detailed interpretation of the chart in textual, tabular, and graphic forms accessible to contemporary scholarly epistemologies. We reveal a document showing a level of detail unparalleled in the longue durée of indigenous Indian Ocean cartography.
As a navigational work, the chart requires specific navigational knowledge as much as it conveys it. Although rich, the inscribed information remains insufficient to enable safe navigation through complex and potentially dangerous waters. This is not a universalist work, premised on graticule-based position-finding and the scalar representation of topography and bathymetry, alongside the use of scientific navigational equipment. Rather, its locational and directional prompts are intended to spark a welter of complementary, tacit, and intangible knowledge—of topography, of seasonal, diurnal, and local meteorology, of oceanography, and even of informative animal behaviour.Footnote 153 It functioned as a handy reference at sea, fulfilling a mnemonic role. Its scroll format allowed it to be opened partially, showing only the relevant section, with the rest rolled safely and conveniently away, reducing its exposure to wind and spray. It stored and handled easily on board.
The details emerging from the chart have illuminated the routes followed by our Kachchhi-Gujarati navigators. In the Gulf of Aden, the emphasis is on open-water crossings, with Aden and Socotra representing focal points in the west and east respectively. Coasting is also apparent along the Arabian coast, evidenced by the toponymic sequence. On the African side, coasting seems concentrated on the section between Maydh and Socotra; implicitly, the ports of Zeila and Barbara are accessed primarily on crossings from Arabia.
Meanwhile, in the Red Sea, a far more complex process of route-finding emerges, reflective of a far more challenging seascape. A mid-sea corridor connects the Bab al-Mandab Strait to the nodal islands of Jabal Zuqar and Jabal Tayr and, further north, projects along the central axis of the sea. This route serves navigators seeking a rapid transit through deep waters, avoiding inshore hazards. Access to and from this route at intermediate points is indicated by rhumbs R6 and R8 at Jabal Zuqar and R2 and R4 at Jabal Tayr.
It is clear, however, that the chart is not simply designed to facilitate long-distance transit to first-order Red Sea ports. The intensity of inshore topography depicted for the Arabian coast, particularly between the islands of Kamaran and Jabal al-Lith, suggests navigators’ involvement in coastal sailing, serving a tramping economy, which demanded detailed local knowledge. This is less the case along the African shore: information south of Massawa appears oriented towards wayfinding to and from that port. Further north, the minor intermediate locales lead to no obvious destination—although probably to the unnamed Suakin.
That the chart’s Red Sea coverage terminates at the level of Jeddah reflects both Ibn Mājid’s fifteenth-century guidance for navigators and a wider historical understanding.Footnote 154 Not coincidentally, this port city marked the boundary between the distinct seasonal wind regimes of the northern and southern Red Sea, making it an ideal gathering point for merchants from all parts. The extent to which the prevailing northerly winds of the northern Red Sea presented an obstacle to northward sailing has been widely debated in recent decades.Footnote 155 Evidence from the VS 1720 (1663–1664) manuscript in India’s National Archives suggests that at least some Kachchhi-Gujaratis ventured further north, at least on occasion.Footnote 156 Nevertheless, for the creator(s) of this chart, Jeddah constituted the ultimate destination.
That the creator(s) and users of the chart were Kachchhi-Gujaratis, as Burnes indicates, is implied in the toponymy: the Arabic sounds /ð/ (ذ) and /z/ (ز) are rendered /dʒ/ (ઝ) in Gujarati—thus the ports of Jizan (/dʒīzān/) and al-Qunfudha (/əl qunfuða/) become /dʒādʒān/ and /qunfudʒa/ respectively, while [Jabal] Zuqar (/zukar/) becomes /dʒakar/.
Meanwhile, an Islamic dimension to the seafarers’ identity is evident from the chart’s pictorial depiction of Islamic buildings. Muslim seafaring communities had been established in Gujarat as early as the eighth centuryFootnote 157 and, in the period of our chart, it was primarily Muslims who captained and crewed Gujarati ships.Footnote 158 Chhaya Goswami reports further that shipowners were mainly from the Muslim Bhadala community.Footnote 159 The depicted mosque-shrines at al-Mukha and Massawa would have functioned not only as landmarks and places of worship but also as social hubs where traders could gather, rest, and interact. The role of Jeddah as a disembarkation point for Muslim pilgrims to Makkah is not explicitly referenced on the chart—nor indeed are prominent city structures such as the tomb of Eve. The extent to which Islamic pilgrimage was itself an engine of the Indian Ocean maritime economy remains contestedFootnote 160 and its direct relevance to this chart as-yet unproven.
Kachchhi-Gujarati seafaring was not exclusively Muslim, however. There were also Jain and Hindu merchants and owners, whose settlement on the Arabian and East African coasts, including at al-Mukha, is well documented.Footnote 161 Burnes himself notes that the crew from whom he acquired the chart was itself mixed: indeed, religious affiliation may well have been a less significant binding agent than the mariners’ Kachchhi-Gujarati identities.
This mixedness extends also to the navigational knowledge systems the chart captures. Modern nationalisms often lay claim to such knowledge, drawing selectively on the evidence of surviving texts and the identities of their authors to assert mono-ethnic proprietorship. The reality is a more profound blending of knowledge based on the inescapable cosmopolitanism of maritime trade and exchange, as well as the demands and affordances of a shared biophysical space. The astronomical knowledge reflected in the chart was certainly known across ethnicities fringing the Arabian Sea and its connecting gulfs;Footnote 162 it must have been in place to a large extent for as long as people have been sailing the region over open water.
Kachchhis, irrespective of their religious affiliations, enjoyed renown as entrepreneurial seafarers. Even the churlish Burnes describes their ‘truly adventurous’ nature, contrasting it with the alleged ‘timid[ity]’ of others.Footnote 163 Just 15 years before his acquisition of the chart, the British East India Company’s political agent James MacMurdo reports that 800 Kachchhi vessels, ranging in tonnage from 40 to 500 candies (9–113 tonnes), were involved in the Indo-Arabian trade, generating annual revenues of about 250,000 rupees.Footnote 164 He says key exports included silk and cotton textiles, alum, and ghee, while imports comprised bullion from al-Mukha, ivory, rhinoceros horn and hides from ‘Powahil’, dates, coconuts and grains from various regions, and timber from India’s Malabar coast and Daman Island.Footnote 165
Sailing west, Kachchhi-Gujarati sailors ventured into other jurisdictions. Flags on the chart in the Gulf of Aden no doubt signify the political and fiscal presence of local polities. Once through the Bab al-Mandab, however, the reach of Ottoman power could be felt: although the empire’s control over the southern Red Sea was not as absolute as in the north,Footnote 166 it did at least extend to Jeddah, Massawa, al-Mukha intermittently, and island outposts such as Kamaran and Farasan.
Conclusion
We have not, in this article, delved into the aesthetic qualities of the RGS chart of the southern Red Sea and Gulf of Aden. Its detailed depictions of ships under sail, of sacred buildings and fluttering flags nevertheless imbue a lively sense of active and inhabited space, set along and between rhythmically embayed coastlines and the busy punctuations of islands. It was no doubt this vibrant aesthetic that inspired Alexander Burnes to secure the chart for the ‘cabinets of Europe’ almost two centuries ago. It was certainly not for its practical value. Less than four years before the British East India Company seized Aden, Burnes had in his possession what we have demonstrated to be a detailed and practical navigational chart of the southern Red Sea and Gulf of Aden, the affordances of which he appears to have been wholly unaware. Indeed, at precisely the same time as he was making his acquisition, the company’s ship Palinurus was conducting a hydrographic survey (1834–1836) of the Arabian coast of the Gulf of Aden, a region that its skipper, Stafford Haines, went on to claim vaingloriously as ‘hitherto almost unknown’.Footnote 167 Clearly, the region was known to indigenous Indian Ocean navigators, as it had been for millennia—just not always in forms accessible to the outsider-agents of the company, even when placed directly into their hands.
It is no coincidence that Burnes’s acquisition of the chart and its accession to the RGS collection has persisted as its dominant origin narrative. By neglecting to record even the name of the ‘pilot’ from whom he obtained a document he clearly prized, Burnes ensured, consciously or not, that his was the only name that might be associated with it in future. He also made it difficult for his acquisition narrative to be crowded out by any earlier history. Burnes is credited as a talented linguist. He travelled an entire sea journey with the pilot who gave him the chart and his crew. And yet he leaves only a cursory contextualisation of the document and an interpretation that goes little beyond a handful of toponyms and a dismissal of the chart’s utility as ‘rude’.
Some 190 years on—and assisted by readily available remote sensing imagery and archives of subsequent cartography—our research offers a contrasting interpretation of the chart. It reveals not only the cartographer’s detailed knowledge of the places and topography of the southern Red Sea and Gulf of Aden but also clear and effective strategies and methods for moving between them. In doing so, it highlights the capacity of this and other non-Cartesian documentations of geographical space to represent and facilitate successful wayfinding in the real world. Much like the ‘stick charts’ of the Marshall Islands,Footnote 168 our chart functioned as an on-board mnemonic, triggering essential, and extensive, complementary knowledge in the mind-brain of its experienced and familiar user. It therefore also tells an essential story of indigeneity: while the imperative of European imperial cartography was to create Cartesian space amenable to navigation by anyone trained in instrument-based techniques, this chart created space that could only be mediated by those with a temporally and cognitively profound relationship with the immediate biophysical environment of the region, built and transmitted over generations, and depending on forms of knowledge that are not encoded within it—for example of season, local winds, bathymetry, and currents. In contrast to the universalist endeavour of European cartography borne of the Enlightenment, it underlines indigeneity and locality as an essential component of the navigational process. We can only ask what similar, detailed, treatments of other navigational documents of the western Indian Ocean—pilot books and charts—might add to our understanding of indigenous navigation in this and other regions of the world where navigators operate(d) outside the paradigm of the modern instrumentation with which we have all become familiar, in principal if not in practice.
Acknowledgements
The authors wish to thank the Royal Geographical Society–Institute of British Geographers (RGS-IBG) for granting access to the Red Sea and Gulf of Aden chart and supplying electronic copies of it for use in this publication. We also thank the United Kingdom Hydrographic Office, in particular research managers Ann-Marie Fitzsimmons and John Williams in the Archives section, for their assistance in identifying relevant comparative materials. We also extend our appreciation to the anonymous reviewers for their valuable comments. Kumail Rajani’s contribution was supported by his British Academy Postdoctoral Fellowship (award no. PF22\220019).
Conflicts of interest
None.
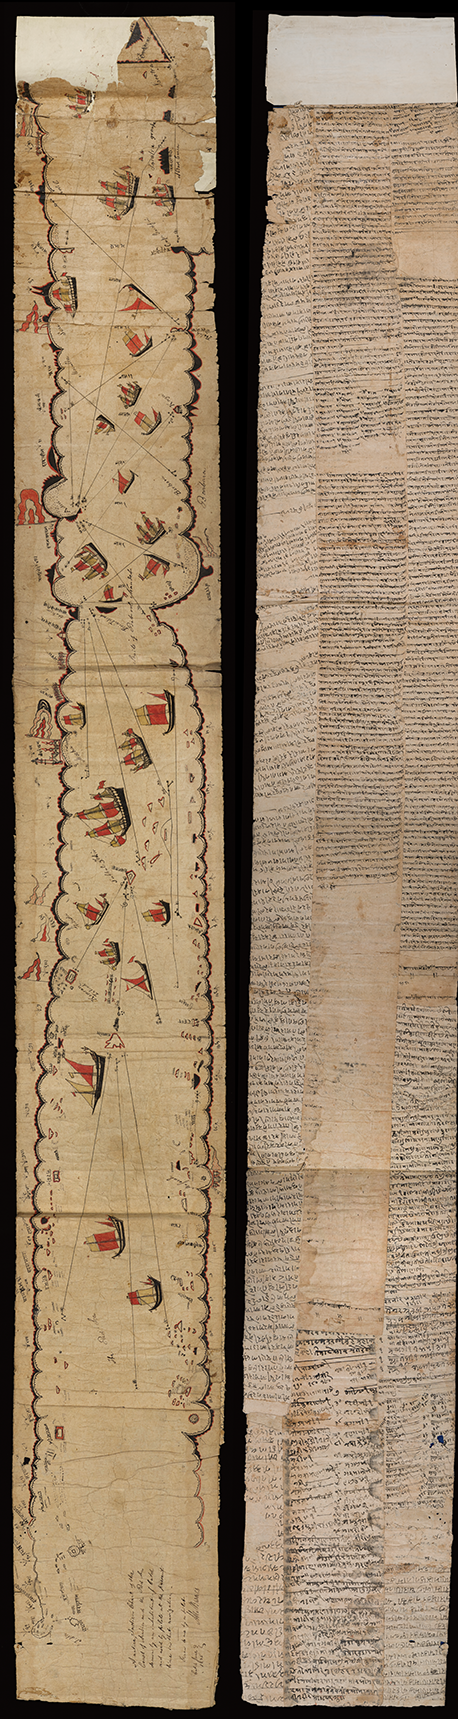
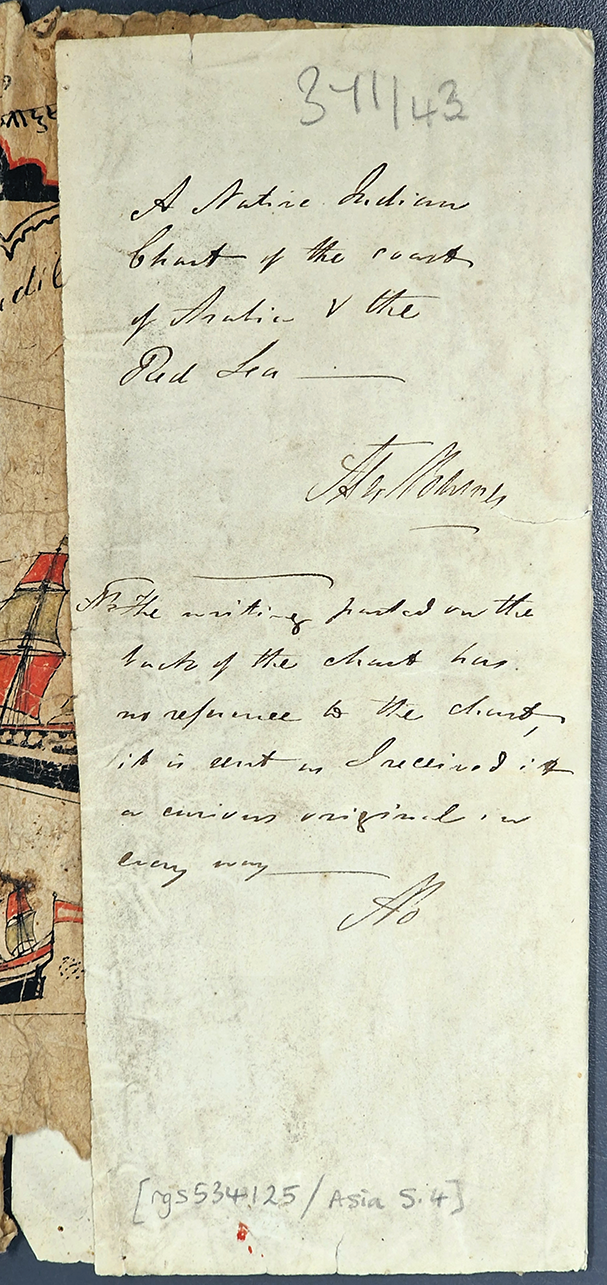
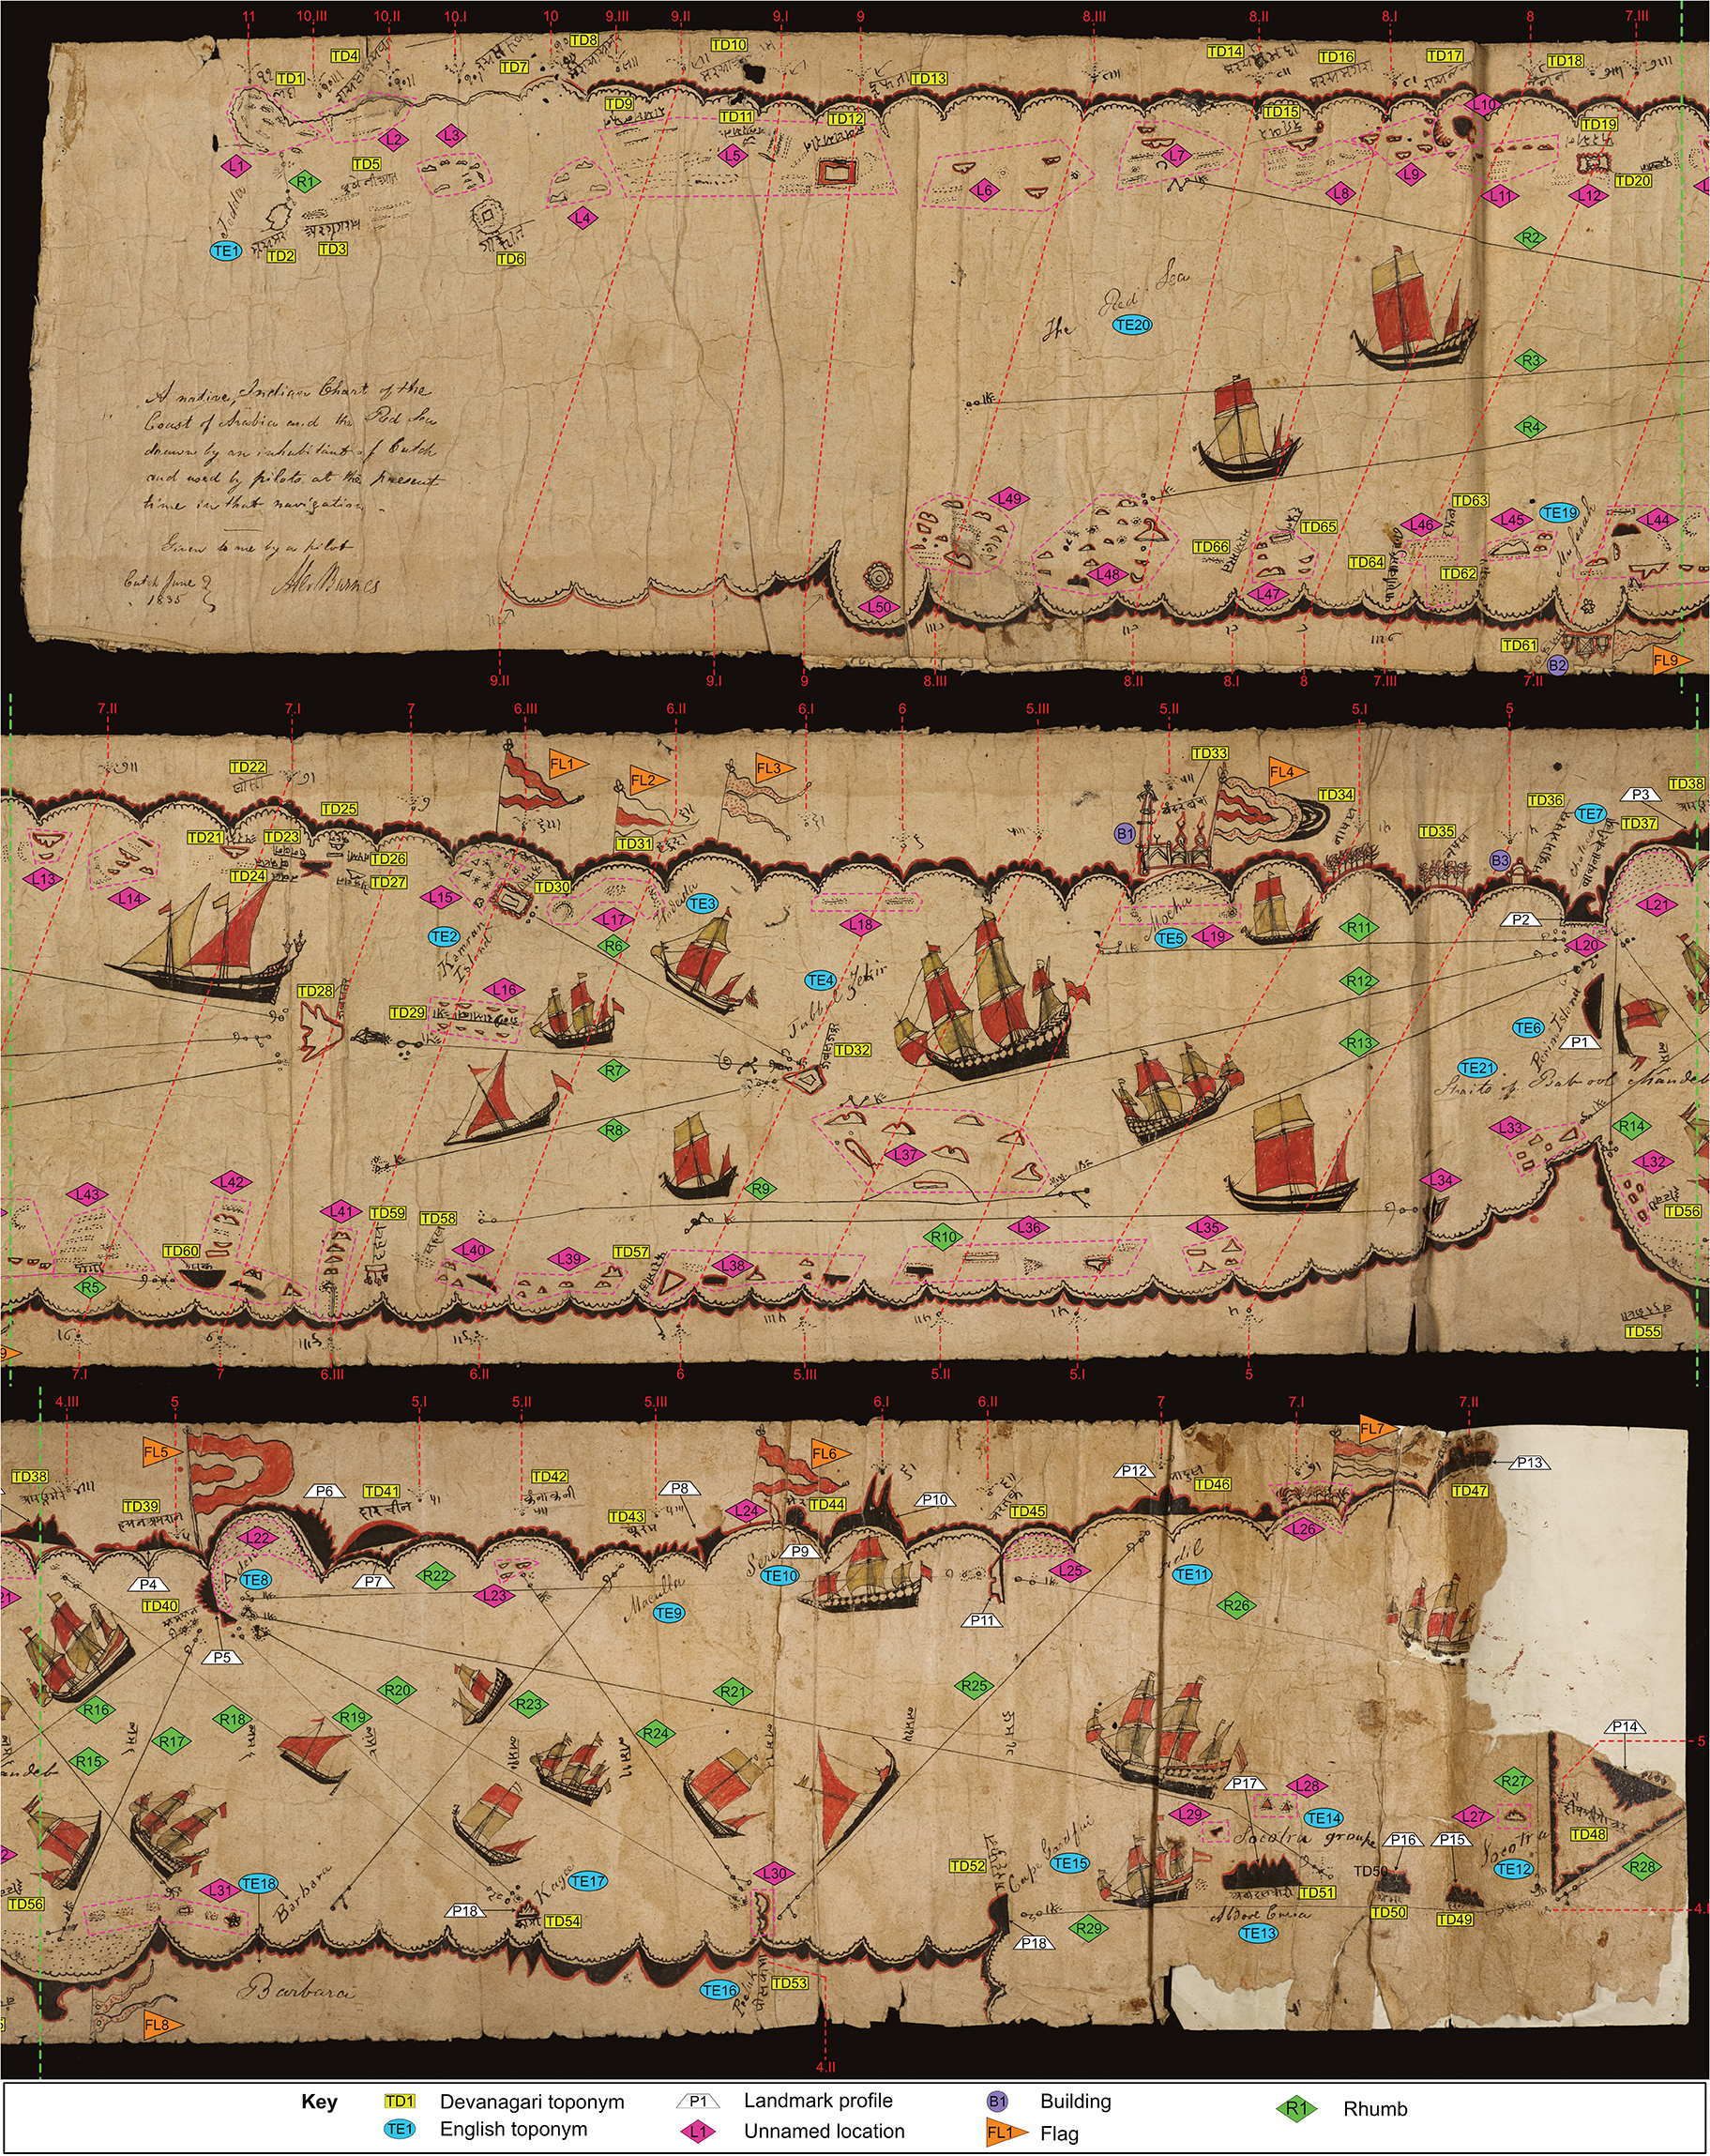
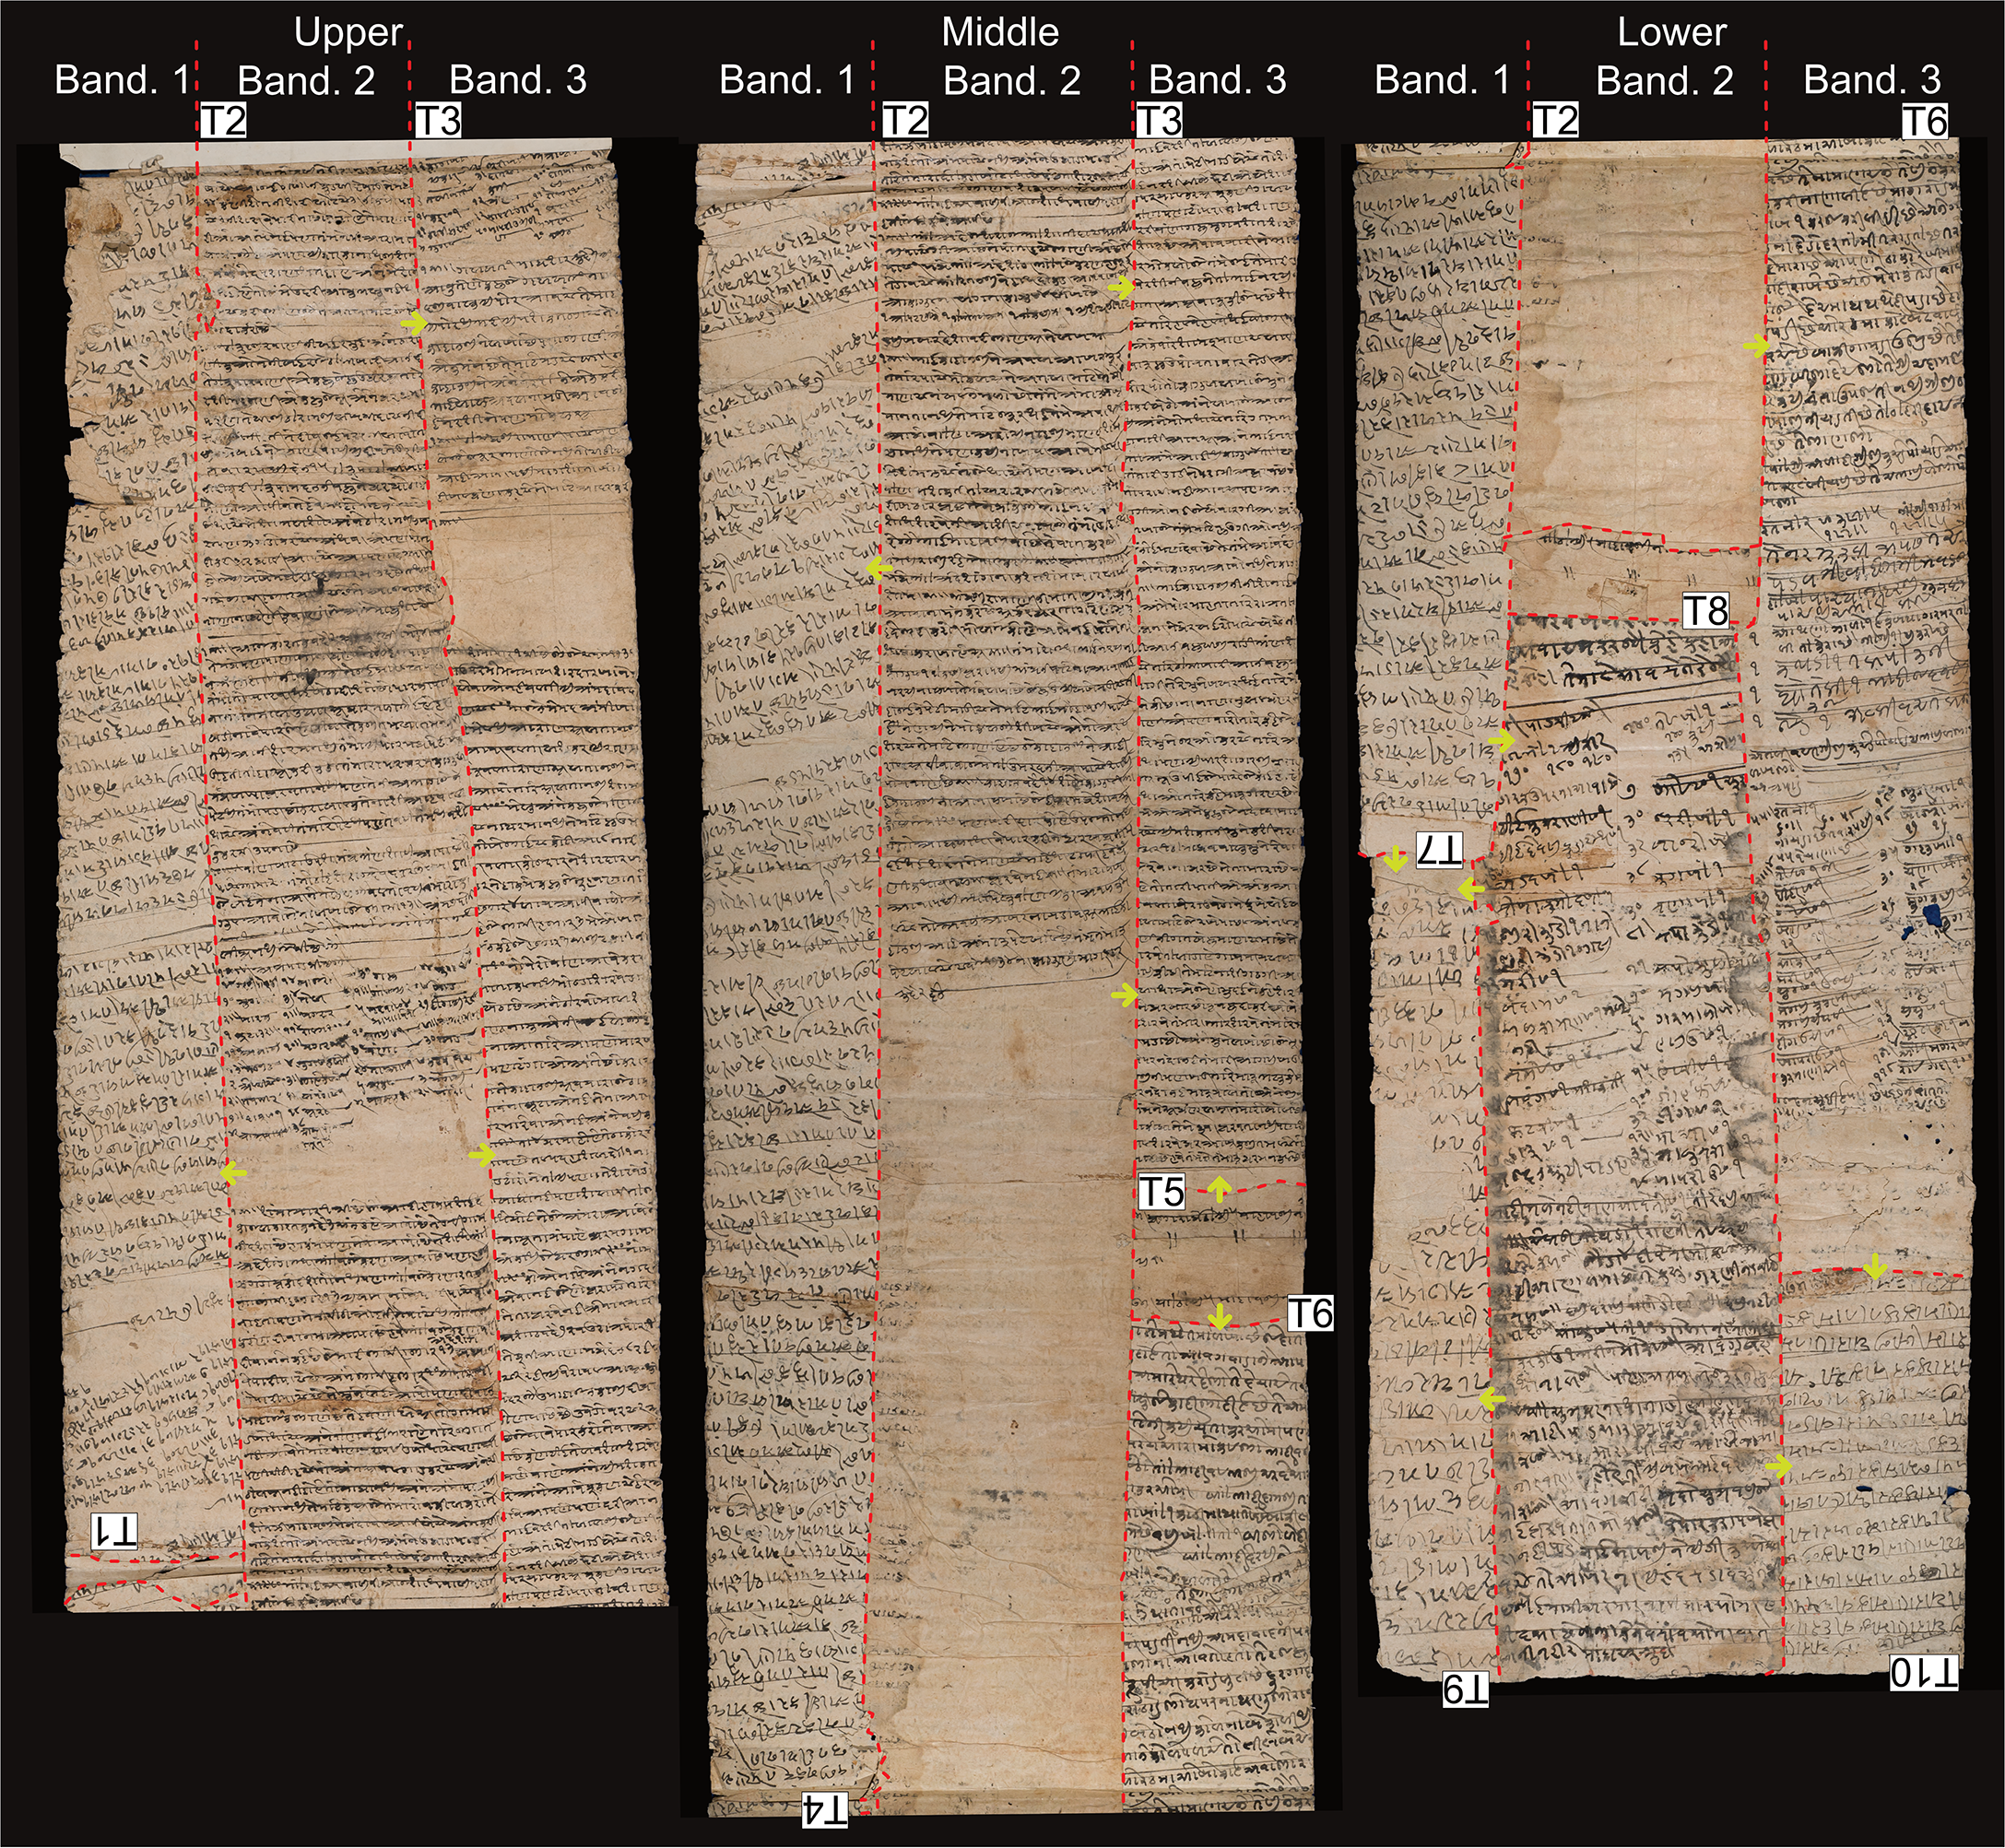
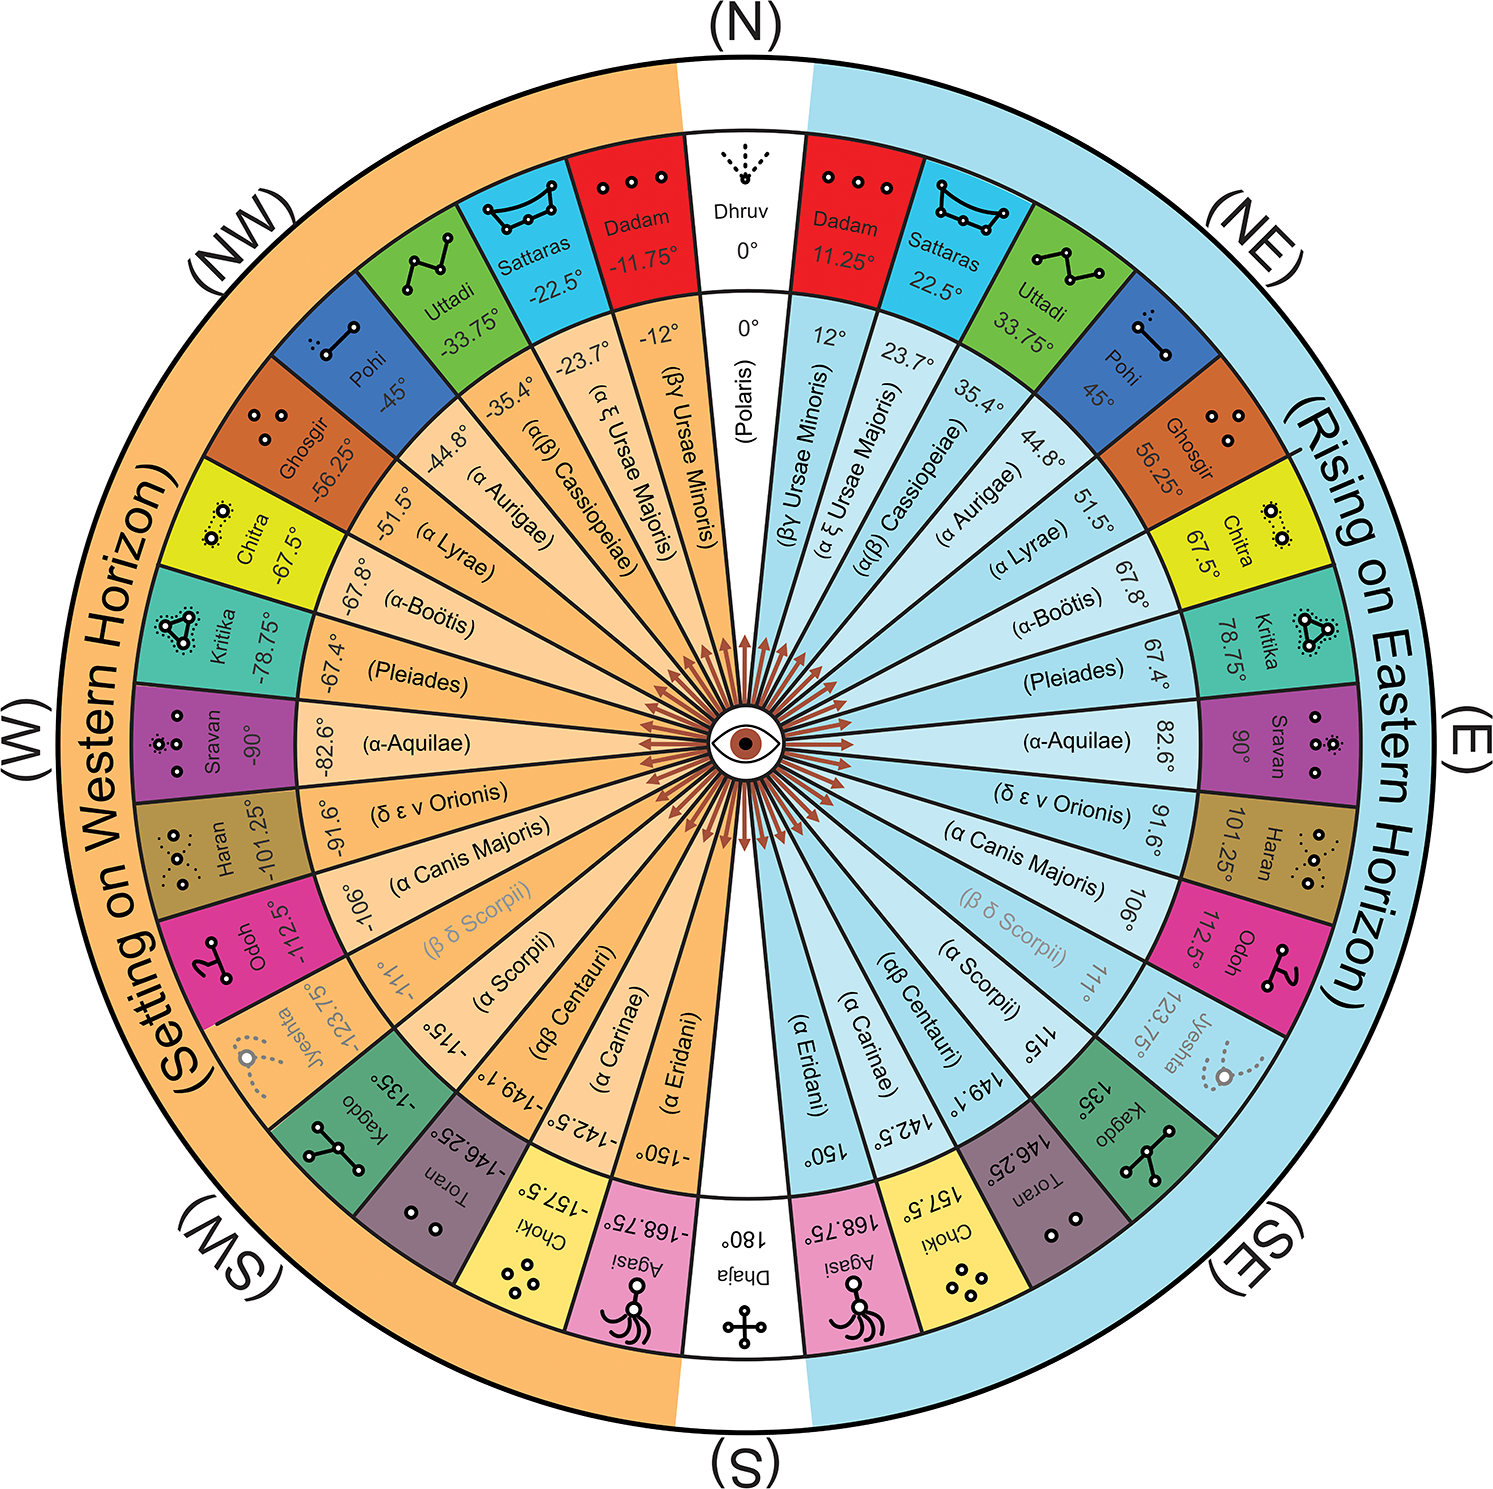
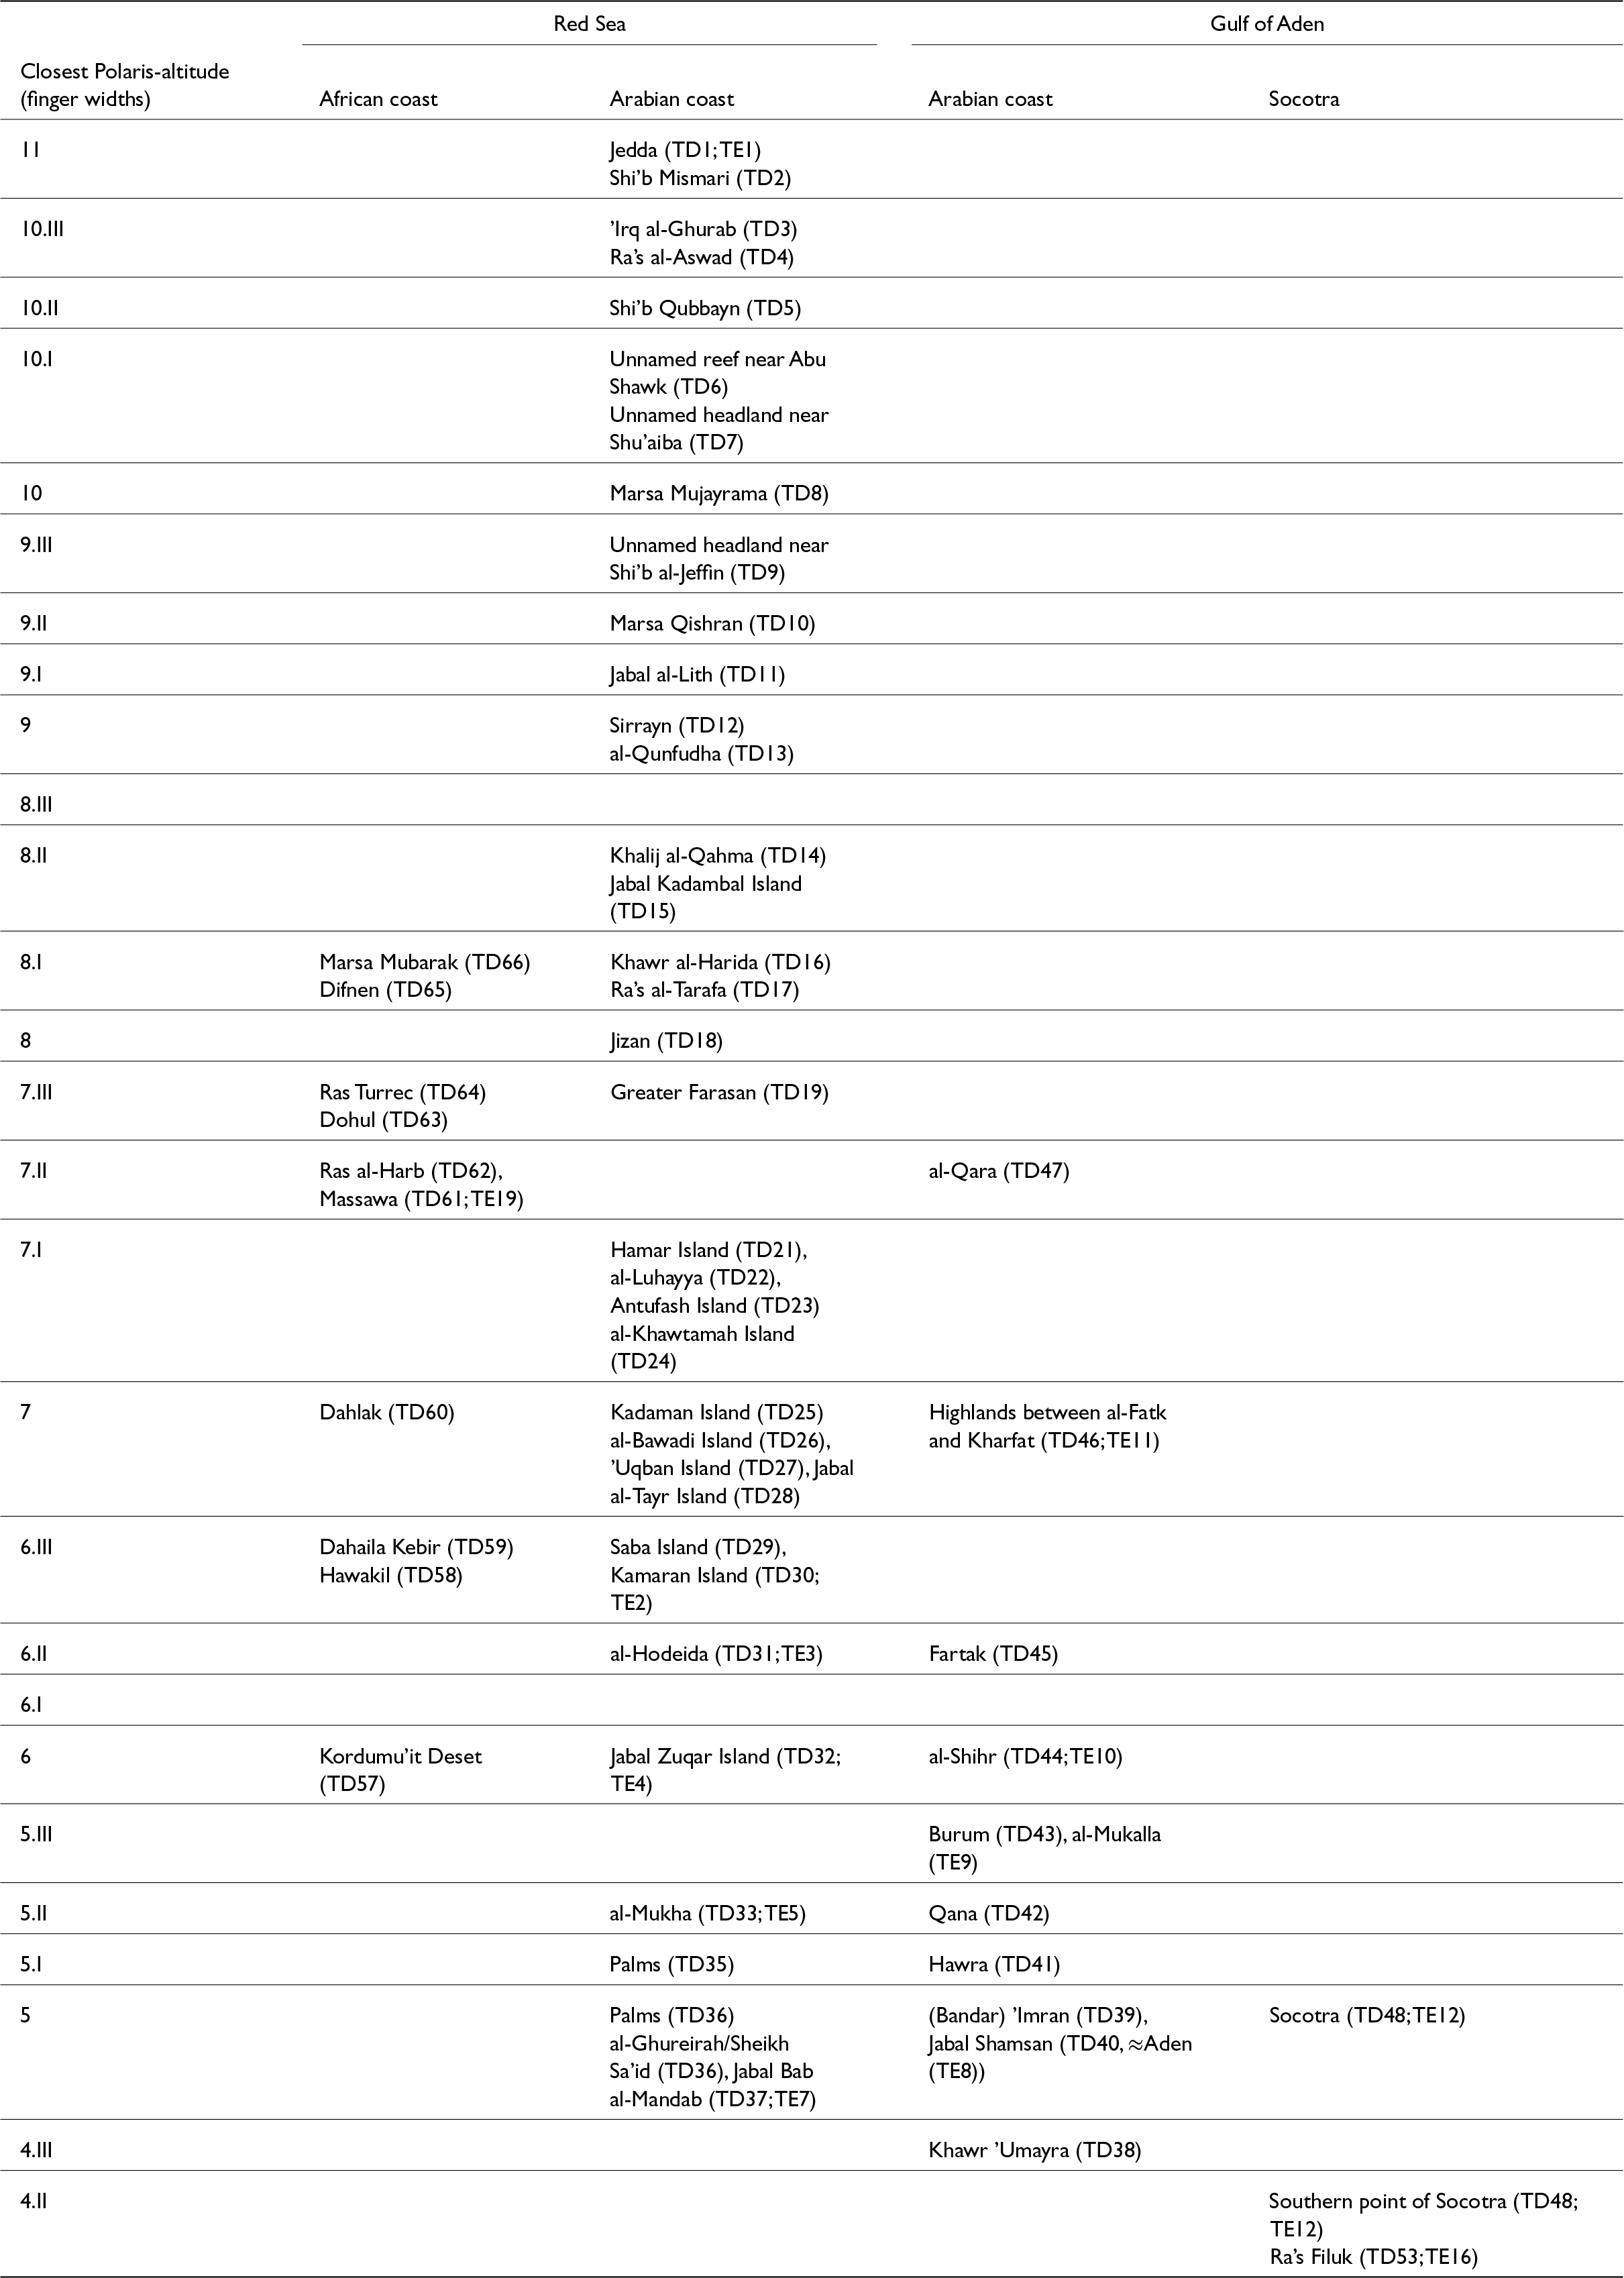
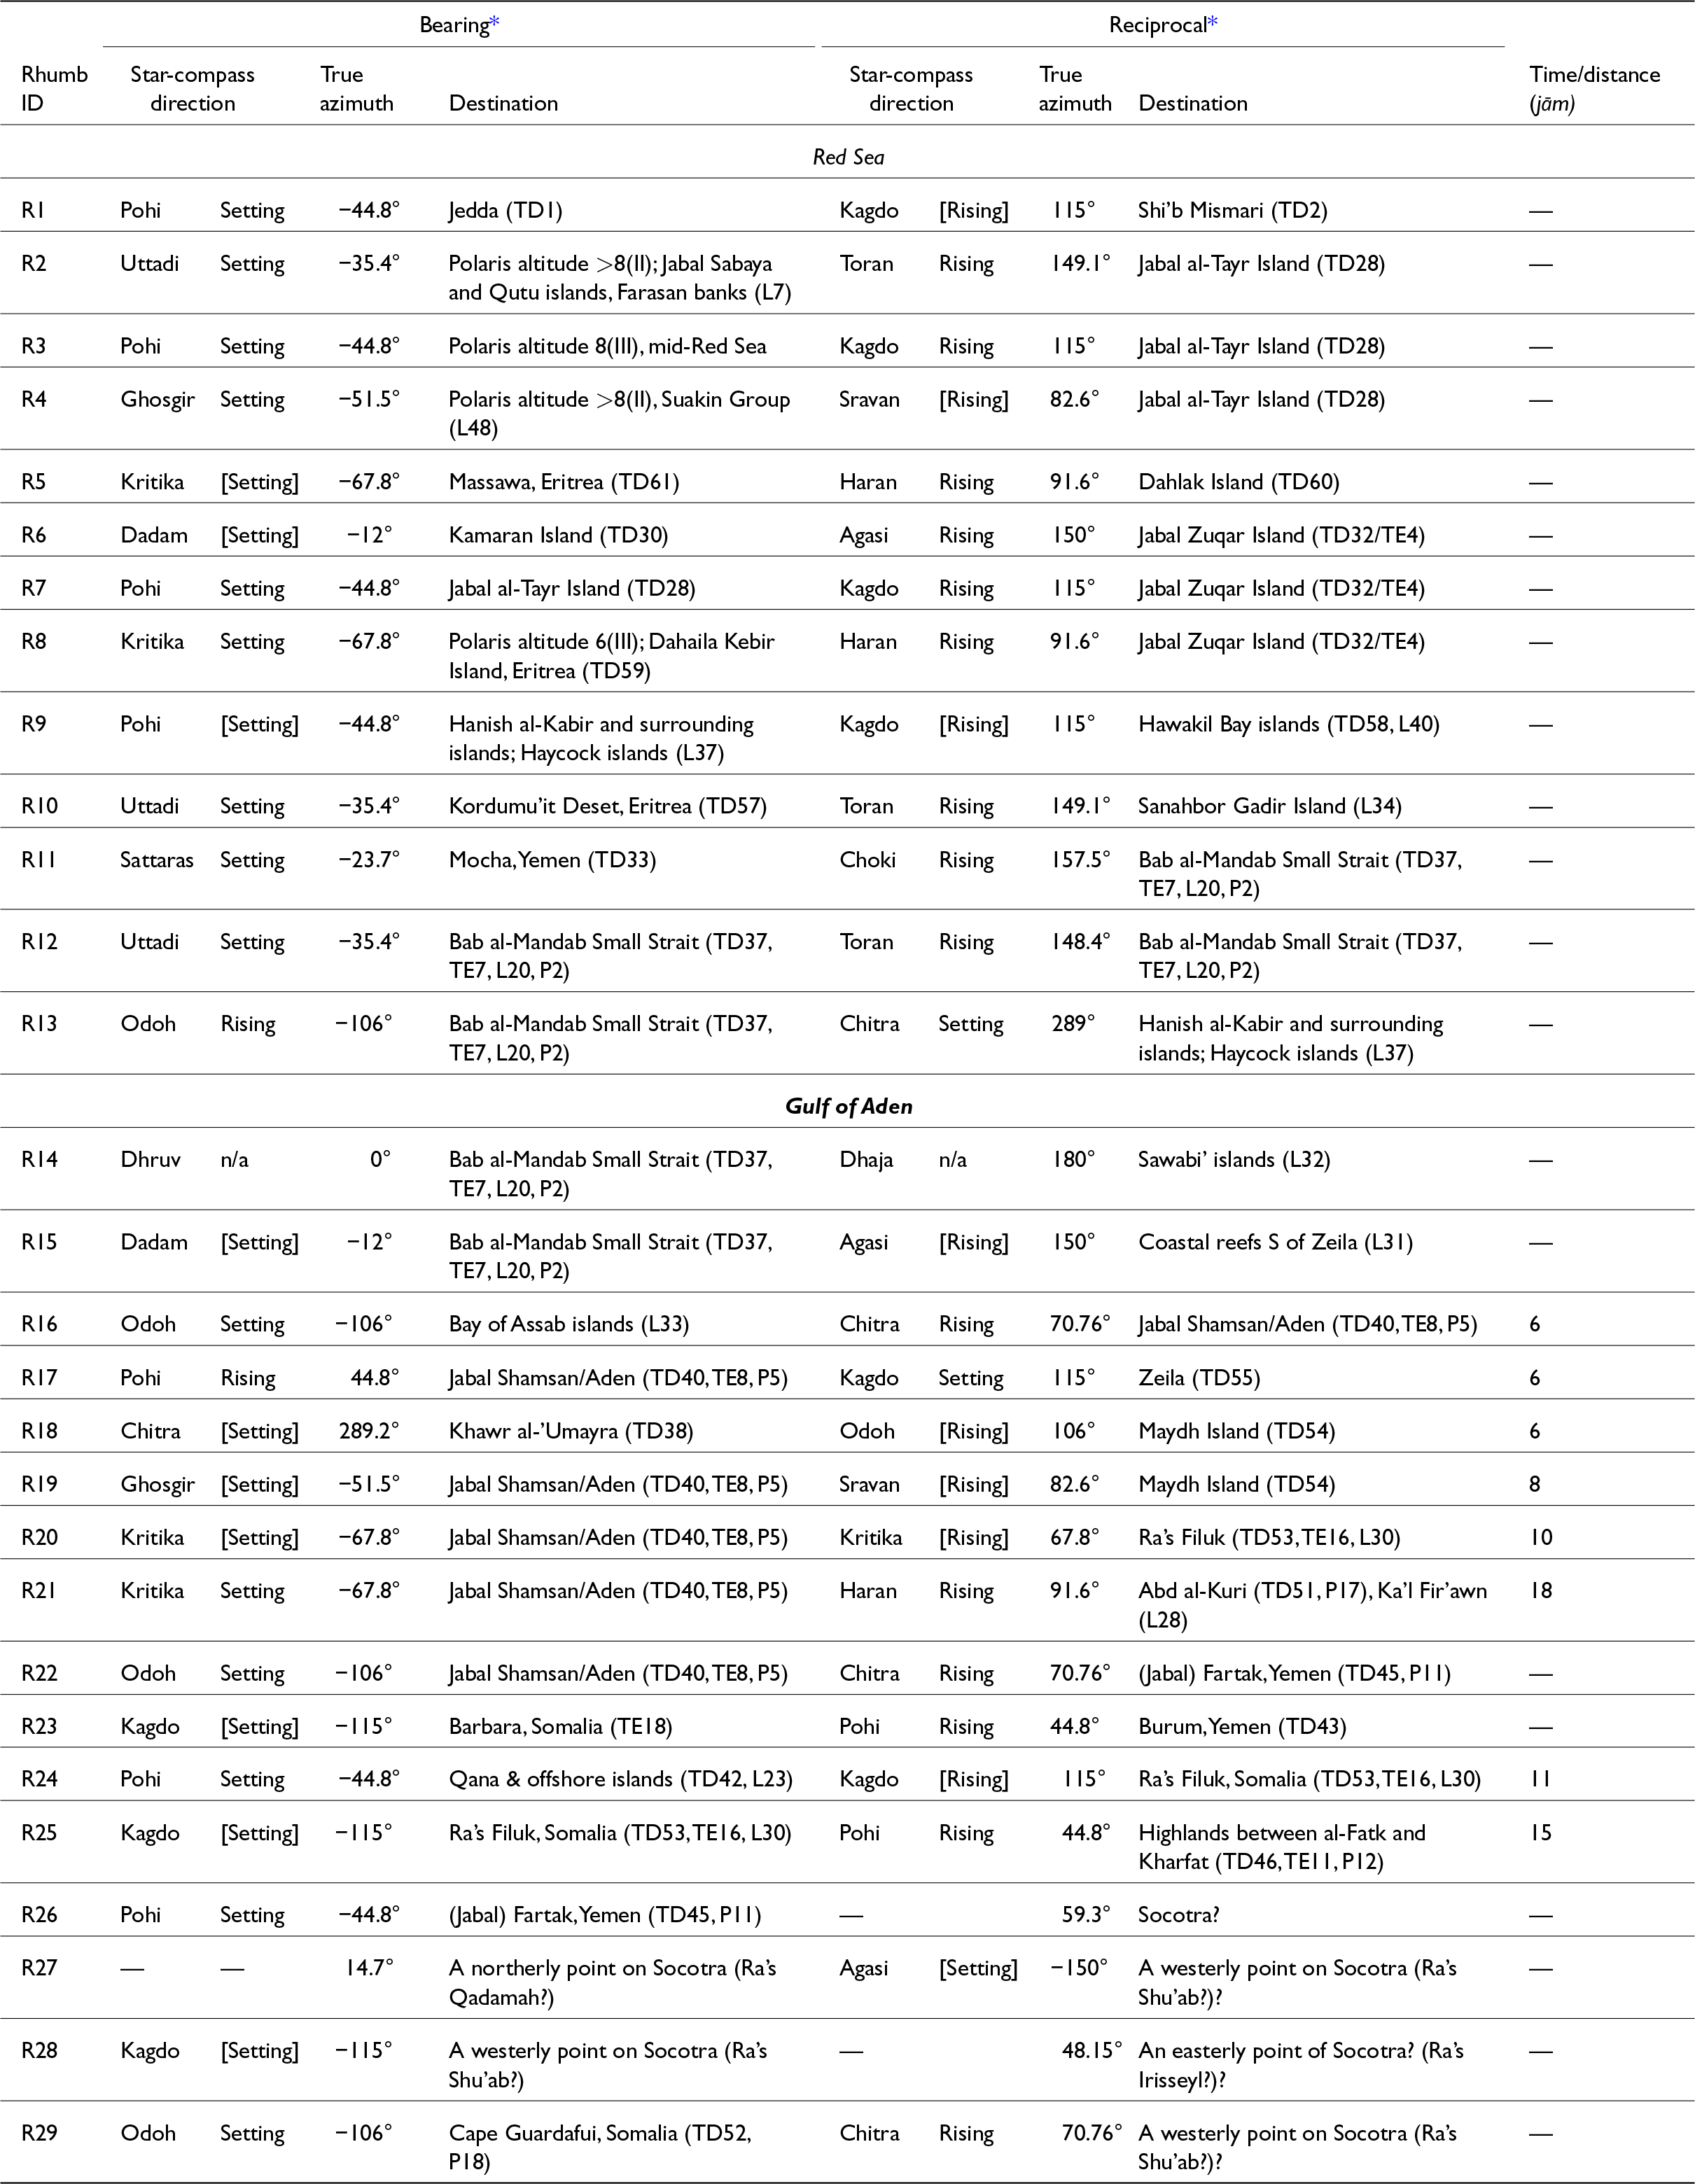
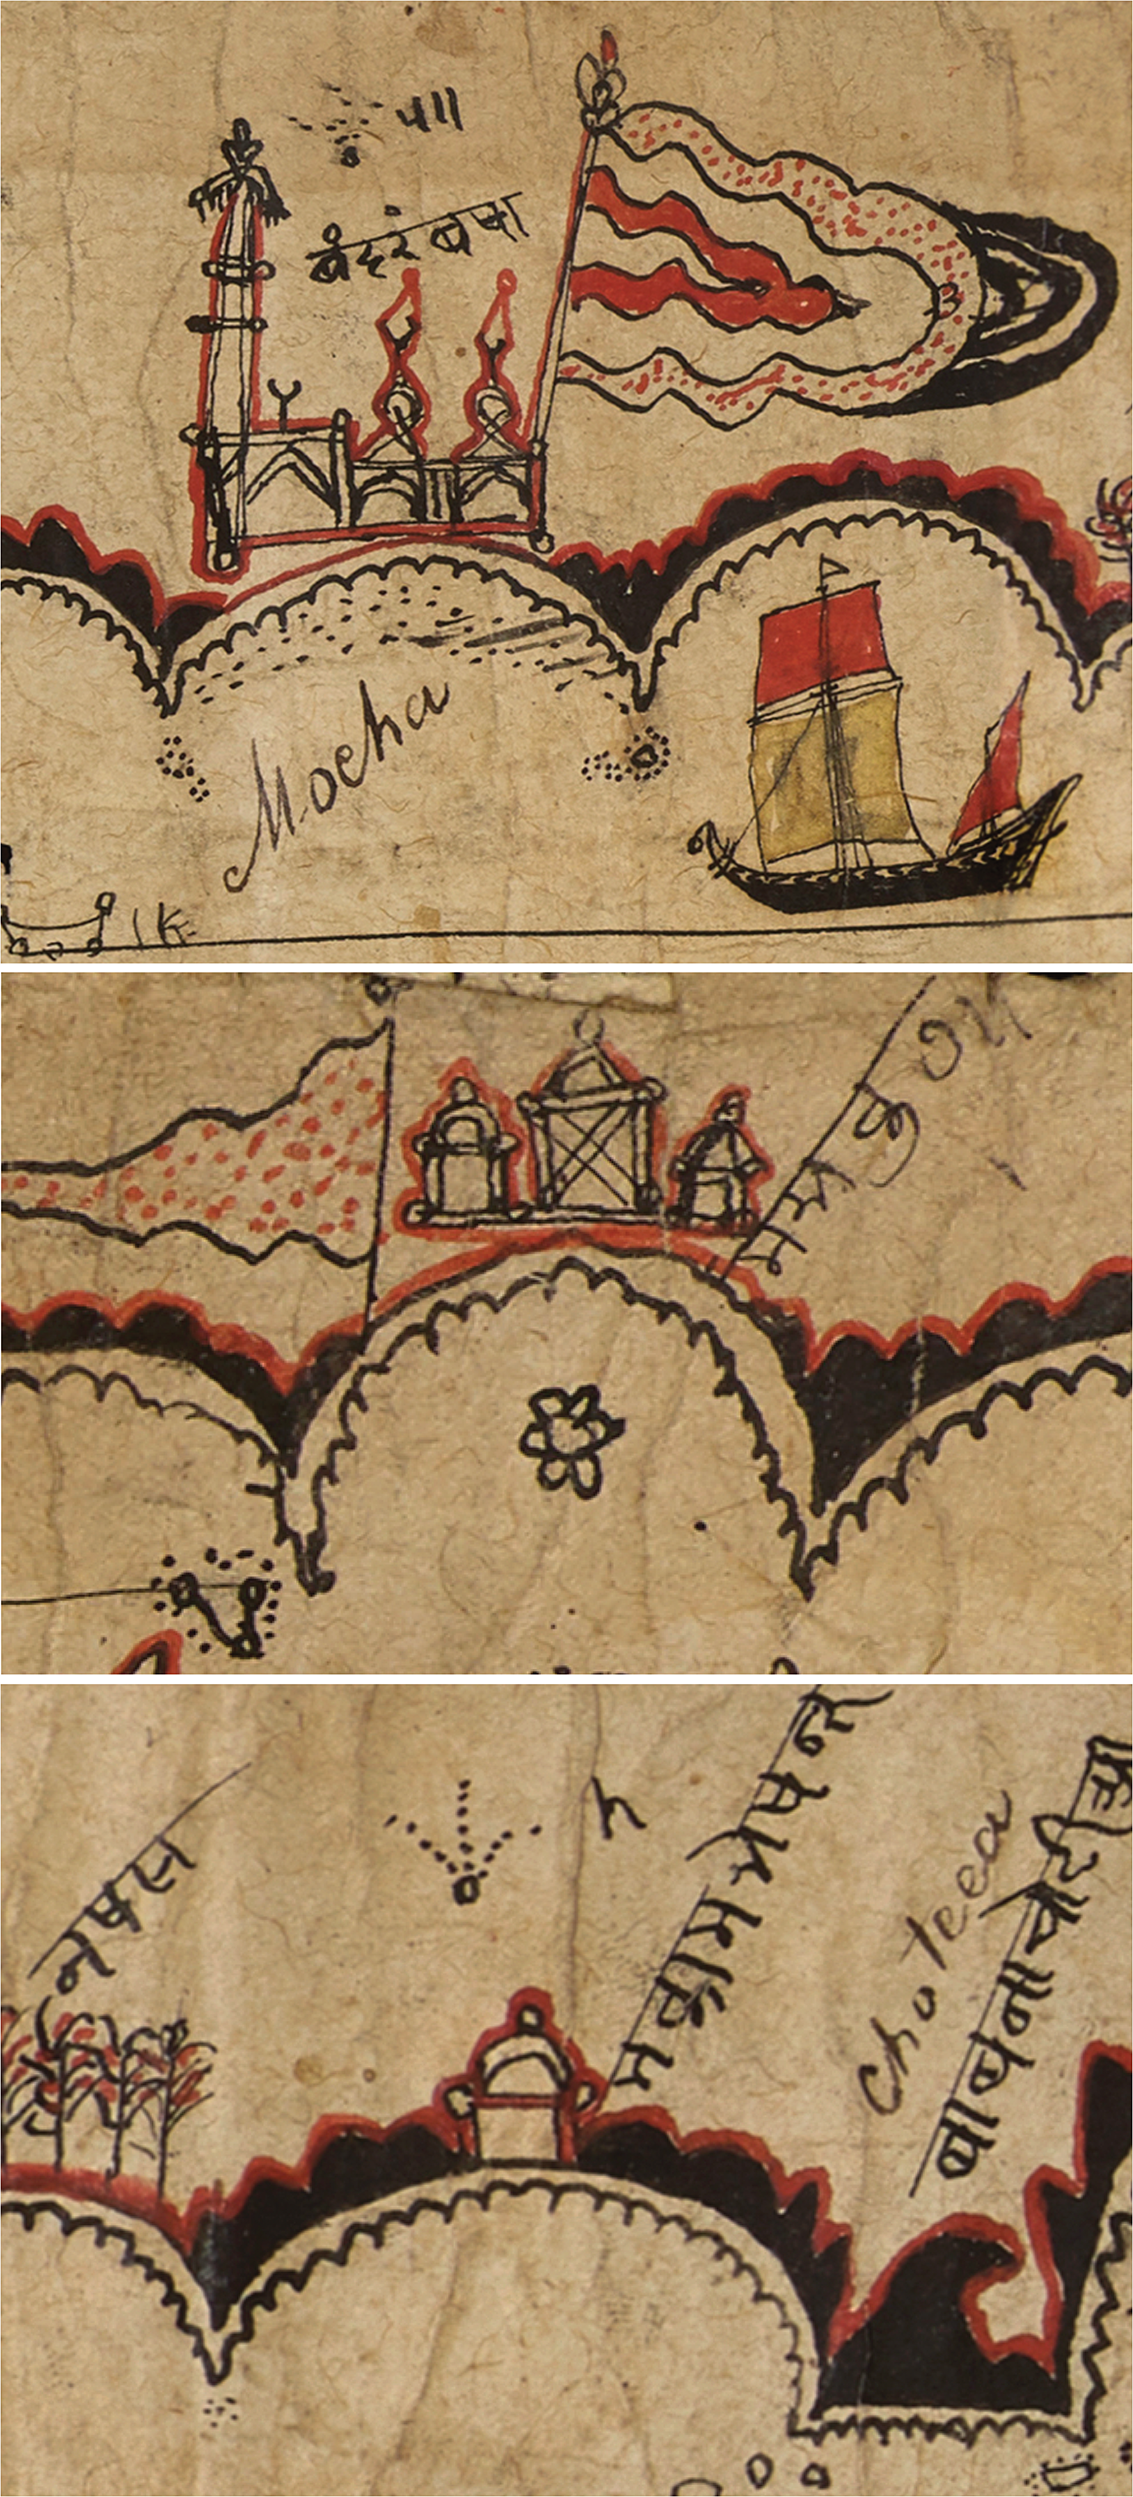
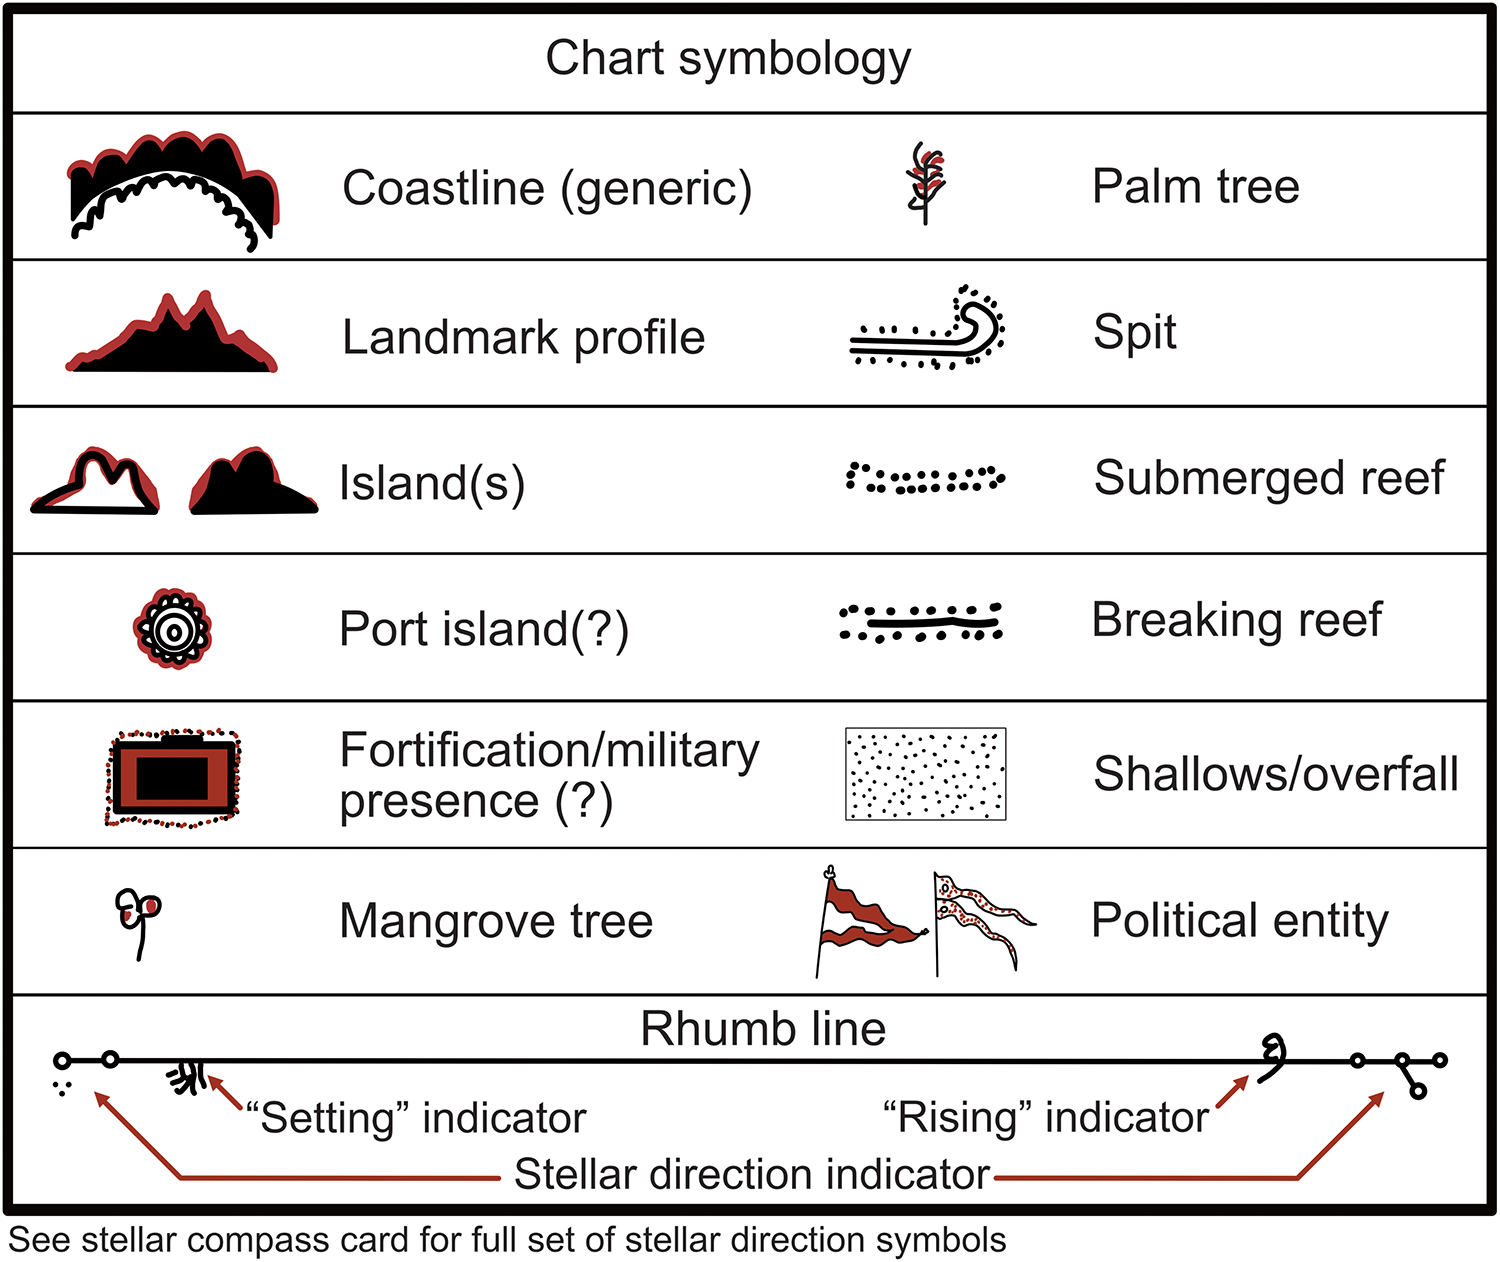
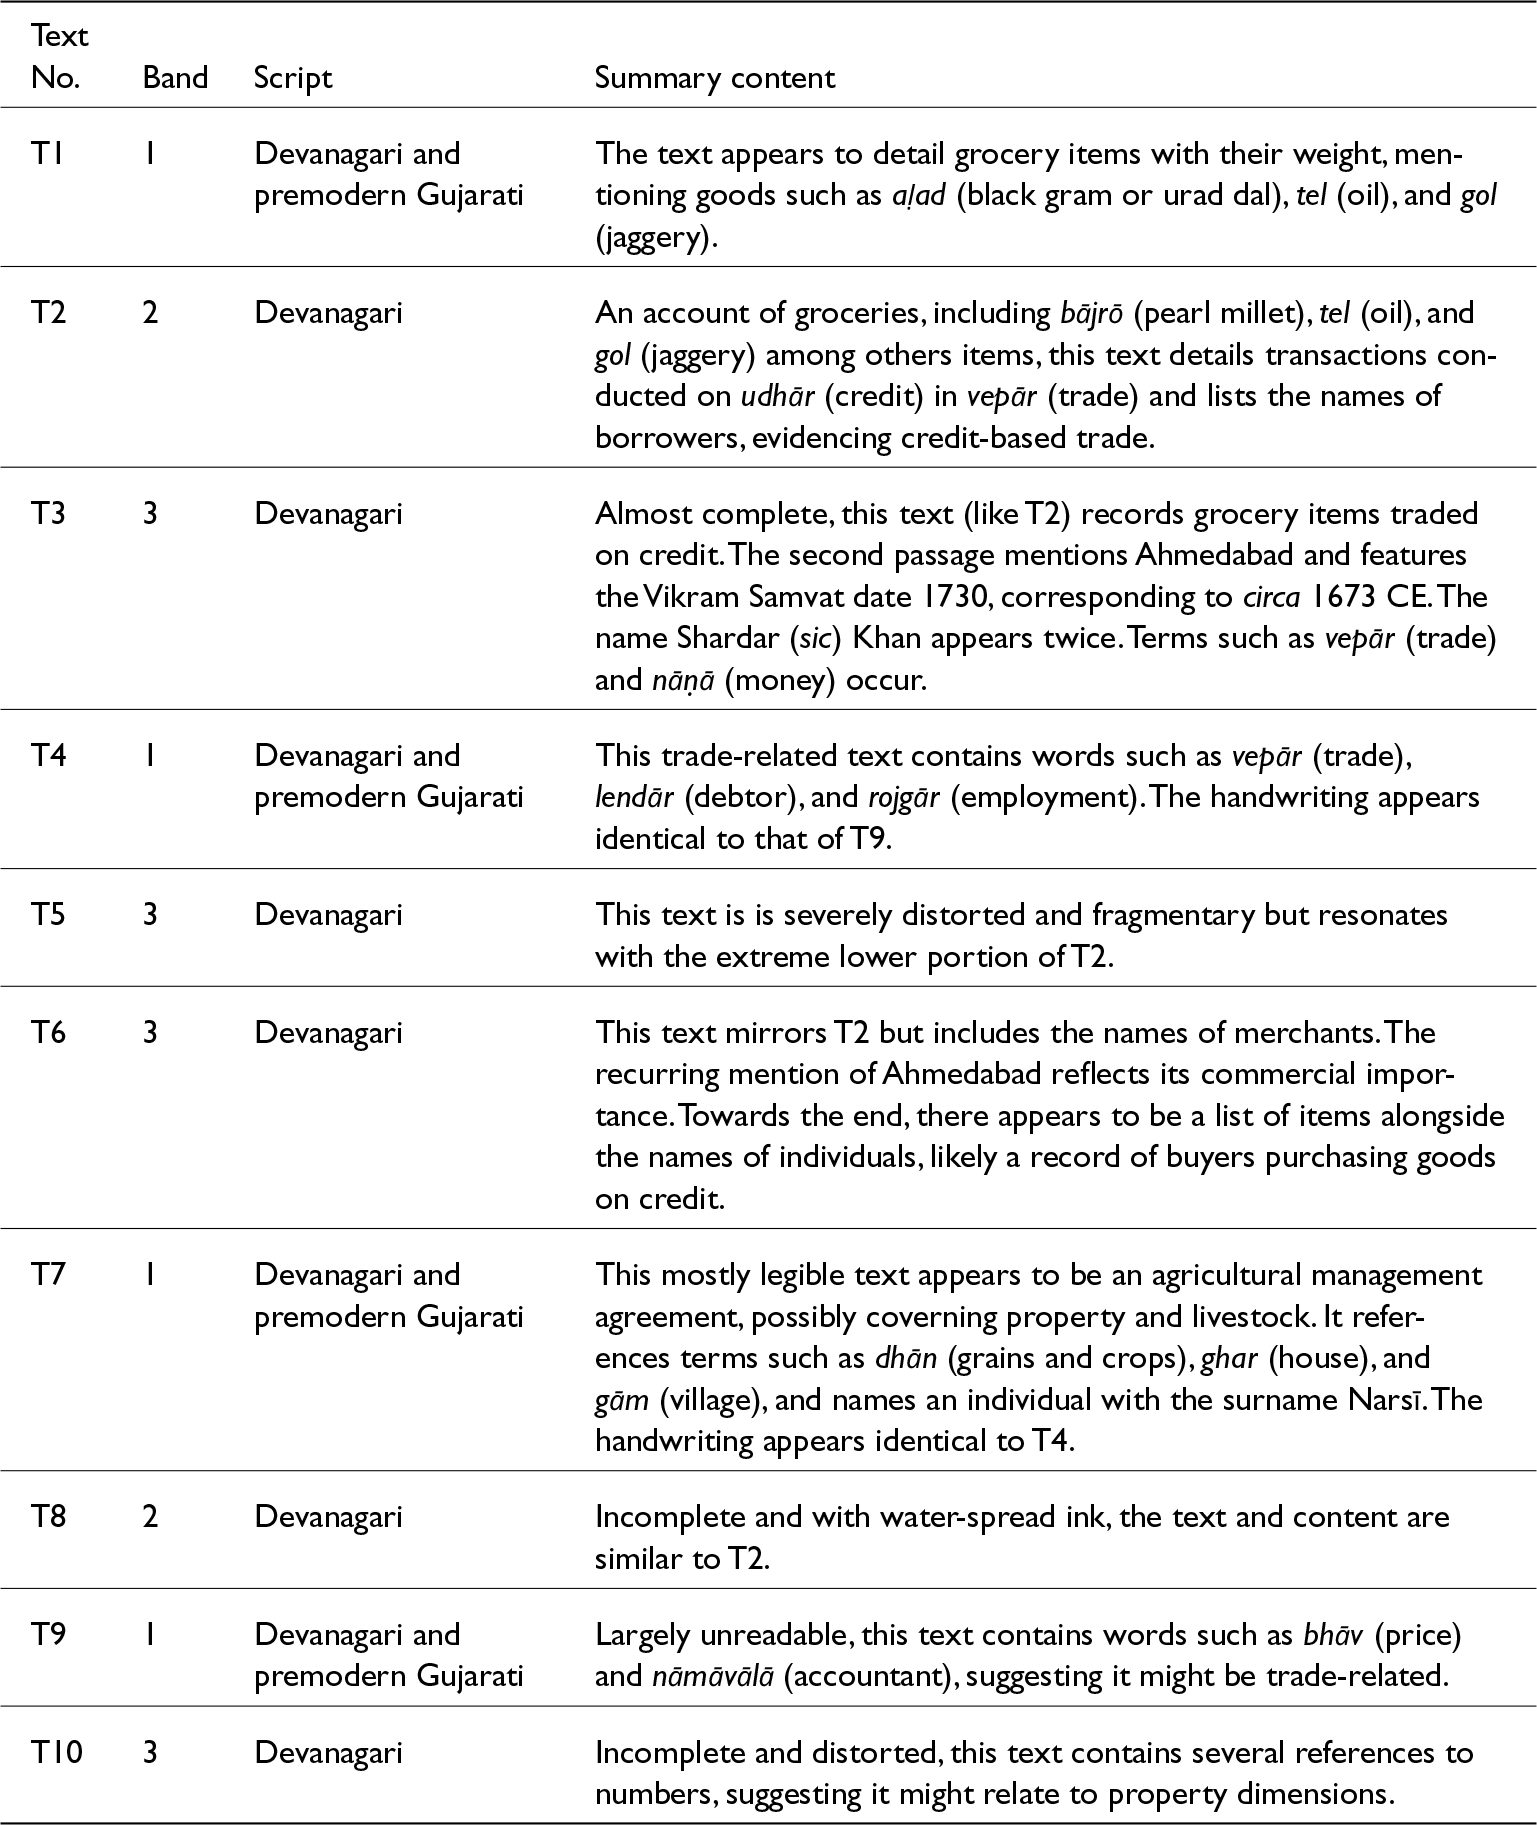

 Open access