


1 How Voters Form Left-Right Images of Parties
It is difficult to overstate the importance of the “left-right” metaphor to how elites provide, and voters consume, information about politics in the western democracies. Such broad, shared summaries of complex political reality emerge, as Benoit and Laver (Reference Benoit and Laver2012:198) remind us, “because people over the years have found them simple and effective ways to communicate their perceptions of [the] similarity and difference[s]” between political parties, politicians, and voters. Despite decades of sustained scholarly attention, however, there is still no widely accepted view of exactly what, for a typical voter, these perceived “similarity and differences” are. While a great deal of scholarship assumes voters use the left-right as a way to summarize and compare policy differences between parties, candidates, and other voters, an equally large body of work doubts this policy-centric interpretation on the grounds that most voters cannot (or simply do not) map most policy debates to coherent positions on the left-right (Adams et al. Reference Adams, Ezrow and Somer-Topcu2011, Kinder and Kalmoe Reference Kinder and Kalmoe2017). So, how do voters form their left-right images of parties? Are these images sensible? Do they respond to the kinds of policies, values, and partisan drivers that have animated so much of the discussion of how voters use (or do not use) the left-right?
In this Element, we try to answer these questions by first organizing many of the scattered theoretical ideas in the existing literature under a single theoretical umbrella that models voters’ left-right images of parties as an ecologically rational heuristic inference (Gigerenzer Reference Gigerenzer2008). This theoretical approach has been widely used across disciplines (Hertwig et al. Reference Hertwig, Leuker, Pachur, Spiliopoulos and Pleskac2022) including in studies of the complex inferences that voters in multiparty democracies make about parties, such as attributions of responsibility for policy outcomes (Lin et al. Reference Lin, Stevenson, Tromborg and Fortunato2017, Fortunato et al. Reference Fortunato, Lin, Stevenson and Tromborg2021) and expectations about which cabinet coalitions are likely to form (Fortunato et al. Reference Fortunato, Lee and Stevenson2025). Thus, we hope that this study will contribute to a wider, progressive research program that has begun to understand how voters cope with the complexity of these systems.
Applying the theory of ecologically rational heuristic inference to voters’ left-right images of parties results in several testable hypotheses about the specific inputs (or cues) that ecologically rational voters will (or will not) use in inferring these images, and how these cues differ across contexts and individuals within the same context. To test these implications, we designed a novel factorial/conjoint experiment that asked survey respondents in Canada, Denmark, Germany, and the UK to place hypothetical parties on a left-right scale. As we explain later, this experimental approach overcomes key limitations of previous observational studies and is able, for the first time, to cleanly estimate the “cue weights” that different kinds of voters, in different contexts, use to infer the left-right images of parties. That said, in Online Appendix (hereafter OA) 4 we provide a careful comparison of the results from our conjoint design to a parallel observational design, based on real (rather than hypothetical) parties and using the same respondents.
In the rest of this section, we briefly review the theory of ecologically rational heuristics, apply it to the specific case of voters’ inferences about the left-right images of parties, derive the hypotheses we will test in subsequent sections, and discuss how these relate to previous theoretical and empirical efforts. That said, to preserve the bulk of our limited space for the research design and empirics, and because thorough discussions of both the theory of ecologically rational heuristics and relevant literature on voters’ left-right images of parties are available elsewhere, we keep these discussions short.Footnote 1
1.1 The Theory of Ecologically Rational Heuristics
We define a heuristic as a rule that maps a set of informational inputs (“cues”) and their weights to a target inference or belief in a way that requires less effort than more effortful alternatives.Footnote 2 As Fortunato et al. (Reference Fortunato, Lin, Stevenson and Tromborg2021) point out, however, this definition does little to tell us which cues (and cue weights) individuals will use for any particular heuristic inference. To do that, we need a theory that tells us which of the many possible heuristics that could be used to make a target inference actually are used. For this, we will rely on the theory of “ecologically rational heuristics,” which argues that individuals will use a heuristic if it is the best combination of “cheap, simple, and accurate” in the context in which it is used (Gigerenzer et al. Reference Gigerenzer, Hertwig and Pachur2011, Fortunato and Stevenson Reference Fortunato and Stevenson2013).
A heuristic is “cheap” if the values of relevant cues are widely known or easy to obtain. It is “simple” if the mapping or rule that aggregates cue values into an inference is easy for the average person to accomplish – for example, a simple compensatory function of cues and their weights (such as a linear additive one), or a non-compensatory function (such as “take the best”) that prioritizes cues with the largest weights.Footnote 3 Finally, a heuristic is “accurate” if it relies on (i.e., gives weight to) cues that, on average, lead to correct (or otherwise satisfying) inferences.
Importantly, the theory of ecologically rational heuristics assumes that the relative weights individuals give to different cues in making a target inference reflect relative differences in the long-term statistical associations between cue values and the real-world values of the target of inference in a given context. These associations need not be causal – any cue that is consistently associated with the target of inference (even if spuriously so) will do. Further, individuals come to know these weights subconsciously through a process of social learning that requires some exposure to the context in which the target of inference occurs.Footnote 4
A simple example illustrates the essential elements of the theory: Suppose we ask a person reared in the West, “Which Indian city is bigger: Delhi or Gwalior?” Most westerners will quickly guess the correct answer by instinctively applying a simple heuristic that relies on subconsciously learned associations between foreign city sizes and their prominence in western media, education, and culture. Thus, for individuals steeped in western culture, recognizing one non-western city but not the other (i.e., a “difference in recognition” cue) allows an immediate heuristic inference about the relative sizes of the cities (Pohl et al. Reference Pohl, Krütli and Stauffacher2017). In contrast, an individual who has not been exposed to western culture may not instinctively reach for this heuristic. Likewise, if the westerner is asked a different question like “which city is closer to Mumbai?” nothing in the common western cultural experience clearly indicates the answer to that question – for example, recognizing one city or the other is not helpful as a cue since differential city recognition is not statistically associated with cities’ relative distances from Mumbai.
The theory of ecologically rational heuristics thus sets a clear agenda for scholars who, like us, are seeking to use the theory to explain a particular heuristic inference. First, one must identify a set of cues that are likely to be statistically associated with the real-world outcomes that are the target of inference (in our case, the “real” left-right positions of parties). Usefully, the relevant academic literature on those outcomes will often provide a set of potential cues whose values have been shown, in previous empirical research, to be associated with the values of the target outcome. Second, one must adopt one or more (simple) aggregation or mapping functions to integrate cues into the target inference. In the work later, we assume that individuals use a simple linear-additive function to aggregate cues, though other aggregation functions could also be used. Finally, to generate a set of testable implications from the theory, one must evaluate the various candidate cues in light of the theory: Which are likely to be easiest for individuals to learn and most strongly associated with the target outcome? How do the answers to these questions differ across contexts and individuals? In the next section we apply this agenda to the question of how individuals infer the relative left-right positions of parties.
1.2 Applying the Theory of Ecological Rational Heuristics to Voters’ Inferences about the Left-Right Positions of Parties
To apply the theory of ecologically rational heuristic inference to voters’ inferences about the left-right positions of parties, the first thing we do is define clearly what the “real” left-right positions of the parties are – after all, the theory claims that voters’ ecologically rational heuristic inferences about these positions will depend on cue-weights that are proportional to the real-world statistical associations between the value of these cues and the true left-right positions of the parties. But, given that we cannot observe a party’s left-right position the way that we observe, for example, its number of legislative seats, what do we mean by its “true left-right position?”
To answer that question, it is useful to first recall that “left-right labels do not necessarily correspond to ‘natural’ political entities: they are invented, not discovered, by political analysts for the political establishment” (Arian and Shamir Reference Arian and Shamir1983:142). That is, the parties’ relative left-right labels or “positions” are contested products of elite discourse and are used by elites for their own purposes. Consequently, a party’s “true” left-right position at any given time is simply what political elites collectively perceive/define it to be.Footnote 5
While not often stated so starkly, one finds this idea repeatedly in the literature on the left-right generally. For example, Caprara et al. (Reference Caprara, Vecchione and Schwartz2017:395) argue that any explanation of voters’ left-right images of parties must be “a function of the ideological content of [elite] political discourse.” Similarly, Jost (Reference Jost2021:67–68) explains that “the ideological bundles or packages that are socially constructed by elites come to anchor the opposing poles on a left-right continuum in any given political context.” Further, “political elites such as elected officials, party leaders, and media representatives impose structure by simplifying the political environment. They can also strongly influence the specific contents of a political ideology, that is, its discursive superstructure.” Indeed, though they agree on little else, on this point Kinder and Kalmoe (Reference Kinder and Kalmoe2017:199) are in lock step with Jost: “Surveys of political experts, party programs, and election platforms around the world all reveal the same thing: among elites, left-right is the dominant language of politics.” Finally, Aldrich et al. (Reference Aldrich, Schober, Ley and Fernandez2018), along with many others, have pointed out that “parties’ use of the left–right scale is a precondition for voters’ use of the left–right scale” (Benoit and Laver Reference Benoit and Laver2006, Hare Reference Hare2022).Footnote 6
Thus, in our view, it is fair to say there’s a quite broad consensus in the literature that parties’ true left-right positions (relative to each other) are those positions, at any given time, that emerge from elite discourse. As such, an accurate (and ultimately satisfying) heuristic inference about a party’s true left-right position is one that matches the current elite consensus about this position (in a given context at a given time).
With this, the first item on our theoretical agenda is to identify a set of candidate cues that are associated with parties’ true left-right positions. Usefully, there is a vast inter-disciplinary literature that has explored the historical and philosophical roots of the left-right as used by elites as well as a dense and active empirical literature that has tried to measure the elite consensus about these positions, understand how and why it changes, and identify its drivers using roll call votes, legislative speeches, elite interviews, expert surveys, party manifestos, and campaign rhetoric.Footnote 7, Footnote 8
Given the size of this literature, we cannot, in this short section, do it justice. Thankfully, however, no such review is necessary since all we really need from this literature is to identify a set of variables that are empirically associated with parties’ true left-right positions and so are potential cues that voters may use in their heuristic inferences. Further, a careful (or even a cursory) reading of this literature immediately suggests four broad (and quite uncontroversial) classes of variables that scholars have argued are either drivers of, or are driven by, parties’ true left-right positions (and so will be associated empirically with those positions). These are party policy positions, party values, patterns of partisan conflict and cooperation, and patterns of party social group support.
For each of these broad sets of potential cues, the theory of ecologically rational heuristic inference requires that we ask two key questions: How widely accessible is information about the values of the cues across parties? And how strongly are the cues’ values associated with the true left-right positions of parties? If a given cue is both widely available and strongly associated with the parties’ true left-right positions, the theory of ecologically rational heuristic inference predicts that voters will weigh it heavily in forming their left-right images of parties.
In addition, because these four cue-categories are quite broad, we can ask the same two questions about the availability and accuracy of different cues within the same broad category. Doing so makes it clear that we should expect the cost (or availability) of specific cues, as well as their associations with the true left-right images of parties, to vary systematically for different specific cues within each cue category. For example, we argue – echoing previous work by Plescia and Staniek (Reference Oesch and Rennwald2017) and others – that salient policies on which elites are polarized will exhibit stronger empirical associations with parties’ true left-right positions. These policies are also cheaper for voters to gather information about, leading voters to weigh cues from such policies more heavily in their ecologically rational heuristic inferences about parties’ left-right images. More generally, for each cue category we can identify a set of variables that the theory says should alter the “signal value” of different specific cues within the categories. Thus, we can test these expectations to evaluate the usefulness of the theory.
While we provide our specific theoretical arguments later in separate discussions of each cue category, it is worth pointing out here that each of the variables that tend to increase or decrease the empirical association between specific cues and the true left-right positions of the parties in a given context is (consistent with our definition of the true left-right positions of parties) very much elite driven. For example, a policy on which elites become more polarized will become a better cue for voters because this increases the true empirical association between the policy and what elites mean when they say one party is left or right of another. Likewise, if elites deemphasize the idea that parties represent specific social groups, as Przeworski and Sprague (Reference Pohl, Krütli and Stauffacher1986) argue Socialist elites did with respect to the working class, this will alter the long-term empirical association between support from the working class and what (elites) mean when they say a party is left or right. Finally, if elites in multiparty democracies begin to use left-right language to mainly denote “my team” or “your team” without reference to policy, values, or social groups – as, for example, Arian and Shamir (Reference Arian and Shamir1983) argue happened in Israel – then we would expect a stronger empirical association between patterns of partisan cooperation and conflict and the elite consensus about the parties’ relative left-right positions.
In the rest of this section, we examine each of the four broad classes of drivers identified earlier. For each, we ask what the literature tells us about their empirical associations with parties’ true left-right positions, the extent to which the values of each of the potential cues in each category are easily available to the average voter, how both these things should vary systematically across specific potential cues within each broad category (e.g., specific policies within the policy category), and how we should expect the use of these cues to vary for individuals with different levels of political sophistication.
1.3 Potential Cues about Relative Party Policy Positions and Values
The most obvious set of cues that voters may use to inform their left-right images of parties are the ones to which classical democratic theory gives pride of place: the parties’ policy positions. Indeed, for many scholars, parties’ aggregated policy positions are the definition of the left-right.Footnote 9 For example, Adams et al.’s (Reference Adams, Ezrow and Somer-Topcu2011) study showing that voters left-right images of parties do not track changes in party manifesto positions sparked a mountain of subsequent work either supporting or challenging this conclusion (see OA1.7 for citations). None of this work, however, questioned Adams et al.’s implicit assumption that (for voters) the left-right is primarily about policy. Whether this exclusive focus on policy is warranted is one of the questions we hope to answer in this Element. However, whether it is or is not, the point here is that most scholars who have asked how voters form and maintain their left-right images of parties have been primarily concerned with the policy content of these images.Footnote 10
Similarly, other scholars – usually motivated by doubts about the ability of the average voter to track the positions of parties on specific issues – have suggested that many voters find it easier to learn and remember a set of broad value differences between the parties rather than specific policies (e.g., Knutsen Reference Knutsen1995, Reference Knutsen1997). Further, our arguments about policy and values tend to closely parallel one another, so in this section we combine our discussion of party policy positions and party values as potential cues that voters may use in their ecologically rational heuristic inferences.
In the rest of this section, we interrogate the relevant scholarly literature as to whether the long-term empirical association between party policies/values and their true left-right positions is likely to be large or small and homogenous or heterogeneous across different policies/values cues. Likewise, we will need to evaluate (again largely based on the literature) the accessibility (or cost) of the relevant policy/values cues. If the literature supports (1) the existence of robust long-term empirical correlations between parties’ policy/value positions and their true left-right positions and (2) the widespread knowledge of these positions, then we should expect voters to weigh policy/values cues heavily in their ecologically rational heuristic inferences about the left-right positions of parties.
1.3.1 The Empirical Association between Parties’ Policy Positions and Values and Their True Left-Right Positions
There is little doubt that across the western democracies, there is a strong association between the parties’ relative policy positions and values and the elite consensus about their relative left-right positions. Empirical studies of which policy positions tend to be “bundled together” in party manifestos, campaign and legislative speeches, roll call voting, voter advice applications, and expert judgments consistently find that the large complex policy spaces in which parties compete can be reduced to a few, and often one, aggregate policy dimension(s).Footnote 11 Further, this work has consistently identified, at least for the western democracies, cross-nationally comparable sub-dimensions of the left-right that concern the appropriate role of the government in the economy, including provision of a social safety net, government regulation, and taxes. Likewise, at least since Inglehart and Klingemann’s (Reference Inglehart, Klingemann, Budge, Crewe and Farlie1976) work on value change in western societies, most scholars have also looked for (and found) a coherent sub-dimension of the left-right that is about the government’s role in regulating social life and supporting or eroding existing social hierarchies, including debates over gender equality, reproductive freedom, multiculturalism, immigration, and the treatment and rights of historically excluded groups like racial and ethnic minorities and sexual minorities (e.g., Huber and Inglehart Reference Huber and Inglehart1995, Hooghe and Marks Reference Hooghe and Marks2009, Bakker et al. Reference Bakker, Jolly, Polk and Poole2014).
Further, while historical and long-term quantitative studies have demonstrated that the exact policy content of the left-right changes over time, this is an elite-driven process in which parties adjust the left-right to encompass new issues and new frames of old issues. Ultimately, as De Vries et al. (Reference De Vries, Hakhverdian and Lancee2013:228) conclude, “the left-right dimension in Western Europe has a strong integrative capacity for absorbing new issues into this ideological conflict and ever-changing substantive meanings, depending on the immediate political context.” As such, left-right labels never become completely untethered from policy.
That said, empirical work on the strength of the association between parties’ relative policy positions and their true left-right positions has been mixed, perhaps reflecting differences in political and temporal context. For example, Fortunato et al. (Reference Fortunato, Stevenson and Vonnahme2016) used data on fourteen policy dimensions in sixteen western democracies between 1992 and 2004 to estimate mostly middling and variable (across countries) correlations between the relative left-right positions of parties and their relative positions on many more narrowly defined issues (e.g., using manifesto and expert placements of parties).Footnote 12 Similarly, Dahlberg and Harteveld’s (Reference Dahlberg and Harteveld2016) analysis of these kinds of correlations in Sweden – a case they argue is among the most likely of the western democracies to produce a robust correlation – finds that increasing a person’s knowledge of parties’ left-right positions from the least to the most in their sample does improve knowledge of the relative positions of parties on more narrow issues – but only by a modest 17% (derived from the results of Model 6 in their Table 5).
In contrast, recent work has shown that these kinds of correlations can be high for countries, periods, and policies experiencing high levels of polarization (Hare Reference Hare2022, Mehlhaff Reference Mehlhaff2025). Specifically, the empirical association between parties’ policy stances and their left-right positions seems to have gotten stronger in many western democracies – as elites have polarized and “conflict extension” has brought many previously less ideological policies into line with the broader left-right policy agendas of the parties (Layman and Carsey Reference Layman and Carsey2002a, Reference Layman and Carsey2002b, Baldassarri and Gelman Reference Baldassarri and Gelman2008). DellaPosta (Reference DellaPosta2020), for example, uses forty-four years of US data on a very wide set of policy (and some non-policy) attitudes to show that over time there has been a substantial increase in the breadth of attitudes that have become aligned with political ideology. As Hare (Reference Hare2022:1603) summarizes: Elite-driven “conflict extension serves to facilitate ideological thinking in the mass electorate by more clearly connecting policy positions and defining ‘what goes with what’ across a wide range of issues.”
Finally, political theorists studying the historical evolution of elite discourse about the political left and right in the West have identified the source of the consistent association between party policy preferences and left-right labels in deeper value conflicts that may underlie many of these specific policies. Indeed, a scholarly consensus has emerged on the idea that the policy conflicts summarized by the left-right (at the elite level) correspond to two primary value dimensions: positions on equality and maintenance or rejection of the status quo power relationships in society.Footnote 13,Footnote 14 More generally, the policies that empirical studies have found to “go together” in party programs, speeches, and so on often reflect a coherent political ideology (again, at the elite level) based on the parties’ broad values. To the extent this is true, values and policy will provide similar kinds of cues about a party’s true left-right position. That said, one distinctive feature of values compared to policy is that a party’s values are much less likely to change than are its policy positions (i.e., for tactical or short-term reasons). A value is (almost by definition) resistant to change.
Of course, if party values are less mutable than policy positions, the theory of ecologically rational heuristic inference make a clear prediction: Since heuristic inferences based on value cues will produce more accurate left-right images than those based on the policy cues (because they will have more consistent long-term associations with the parties’ true left-right positions), voters should put more weight on values cues than policy cues. Usefully, our empirical work can directly compare the impact of party policy positions versus broader values on voters’ left-right images of parties and so can test this expectation.
In sum, the message from the previous literature is clear: Parties’ policy stances tend to be organized at the elite level into one (or a small number of) ideological dimension(s) that most political observers would easily associate with left-right labels (and that are closely tied to parties’ broad values). While both the specific policy content of the left-right and the strength of the empirical associations between party positions on these issues and their true left-right positions may be different across contexts and over time, there is enough continuity in these connections (in any given context) that voters could, in principle, discern them (at least subconsciously). Whether they actually do, however, depends (according to our theory) on whether information about the policy positions of parties is widely available and inexpensive (in terms of mental and/or physical resources) to collect – a question to which we now turn.
1.3.2 The Availability of Cues about Parties’ Policy and Values Positions
Even in cases in which there’s a strong correspondence between parties’ relative positions on specific values/policies and their positions on an aggregate left-right scale, scholars have long questioned whether most voters could ever really make use of this correlation in the construction of their own beliefs. Most famously, Converse (Reference Converse1964) found that only about 17% of the US public could both assign the terms “liberal” and “conservative” correctly to the US parties and say something sensible about what the terms mean. Similarly, Klingemann (Reference Klingemann, Barnes and Kaase1979) found that most European voters do not know what sorts of policy positions are associated with the labels “left” and “right,” and Levitin and Miller (Reference Levitin and Miller1979:751) highlighted the puzzle posed by the fact that voters indisputably use the left-right to order parties but do so with relatively little issue knowledge:
… the general picture of a public “with little comprehension of [the] ideological meaning [of the left-right]” persists, even though 70 percent or more of the citizens in these mass electorates may use them to describe political parties.
More recently, Adams et al.’s (Reference Adams, Ezrow and Somer-Topcu2011:372) review of the relevant literature concludes that “there’s extensive empirical research that argues that large segments of the mass public are inattentive to and uninformed about political issues.” Likewise, Kinder and Kalmoe (Reference Kinder and Kalmoe2017) have forcefully articulated the fairly common empirical conclusion, for the American case, that only about 30% of American citizens have any sort of coherent ideological framework that structures their policy preferences. Further, even if one allows that a person’s personal sense of ideology (or ideological identification) can be consequential without a coherent connection to policy (Jost Reference Jost2021), one can hardly extend this allowance to beliefs about the policy positions or values of parties. If voters are using policy/values cues to inform their heuristic inferences about the left-right images of parties, it is hard to imagine how they could do this without actual knowledge of those cues.Footnote 15
Of course, one can take such skepticism too far. There are clearly segments of the population with fairly well-developed left-right ideologies who think of the left and right in policy terms (and will report that view if asked). Further, there’s considerable evidence that policy positions play an important (though not dominant) role in left-right self-placements (see the work cited in OA1.8) as well as recent work that has demonstrated some voters do update their beliefs about the left-right positions of parties when those parties make visible changes on highly salient policies (e.g., Plescia and Staniek Reference Oesch and Rennwald2017).
Perhaps the least controversial take-away from the literature on what voters know about the policy positions of parties is simply that some voters (perhaps about 30%) certainly do know the relative positions of parties on most of the important issues of the day, while for others their grasp of these issues is less secure. More generally, this literature makes clear the absolute necessity that scholars account for voters’ different levels of political knowledge and sophistication in any analysis of their views about party policy. Indeed, rather than an arbitrary cut off (like the 30% number), scholars in this area should strive to account for variation in voters’ levels of political sophistication across its whole theoretical range. As we explain later, this is exactly what we try to do in this Element.
Finally, whatever the level of political sophistication required to understand the relative positions of parties on specific policies, it seems likely (and scholars have certainly argued) that knowledge about parties’ broad values should be more readily available to all voters, even at lower levels of political sophistication (Balogh et al. Reference Balogh, Horne, Adams, Weschle and Wlezien2025). Likewise, it seems reasonable to assume (as we argued earlier) that the empirical association between these broad values and the elite consensus about the relative left-right positions of parties is stronger than for specific policies. Both these conclusions follow readily from the simple fact that parties’ broad values are much less likely to change over short periods of time (e.g., due to tactical or strategic considerations) and are much more likely to be justified (by elites) as part of a coherent ideological system that is readily interpreted as part of the left-right. Thus, we expect less sophisticated voters to weigh values more heavily than policy in their ecologically rational inferences about the left-right images of parties.
At the same time, party values may also play a special role in more sophisticated voters’ left-right images of parties. Specifically for the most sophisticated voters, parties’ values and policy positions will not only be well understood but will be integrated into a coherent ideological structure that mirrors that of elites. Indeed, given that sophisticated voters are likely to have the ability to differentiate short-term tactical position-taking from long-term ideological commitments, we should expect them, like less sophisticated voters (though for different reasons), to put more weight on values cues than policy cues in their left-right images of parties.Footnote 16
The prediction that less sophisticated voters will know more about party values than policy (and so put relatively more weight, ceteris paribus, on the cues about the former) is echoed in Goren et al.’s work (Reference Goren, Smith and Motta2022) on human values, where they show that “universalism and tradition/conformity predict liberal-conservative [left-right] self-placements to a comparable degree for people at all levels of sophistication.” Furthermore, they find that the most sophisticated individuals in their study “do a better job grounding operational ideology in human values” – that is, they can tie values to policy in a more integrated and useful fashion. Thus, while the impact of values on left-right self-placements is strong at all levels of political sophistication, it is stronger still for the most sophisticated.
1.3.3 Systematic Heterogeneity in the Value (to Voters) of Different Policy Cues
While the discussion earlier was cast in terms of policy and values cue categories, voters do not experience cue categories. Instead, they engage messages (or not) about specific party policy positions or values. Thus, it’s important to ask whether some party policy positions or values may provide more informative cues than others and/or be less costly to collect.
Usefully, current scholarship gives a clear answer to these questions. Specifically, if we translate this literature into the language of ecologically rational heuristics, it says that the policies and values dimensions that we should expect to get the most weight in voters’ ecologically rational heuristic inferences will be the ones that are both most salient to the parties (and other political elites) and on which the parties are most polarized.
When parties are polarized on an issue, party elites espouse homogenous positions on the issue that are quite different from the (internally homogenous) positions of other party elites (Levendusky Reference Levendusky2010, Gidron et al. Reference Gidron, Adams and Horne2020, Mehlhaff Reference Mehlhaff2025). This enhances (relative to other issues) the empirical association between party positions on this issue and the parties’ true left-right positions. In other words, the “signal” that these positions send to voters about the left-right positions of parties should be stronger. Likewise, when parties increase the salience of a policy by emphasizing it in their political campaigns and policy work, they naturally make it accessible to a wider swath of voters (at lower levels of political interest and sophistication). As Levendusky (Reference Levendusky2010:114–15) summarizes for the American case, “When elites are polarized, they send voters clearer signals about where they stand on the issues of the day.”
While not motivated by the theory of ecologically rational heuristic inference, an international empirical literature exploring the impact of party policy on voters’ left-right images of parties has come to the same conclusion regarding the importance of issue polarization and salience on the signaling value of specific policies. These include (among others) Giebler et al.’s (Reference Giebler, Meyer and Wagner2021) analysis of policy changes by the German AfD, which demonstrates that these policy changes were only perceived by voters when elites talked extensively about them. Likewise, Plescia and Staniek (Reference Oesch and Rennwald2017) used panel data from Germany, the UK, Ireland and the Netherlands, to show that voters can only perceive parties’ policy shifts on salient issues while “remaining oblivious to parties’ changing positions on issues that they do not consider important.” Further, De Vries et al. (Reference De Vries, Hakhverdian and Lancee2013) demonstrated that as immigration and related cultural issues became more salient among Dutch elites (and parties mobilized around these issues), voters’ left-right self-placements more heavily reflected these issues instead of issues around redistribution. Finally, Adams et al. (Reference Adams, De Vries and Leiter2012) showed that elite de-polarization around specific issues produces lower rates of partisan sorting among voters.Footnote 17
Summarizing much of this literature, Hare (Reference Hare2022:1604) concludes that the extent of policy constraint among voters in a given context is tied to the “amount and clarity of ideological conflict present in the political environment” and points out that a primary response, in the American politics literature, to Converse’s critique of American voters in the 1950s has been to identify other times and places in which ideological conflict was more pronounced and voters’ levels of ideological constraint accordingly stronger.
1.4 Potential Cues about Partisan Conflict and Cooperation
Over the last decade, political scientists’ traditional focus on the policy/values drivers of voters’ left-right images of parties has given way to other potential influences on these images. Most importantly, several lines of work have converged on the idea that in multiparty systems, voters’ relative left-right images of parties reflect (in part) the extent to which they think of parties as allies or enemies. One line of work has shown that voters perceive parties’ left-right positions to be closer together when those parties join formal governing coalitions (Fortunato and Stevenson Reference Fortunato and Stevenson2013, Fernandez-Vazquez Reference Fernandez-Vazquez2014, Fortunato and Adams Reference Fortunato and Adams2015, Adams et al. Reference Adams, Ezrow and Wlezien2016, Spoon and Klüver Reference Spoon and Klüver2017). Further, this effect increases the longer the coalitions last (Fortunato Reference Fortunato2012) and occurs when cooperation is informal (Falco-Gimeno and Munoz Reference Falcó-Gimeno and Muñoz2017, Adams et al. Reference Adams, Weschle and Wlezien2021, Santoso et al. Reference Rapeli2024).Footnote 18
As Fortunato et al. (Reference Fortunato, Stevenson and Vonnahme2016) point out, while these empirical results are compatible with the idea that voters are using changes in partisan cooperation as a cue for policy change (i.e., parties that govern together have more closely aligned policy preferences), it could also be that voters do not use patterns of partisan conflict and cooperation mainly to infer parties’ aggregate policy positions, but are instead simply part of what the left-right means to voters, quite independent of policy. That is, “quite apart from any specific policy content, when a party is on the ‘left’ or ‘right,’ this tells the voter which other parties should be considered allies and which enemies” (Fortunato et al. Reference Fortunato, Stevenson and Vonnahme2016:1213).
Indeed, this is exactly the interpretation that Arian and Shamir (Reference Arian and Shamir1983) provided for how the left-right became an important organizing metaphor for Israeli voters, even though it never effectively aggregated that complex, multidimensional policy space. Specifically, they use a great deal of data to track how Israeli voters came to use left-right language not to indicate constellations of coherent policy positions but as indicators of party membership (and degrees of membership) in broad political coalitions.
Recent summaries of the relevant literature have also come to this interpretation and point out its broad compatibility with earlier work on the partisan component of left-right self-placements. For example, Vegetti and Sirinic (Reference Swaan2019:263) conclude:
In general terms, left and right are just cues, usually given by parties with respect to other parties, and citizens learn their meaning based on what parties use them for. In a given context, they may be frequently linked to different substantive policies, and citizens will learn to use them to organize policy concepts. Alternatively, they may be used in a more relational way, to define the borders of political groups, and qualify oneself and others as part of a given group or not. In this case, people will get used to referring to left and right as political groups and will regard left–right positions as group memberships.
This view leads to novel hypotheses about the conditions under which voters’ beliefs about the policy positions of parties will change. To take just one example, it clearly suggests that new parties’ decisions about which other parties to cooperate with will be crucial (and more important than their policy stances) in shaping voters’ beliefs about where they fit on the left and right. This may be particularly relevant for new parties like the Danish Alternativet and the Italian Five Star Movement, whose policy profiles are (almost by design) hard to pin down; but that have had to make decisions about which other parties to cooperate with. Likewise, this viewpoint may suggest a need to reassess the reasons voters’ beliefs about the left-right positions of parties like the Greens have evolved over time. For our purposes, this literature suggests that patterns of partisan cooperation and conflict may provide an accurate and inexpensive cue for voters’ ecologically rational heuristic inferences about the true left-right positions of parties. Of course, whether that is likely to be true depends on the long-term empirical association between patterns of partisan cooperation and conflict and the true left-right positions of the parties (in a given context) and whether voters actually know these patterns.
1.4.1 The Empirical Association between Patterns of Partisan Conflict and Cooperation and Parties’ True LR Positions
There is a huge body of work in political science relevant to accessing the strength of the empirical association between patterns of partisan conflict and cooperation and the true left-right positions of parties. Specifically, students of coalition formation have long used the left-right relationships between parties as a primary predictor of the chances that those parties will cooperate formally in coalition cabinets. Early work on the drivers of coalition formation demonstrated that ideologically “connected” coalitions are more likely than unconnected ones (e.g., Axelrod Reference Axelrod1970, De Swaan Reference Swaan1973) and later statistical models of coalition formation extended that result to the general finding that, across the coalitional democracies, ideological compactness is a decisive factor in determining which of the myriad of potential cabinets that could form actually do (Laver and Schofield Reference Laver and Schofield1998, Martin and Stevenson Reference Lin, Stevenson, Tromborg and Fortunato2001, Reference Martin and Stevenson2010, Laver and Schofield Reference Laver and Schofield1998). More recently, studies of how voters form expectations about which cabinets are likely to form demonstrate that these expectations depend crucially on voters’ beliefs about the relative left-right positions of the parties (Hobolt and Karp Reference Hobolt and Karp2010, Lachance Reference Lachance2023, Fortunato et al. Reference Fortunato, Lee and Stevenson2025).Footnote 19 Further, Fortunato et al. (Reference Fortunato, Stevenson and Vonnahme2016) showed that voters are better able to order parties correctly on the left-right in contexts in which the left-right plays a bigger role in predicting which cabinets form.
Overall, the last fifty years of coalition research leaves little doubt that there’s a robust correlation in all the western democracies (in which coalitions usually form) between parties’ left-right positions and the extent to which they cooperate formally. Further, more recent work on informal cooperation extends this result to parties that do not regularly join cabinets and systems, like the UK, in which coalition cabinets are rare (Adams et al. Reference Adams, Weschle and Wlezien2021, Santoso et al. Reference Rapeli2024).
1.4.2 The Availability of Cues about Partisan Cooperation and Conflict
While there’s clearly a robust connection between parties’ relative left-right positions and their patterns of conflict and cooperation at the elite level, that does not mean that voters know these patterns and so use them to infer parties’ relative left-right images. Several lines of empirical work, however, give us some idea of how widespread knowledge of patterns of partisan conflict and cooperation really are. First, a small body of empirical work asks whether voters know which parties are in coalition cabinets.Footnote 20 This work generally finds that voters in multiparty democracies overwhelmingly know the identity of the current PM and large numbers know whether individual parties are in or out of the current cabinet. For example, Rapeli (Reference Pohl, Krütli and Stauffacher2016) found that 93% of Finnish respondents knew the party of the Finnish PM in 2008, which mirrors results reported in Duch and Stevenson (Reference Duch and Stevenson2008:290). Lin et al. (Reference Lin, Santoso and Stevenson2025) found that almost 90% of Canadians, Danish, German, Dutch, and British respondents (surveyed around 2020) could correctly identify the current PM. Likewise, 68% of Finns in Rapeli’s survey could identify the two major parties in the Finnish four-party coalition. Similarly, Lin et al. (Reference Lin, Santoso and Stevenson2025) find that about 80% of respondents in Germany correctly identified the SPD as a cabinet partner in 2019 and again in 2020; more than 79% of Dutch respondents in 2020 correctly identified the CDA as a cabinet partner, and about 60% identified D66 and CU as cabinet partners well.
That said, when it comes to identifying the whole cabinet rather than correctly identifying the role of any one party, the rate of correct responses declines precipitously. For example, Rapeli (Reference Pohl, Krütli and Stauffacher2016) finds that only 38% of Finns could correctly identify the full four-party cabinet that was in office in 2008, and Lin et al. (Reference Lin, Santoso and Stevenson2025) find that only about 50% of the respondents in their two German samples, respectively, could identify the whole cabinet composition; this rate was 31% in the more complex four-party cabinet in the Netherlands (2020).
Taken together, we agree with Rapeli (Reference Pohl, Krütli and Stauffacher2016, Reference Rapeli2018) that this pattern suggests that voters’ knowledge of partisan patterns of formal cabinet cooperation is likely based, for many less politically interested voters, on longer term understandings of the kinds of parties that tend to get into cabinet together rather than specific knowledge of the current cabinet. Given widespread knowledge of which party is the PM, this allows many voters, when asked who is in the cabinet, to name parties that are known to coalesce regularly with the current PM (whose identity they do know). This sort of “educated guessing” results in much better performance party-by-party than for the cabinet as a whole and is especially effective for larger, better-known, parties. For us, this suggests that voters may have a better grasp of parties’ longer-term patterns of (formal and informal) cooperation than the specifics of current cabinet compositions.
Usefully, we can get some insight into the extent to which voters have knowledge of the general (formal and informal) patterns of cooperation between parties using the four original surveys (and three pilots) that we describe in the next section. These were conducted in Denmark (2019), Germany (2018, 2019), Canada (2017, 2019), and the UK (2017, 2019) and showed respondents pairs of parties along with the following question:
How often do you think these two parties cooperate with each other in [your country’s] politics? [Answer categories: (0) “Never cooperate” to (10) “Almost always cooperate”]
We asked respondents about each pair of parties that had seats in the legislature at the time of the survey. The distributions of these “cooperation scores” over our respondents are all quite sensible, as illustrated in Figure 1 for the German case.
Distribution of perceived cooperation among German parties in 2019
Note: Vertical lines indicate average cooperation scores.
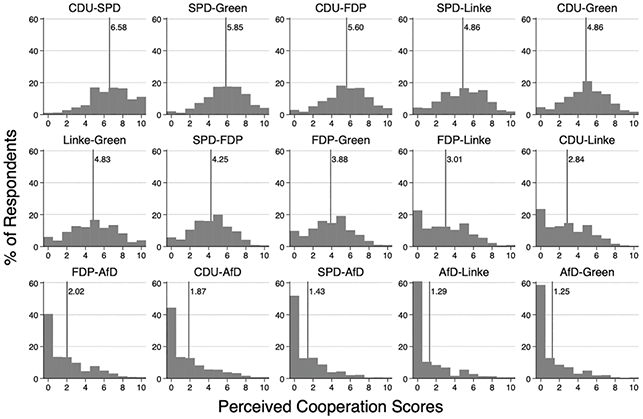
German voters, quite sensibly given the recent (pre-2019) political history of Germany, think the AfD and the Greens cooperate the least and the CDU and SPD, which had been in coalition for ten out of fourteen years at the time of the survey, cooperate the most. These sensible patterns of perceived partisan cooperation are encouraging and extend to other countries and party dyads in our data (see OA3.6).
Finally, Santoso et al. (Reference Rapeli2024) echo the idea that multiparty voters may have a clear sense of long-term patterns of partisan cooperation and conflict. They showed (using the same seven surveys described earlier) that survey respondents’ perceptions of the extent to which any two parties cooperate (both formally and informally) reflect real patterns of long-term historical cooperation between the parties as well as short-term fluctuations in informal cooperation (as indicated by cooperative and conflictual events between party-dyads as reported in the media).
Taken together, the existing evidence suggests that patterns of partisan cooperation and conflict may be an accessible cue for many voters – who seem to have a reasonable sense of the overall extent that different parties cooperate (even if this varies over party dyads and may not extend to specific knowledge of current cabinet composition).
1.4.3 Systematic Heterogeneity in the Value (to Voters) of Different Cues about Patterns of Partisan Conflict and Cooperation
Applying the theory of ecologically rational heuristics to cues about partisan cooperation suggests that not all patterns of partisan cooperation should be equally informative about the left-right positions of parties. Most clearly, the strength of the signal about one party’s left-right image that is provided by cooperation with another party should, if the theory of ecological rationality is correct, depend on the ideological “purity” of the latter party’s patterns of cooperation. Suppose, for example, that a voter observes a new party in two different scenarios: (1) the new party cooperates with an existing party that is known to cooperate exclusively with parties of the far left, and (2) the new party cooperates with an existing party that sometimes cooperates with the left, center, or right parties. Both common sense and the theory of ecological rationality suggest that the voter can glean more information about the true left-right position of the new party from the former pattern of cooperation than the latter.
In terms of the theory of ecological rationality, this is because in the former situation there will be a strong empirical association between cooperation with the existing party and the (elite consensus about the) cooperator’s left-right position, while in the latter that association will be smaller or nonexistent. More generally, we hypothesize that in forming their left-right images of a party, respondents will put more weight on cues about that party’s cooperation with other parties that are more ideologically “pure” in their patterns of cooperation than on cues about cooperation with parties that are more promiscuous in the parties with which they cooperate.
1.5 Potential Cues about the Social Basis of Party Support
A great deal of work in political science highlights the role that social groups play in organizing and producing support for political parties.Footnote 21 As such, we might expect these groups to have an impact on parties’ true left-right positions. In addition, strategic parties certainly court specific social groups by adjusting their policies, rhetoric, alliances, leadership, and candidates (i.e., the milieu of variables that result in an elite consensus about the party’s left-right position). Thus, from both “directions” we should expect a robust empirical association between the pattern of social group support for a given party and its true left-right position. Consequently, if voters also know something about these patterns of social group support, they may well be part of an ecologically rational heuristic for inferring the party’s left-right image.
1.5.1 The Empirical Association between Patterns of Social Support for Parties and Their True LR Positions
Scholars have long emphasized how parties’ policy programs, values, and image (all of which help make up the elite consensus about the left-right positions of parties) can depend on the social groups to which they owe allegiance or that they claim to represent. Indeed, much of the early literature on the development of both European and American parties and party systems explicitly characterized parties as representatives of particular constellations of social groups: Socialist and Communist parties were the parties of workers, Christian Democrats of various stripes represented religious voters, agrarian parties represented the interests of farmers, and so on (Lazarsfeld et al. 1944, Lipset and Rokkan Reference Lin, Stevenson, Tromborg and Fortunato1967, Hooghe and Marks Reference Hooghe and Marks2018).
Social groups can influence parties’ true left-right positions through several related mechanisms. First, a party’s leaders and elected officials may themselves identify with the social groups that most strongly support the party, for example, when socialist parties draw their leaders from union members and religious parties elevate the devout. Second, social groups that are seen as the core supporters of a party are likely to have an outsized influence on decision-making in the party (including its policy programs) and may even support the impression (in the minds of the elites whose consensus defines a party’s true left-right position) that the party’s “purpose” is to represent those groups and the demands of those groups. That is, elites see a party as “moderately left” because the social groups that support it are seen as demanding the policies, values, alliances, rhetoric, and symbology of a moderately leftist party. Third, to run election campaigns, parties need a legion of volunteers and party activists who are often drawn mainly from the social groups of their core supporters, enhancing the importance of appealing to these groups.
The modern relevance of this traditional understanding of parties as representatives of social groups has, of course, been questioned. A great deal of empirical work has demonstrated that many of the traditional bonds between social groups and parties (e.g., class and religious based groups) have weakened over time and have only partially been replaced by bonds with new social groups.Footnote 22 Przeworski and Sprague’s (Reference Pohl, Krütli and Stauffacher1986) central argument, for example, explains the decline of class-based voting in western democracies as the result of leftist elites purposefully de-emphasizing the idea that Socialist parties primarily represent workers. That said, the extent of decline in the social bases of party support in Europe is often overblown, and many scholars remain convinced that social identification is a primary driver of party support in Europe, even if the specific social identifications most relevant may have changed over time (Elff Reference Elff2007, Oesch and Rennwald Reference Oesch and Rennwald2018).
Finally, recent scholarship about the United States has gone from accepting the long, slow decline in the social bases of parties’ support, to championing the exact opposite: Voters’ allegiances are not only strongly conditioned by the social groups with which they identify, but this association has been strengthening for decades. Work by Green et al. (2002), Huddy et al. (Reference Huddy, Mason and Aarøe2015), and Mason (Reference Martin and Stevenson2018) has argued that the supporters of the two American parties have become sorted into distinct sets of overlapping social groups. Indeed, this line of work has reinvigorated the general theory of social group influence on partisanship and party support and contributed to calls for the development of a modern group theory of politics (Achen and Bartels Reference Achen and Bartels2017, Kinder and Kalmoe Reference Kinder and Kalmoe2017).
Of course, the large changes in the association between social group membership and party support that these studies have demonstrated for the United States should also remind us that there is nothing inevitable about them. They may exist in some periods and some countries and not others. Further, there is far less work on the extent of social group sorting outside the United States, and the limited evidence does not find nearly as much social sorting to parties in other western democracies as has been seen in the United States (e.g., Harteveld Reference Harteveld2021).
1.5.2 The Availability of Social Support Cues
Recent interest in partisan social sorting in the United States has generated a great deal of empirical work (using various methods, from conjoint designs to open-ended questions) showing that high levels of elite polarization in the United States has resulted in quite high levels of knowledge about the social groups which support the American parties.Footnote 23 As such, scholars like Achen and Bartels (Reference Achen and Bartels2017) who are skeptical of the average American’s ability to understand and use policy positions effectively have instead explicitly pointed to social group cues as a useful substitute, arguing that “the favorability or antagonism of candidates and parties toward various ethnic, religious or other social groups is much easier to learn than the intricacies” of various policy domains (p.232). Relevant empirical work on the United States agrees. For example, Konicki’s (Reference Konicki2025) recent review of studies in this area concludes, “[U.S.] partisans are well aware of these divides, readily classifying social groups as Republican or Democratic and stereotyping the parties on the basis of demographics.”Footnote 24
Many scholars studying European multiparty democracies (e.g., Dalton Reference Dalton1996:166) would agree that – relative to collecting information on parties’ detailed policy positions – “social characteristics provide a simpler, although less certain, method of choosing which party represents a voter’s interests.” Indeed, “when strong social-group identities are matched by clear party positions on these social cleavages, as they are in most European nations, then social characteristics can provide a very meaningful guide for voting behavior.” Further, though the actual empirical work exploring what (non-US) publics know about the pattern of social group support for parties is surprisingly limited, the empirical work that does exist tends to support the idea that the average citizen does know something about the pattern social support for specific parties.Footnote 25 For instance, Titelman and Lauderdale (Reference Swaan2023) use conjoint-like experiments to show that British voters can reliably guess partisan preferences from basic demographic profiles such as age, occupation, and education, indicating clear perceptions of partisan group alignments. However, the extent to which citizens outside the United States have clear stereotypes about which social groups support which parties remains understudied. Existing European research largely relies on identifying broad social cleavages (e.g., class, religion, or region) historically linked to parties rather than directly measuring citizens’ knowledge or stereotypes of these associations.
1.5.3 Systematic Heterogeneity in the Value (to Voters) of Different Cues about Parties’ Social Support
As with the other cues we considered, the theory of ecologically rational heuristics suggests that some party social support cues may be more useful than others for making inferences about the true left-right positions of parties. Specifically, the empirical association between a given social group cue and a party’s true left-right position should be stronger the more that particular social group tends to support only parties on one side of the left-right divide. For example, given that African Americans in the United States consistently support the Democratic Party at rates exceeding 90% (and the Republican Party at less than 10%), a voter observing that a new US party is supported by African Americans (and that Democrats are left of Republicans) should, quite reasonably, conclude that the new party is likely leftist. In contrast, knowing that a US party is strongly supported by middle-class voters, is much less likely to provide a clear signal of its left-right position because middle-class voters tend to split their votes for parties of the left and right. More generally, we should expect social support cues to be more effective as the long-term association between group membership and support for parties of the left or right is stronger.
One simple way to explore this kind of variation (using the survey data we will introduce in the next section) is to examine the extent to which voters in a given social group are systematically different in their left-right self-identifications from those not in that group. For groups in which the average member identifies much further left (right) than nonmembers, we should expect information about which parties that group supports to be more informative for drawing inferences about those parties’ left-right images than information about which parties are supported by groups with a more neutral left-right profile.Footnote 26
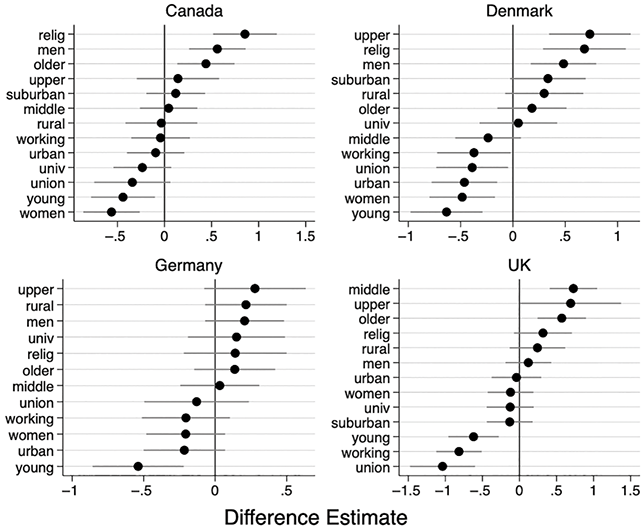
Figure 2 provides our estimates of the difference in the average left-right self-placement of the members of ~13 different social groups in four countries. Negative numbers indicate the average group member is to the left of the average non-group member (and positive numbers the opposite). Reassuringly, the directions of these effects are as expected: Workers are to the left of non-workers, upper-income voters are to the right of non-upper-income voters, religious voters are to the right of nonreligious voters, older voters are to the right of others (and younger voters to the left of others). In Section 3, we explore whether these differences predict the weight that our respondents put on the corresponding social support cues in inferring the left-right images of hypothetical parties, but for now the main point is that there is significant variation across groups in the extent to which group members’ and non-group members’ left-right self-placements differ (and so, ostensibly, the left-right positions they demand from parties). Thus, we should expect corresponding heterogeneity across groups in the impact of social group cues on respondents’ left-right images of parties.
Difference in average left-right self-placement of group vs. non-group members
Note: Negative (positive) differences indicate the average group member’s LR self-placement is to the left (right) of the average non-member. “Young” denotes those under 35; “old,” those over 54. Bars indicate 95% confidence intervals.
1.6 Political Sophistication
For all the cues discussed earlier, we can also ask whether voters with different levels of political interest, knowledge, and sophistication weigh them differently. The literature that sees parties’ left-right positions as mainly about policy has been preoccupied with such heterogeneity, since political sophistication is (by far) the most important individual-level predictor of whether an individual holds coherent policy views that they can integrate into a summary party policy position. That said, the theory of ecologically rational heuristics also suggests – in two distinct ways – that this kind of heterogeneity should matter.
First, since a key component of the theory is the cost of acquiring cue values (i.e., easier-to-access and less costly cues will be used more, ceteris paribus), more politically interested and knowledgeable individuals will have access to a wider range of potential cue values. Second, to successfully use a heuristic, an individual must have subconsciously acquired the true long-term associations between relevant cues and parties’ true left-right positions in a given context. While just living in a particular culture is probably sufficient to acquire many of the empirical associations that fuel simple heuristics (like the city recognition example earlier), this is likely not enough for more specific domains like politics. Instead, those who are more engaged with politics are likely to be exposed to more relevant elite discourse and develop stronger mental associations between various political concepts, including those that reflect the long-term empirical associations on which an ecologically rational left-right heuristic must rely.Footnote 27
If the complex process that leads to parties’ true left-right positions generates a set of empirical associations between cues and true party positions, we should expect more politically sophisticated citizens to weigh the most predictive of these cues most heavily.Footnote 28 Further, if multiple cues have nontrivial real-world weights, we should expect the politically sophisticated to put more weight on all these cues compared to those who rely only on their general cultural knowledge to assign weights to cues. Indeed, less politically sophisticated voters may well ignore weaker cues that are, while informative to some extent, only weakly associated with real outcomes – because these less politically sophisticated voters will not have internalized these subtler long-term associations to the extent that more politically sophisticated citizens will have.Footnote 29
Thus, given a set of relevant potential cues, the theory of ecologically rational heuristics implies that political sophistication should be positively correlated with larger cue weights in general. When these weights are large in the real world, sophisticated voters will have internalized that fact and weigh them heavily in their heuristic inferences. To be clear, while this suggests that sophisticated voters will weigh all available (informative) cues more heavily than less sophisticated voters, this does not mean that they will put more relative weight (across cues) on any given cue compared to less sophisticated voters.
Indeed, given that our cues differ in their accessibility and true associations with parties’ left-right positions, we should expect less sophisticated voters to favor (to the extent that they rely on any cues at all) more accessible cues relative to more sophisticated voters. Further, we have argued that some of the most accessible and predictive cues are to be found in the patterns of partisan cooperation and conflict (including which parties tend to govern together). Consequently, while we expect less-sophisticated voters to have smaller cue weights overall, we also expect that the relative size of these weights across cue categories will be skewed toward partisan cooperation cues.
1.7 Summary
Our discussion suggests several hypotheses regarding the relative weight different voters will place on different cues (in specific contexts). The clearest and most probative of these hypotheses are about the relative weight voters should give different cues within each of the four broad cue categories discussed earlier. Specifically, for each cue category, our theory predicts that voters should put the most weight on cues within the category that have the strongest long-term empirical association with parties’ true left-right positions and whose cue values are most accessible. That is, they should weight the specific cues within each category that send the strongest “signal” of a party’s true left-right position.
Thus, as summarized in Table 1 for each cue category, we can operationalize the strength of this signal in different ways for different cues and examine how well it predicts how strongly each specific cue impacts respondents’ left-right images of parties.
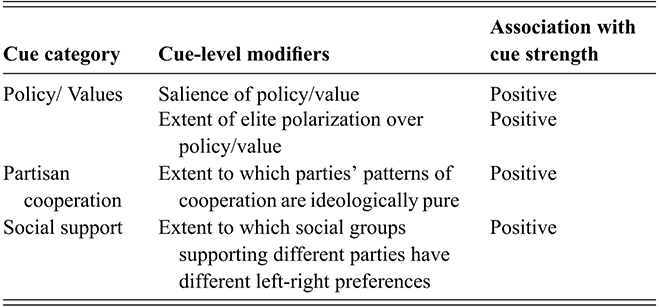
Table 1 Long description
The table has three columns: Cue category, Cue-level modifiers, and Association with cue strength. There are three cue categories, each with associated modifiers and a positive association with cue strength: 1. Policy/Values: Two cue-level modifiers are listed: (1) the salience of the policy or value, and (2) the extent of elite polarization over the policy or value. Both have a positive association with cue strength. 2. Partisan cooperation: One cue-level modifier is listed: the extent to which parties’ patterns of cooperation are ideologically pure. This has a positive association with cue strength. 3. Social support: One cue-level modifier is listed: the extent to which social groups supporting different parties have different left-right preferences. This has a positive association with cue strength.
Besides these within-cue-category hypotheses, our theory also provides some expectations about the relative weight voters (at different levels of sophistication) should give to cues across cue-categories. Specifically, we suggest that more sophisticated voters should weigh both policy and values cues heavily, with values cues playing an increasingly larger role as sophistication increases and a coherent ideology comes to organize these voters’ political worlds – for example, allowing them to recognize (as elites do) that parties often make strategic, short-term policy moves that are uninformative about their true left-right positions. Next, while we also expect sophisticated voters to put weight on cues about partisan cooperation and social group support, it is less clear a priori how these weights should compare with the weights they put on policy and values cues. Thus, we leave this as an empirical question to be explored in Section 3, where (to preview) we find that voters put increasingly more weight on cooperation cues as they are increasingly sophisticated, but this plateaus at mid to upper levels of sophistication, where values and policy come to play the larger role.
For less sophisticated voters, we expect weaker associations between all four cue categories and their left-right images of parties – since such voters are less likely to know cue values and to have internalized relevant cue weights compared to more sophisticated voters. However, to the extent that these voters use any cues, we expect that they will favor cues about partisan cooperation – since information about both the cue values (which parties tend to cooperate) and the relevant cue weights (the long-term empirical association with the true left-right positions of parties) is among the most easily accessible. In contrast, our theoretical discussion also makes it clear that we should expect policy cues to be less important to voters’ left-right images of parties as these voters are less sophisticated.
A similar argument applies, with less force, to values cues. Specifically, while integration of values into an ideology may be the sign of the most sophisticated voters, we would not be surprised if some less-sophisticated voters use values in a different way – that is, that they can incorporate widely accessible information about the very broad values of parties (e.g., learning in school that Socialists promote equality) into their left-right images of parties, even if this does not reflect any sort of coherent ideology.
Finally, while the literature points us toward the potential importance of social group support cues, the quite limited empirical work (outside the United States) documenting the extent of social sorting into parties leaves us uncertain about the extent to which we should expect these cues to be important to the voters we study (for both sophisticated and unsophisticated voters). If there are not (or are no longer) strong and well-known links between social groups and parties (e.g., African-American support for the Democratic Party) then such cues should not be particularly helpful to voters’ ecologically rational inferences about the left-right positions of parties.
2 Using Conjoint Experiments to Understand How Voters Perceive Left-Right Positions of Parties
In this section, we provide an overview of the usual research designs scholars have used to identify the drivers of voters’ left-right images of parties, discuss their strengths and weaknesses, and explain how a factorial/conjoint design, in which respondents place hypothetical parties (with various attributes) on a left-right scale, can contribute to progress in this area. We then describe the four main surveys we conducted (and three pilot surveys), explain the design of the conjoint experiments that we implemented in each, and finally discuss our strategy for using the conjoint experiment to estimate the relative weight that our respondents give to different cues in their inferences about the left-right placements of parties.
2.1 Research Designs Used in Previous Studies of Voters’ Left-Right Images of Parties
The previous empirical studies most relevant to the questions we ask in this Element explore why voters place real-world parties in particular positions on a left-right scale.Footnote 30 The typical research design asks respondents to place real-world parties on a left-right scale and tries to estimate the separate effects of some (theoretically identified) set of influences on these placements. The typical causal identification strategy is “selection on observables” – that is, controlling for a sufficient set of potential confounders. Meyer and Wagner (Reference Meyer and Wagner2020), for example, use data from the Chapel Hill expert surveys to measure both the salience and position of 190 parties from 28 countries on a range of economic and cultural issues. They then estimate the effect of these variables on voters’ perceptions of parties’ overall left-right positions. They do this while controlling for the importance of these issues in the party system, party sizes, and how extreme a party is on each dimension.
Another example is Adams et al. (Reference Adams, Bernardi and Wlezien2020), who attempt to estimate the impact of a party’s willingness to spend on social welfare on voters’ perceptions of its left-right placement. In their design, the dependent variable is the change in respondents’ perceptions of a party’s left-right position between two elections and the key independent variable is the party’s social welfare generosity index, with the left-right tone of the party’s current election manifesto and the change in the party’s manifesto tone between the current and the previous election serving as control variables.
Such designs face several challenges. The first is the problem of convincing a skeptical reader that all the important variables that may confound the relationship between the focal “treatment” variable and voters’ left-right placements of parties have been accounted for. Meyer and Wagner’s (Reference Meyer and Wagner2020) study is emblematic of the typical approach in this area. In testing their hypothesis that voters’ perceptions of party positions on the left-right spectrum are influenced by parties’ stances on economic and cultural issues, they argue that the controls they employ are essential because they are correlated with both their focal variables. However, it remains difficult to rule out the possibility that omitted variables are driving the observed relationships. For instance, historical party loyalty, media influence, or unmeasured cultural factors could all confound the link between parties’ policy stances and how voters place those parties on the left-right scale. While controlling for a comprehensive set of observable factors, such as party size, issue salience, and party extremism may mitigate some of these concerns, it is an ongoing challenge to account for all relevant confounders.
The second problem is the lack of sufficient independent variation in both the focal variables and the controls. In real-world politics, parties with economically left-wing positions tend also to hold culturally progressive views, and vice versa. This alignment makes it difficult to identify the individual influence of each dimension on voter perceptions. The study by Adams et al. (Reference Adams, Bernardi and Wlezien2020) illustrates this challenge: Changes in a party’s social welfare generosity are likely to be correlated with shifts in its overall left-right tone, making it difficult to isolate the effect of social welfare policy from broader changes in how the party positions itself on the left-right spectrum. In such cases, collinearity reduces the precision of the estimated effects and limits the ability to determine which specific party characteristic is driving changes in voter perceptions of left-right placement.
A third challenge is simply that observational studies like Meyer and Wagner (Reference Meyer and Wagner2020) and Adams et al. (Reference Adams, Bernardi and Wlezien2020) rely on voters’ perceptions of the characteristics of real-world parties. Voters, however, may have prior affective attachments to these parties so that their perceptions of the left-right placement of these parties may be shaped by partisan biases. For example, partisans may see parties from the opposing ideological camp as more alike than they actually are while distinguishing more finely among parties within their own camp – the oft-demonstrated “outgroup homogeneity effect” (Bølstad and Dinas Reference Bølstad and Dinas2017, Lin et al. Reference Lin, Santoso and Stevenson2026).
Similarly, voters’ perceptions of the characteristics of parties (i.e., the cues in which we are interested) are unlikely to be independent of respondents’ previous left-right images of parties. As a result, it can be difficult to disentangle whether a party is perceived as left or right due to its actual attributes or because of the (potentially biased) view of these attributes engendered by previous inferences about the party’s left-right image. This challenge aligns with recent research examining how voters not only use heuristics to infer the left-right images of parties but also use the left-right images of parties as cues for downstream judgments about representation (Giebler et al. Reference Giebler, Meyer and Wagner2021), policy alignments (Dahlberg and Harteveld Reference Dahlberg and Harteveld2016), and coalition formation (Fortunato et al. Reference Fortunato, Lee and Stevenson2025).
While “selection on observables” is the dominant approach to causal identification in the previous empirical work in this area, several survey experiments have sought to better identify the relative impact of various potential drivers of voters’ left-right placements of parties by independently manipulating perceptions about these potential drivers in vignette experiments. These studies, however, were designed to manipulate (using vignette treatments) only one relatively narrow potential cause of voters’ left-right party placements, such as coalition signals (Falcó-Gimeno and Muñoz Reference Falcó-Gimeno and Muñoz2017), party rhetoric (Fernandez-Vasquez Reference Fernandez-Vazquez2019), or emphasis on specific salient issues (Wagner and Meyer Reference Swaan2023), rather than to estimate the relative weight that voters place on a wide array of potential drivers.
In addition, several of these studies use real-world parties and so risk respondents bringing their prior beliefs about the parties with them when evaluating the vignette. For example, in his experiment on party rhetoric, Fernandez-Vazquez (Reference Fernandez-Vazquez2019) manipulated statements made by party leaders from the Conservative and Labour parties in the UK regarding immigration and National Health Service (NHS) funding. However, because these are well-known real-world parties with long-standing reputations, respondents are likely to have prior beliefs about what these parties typically stand for. When exposed to a statement that appears inconsistent with a party’s established profile, respondents may not view it as realistic and may even discount it. As a result, even though such studies leverage experimental variation and thus help address the first two challenges discussed earlier (i.e., concerns about causal identification and limited variation in real-world party attributes), they do not fully resolve the third challenge: that perceptions of party characteristics are themselves shaped by prior partisan and ideological beliefs. The use of real-world parties means the treatments cannot be assumed to operate independently of respondents’ preexisting knowledge, expectations, or affective filters, thereby limiting the internal validity of these experimental designs.
We hope to add to these existing empirical efforts by adopting a design that (1) allows us to achieve sufficient independent variation in key cues voters may use to make inferences about a party’s true left-right position, (2) holds constant, by design, a wide range of variables (potential cues) that, while they may play a role in some people’s left-right images of parties, are not sufficiently cheap, simple, accurate, or general (across contexts), to warrant direct manipulation in our design – which, relying on the literature for guidance, attempts to identify the effects of a set of potential cues most likely to be consequential for peoples’ left-right images of parties, (3) holds constant by design (i.e., by using hypothetical parties) any characteristics of respondents (like partisan feelings or rationalizations) that might interfere with our treatments (i.e., partisan respondents rejecting our characterization of the policy commitments or partisan alliances of a given party) and (4) estimates the relative effect of a large set of potential cues at the same time and in a way that allows us to directly compare effect sizes across cues (within countries). As we explain in Section 2.2, a conjoint factorial design is a suitable approach to fulfill these criteria.
2.2 Using Conjoint Experiments to Study How People Understand Political Concepts
In recent years, political scientists have increasingly used conjoint/factorial experiments to explore the drivers of political choices, judgments, and attitudes. For example, scholars have used these methods to study beliefs about political candidates, immigrants, institutional reforms, social policies, climate policies, economic policies, foreign policies, and counter-terrorism strategies, among others.Footnote 31
Conjoint experiments are typically implemented using a choice-based design (Hainmueller et al. Reference Hainmueller, Hopkins and Yamamoto2014) in which respondents choose between hypothetical profiles presented side by side. Each profile lists a set of attributes – such as gender, age, education, or party affiliation in a political candidate experiment – whose levels are randomly assigned. While this method allows researchers to estimate the influence of specific attributes on choice, some critics argue that it fails to capture key elements of real-world decision-making.
Because these choices are hypothetical and costless, they may not reflect actual behavior. For instance, the act of voting carries real costs – such as time or effort – which can influence how seriously individuals consider their options. Without such consequences, survey respondents may behave differently than they would in real settings.Footnote 32
Atsusaka (Reference Atsusaka2025) illustrates this point in a factorial ballot experiment examining the effect of candidate ballot order in ranked-choice voting. The experiment showed a strong ballot order effect – respondents favored candidates listed higher on the ballot. However, real-world election data showed that this effect was much smaller. Atsusaka attributes the discrepancy to the hypothetical nature of the experiment: Respondents faced no real stakes and so were more willing to vote based on superficial cues like ballot order rather than casting a vote reflective of their true preferences.
More generally, the seemingly inescapable fact that artificial choice settings lack the consequences of real-world choice settings may heighten the risk of various kinds of cognitive biases including, for example, social desirability bias (Schwarz Reference Schickler and Palmquist1999, Krosnick et al. Reference Krosnick, Judd, Wittenbrink, Albarracín, Johnson and Zanna2005). As a result, expressed preferences in conjoint tasks may not align with real-world actions (Bertrand and Mullainathan Reference Bertrand and Mullainathan2001).
While such criticisms of the hypothetical nature of conjoint experiments are often well-founded, it is not yet widely appreciated that there’s a type of conjoint experiment in which they are likely to apply with much less force. Specifically, we think it is important to distinguish between conjoint experiments aimed at understanding how people make choices or evaluations (the typical application) from those aimed at understanding how people use language – that is, what they mean by a term or concept. We contend that the latter application, which we employ in this Element (and that a few other examples in the literature use), is more robust to the kind of external validity criticisms discussed earlier (Schwarz Reference Schickler and Palmquist1999, Krosnick et al. Reference Krosnick, Judd, Wittenbrink, Albarracín, Johnson and Zanna2005, Hainmueller et al. Reference Hainmueller, Hangartner and Yamamoto2015).
Consider, for example, Huff and Kertzer’s (Reference Huff and Kertzer2018) conjoint study exploring what Americans mean when they use the term “terrorism.” Respondents were presented with descriptions of violent events varying in attributes such as the nature of the attack or the identity of the perpetrators and were asked to evaluate whether these events qualified as acts of terrorism. Unlike a hypothetical voting experiment, this task can more plausibly rely on the same cognitive process people engage in when assigning meaning to the term in everyday life: the generic cognitive process of categorizing and labeling events based on limited information. That is, when we ask people what they mean rather than what they will do, we ask them to do exactly what they regularly do in a real-world conversation. Even the hypothetical nature of the described event does not make the conjoint setting hypothetical in the same way a choice experiment does, since we regularly assign labels to events in the real world that are either explicitly hypothetical (e.g., when a friend comes up with a hypothetical example in an argument) or that we suspect may be (e.g., when engaging with unfamiliar news sources on the internet). Thus, while conjoint designs for studying both choice and meaning present respondents with hypothetical cases to consider, only in the former case is this hypothetical a completely artificial situation. In contrast, the latter is, in our view, much closer to the real-world settings in which meanings are made.
Several other scholars have used conjoint designs to explore what respondents mean by important political concepts. For example, Knudsen and Johannesson (Reference Knudsen and Johannesson2019) investigate how Norwegians think about the “trustworthiness” of news sources and Guttmann et al. (Reference Gutmann, Kantorowicz and Voigt2025) explore how Germans and Poles define the “rule of law.” Likewise, Miwa et al. (Reference Miwa, Arami and Taniguchi2023) investigate how Japanese respondents place politicians on the left-right spectrum based on a range of policy positions.
2.3 The Surveys
The set of surveys we fielded for this project included three pilot studies conducted in Canada, Germany, and the UK in 2017 and 2018, and four “main” surveys conducted in the UK, Canada, Germany, and Denmark in 2019. For each survey, we recruited approximately 1000 respondents from Qualtrics LLC’s online panels. Quotas were imposed in each country, targeting census proportions for males and females and a set of discrete age categories (see Table A2.1 in OA2.2 for additional information).
We chose Canada, Denmark, Germany, and the United Kingdom because, according to the relevant comparative politics literature, they vary considerably (among the western democracies) in the use and pervasiveness of the left-right metaphor in politics. Canadian political scientists have long noted the relative lack of left-right nomenclature in discussions of Canadian politics compared to many similar democracies (Cochrane Reference Cochrane2010), while the German case is one in which the use of left-right language is pervasive (Dalton and Jou Reference Dalton and Jou2010). The Danish case is similar to the German, and it is also an archetypical case of coalitional government. Finally, the UK is more like the German and Danish case than the Canadian but likely falls somewhere in between (Clarke et al. Reference Clarke, Sanders, Stewart and Whiteley2009). This ordering is confirmed by Fortunato et al.’s (Reference Fortunato, Stevenson and Vonnahme2016) measure of partisan left-right knowledge in these four countries and, by the percentage of respondents in our surveys who report familiarity with the concept of the left-right. We chose cases with this kind of variability because the pervasiveness of left-right language in a society likely reflects the specific cultural, historical, and institutional characteristics that are most likely to matter for an analysis of the sources of voters’ understanding of the left-right. Thus, if we find consistent drivers of left-right perceptions across these four different cases, we will have some confidence that they are applicable to many others (at least across the western democracies).
We benchmarked our survey samples against data from the Comparative Study of Electoral Systems (CSES) for the most proximate survey. The detailed results are in OA2.3. These comparisons showed our samples were quite similar to the CSES in key demographic variables, including gender, age, education, and levels of political interest. The only notable differences are the overall level of reported partisanship in our samples, which appear to have between 10% and 20% more partisans than in the CSES (defining this as any indication that the respondent is in any way partisan). However, as we explain in OA2.3, there are several important differences in the way we asked about partisanship in our surveys and the question used in the CSES, and therefore it is not clear what to make of the larger share of partisans in our samples. The fact that no other variables in our sample (e.g., indicators of levels of political interest or knowledge) are what we would expect if we really had a much more partisan sample than is usual suggests this is due only to the differences in the questions.
The survey begins with a question about the respondents’ level of political interest and their familiarity with the concept of the left-right as used in politics. This was followed by the conjoint tasks in which respondents are presented with information about a series of hypothetical new parties and asked to place each party on a 0–10 left-right scale. In each trial, there were “slots” for six discrete pieces of information: the party’s name and symbol (Slot 1); the party leader (picture with name, Slot 2); the party’s pattern of cooperation with existing parties (Slot 3); the party’s position on a specific policy or value (Slot 4); the gender composition of the party’s candidates, its gender quota policy, the party’s expected size, or the geographical scope of its electoral support (Slot 5); and the party’s support among different social groups (Slot 6). After the conjoint tasks, the survey asked for respondent-level information (e.g., partisanship) and their placement of existing political parties and themselves on scales for the same policy and value dimensions used in the conjoint tasks.
Figure 3 provides a concise summary of the design, along with an annotated example of a screen (party profile) shown to British respondents. The corresponding information for other countries is available in OA Table A2.2. On each trial, the six information “slots” each display a statement randomly selected from a pool of statements relevant to a specific attribute category. These categories include patterns of partisan conflict and cooperation, policy positions, value positions, and bases of social support. Within each category, different attributes specify the type of information presented. For example, within policy positions, one attribute concerns limiting immigration from non-western countries, while within partisan conflict and cooperation, an attribute pertains to cooperation with the Conservatives.
Annotated example of party profile shown to British respondents
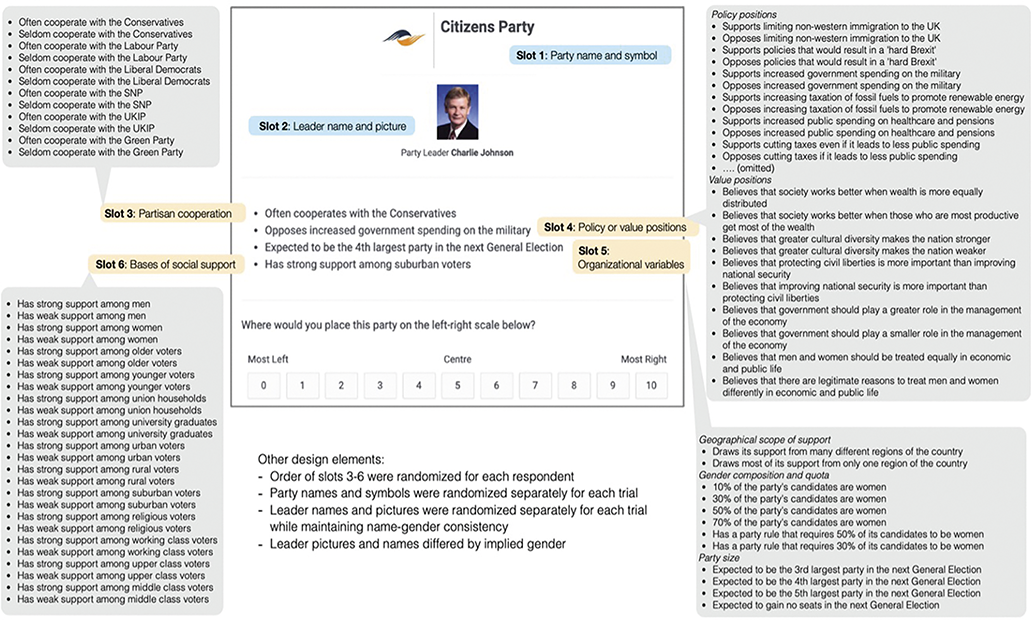
Each attribute consists of multiple “levels” that capture variation in positions. For instance, in the immigration attribute, statements indicate either support for limiting immigration or opposition to it. Likewise, in the cooperation with the Conservatives attribute, statements describe whether a party often or seldom cooperates with them.Footnote 33 Taken together, the design follows a structured hierarchy: slot → attribute category → attribute → attribute levels.
Most respondents saw twenty trials, though respondents who expressed no familiarity with the concept of the left-right as used in politics (about 15%) saw only ten trials (and a modified introduction reassuring them of the usefulness of their responses). Our substantive results do not change if we exclude these individuals (results available from the authors) and all our measures of uncertainty account for clustering by respondent.
There are several features in our design that are worth highlighting. First, each trial presents a hypothetical party (with a name, symbol, leader’s name and picture).Footnote 34 Unlike real-world parties, which carry established reputations and long-standing associations with certain left-right images, hypothetical parties do not evoke prior affective attachments. This ensures that respondents’ left-right placements of these parties are shaped by the specific attributes being studied rather than ingrained expectations or partisan loyalty. Moreover, hypothetical parties prevent past left-right images from shaping how a party is perceived in terms of policies, values, and patterns of cooperation – factors that, in turn, can reinforce existing left-right perceptions. By eliminating these feedback effects, our design allows us to isolate the causal impact of specific attributes on left-right placement without the confounding influence of preexisting partisan associations with certain left-right positions.
Second, our design is different from the conjoint/factorial designs typically used in political science, which usually have a smaller number of attributes (e.g., five to ten) with several levels for each attribute. Our design, however, allows us to include a much larger set of attribute levels. For example, in the UK, we include fourteen policy and value attributes (Slot 4) each of which comes in two versions (levels): “Support” or “Oppose.” This design allows us to explore the impact of many more attributes than in the typical design. We adopt this broader attribute sampling strategy to improve the generalizability of our conclusions to entire attribute categories. By incorporating a wide – and, we hope, representative – range of attributes within each category, our findings can speak to the overall effects of an attribute category as well as any specific attribute. That said, since our design distributes its many attributes to only six “slots,” each respondent only sees six discrete pieces of information, well below the number shown in most other conjoint studies as well as the limit recommended in Bansak et al. (Reference Bansak, Hainmueller, Hopkins and Yamamoto2018).Footnote 35
Third, in Slot 4, we group policy and values attribute categories into the same slot so that on each trial, respondents see either a policy or value statement. This is to eliminate any possibility of conflicting statements. For example, we would not want a respondent to see the policy statement “Supports limiting non-western immigration” alongside the value statement “Cultural diversity makes the nation stronger.” By putting the value statements in the same slot as the policy statements (and only having one policy or values slot) this is avoided by design.Footnote 36
Fourth, each specific attribute in the attribute categories partisan cooperation, policy positions, values, and the bases of social support came in two versions (or levels) that were matched to be opposites. For each policy attribute respondents saw a statement saying the new party either “supported” the policy or “opposed” it. For attributes capturing patterns of partisan cooperation, respondents saw a statement saying the new party either “often” or “seldom” cooperates with a particular (real) target party. For attributes capturing the social bases of the new party’s support, respondents saw a statement saying the new party either had “strong” or “weak” support from a particular social group. Thus, the estimates presented in the next section are always contrasts between the two attribute levels that were matched opposites. One result of this set-up is that the effect of the first and second statements in a pair is always the same but with different signs. Given this equivalence, we report results using the version of each pair that best facilitates interpretation.
2.4 Estimation Method
We estimate the relative weight of each party attribute (cue) as the average marginal component effect (AMCE) for that attribute. AMCEs can be estimated in a few different ways that are asymptotically equivalent. In our case, we first stack the data so that a row is a respondent-trial. For each row, there are variables indicating the left-right position at which the respondent placed the hypothetical new party (the dependent variable) and four factor variables indicating the attribute category and the attribute level that the respondent saw on that trial in each slot.Footnote 37 Next, we choose a baseline attribute level for each attribute and regressed our DV on factor variables indicating the level of the attributes shown in each slot on each trial (as Hainmueller et al. Reference Hainmueller, Hopkins and Yamamoto2014 recommends). Since AMCEs are estimates of the relative effect of an attribute level rather than its absolute impact, the choice of baseline does not affect our substantive conclusions (Egami and Imai Reference Egami and Imai2019). As such, one is free to report relative quantities that are best suited to the substantive goals of the research. This is useful in our case because all of the attributes of interest in this Element were designed to have only two levels (e.g., “seldom cooperates with X” or “often cooperates with X”), even though multiple such pairs were allocated to the same “slot” (as shown in Figure 3).Footnote 38 Thus, rather than presenting the results, for example, of “often cooperating with the Conservatives” relative to the arbitrary baseline that we had chosen for “Slot 3,” we instead present more substantively meaningful differences: for example, between “often” and “seldom” cooperating with the Conservatives. That is, once we have estimated effect of “often cooperating with the Conservatives” (relative to the arbitrary Slot 3 baseline) and “seldom cooperating with the Conservatives” (relative to that same baseline), the difference in these two estimates is the effect of “often cooperating with the conservatives” relative to “seldom cooperating with the conservatives” as the baseline cancels out.
This approach is asymptotically equivalent to both Egami and Imai’s (Reference Egami and Imai2019) Causal ANOVA procedure or a simple difference in means estimator (Egami and Imai Reference Egami and Imai2019:535) in which one averages the value of the DV for cases that saw a given attribute and subtracts the average of the DV for those that saw the baseline condition (i.e., marginalizing over the other attributes and levels the respondent saw in the other slots). As one would expect, given our large samples, these different procedures produce nearly identical estimates. Thus, next we report the AMCEs from the regression procedure. To account for the possible non-independence of ratings from the same respondent, we cluster the standard errors by respondent in these regressions.
2.5 Design Diagnostics and Robustness Checks
As with any inferential strategy, conjoint designs (under full randomization) make several assumptions that should be checked in each application. Hainmueller et al. (Reference Hainmueller, Hopkins and Yamamoto2014) identify several of these (e.g., absence of carryover effects, profile order effects, randomization failures, attribute order effects, and atypical profiles) and discuss how they can be tested. For example, they explain that causal identification in a conjoint design requires the assumption of no “carryover” effects. A carryover effect occurs (in our case) when respondents do not give the same rating to two hypothetical parties with the same attributes because the attributes seen in previous trials influence their choices on the current trial. One way to examine the plausibility of this assumption is to test whether the estimated weights on attribute statements change significantly when one compares estimates obtained from each trial separately. A simple way to accomplish this test is to estimate a regression that includes not only the attributes of interest, but also indicators for each trial and the interactions between these indicators and the attributes. A joint F-test of the significance of the interactions is a test of the stability of the attribute weights (and so the possibility of cross-over effects). We estimated this joint F-test for each attribute reported in this Element and failed to reject the null hypothesis that the trial interactions were jointly zero in every case.
Other assumptions discussed in that article are not relevant to our design. Profile order effects are not relevant as we do not offer more than one profile in a trial. Attribute order effects are not a significant concern as we limit the number of attributes to four per trial (except party name and leader information) and randomize the order of these attributes by respondent. This makes it highly unlikely that the order of attributes shown to respondents makes any difference to our estimates. Nevertheless, we conducted the order test suggested by Hainmueller et al. (Reference Hainmueller, Hopkins and Yamamoto2014:26) and confirmed this expectation. Finally, randomization of profiles is guaranteed by design in our case, and our balance tests confirmed that we did the randomization correctly.
Besides the recommendations provided by Hainmueller et al. (Reference Hainmueller, Hopkins and Yamamoto2014), we also consider the appropriateness and robustness of our design’s “profile distribution,” which is, for any focal attribute, the distribution of all the other attributes over which we take averages to estimate the focal attribute’s AMCE. Most published conjoint analyses assume this distribution is uniform, which assigns equal weight to each profile (de la Cuesta et al. Reference Cuesta, Egami and Imai2022). This could be problematic if it introduces a discrepancy between the real-world distribution of profiles and the distribution of theoretical interest. Such misalignment has the potential to compromise the external validity of the conjoint analysis. Thus, we follow suggestions from de la Cuesta et al. for thinking about this issue. Specifically, for each of our attributes, we ask if deviations from uniform are indicated by plausibly relevant data on the real-world distribution of party characteristics among new parties, existing parties, or some other reasonable target population of parties. If these data, or simple logic, suggests that the uniform is not a reasonable profile distribution, we use the methods described in de la Cuesta et al. to adjust the target profile distribution statistically and examine if these changes make any difference to our inferences about the focal attribute of interest.
Online Appendix 2.4 provides a detailed analysis of the profile distributions we rely on in this study. In short, our analysis demonstrates that using uniform marginal distributions for most attribute categories is both theoretically justified and empirically robust, producing results that remain consistent with plausible alternative distributions.
We also assess potential interactions between attributes by estimating unregularized linear regressions that include all possible two-way interactions using the Findit package in R (de la Cuesta et al. Reference Cuesta, Egami and Imai2022). Given our binary attributes, regularization is unnecessary. Across our four-country study, only 1.02% of interactions (112 of 11,024) are statistically significant, indicating minimal evidence of causal interactions.
Finally, we address Leeper et al.’s (Reference Leeper, Hobolt and Tilley2020) caution regarding subgroup analysis in conjoint designs. They warn that differences in AMCEs across groups do not necessarily indicate variations in preferences. This is because conditional AMCEs depend on the choice of reference category, which can distort subgroup comparisons – making similar preferences appear different or vice versa. To mitigate this issue, Leeper et al. recommend supplementing AMCEs with descriptive measures like marginal means, which better reflect subgroup preferences. We follow this approach, presenting our results in OA3.8.
3 Results
We begin with a section devoted to each of the four main cue categories discussed in Section 1: policy, values, social group support, and partisan cooperation and conflict. In each of these sections, we first explain how we operationalized each cue in our experiments and why we picked the specific cues we did. Second, we present the “top-line” AMCEs for each attribute category, which we interpret as estimates of the (signed) weight that an average respondent in each of our countries gave to each cue in her placements of parties on the left-right scale. In addition, our discussion will take full advantage of the fact that we have independent samples across four different countries and (for three of them) at different times. Thus, we can explore the extent to which our estimated cue weights are consistent between independent samples drawn from the same national populations 12–18 months apart.Footnote 39
Third, for each cue category we have theoretical expectations (drawn from both the previous literature and the theory of ecologically rational heuristics discussed in Section 1) about the relative importance of specific cues within the cue category. For example, we expect the specific policy cues that will matter most to be those that are most salient and polarized. Consequently, in each section we will also explore heterogeneity in the impact of cues within the category and test our theoretical hypotheses about the nature of that heterogeneity.
Finally, we end each of these topical sections with an exploration of how voters’ levels of political knowledge and sophistication impact the structure of their heuristic inferences about the left-right images of parties. This is a crucially important part of the analysis since the strongest message to come out of the long-standing debate on the importance of ideology to mass political behavior is that we should expect almost everything to be different for individuals with different levels of interest in and knowledge about politics. Specifically, we will explore the extent to which the cues (or their weights) that our respondents use in forming their left-right images of parties are different for respondents with different levels of political sophistication. We will be particularly interested in whether the extent of this conditioning is linear (or perhaps monotonic) with increasing levels of political sophistication – and, of course, the direction of such conditioning.
Using a more finely grained measure of political sophistication than most previous studies, what we find is both new and remarkable: There are very consistent and substantively important differences in the extent to which respondents at different sophistication levels rely on different types of cues when assessing new parties’ left-right images. For example, less sophisticated respondents prioritize patterns of partisan cooperation, while more sophisticated respondents prioritize party values (and, to a lesser extent, policy).
We first discuss the results of each attribute category separately in this section and later, in Section 4, compare the overall impact of these four cue categories relative to each other. This comparison is important since one of our main goals is to understand the relative importance of these categories generally. While a specific policy cue, for example, may have a larger weight than a specific value cue, our experiment includes many specific cues per category (indeed many more than in typical conjoint experiments) to allow generalization about the relative importance of different cue categories in ways that do not depend on only one or a few specific cues within those categories. To do this, we propose ways of aggregating the AMCEs within each attribute category to get a clear summary of the overall impact of the category relative to others.
3.1 Cues about Party Policy Positions
As discussed in Section 1, most of the work on voters’ left-right images of parties has assumed that these images are mainly “policy images” – that is, they (only) aggregate many different party policy positions into a kind of general summary. In our heuristic model of these images, this translates quite directly to the proposition that the only important cues aggregated in the voters’ partisan LR heuristic are different policy cues.
In addition, the theory of ecologically rational heuristics (and a lot of the previous literature) suggests that the specific policy cues that should matter most to the partisan LR heuristic are those that are most salient to parties and that are most characterized by partisan polarization. As such, we designed our experiment so that we could include a large number of specific policies (ten in Germany and Denmark, and nine in Canada and the UK) that are important in the current politics of each country and that varied in their salience and levels of partisan polarization.
3.1.1 Which Policy Cues Did We Include?
Table 2 provides the wording of each policy cue we included in our experiment (for each country) as well as the number of respondents who saw each statement.
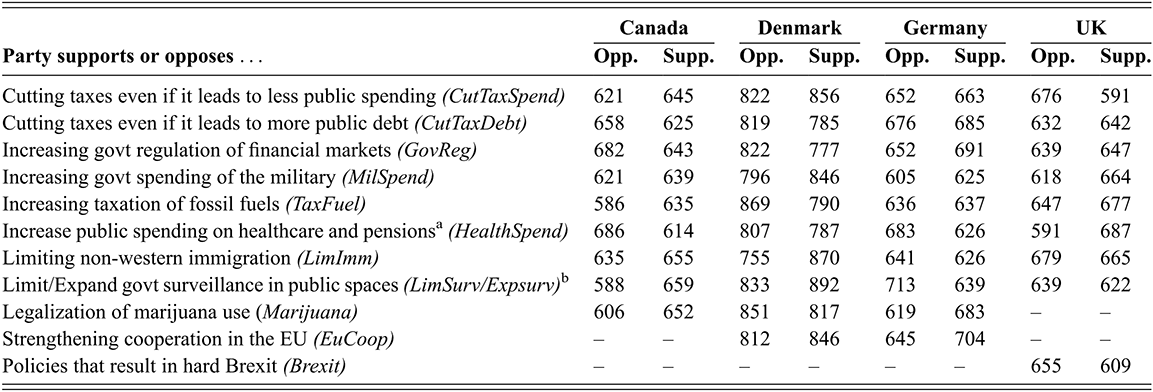
Table 2 Long description
The table presents 11 policy attributes (rows), each with a short variable name in italics. The columns show, for each of four countries (Canada, Denmark, Germany, and the U.K.), the number of conjoint trials in which respondents saw either the opposing (Opp.) or supporting (Supp.) version of that policy statement. A dash (–) indicates that a given policy was not used in that country.
The 11 policy attributes and their trial counts are as follows:
1. Cutting taxes even if it leads to less public spending (CutTaxSpend): Canada: 621 / 645; Denmark: 822 / 856; Germany: 652 / 663; UK: 676 / 591.
2. Cutting taxes even if it leads to more public debt (CutTaxDebt): Canada: 658 / 625; Denmark: 819 / 785; Germany: 676 / 685; UK: 632 / 642.
3. Increasing govt regulation of financial markets (GovReg): Canada: 682 / 643; Denmark: 822 / 777; Germany: 652 / 691; UK: 639 / 647.
4. Increasing govt spending on the military (MilSpend): Canada: 621 / 639; Denmark: 796 / 846; Germany: 605 / 625; UK: 618 / 664.
5. Increasing taxation of fossil fuels (TaxFuel): Canada: 586 / 635; Denmark: 869 / 790; Germany: 636 / 637; UK: 647 / 677.
6. Increase public spending on healthcare and pensions (HealthSpend) [note a]: Canada: 686 / 614; Denmark: 807 / 787; Germany: 683 / 626; UK: 591 / 687.
7. Limiting non-western immigration (LimImm): Canada: 635 / 655; Denmark: 755 / 870; Germany: 641 / 626; UK: 679 / 665.
8. Limit/Expand govt surveillance in public spaces (LimSurv/Expsurv) [note b]: Canada: 588 / 659; Denmark: 833 / 892; Germany: 713 / 639; UK: 639 / 622.
9. Legalization of marijuana use (Marijuana): Canada: 606 / 652; Denmark: 851 / 817; Germany: 619 / 683; UK: not included.
10. Strengthening cooperation in the EU (EuCoop): Canada: not included; Denmark: 812 / 846; Germany: 645 / 704; UK: not included.
11. Policies that result in hard Brexit (Brexit): Canada: not included; Denmark: not included; Germany: not included; UK: 655 / 609.
Notes: (a) In Denmark, the HealthSpend attribute refers only to old-age pensions. (b) The limit government surveillance version was used in Canada and the U.K.; the expand version was used in Denmark and Germany.
Note: Entries indicate the number of conjoint trials in which respondents viewed either “support” or “oppose” version of the listed policy attribute; (a) In Denmark, the HealthSpend attribute refers only to old-age pensions; (b) We used the “limit government surveillance” version in Canada and the UK, and the “expand” version in Denmark and Germany.
As explained in Section 2, each respondent was randomly assigned to either the oppose or support version of either one of these policy cues or one of the values cues described in the next section. The AMCEs are the difference in the average party placements among the group of respondents who received the “support” or “oppose” version.
In Section 1, we pointed out that the policy content of elite discussion of the left-right fluctuates as political entrepreneurs introduce new issues, frame old issues differently, and emphasize different policy differences between parties. That said, we expect many of the same policies to matter across countries. As such, our policy cues are drawn from a wide array of policy issues that represent traditional economic issues, social and cultural issues, new politics issues, and other issues that have emerged more recently.Footnote 40 To ease interpretation of the results, we have set the leftist policy position (which we judge a priori) as the baseline attribute level so that the estimated AMCEs represent the difference in the inferred left-right position of the hypothetical party between a party with a leftist policy position vs. a rightist one. Thus, any negative estimates are readily identified as unexpected. Since the estimate of each statement is the reciprocal of its pair, this choice is purely cosmetic.
3.1.2 Top-line Results for Policy Cues
Figure 4 plots the AMCE of each policy attribute on our respondents’ left-right party placements. The x-axis denotes AMCEs for each of the policy issues arrayed on y-axis. The AMCEs can be interpreted as the difference that the stated policy cue makes in the left-right placement of a hypothetical party compared to the opposite cue on the same issue. For example, the first row on the top-left panel (Canada) shows that respondents who saw the cue “Supports limiting non-western immigration to Canada” placed the corresponding hypothetical party 0.82 units more to the right on the 11-point left-right scale than those who saw “Opposes limiting non-western immigration to Canada.”
The impact of party’s policy positions on left-right placement
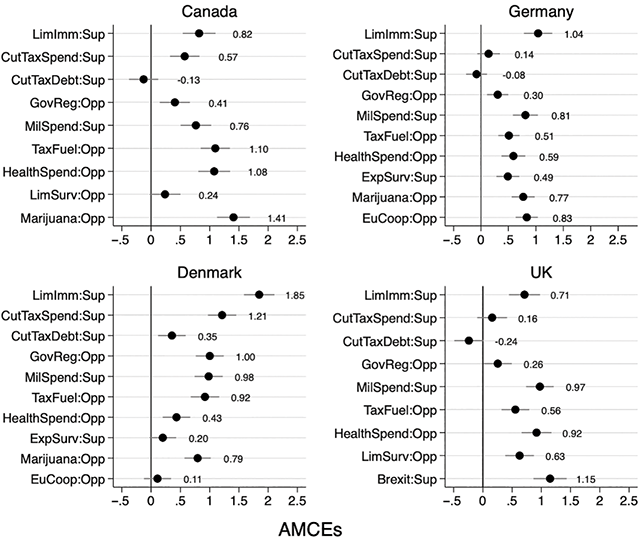
The results in Figure 4 show that out of thirty-eight estimates, thirty-five are in the expected direction. For example, traditionally rightist positions, like limiting immigration, cutting tax and spending, and opposition to the legalization of marijuana all move respondents’ party placements rightward. Further, of the thirty-eight estimates in the figure, thirty-one are statistically different from zero.Footnote 41
Some of these effects are large, but there is a lot of variation. The biggest effects (e.g., immigration in Denmark) are just short of 2 points. How large is this? Since our left-right scale runs from 0 to 10, a movement of this size to the left would change the perception of the left-right position of a new party from, say, the center of the scale (at 5) to a clearly leftist party at 3 (e.g., most of the large social democratic parties average around 3), or from a leftist (3) to a far-leftist at 1 (only the most extreme parties have scores in this range in our sample). Another way to think about the size of these effects is to compare them to the typical size of the left-right differences between the real-world parties in our sample. We asked our respondents to place each real-world party on our 11-point left-right scale and the results for Germany are provided in Figure 5 (other countries are in OA3.1).
The distribution of perceived left-right positions of German parties
Note: Vertical line indicates the average left-right position.
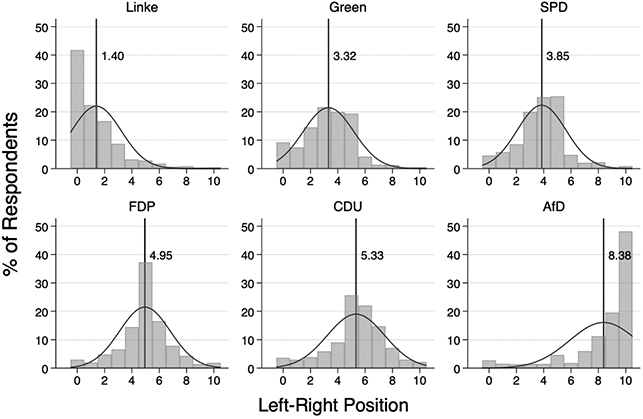
We can see that the typical difference between, for example, the moderate right CDU and the far-right AfD is three points. Likewise, the perceived left-right distance between the SPD and Die Linke is about 2.5 points. Clearly, this supports the conclusion that a difference in placement of 2 points is quite large on our scale – for example, it is (almost) the difference between a clearly extremist party and a clearly moderate one.
In addition, it will be useful to examine the extent to which the estimates in Figure 4 are the same for independent samples collected at different times. If we see the same patterns across such samples, we can be more confident in interpreting the heterogeneity in Figure 4 substantively. To do this, we can compare the estimates in Figure 4 to directly comparable ones that we estimated in our (fully powered and independently sampled) pilot studies (in Canada, Germany, and the UK), which included many of the same policy cues that we used in the main study. These studies were in the field between 12 and 18 months before the main surveys.
Figure 6 compares the AMCEs from the pilot and the main study. Except for the surveillance issue in Canada, there is a remarkable degree of continuity in the estimated AMCEs from the two time points, with correlations above 0.85 for Germany and the UK, and 0.51 for Canada (rising to 0.73 if we exclude the outlying surveillance policy). This should give us some confidence that the AMCEs we are estimating for these attributes are reasonably stable over time and so likely reflect real differences in the impact of these policies on voters’ left-right images of parties.
Comparing the effects of party policy positions using two independent samples from pilot and main studies
Note: X-axis indicates the AMCEs from the pilot study and y-axis indicates the AMCEs from the main study.
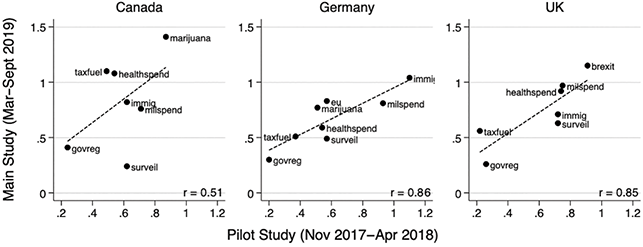
3.1.3 Exploring the Sources of Heterogeneity in the Impact of Policy Cues
There is clearly a great deal of heterogeneity in the size of the estimated effects of different policies within countries. While the most impactful policies move average party placements by 1.5–2 points, several other policies have quite small effects and/or are not statistically distinguishable from zero. How can we account for this heterogeneity? In Section 1 we argued that the policies that should have the largest impact on respondents’ left-right placements of parties are those that are both salient to the parties and on which the parties are most polarized.
To test these hypotheses, we first need to characterize the salience and level of partisan polarization of each issue and then examine if our AMCEs are strongly associated with these measures across policies. While we relegate a detailed explanation of the several measures we use to do this to OA3.2, here we focus on two that are available for all our policies (as well as the values discussed in the next section). For policy salience, we measure the extent to which our respondents answered “Don’t Know” when asked about each party’s position on the issue. Likewise, to measure the extent to which parties are polarized on an issue, we calculate, for each policy, the Cluster Polarization Coefficient (CPC), which was recently introduced by Mehlhaff (Reference Mehlhaff2024) to capture the idea that partisan polarization on an issue requires that parties hold distinct positions on the issue and that these positions are relatively homogenous. These measures are particularly useful for our purposes because we can calculate them using our survey data. In OA3.2, we compare these measures to several alternatives for which we have less coverage, including the Chapel Hill Expert Surveys, which ask experts about the salience of various policies to parties (as of 2019), and random effects models in which we estimate the percent of variance in party placements that can be attributed to a party random effect. The relative ranking of policies (and values) using these alternatives closely mirrors our primary measures, giving us confidence that they are good measures of the relative salience and partisan polarization of each policy (and values in the next section).
Turning first to policy salience: In all our surveys we asked our respondents to place themselves and each party on a set of policy scales that corresponded directly to the 9–10 policy items they could have seen in the conjoint experiments. For example, the immigration questions asked our respondents whether they, and each party, supported increasing immigration from non-western countries, with responses ranging from “support increasing immigration” to “oppose increasing immigration.” Given that we allowed respondents to choose “Don’t Know” to these items, we take the average number of such responses for a given policy as a measure of its (lack of) salience.Footnote 42
Figure 7 plots the average number of “Don’t Know” responses across individuals and parties in each country against the size of the effect of each policy item from our conjoint experiment. Clearly, there is a strong negative association between our respondents not knowing (or being unwilling to provide) a party’s position on a given policy and its AMCE. Further, while there is some variation across countries, the same relationship is apparent in each, with the issues of EU cooperation and government regulation in Denmark the only (moderate) outliers. With respect to the EU issue, the AMCE is lower than we should expect given its salience to our respondents (we get a more muted but similar result for this issue using the CPC measure of polarization in Figure 8). This aligns with a trend observed in Nordic countries where parties within the same party families, which generally share similar left-right positions, lack a unified stance on European cooperation and integration (Leruth et al. Reference Leruth, Gänzle and Trondal2019). As a result, ecologically rational respondents in Denmark may not put a lot of weight parties’ positions on European cooperation when inferring their left-right placements. Nevertheless, the general pattern observed in Figure 7 corroborates the idea that the more salient a given policy issue is to the party and to the voters, the more impact it has on their left-right images of the parties (Meyer and Wagner Reference Meyer and Wagner2020).
Relationship between the saliency of a given policy and its effect size in the conjoint experiment
Note: We used the average number of “Don’t Know” responses for a given policy as our proxy for the (lack of) salience for that item on the x-axis. Dashed lines are regression fitted lines.
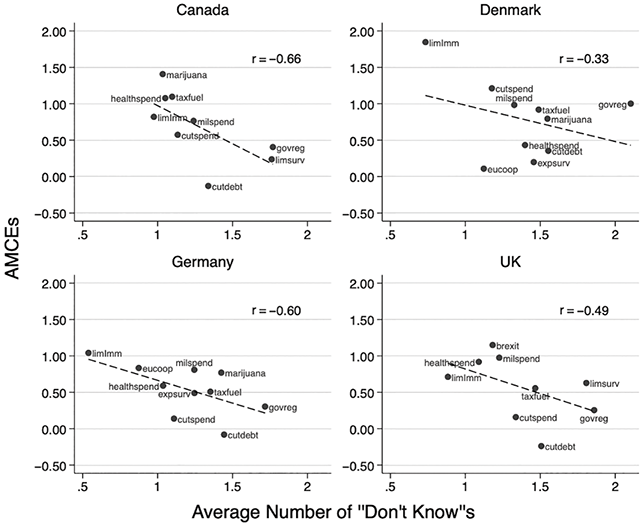
We can also use these data to measure the relative extent to which our voters believe the parties are polarized on each issue. To do that, we utilize the Cluster Polarization Coefficient (CPC) that was recently introduced by Mehlhaff (Reference Mehlhaff2024). This measure has several advantages over previous measures (e.g., Dalton Reference Dalton2008, Ahler and Broockman Reference Ahler and Broockman2018), including that it applies naturally to multiparty systems and accounts simultaneously for both inter-group heterogeneity and intra-group homogeneity, both of which are necessary for polarization.Footnote 43
Figure 8 provides the empirical association between this CPC measure (larger values mean more partisan polarization on the policy) for each policy and the corresponding AMCEs. Clearly, a great deal of the variation in the impact of specific policies on left-right placements within each country can be explained by the extent to which respondents perceive the parties to be polarized on the issue – exactly as the theory of ecologically rational heuristics (and the previous literature) would predict. When a policy issue is highly polarized, it distinctly delineates the differences between parties. These stark differences make the policy a clear and reliable indicator of each party’s position on the left-right spectrum (Busch Reference Busch2016).
Relationship between party polarization on a policy issue and that issue’s impact on LR placements
Note: CPC indicates how distinct and homogenous respondents’ beliefs are about party positions on a policy. Higher values indicate clearer differences between parties and greater agreement among respondents.
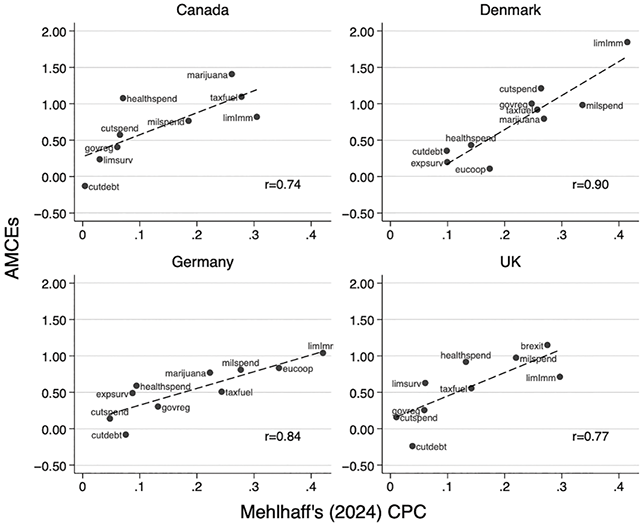
Finally, Table 3 provides a regression of our AMCEs on both our salience and polarization measures, pooling our countries together. As shown in Table 3, both measures condition how much our respondents weigh specific policy cues in inferring the left-right images of parties. Further, with just these two variables we can account for more than 65% of the variance in our AMCEs for different policies.
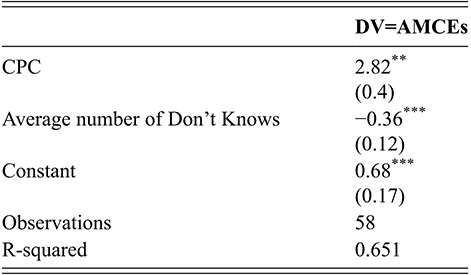
Table 3 Long description
The table presents results from a regression model where the dependent variable is A M C Es. The table has two columns: the variable name on the left, and the corresponding coefficient estimates and standard errors on the right. Robust standard errors are shown in parentheses below each coefficient. The results are as follows: 1. C P C: Coefficient 2.82, significant at the p<0.05 level (two asterisks); robust standard error 0.4. 2. Average number of Don’t Knows: Coefficient −0.36, significant at the p<0.01 level (three asterisks); robust standard error 0.12. 3. Constant: 0.68, significant at the p<0.01 level (three asterisks); robust standard error 0.17. 4. Observations: 58. 5. R-squared: 0.651. Note: Robust standard errors are in parentheses. To account for the fact that the A M C Es are estimates, standard errors robust to unspecified forms of heteroscedasticity are used (Lewis and Linzer 2005). Significance levels: p<0.01 (three asterisks), p<0.05 (two asterisks), p<0.10 (one asterisk).
Note: Robust standard errors in parentheses; To account for the fact that the AMCEs are estimates, we use standard errors robust to unspecified forms of heteroscedasticity (Lewis and Linzer Reference Lewis and Linzer2005); ***p<0.01, **p<0.05, *p<0.10.
3.1.4 Summarizing Cue Weights
Earlier we examined the weight respondents assigned to specific policy cues. However, as emphasized in Section 2, we did not want to draw our inferences about the overall impact of policy (versus other attribute categories) from only one or a few specific examples of policies, but from as expansive a set of policies as was possible for us to include in our experiment. Additionally, an important task for us is to understand how our AMCE estimates are conditioned by political sophistication. This task is much simpler using a summary indicator of the overall size of the AMCEs for policy rather than presenting results for each policy individually across political sophistication levels.
Of course, such summaries are only useful if they do not mask important heterogeneity or obscure more subtle relationships. We guard against this in three ways. First, we devote (as earlier) a section in our discussion of each cue-category to exploring the theoretically indicated sources of heterogeneity in cue weights within the category. Second, when presenting our aggregate results (for each cue category) conditioned by political sophistication, we reference OA3.10, where we provide the same analysis for every specific cue within each category. Further, we will be careful to point out cases in which specific cues do not follow the (as we will see) generally monotonic relationship between a respondent’s sophistication and the weight she places on each cue. Finally, at the end of this section, we compare cue categories (within each country) to each other using a range of different aggregation methods.
There are many ways one can aggregate AMCEs for individual policies into a summary estimate. One could focus on the one policy that has the largest effects, the average, or something else. We explore such possibilities at the end of this section. For now, we begin with the most straightforward measure. Specifically, we recode all the individual policy cues so that “1” indicates the expected “rightist position” and “0” the expected “leftist position.” This combines our specific policy cues into a single statement: The new party supports versus opposes a rightist position. The AMCE for this combined statement is equivalent to a weighted average of the individual policy AMCEs, weighted by the number of respondents who saw each statement (i.e., as shown in Figure 4). In the next section, we use this aggregate measure to explore how political sophistication alters the weight voters give to policy cues in their inferences about the left-right images of the parties.
3.1.5 Policy Cues and Political Sophistication
If there’s one message that one can take from the long-standing debate in the American literature on mass ideology, it is that voters’ interest in and knowledge about politics strongly conditions the extent to which individuals know about policy, hold consistent policy positions across different policies or over time, and can use knowledge of policies in subsequent evaluations of parties and candidates. Indeed, much of the empirical debate that has fueled this literature might well be settled if everyone involved always included in their studies fine-grained measures of political sophistication and reported results conditional on this variable. Thus, we agree with Kinder and Kalmoe (Reference Kinder and Kalmoe2017:134) and others (Lupia Reference Lin, Stevenson, Tromborg and Fortunato2020, Benoit et al. Reference Benoit, Munger and Spirling2019) who have called on scholars in this area to do a better job characterizing levels of political sophistication.Footnote 44
Consequently, in our surveys we included a great deal of instrumentation tapping political knowledge and interest and then used item response theory (IRT) to combine them into a measure of political sophistication sufficiently fine-grained to give a unique sophistication score to each respondent. We detail the exact methods used in OA3.3. This, in turn, allows us to re-estimate our AMCEs for each attribute category for “a rolling sample” of approximately equally sized groups, where each group is marginally more sophisticated than the previous one. Thus, we can use these conditional AMCEs to make apples-to-apples comparisons (i.e., with the same sample size) among a large number of groups with different levels of political sophistication, making it possible to identify the level of political sophistication necessary to produce cue weights of different sizes (e.g., cue weights that are statistically different from zero, or that are bigger than some cut point).
Figure 9 provides our AMCEs for these moving windows. The windows begin by grouping all the trials for the least sophisticated group of 200 respondents and estimating the AMCE for this group (the result is recorded on the far left of the graph). Next, we formed the second least sophisticated group by adding the trials for the next most sophisticated respondent to the previous sample (the two hundred and first) and removing the trials from the least-sophisticated (the first). We repeat this process, recording the AMCE for each (increasingly sophisticated) group of 200 respondents as we move right in the graph. Given that we had different numbers of respondents in each sample (though always near 1000), we form different numbers of sophistication groups (i.e., windows) for each country – though in each case it is close to 800 groups. To ease interpretation of the results, we label these groups from 20 to 100, where the label can be interpreted as indicating the percentage of respondents whose level of political sophistication is less than the most sophisticated respondent in the corresponding window.Footnote 45 This labeling is helpful because the relationship between political sophistication and our cue weights is almost monotonic for all our cues. Thus, we can usefully talk about the “level of sophistication required to see a certain sized cue weight.”
The impact of aggregated policy cues by level of political sophistication
Note: The labelling of the x-axis reflects the percentage of respondents less sophisticated than the most sophisticated one in each estimation window. Dark points are AMCEs, with grey shaded 95% CIs. Each estimate (and associated confidence interval) is based on all trials from a moving window of 200 respondents, where respondents are ordered from least to most politically sophisticated. As there are few ties in sophistication scores, each window shifts by adding the next most sophisticated respondent than everyone, replacing the least sophisticated one. Importantly, each estimate uses the 200 most sophisticated respondents below the indicated label, not all respondents below the indicated label. Vertical lines mark the sophistication level where the AMCE becomes statistically different from 0 (solid), 0.5 (dash), and 1.0 (short dash).
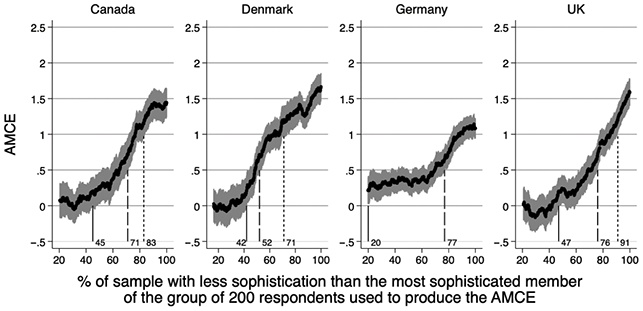
The first thing to notice about the graphs in Figure 9 is that the AMCEs are very strongly conditioned by levels of political sophistication in all countries – as many scholars would likely suspect. To our knowledge, however, this is the first time this has been demonstrated in an experimental setting with very fine-grained information about levels of political sophistication.
Second, the size of the AMCEs in each country increases nearly monotonically with levels of political sophistication. As we will see, we observe this pattern in all attribute categories we discuss next. Specifically, in these graphs, the vertical lines indicate the sophistication levels at which the AMCE for these cues becomes statistically different from 0.0 (solid-line), from 0.5 (dash), and from 1.0 (short-dash) and (more or less) remain above these thresholds for all levels of sophistication greater than the thresholds.
Further, while some caution is (always) warranted in making cross-country comparisons from samples based on large online panels, it is fairly clear that the percentage of respondents in each country who put little positive weight on policy cues is large. Indeed, for Canada, Denmark, and the UK, we do not see policy cue weights that are statistically distinguishable from zero until we get to the 45th, 42nd, and 47th most sophisticated respondents, respectively. Similarly, the levels of sophistication required to see average cue weights larger than 1 are 83, 73, and 91 for these three countries. None of the aggregated policy-cue weights (for any country) are statistically larger than 1.5, even for the most sophisticated.
The story for Germany is similar in kind to the other three countries but differs in degree. Specifically, while the aggregated policy cue weights for German respondents increase monotonically with sophistication (as in other countries), these weights are (1) statistically distinguishable from zero at lower relative levels of sophistication than in the other countries and (2) smaller for the most sophisticated German respondents (e.g., none of the German policy cues weights are statistically greater than 1).
With respect to the first finding, in OA3.11, we use a variety of evidence to show that the somewhat elevated impact of (aggregated) policy-cues for less-sophisticated Germans that is apparent in Figure 9 is unlikely to reflect substantive differences in how these respondents infer the left-right images of parties relative to respondents in other countries. In contrast, the other result – that the weight sophisticated Germans give to aggregated policy-cues is substantially smaller than in other countries – is robust. First, even for the most sophisticated Germans, the AMCEs for aggregate policy cues never reach the same levels that we see in other countries. While other countries’ aggregate estimates top out at about 1.5 (Figure 9), in Germany the estimate only just reaches one and is never statistically greater than one. Further, an examination of the cue-specific results in OA3.10 reveals that this is not due to just one or a few cues. For the eight policy cues for which we can compare Germans to respondents in at least two other countries (i.e., all cues except EuCoop/Brexit), our estimate for the most sophisticated German respondents tops out at a lower (often much lower) level than for respondents in other countries.
This result replicates in our German pilot study. For example, our estimate of the aggregate AMCE based on the nine policy items in the German pilot sample (bottom panel of Figure A3.14 in OA3.11) was only about 0.75 for the most-sophisticated (pilot sample) Germans.
Given this, it appears politically sophisticated Germans put less weight on policy cues than sophisticated voters in other countries. Why might this be? If we look to the theory of ecologically rational inference for help, it seems quite likely that the recent political history of Germany is the culprit.Footnote 46 Specifically, at the time of our survey the CDU/CSU and SPD had been in a grand-coalition for ten of the last fourteen years, including being the incumbent coalition. This involved a lot of day-to-day policy compromise on many issues and would likely have blurred, for sophisticated voters following the party’s policy moves, the distinct policy images associated with the leading parties of the right and left respectively. It is, thus, easy to imagine how this context of policy compromise among the left and right might have undermined the signaling value of policy across the board.Footnote 47 This potential explanation is buttressed by the fact that we do not see a similar diminution in sophisticated Germans’ use of broad values to identify the left-right positions of German parties (as shown in the next section) – since we would expect such values to be more immune to the strategic policy compromises governing parties must often make. Likewise, when we discuss the impact of partisan cooperation cues next, we will see that the impact of the German grand coalition is both what we would expect and quite large, bolstering the case that this feature of the German context has an important impact on the signaling value of the cues (policy or otherwise) that voters use to infer the left-right images of parties.
Overall, our results reveal only moderate-to-large effects of policy cues on voters’ inferences and (as we will see) do not support the idea that the left-right is, in the minds of voters, only about policy. Indeed, even for the most sophisticated voters, policy is not the largest driver of their left-right images of parties. That said, neither of our results are consistent with the most extreme claims of the “ideological innocence” literature. Large percentages of respondents in each country give at least some weight to policy cues in their left-right images of parties and in all but Germany, the most sophisticated voters give substantial weight to policy (even if not the most weight). Finally, we presented clear evidence that the weight voters give to policy cues responds strongly to the signaling value of these cues in the real world (as captured by the salience and polarization of each issue).
3.2 Cues about Broad Values
In Section 1, we pointed to several scholars who see broad values as a remedy to the criticism that many less sophisticated voters cannot map specific policy positions coherently to the left-right. These scholars argue that cues about broad party values are often more widely accessible, simpler to understand, and more easily mapped to the left-right than are many policy cues. Further, while other scholars have not put it this way, in Section 1, we explained why values, almost by definition, should be more closely correlated with parties’ true left-right positions. If this is so, then the theory of ecologically rational heuristics implies that values cues should be used more widely than policy cues and have a larger impact on left-right images of parties among voters at lower levels of political sophistication. Likewise, for voters at quite high levels of sophistication, who understand that these broad values will often influence the party’s stance on many more narrow policies, values statements should prove particularly powerful.
Finally, as with policy, we suggested in Section 1 that we should expect the relative impact of different values statements to vary depending on their salience to the parties and the extent to which the parties are polarized over the value. Specifically, while much of the discussion of the abstract values underlying the left-right have come to similar conclusions (i.e., it is about equality and hierarchy), these values are expressed in both traditional and contemporary conflicts like gender equality, equality for sexual minorities, income inequality, and the role of government in all of this. Consequently, even if the more abstract values are fairly constant, the way they are expressed is likely to change with the priorities of the parties.
3.2.1 Which Value Cues Did We Include?
Scholars have tried to identify the specific values that drive thinking about the left-right both by interrogating the historical and philosophical literature (e.g., Bobbio Reference Bobbio1996) and trying to identify empirically the enduring differences in the values of people who think of themselves as left or right (Caprara and Vecchione Reference Caprara and Vecchione2017, Jost Reference Jost2021). As we discussed in Section 1, most scholars have settled on a values-based conception of left-right in which leftists promote social and economic equality and work to change existing power hierarchies in society (whether these are based on social, economic, religious, racial, gender, sexual identity, or other distinctions), and rightists espouse the belief that social hierarchy and the continuity of the established order should be preserved (Inglehart and Klingemann Reference Inglehart, Klingemann, Budge, Crewe and Farlie1976). Thus, we have chosen five sets of cues that we think capture these broad values: income redistribution, cultural diversity, civil liberties, government’s role, and gender inequality.
Table 4 provides the specific wording of each of our value statements. As with other attribute categories, we prepared two statements for each of the five value dimensions and randomly selected one (out of ten statements in total) to describe the hypothetical party in our conjoint experiment (versions are separated by a “/”).
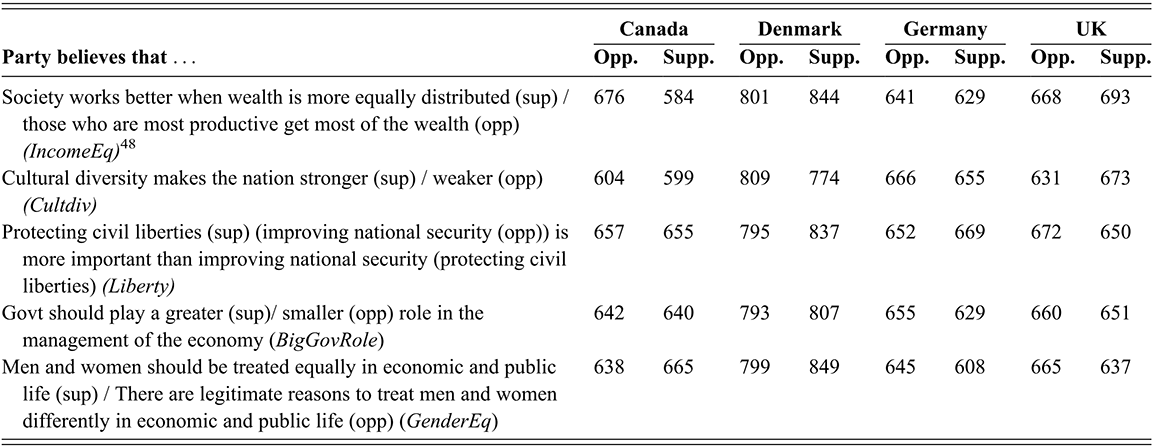
Table 4 Long description
The table presents five values attributes (rows), each with a short variable name in italics. Each attribute is described as a pair: the supporting version of the statement is labelled (sup) and the opposing version (opp). The columns show, for each of four countries (Canada, Denmark, Germany, and the U.K.), the number of conjoint trials in which respondents saw either the opposing (Opp.) or supporting (Supp.) version of that values statement.
The five values attributes and their trial counts are as follows:
1. Income equality (Income E q): Supporting version: Society works better when wealth is more equally distributed; opposing version: those who are most productive get most of the wealth. Canada: 676 / 584; Denmark: 801 / 844; Germany: 641 / 629; U.K.: 668 / 693.
2. Cultural diversity (CultDiv): Supporting version: Cultural diversity makes the nation stronger; opposing version: weaker. Canada: 604 / 599; Denmark: 809 / 774; Germany: 666 / 655; U.K.: 631 / 673.
3. Civil liberties (Liberty): Supporting version: Protecting civil liberties is more important than improving national security; opposing version: Improving national security is more important than protecting civil liberties. Canada: 657 / 655; Denmark: 795 / 837; Germany: 652 / 669; U.K.: 672 / 650.
4. Government role in the economy (BigGovRole): Supporting version: Govt should play a greater role in the management of the economy; opposing version: a smaller role. Canada: 642 / 640; Denmark: 793 / 807; Germany: 655 / 629; U.K.: 660 / 651.
5. Gender equality (Gender E q): Supporting version: Men and women should be treated equally in economic and public life; opposing version: There are legitimate reasons to treat men and women differently in economic and public life. Canada: 638 / 665; Denmark: 799 / 849; Germany: 645 / 608; U.K.: 665 / 637.
Note: Entries indicate the number of conjoint trials in which respondents viewed either the support or oppose version of the listed values attribute.
Note: Entries indicate the number of conjoint trials in which our respondents viewed either “support” or “oppose” version of the listed values attribute.
3.2.2 Top-line Results for Value Cues
As explained in Section 2, each respondent was randomly assigned to one (version) of each statement shown in Table 4. Since respondents saw only one of the two versions of each value, the AMCE is (essentially) the difference between the average LR party placements of the respondents who saw each version. Consequently, the AMCEs are completely symmetric with respect to the two versions of the statements. In Figure 10, we present the version of the value statement that we expected (a priori) to move placements to the right so that, if our expectations are correct, all these estimates should be positive – as they are.
The impact of value cues on left-right placement
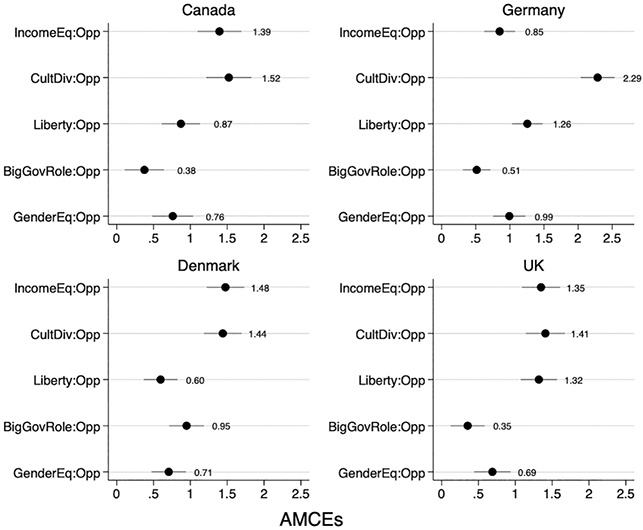
Not only are all estimates positive as expected and statistically different from zero, in almost all cases they are substantively large (compared to the impact of most policies for example) – the smallest estimates in Figure 10 are still larger than half a point on our LR scale.Footnote 49
In addition, there’s quite a lot of cross-national consistency in the values that matter most and least. In three of our countries, cultural diversity is the values statement with the largest weight (and it is a very close second in the fourth country). Similarly, values statements around the role of government in the economy had the smallest effects in three of our countries, perhaps indicating a shift in the importance of traditional economic values conflicts to more modern social ones.
3.2.3 Exploring the Sources of Heterogeneity in the Impact of Value Cues
In Section 1 we argued, based on the theory of ecologically rational heuristics and the previous literature, that the specific values that should have the largest impact on respondents’ LR placements of parties are those that are both salient to the parties and on which the parties are most polarized. The argument is essentially the same as the one we made for policy cues: When parties’ values differ and they consistently emphasize these differences, these value differences will become more salient to voters who will both better understand the difference and agree more about them.
Using the same methods and measures explained in the section on policy, Figures 11 and 12 examine the correlation between our AMCEs and respondents’ willingness/ability to answer our values questions (“Don’t Know”) and the CPC scores for values cues.
Relationship between the saliency of a value and the value’s impact on LR placements
Note: We used the average number of “Don’t Know” responses for a given value as our proxy for the (lack of) salience for that item on the x-axis. Dashed lines are regression fitted lines in each country.
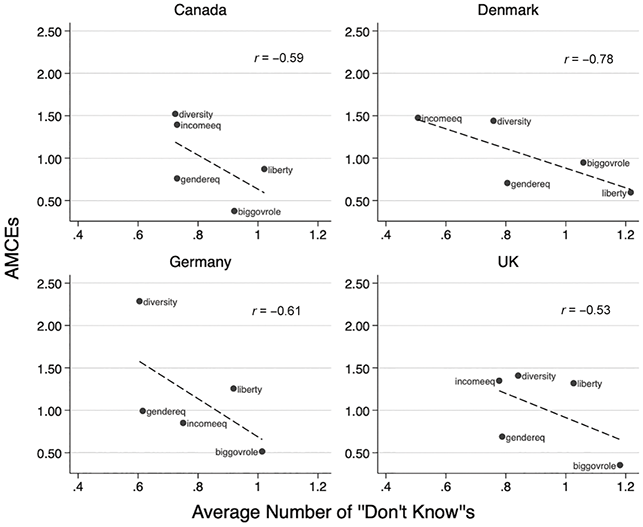
Relationship between perceived party polarization on a value and the impact of the policy on LR party placements
Note: CPC indicates how distinct and homogenous respondents’ beliefs are about party positions on a policy. Higher values indicate clearer differences between parties and greater agreement among respondents.
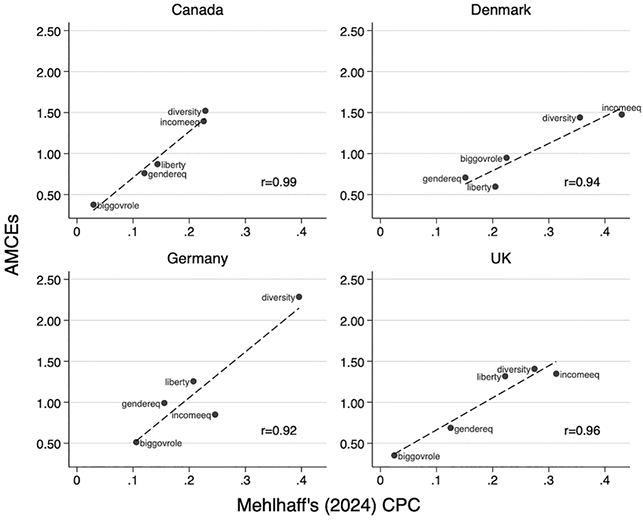
We observe the same relationship that we saw for policy, and the relationships are even stronger and more consistent across countries. Further, looking at the degree of perceived partisan polarization around these values using the CPC measure in Figure 12, we find incredibly strong associations.
This evidence strongly supports the idea that voters use cues about parties’ broad values in their left-right images of parties consistently and that the size of these effects vary as specific values are more salient and polarizing.
3.2.4 Values Cues and Political Sophistication
How does the impact of value cues on the left-right images of parties change with political sophistication? As we did with policy cues, we use an aggregated version of our values cues by recoding them as “1” when a respondent saw the version (support or oppose) that aligns with the expected “rightist position,” and as “0” the expected “leftist position.” Figure 13 provides the AMCEs by levels of political sophistication.
The impact of aggregated values cues by level of political sophistication
Note: Dark points indicate AMCEs, with grey shaded 95% CIs. Each point is estimated based on a moving window of 200 respondents, where respondents are ordered from least to most politically sophisticated. Vertical lines mark the sophistication level where the AMCE becomes statistically different from 0 (solid), 0.5 (dash), 1.0 (short dash), and 1.5 (dot). See Figure 9 note for details.
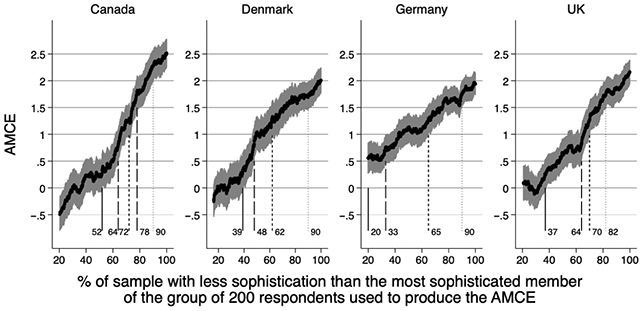
The results in Figure 13 indicate that the impact of value cues is particularly pronounced at the high end of the political sophistication spectrum. This effect is significantly larger than that observed for policy cues. Indeed, it seems reasonable to assume that these very large weights on values cues result from sophisticated voters’ integration of values into the kind of coherent ideological framework scholars like Converse, Kinder, and Kalmoe require for voters to be labeled ideological.
Interpreted through the lens of ecologically rational heuristic inference, values cues should be particularly valuable because (as emphasized in Section 1) they are likely to be much more stable over time than other cues, like party policy positions and partisan alliances. Thus, sophisticated voters may ground their view of what the left-right means most strongly in such values.
Beyond the most sophisticated voters, our findings also show that, compared to other attribute categories, the sophistication thresholds required for values AMCEs to be statistically different from 0, 0.5, 1, and 1.5 respectively are generally lower than the corresponding thresholds for policy cues. For example, Figure 9 shows that these thresholds for policy cues in the UK were 47%, 76%, and 91% respectively. In contrast, Figure 13 estimates these thresholds to be considerably lower for values cues (i.e., 37%, 64%, and 82%, respectively). This suggests that even less sophisticated respondents can more reliably map these values to the left-right spectrum than they can policy cues, even if they put less weight on them than more sophisticated voters.Footnote 50
This confirms our claim that the theory of ecologically rational heuristics implies that voters across the spectrum of political sophistication should put more weight on values cues than policy cues because the real-world correlation between party values and the true positions of parties is likely stronger than the same correlation for party policy positions.
3.3 Cues about Partisan Cooperation and Conflict
We argued that patterns of partisan cooperation may provide a set of cheap and simple cues that can improve the accuracy of the partisan LR heuristic since parties tend to cooperate more often with other parties that occupy similar positions on the left-right (e.g., Martin and Stevenson Reference Lin, Stevenson, Tromborg and Fortunato2001, Reference Martin and Stevenson2010). Further, several observational studies have shown strong correlations between (formal and informal) partisan cooperation across contexts and citizens’ inferences about the parties’ left-right positions (Fortunato and Stevenson Reference Fortunato and Stevenson2013, Adams et al. Reference Adams, Weschle and Wlezien2021, Santoso et al. Reference Rapeli2024). Indeed, as we pointed out in Section 1, some scholars (e.g., Arian and Shamir Reference Arian and Shamir1983) argue that the primary way voters use the left-right in some contexts is as a summary of patterns of partisan cooperation and conflicts – regardless of whether they provide any information about other aspects of the LR (like policy or values stances).
3.3.1 Which Partisan Cooperation Cues Did We Include?
To capture the possibility that voters use the left-right (in part) to identify “the good or the bad, the right and the wrong, the desirable and the despicable” we provided respondents with a set of attributes that indicated the extent to which the hypothetical party cooperated with one of the existing parties in their country. The parties we used are those that earned at least one legislative seat in the previous election.Footnote 51 Table 5 provides the attribute statements for the case of Germany. The other countries’ statements are listed in OA3.4.
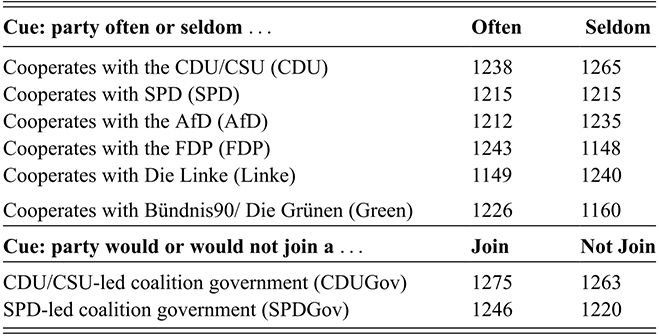
Table 5 Long description
The table is divided into two sections: how often a party cooperates with other named parties, and whether a party would join a named coalition government. Each section represents a different type of cue, with counts for each version shown to respondents.
Section 1 - Cue: party often or seldom cooperates with … (columns: Often / Seldom). This section lists six parties with which the target party either often or seldom cooperates:
1. Cooperates with the C D U/C S U (C D U): Often 1238, Seldom 1265.
2. Cooperates with S P D (S P D): Often 1215, Seldom 1215.
3. Cooperates with the A f D (A f D): Often 1212, Seldom 1235.
4. Cooperates with the F D P (F D P): Often 1243, Seldom 1148.
5. Cooperates with Die Linke (Linke): Often 1149, Seldom 1240.
6. Cooperates with Bündnis 90/Die Grünen (Green): Often 1226, Seldom 1160.
Section 2 - Cue: party would or would not join a … (columns: Join / Not Join). This section lists two coalition government scenarios:
7. C D U/C S U-led coalition government (C D U Gov): Join 1275, Not Join 1263.
8. S P D-led coalition government (S P DGov): Join 1246, Not Join 1220.
Note: Entries indicate the number of conjoint trials in which respondents viewed either the often or seldom version of the listed cooperation attribute.
Note: Entries indicate the number of conjoint trials in which our respondents viewed either the “often” or “seldom” version of the listed cooperation attribute.
In addition, while we designed these statements to allow for the effects of formal cabinet cooperation to be different from less formal (or at least unspecified forms of) cooperation, our subsequent analysis revealed only miniscule differences between the effects of these different statements. Therefore, we only focus on informal cooperation in this section, where the AMCEs for these attributes indicate the effect of being told that a new party “often cooperates” with the indicated target party relative to “seldom cooperating” with it, with positive estimates indicate moves to the right and negative numbers moves to the left.
3.3.2 Top-line Results for Partisan Cooperation Cues
Before presenting the top-line results in this section, we must first address important differences in this attribute category compared to the others. Since this attribute category explicitly names a real-world party as the “target” of cooperation/conflict, we need to account for the fact that respondents may disagree about the target party’s left-right position. One way to deal with that is to transform the dependent variable in our regression models (or in calculating first differences directly) into distances from the target party rather than absolute placements on the LR.Footnote 52 In that case, our expectation would be that “often cooperating” with a given target party (versus “seldom cooperating”) will move voter placements of the hypothetical party toward the target party, wherever the respondent believes the target party to be located on the left-right.
The downside to the “distance from target party” approach is that the resulting estimates are not directly comparable with other attribute categories (which use absolute placements on the left-right as the dependent variable). This complicates assessing the relative importance of different attributes across attribute categories and characterizing their overall impact.
Usefully, however, there is an alternative that uses the same dependent variable as the analyses of the other attribute categories (absolute LR placements) and properly accounts for the fact that our hypotheses are (and our analysis should be) conditional on the respondents’ beliefs about the left-right positions of the target parties. Specifically, we can first estimate a set of conditional relationships (conditioning on where the respondents placed the target party on the left-right) and then aggregating those (in the right way) to produce an unconditional estimate that is directly comparable to the estimates of the other attributes included in the model.
We illustrate this, for the British case, in Figure 14 (the other countries are in OA3.5). Each panel in the figure shows the effects of cooperation with a given target party on the left-right placement of a hypothetical new party, conditional on where the respondent placed the target party on our 11-point left-right scale. The histogram at the bottom of each panel shows the percentage of all respondents (who saw a statement about cooperation – or not – with that target party) who placed the target party in the indicated position. Dots above the bars of those histograms, with corresponding numbers on the left y-axis, are the AMCEs of being told that a new party “often cooperates” with the indicated target party relative to “seldom cooperating” with it, conditional on the respondent’s belief about where the target party is located on our left-right scale. For example, we estimate that respondents who placed the Conservative Party at position 8 on the left-right scale (as a plurality of respondents did) placed a new party almost 2.5 points farther to the right when told that the new party “Often cooperates with the Conservatives” rather than it “Seldom cooperates with the Conservatives.” In contrast, this effect falls to near zero for those, many fewer, respondents who placed the Conservatives at 5.
The effect of partisan cooperation and conflict conditional on the perceived left-right position of the target party (UK)
Note: The histogram in each panel shows the distribution of respondents’ LR placements for the indicated target party. Point estimates are conditional AMCEs for respondents who placed the target party at the specific location on the left-right scale. The “Avg” on the far right of each panel represents the weighted average of these conditional AMCEs. Vertical lines indicate 95% CIs. The left y-axis shows the size of the (conditional and weighted) AMCEs; the right y-axis shows the percentages of respondents.
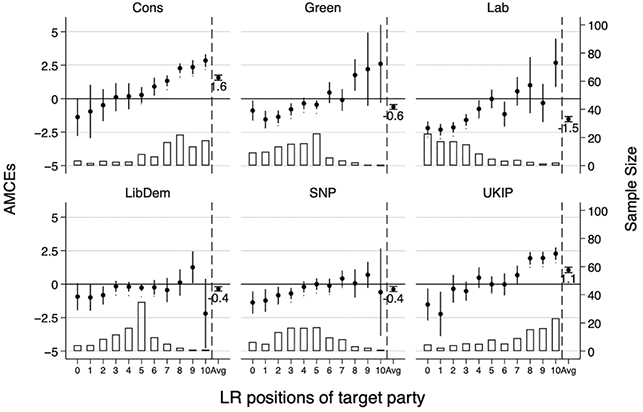
These graphs also include our estimates of the unconditional effect of cooperation with the target party (on the far right of each panel, labeled “Avg” on the x-axis). These estimates are the weighted average of the conditional AMCEs – where the weighting is the percentages of the respondents (who saw the attribute) that believed the target party to be located at each position – and are essentially equivalent to the topline estimates reported in Figure 14.Footnote 53
The first point from Figure 14 is that we can produce unconditional AMCEs for the impact of cooperation with a given target party quite naturally by understanding that this unconditional result is equivalent to the weighted average of the kinds of conditional estimates shown in the figure.
Second, the distributions of target-party left-right placements are all quite sensible and correspond closely to what informed observers would expect. Further, the conditional AMCEs are what we expect even when respondents are wrong about the left-right placements of the target parties. For example, the relatively small number of voters who believe that the British Conservative party was on the extreme left (i.e., position 0) moved hypothetical parties that cooperate with the Conservatives to the left on average – though this estimate is, as we would expect, much noisier than the estimated effects for much larger groups of respondents who put the Conservatives on the right. A similar pattern applies (on average) to other target parties: When respondents believed the target party to be farther left (right), they tended to move hypothetical parties that cooperated with the target party to the left (right), regardless of the parties’ actual LR positions. Thus, our respondents seem to be using information about cooperation between target parties consistently, even if they are confused about the target parties’ left-right positions.Footnote 54
With this understanding of how our unconditional AMCEs for partisan cooperation with a given target party relate to the conditional AMCEs for cooperation with that party, given beliefs about where the party is located on the left-right scale, Figure 15 presents all our unconditional AMCEs for partisan cooperation for each target party in each country. Like the corresponding figures for other attribute categories, these estimates are interpreted as the distance (on our 11-point left-right scale) that a respondent would move a hypothetical party that cooperated with the target party relative to seldom cooperating. For example, the first row of the first panel shows that the Canadian respondents who were told that a new party “Often cooperates with the Conservatives” placed that new party 1.22 points farther right than those who were told that the new party “Seldom cooperates with the Conservatives.” And in the bottom-right panel for the UK, the result indicates that respondents who were told that a new party “Often cooperates with the Green party” placed that new party 0.63 points farther left than those who were told that the new party “Seldom cooperates with the Green party.”
Average effects of cooperation with a given target party on left-right placement of a new party
Note: The AMCEs represent the difference in the average left-right placement of a new party between respondents who received the information that the party often cooperated vs seldom cooperated with the indicated target party. Positive estimates indicate a rightward shift; negative estimates, a leftward shift. The x-axis indicates AMCEs; horizontal lines show 95% CIs. See OA 3.4 for full party names.
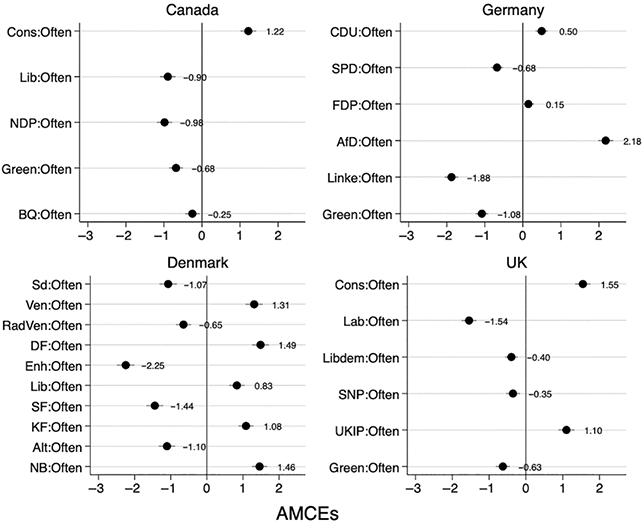
As we did in the section on policy attributes, it will be useful to see how stable these estimates are over time. As such, in Figure 16 we compare them (from 2019) to those from our pilot studies (2017–2018) for Germany, Canada, and the UK. Clearly, the continuity in the AMCEs over this period is remarkable – with correlation coefficients above 0.99 in each country. Further, it is worth noting that this level of continuity is much greater than even the relatively high levels of overtime continuity in our estimates for the policy attribute in Figure 16. Of course, smaller correlations over time for the policy variables could be due to a more volatile underlying causal processes for the impact of policy cues; but, given the rather short time between our pilot and main surveys (1–1.5 years), it seems more likely that the smaller overtime correlations for policy occur because the strength of the left-right signal that these cues provide is noisier than the signal partisan cooperation provides.
Comparing the effects of party cooperation and conflicts using two independent samples from pilot and main studies
Note: X-axis indicates the AMCEs from the pilot study and y-axis indicates the AMCEs from the main study.
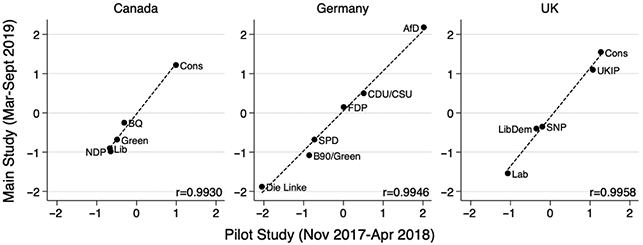
3.3.3 Exploring the Sources of Heterogeneity in the Impact of Partisan Cooperation Cues
In Section 1, we hypothesized that the particular cues about partisan cooperation that should be most used by voters are those that are cheap, simple, and accurate. Given that information about patterns of partisan cooperation is among the most widely reported and accessible information about politics and can be incorporated fairly directly into a Left-Right heuristic (i.e., no complex calculations required), in this section we focus primarily on the accuracy criterion, which we argued should vary considerably among different target parties. Specifically, we hypothesized that cues about the (target) parties with which a new party cooperates will lead to more accurate (or satisfying) inferences about the party’s left-right position when the target party in question is more ideologically “pure” in the kinds of parties with which it cooperates.Footnote 55
Specifically, we argued in Section 1 that if a respondent believes that a target party only cooperates with leftist parties, then telling her that a new (hypothetical) party “often cooperates” with that target party will provide a clearer signal that the new party is leftist than if the target party cooperates more broadly across the left and right. Consequently, we should expect cooperation with target parties that have more “ideologically pure” patterns of partisan cooperation to have larger effects than less ideologically pure ones.
To measure the “purity” of a party’s pattern of partisan cooperation, we use respondents’ left-right placements of the real-world parties to construct a perceived “ideological purity score” for each party (for each respondent), which runs from 0 to 1, with higher scores indicating that the party is perceived to cooperate exclusively with other parties on either the left or the right. Likewise, a score closer to zero means that the party is perceived to cooperate mainly with centrist parties and/or with a mixed group of leftist and rightist parties (see OA3.9 for details).
We estimate the correlations between average purity scores (over respondents) and our AMCEs for each party and the results are reported in Figure 17.Footnote 56 The results strongly support the hypothesized association in Denmark, Germany, and the UK, while it does not in Canada.Footnote 57
Relationship between perceived ideological purity in patterns of partisan cooperation and the impact of cooperation cues on LR placements
Note: The slopes of these regression lines are ‒0.031, 1.35, 1.15, and 0.95 for Canada, Denmark, Germany, and the UK, respectively; all statistically significant at the 95% level except Canada.
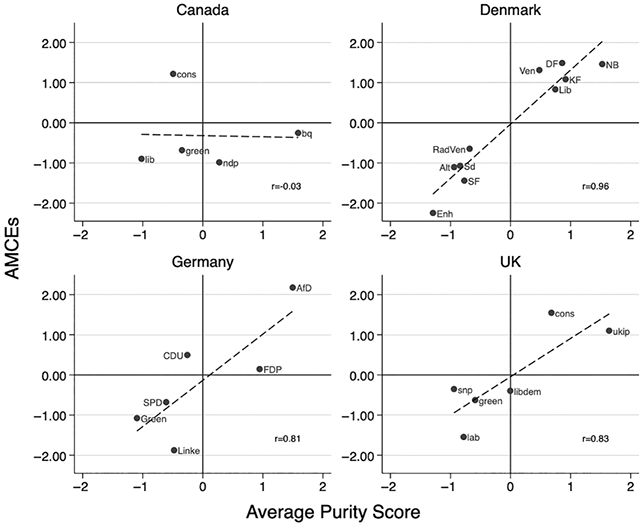
3.3.4 Cooperation Cues and Political Sophistication
Using the data on political sophistication described in previous sections, we can examine the weight that individuals with different levels of political sophistication give to cues about partisan cooperation. As in other sections, we aggregated our various partisan cooperation cues (i.e., for different targets) by recoding all the individual cooperation cues so that a “1” indicated that a respondent saw the version of the cooperation statement with a target party (often or seldom) that we expected, a priori, to shift party placements to the right, while a “0” indicated an expected shift to the left.
Figure 18 provides the relevant results and reveals important differences in the way political sophistication is related to these cues compared to those for policies or values. Most obviously, partisan cooperation cues become relevant to our respondents’ left-right images of parties at lower levels of political sophistication than do cues about policy or values. Further, the size of the effects at the highest levels of political sophistication tend to flatten out starting after about 60 to 80 – indicating there is not much difference in the weights respondents put on these cues when we move from high to very high levels of political sophistication. This contrasts with what we saw for values, but more closely mirrors what we saw for policy (at the top end). Overall, less sophisticated respondents tend to put more weight on cooperation cues than other cues and these weights increase with increasing sophistication. However, the signal value of cooperation cues plateaus at higher levels of sophistication (where, as we have seen, values cues seem to play a bigger role).
The impact of aggregated cooperation cues by level of political sophistication
Note: Dark points indicate AMCEs, with grey shaded 95% CIs. Each point is estimated based on a moving window of 200 respondents, where respondents are ordered from least to most politically sophisticated. Vertical lines mark the sophistication level where the AMCE becomes statistically different from 0 (solid), 0.5 (dash), 1.0 (short dash), and 1.5 (dot). See Figure 9 note for details.
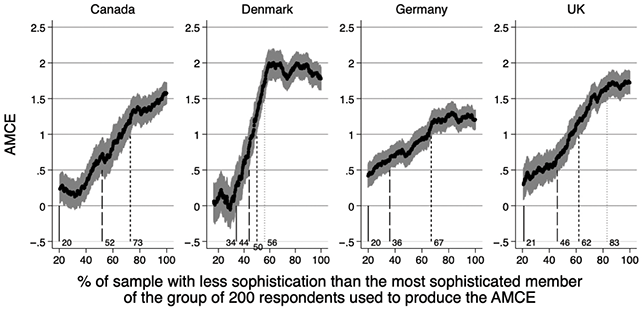
The German case again stands out as different from the others in two ways. First, the AMCEs for the most sophisticated Germans plateau at about 1.25, lower than the other countries. If we look at the cue-specific versions of this graph in OA3.10, we immediately see why: The AMCEs for cooperation with the CDU or SPD are both half the size of the AMCEs for the leading parties of the left and right in the other countries. This is, in our view, almost certainly due to the grand coalition between these CDU and the SPD. Indeed, this is the most dramatic example of the general (across parties and counties) phenomenon identified earlier in which voters give more (less) weight to cooperation with parties whose patterns of cooperation are more (less) ideologically pure.
Second, the AMCEs for the least sophisticated Germans in Figure 18 are also higher (though not dramatically) than for other countries. Again, examining the cue-specific results (in OA3.10) reveals that this is largely due to large AMCEs among unsophisticated voters for cooperation cues targeted at the AfD and Linke. Interestingly, extremist parties on the left and right in our other countries (the DF, NB, and Enh in Denmark and UKIP in the UK) do not have similarly oversized AMCEs for less sophisticated voters. A clue to the source of this significant (but moderately sized) difference is found in OA3.12. These figures are histograms of the left-right position at which our least sophisticated respondents (40th percentile and below) in each country placed their extremist parties. For all such parties in Denmark and the UK, we get a largely uniform distribution over the possible placements, with a spike at the center and perhaps some small tilt in the appropriate ideological direction. Less-sophisticated German voters, however, show a completely different pattern: These voters place both the AfD and Linke unequivocally at the extremes. Approximately 40% of these respondents place these two parties, respectively, at either 10 or 1 on the left-right scale and the rest of these highly skewed distributions follow suit.
It is likely that this difference reflects the same underlying dynamic in German politics that we pointed out earlier. In a period when the large left and right parties were pursuing strategies of centrism and compromise (with the SDP adopting many neoliberal economic positions and the CDU adopting relatively progressive positions on issues around immigration and diversity), Linke and AfD may have emerged (partially in response) as clear alternative anchors for what it means to be left or right. Thus, consistent with the theory of ecological rational heuristic inference, voters find the signal of cooperation with these extremist parties to be much more useful in accessing the left-right positions of a new party than cooperation with the traditionally leading parties of the left and right. What is remarkable is how successful this basic message was at penetrating the consciousness of low sophistication voters – a fact that likely reflects the intensity of the political debate around these issues (and parties) in the late 2010s and perhaps their particular salience among lower-sophistication voters.
3.4 Cues about the Social Basis of Party Support
As discussed in Section 1, there is a long tradition in western political science that explains the origins, relative sizes, and long-term success of different parties (and party families) by pointing to corresponding differences in patterns of social group support for parties. Further, some recent work (e.g., Mason Reference Martin and Stevenson2018, Harteveld Reference Harteveld2021) has argued for the continuing importance of social groups in generating patterns of partisan support (and to some extent ideological identifications). That said, we also pointed out in Section 1 that the influence of social groups on the character of parties may have been waning over time, especially for traditional social categories like class.
3.4.1 Which Social Support Cues Did We Include?
Given the origin of many parties as representatives of different classes, religious sects, regions (or ethnic groups), and urban/rural groups, we included cues about the support of each of these groups for the hypothetical parties in our study. Further, given the emergence of more modern alignments around women’s issues, new politics issues, and the emergence of the modern gender gap (Coffe et al. Reference Coffé, Kittilson, Meguid, Weeks, Carter, Keith, Vasilopoulou and Sindre2023, Weeks et al. Reference Weeks, Meguid, Kittilson and Coffé2023, Di Landro Reference Di Landro2025), we also included cues for support from women vs. men and younger vs. older voters. For each new party that respondents placed on the left-right scale, they were provided with one of the social group support cues listed in Table 6.
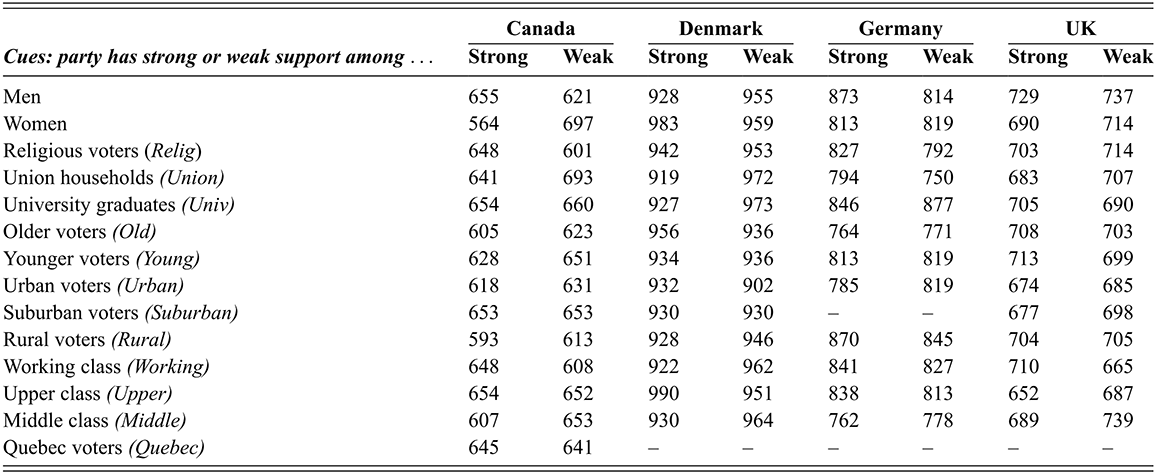
Table 6 Long description
The table presents 14 social group attributes (rows), several with a short variable name in italics. The cue framing is whether a party has strong or weak support among a given social group. The columns show, for each of four countries, the number of conjoint trials in which respondents saw either the strong or weak version of that cue. A dash (-) indicates that a given attribute was not used in that country.
The 14 social group attributes and their trial counts are as follows:
1. Men: Canada: 655 / 621; Denmark: 928 / 955; Germany: 873 / 814; U.K.: 729 / 737.
2. Women: Canada: 564 / 697; Denmark: 983 / 959; Germany: 813 / 819; U.K.: 690 / 714.
3. Religious voters (Relig): Canada: 648 / 601; Denmark: 942 / 953; Germany: 827 / 792; U.K.: 703 / 714.
4. Union households (Union): Canada: 641 / 693; Denmark: 919 / 972; Germany: 794 / 750; U.K.: 683 / 707.
5. University graduates (Univ): Canada: 654 / 660; Denmark: 927 / 973; Germany: 846 / 877; U.K.: 705 / 690.
6. Older voters (Old): Canada: 605 / 623; Denmark: 956 / 936; Germany: 764 / 771; U.K.: 708 / 703.
7. Younger voters (Young): Canada: 628 / 651; Denmark: 934 / 936; Germany: 813 / 819; U.K.: 713 / 699.
8. Urban voters (Urban): Canada: 618 / 631; Denmark: 932 / 902; Germany: 785 / 819; U.K.: 674 / 685.
9. Suburban voters (Suburban): Canada: 653 / 653; Denmark: 930 / 930; Germany: not included; U.K.: 677 / 698.
10. Rural voters (Rural): Canada: 593 / 613; Denmark: 928 / 946; Germany: 870 / 845; U.K.: 704 / 705.
11. Working class (Working): Canada: 648 / 608; Denmark: 922 / 962; Germany: 841 / 827; U.K.: 710 / 665.
12. Upper class (Upper): Canada: 654 / 652; Denmark: 990 / 951; Germany: 838 / 813; U.K.: 652 / 687.
13. Middle class (Middle): Canada: 607 / 653; Denmark: 930 / 964; Germany: 762 / 778; U.K.: 689 / 739.
14. Quebec voters (Quebec): Canada: 645 / 641; Denmark: not included; Germany: not included; U.K.: not included.
Note: Entries are the number of conjoint trials in which respondents viewed either the strong or weak version of each social group support attribute. Following advice from German politics experts, the suburban cue was excluded from the German case.
Note: Entries are the number of conjoint trials in which our respondents viewed either the strong or weak version of each social group support attribute. Following the advice of German politics experts we consulted, we excluded the suburban cue from the German case.
3.4.2 Top-line Results for Social Group Support Cues
Figure 19 gives our topline results for social group cues. Since our cues for any group are symmetric and we chose to present the version that we expected a priori to push placements to the right, we expect all estimates to be positive and that is mostly what we find – only four of the fifty-two estimates are negative, and just one of those is statistically significant.
The impact of social group support on left-right placements of parties
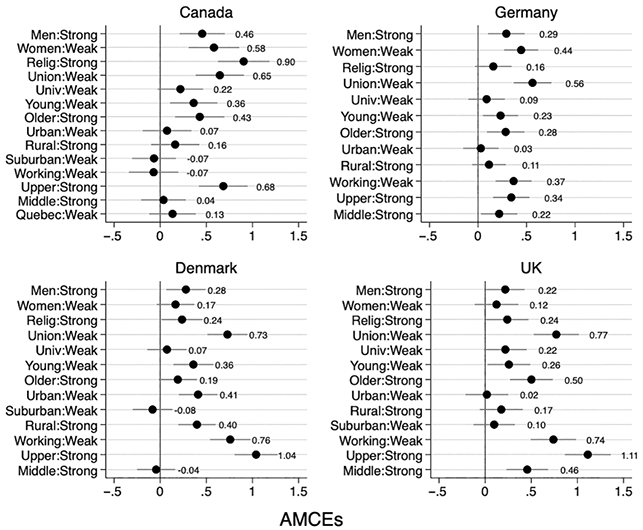
Despite this directionally consistent result, the magnitudes of these effects are much smaller than those for policy, values, or partisan cooperation. Across groups, the average effect is 0.32 for Canada, 0.16 for Germany, 0.38 for the United Kingdom, and 0.15 for Denmark – which are about 50–60% of the average size of our policy effects (which are themselves generally smaller than the effects of values and partisan cooperation). This is clearly consistent with the oft-cited decline of the class, religion, and other social cleavages (e.g., Franklin et al. Reference Franklin, Franklin, Mackie and Valen1992, Dalton Reference Dalton1996, Goldberg Reference Goldberg2020).
The only effects that are both consistent across counties and at least moderately sized are for messages about which social classes (working, middle, and upper classes) support the new party and whether union members do. This may reflect voters’ lingering understanding of the left-right as a traditional summary of conflict between working/union households and the upper classes – a conflict that is apparently (given Figure 4) less well reflected in corresponding economic policy conflicts. In fact, if we look just at the social support cues that are greater than 0.5, the effect of cues about a party’s support from union members reaches this level for each country. Likewise, in Canada, Denmark, and the UK, the effects of cues about support from upper-class people reach 0.5. For Denmark and the UK, cues about working class support also reach this level. The only other cues greater than 0.5 are those concerning support from women and religious people. Overall, these results suggest that cues about the social groups that support parties are weighted far less heavily by the average voter in our countries than are other cues.
Next, as we did in the previous sections, we compare these estimates to those from our pilot studies (2017–2018) for Germany, Canada, and the UK to see how stable the estimates are over time. We present this comparison in Figure 20.
Comparing the effects of social group support using two independent samples from pilot and main studies
Note: X-axis indicates the AMCEs from the pilot study and y-axis indicates the AMCEs from the main study.
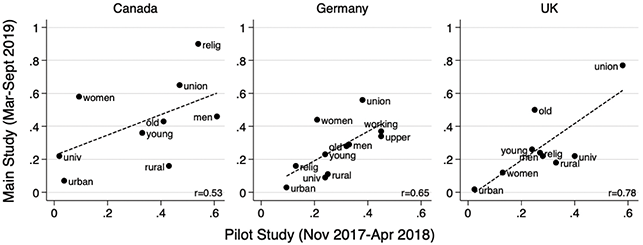
Like we have shown for the other attribute categories, the correlations are relatively large, suggesting that our respondents tend to use social group support cues consistently over time. That said, the level of continuity in social cues is smaller than we found for policy cues, values cues, and cues about partisan cooperation.
3.4.3 Exploring the Sources of Heterogeneity in the Impact of Social Support Cues
In Section 1, we argued the usefulness of social support cues about different groups will reflect the “signal value” of the cue, which in this case should be stronger when group members tend to support parties on one side of the left-right divide and non-group members tend to support parties on the opposite side.
Usefully, our surveys asked respondents a set of demographic questions that covered all the social groups that we included in the experiments and also to place themselves on the left-right scale. Thus, we can calculate the average left-right self-placement of our respondents who identify themselves as members of each social group, as well as the average left-right position of respondents who do not. The bigger the difference in these averages the stronger the signal that group support should provide about the new party’s left-right position – and the bigger the expected AMCEs.
Figure 21 provides our results. The y-axis indicates the AMCEs of social support cues as shown in Figure 19, while the x-axis represents our measure for the (lack of) distinctiveness in the left-right orientation between group members and non-group members of a given social group. The scores on the x-axis are calculated by taking the average left-right position for members of a social group minus the average left-right position for non-members of that group. Thus, a positive value on the x-axis indicates that the group tends to be more right-leaning than non-members.
Relationship between the difference in the average left-right distance between the members and non-members of a social group and the impact of that group’s support on LR placements
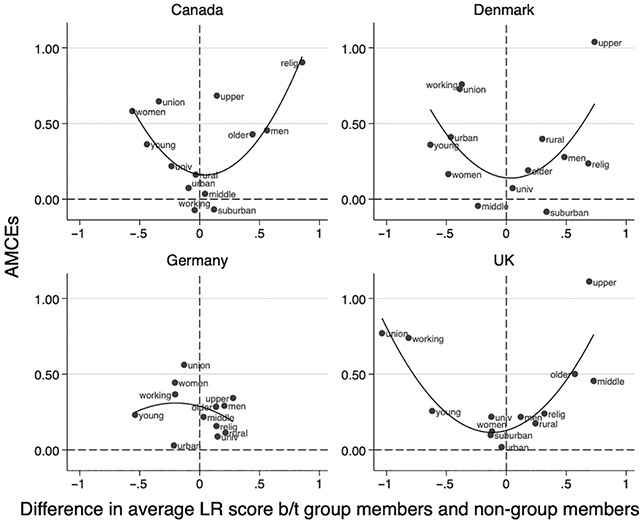
First, the results are consistent and intuitive across the four countries. Women, union members, working-class individuals, urban residents, and younger people tend to be positioned to the left of those not belonging to these groups. In contrast, men, religious individuals, rural residents, and older people are generally positioned to the right. Second, in three of the four countries, we observe a U-shaped relationship between the AMCEs of different social support cues and the difference in average left-right positions between group members and non-members. This means that the greater the left-right distance, whether to the left or to the right, between members of a social group and non-members, the larger the corresponding AMCE in the conjoint experiment. This indicates that when there is a clear distinction in the left-right positions between members and non-members of a particular group, the effect of that group’s support for a party will have a more pronounced effect on voters’ left-right images of the party.
While this pattern is evident in our Canadian, Danish, and British samples, we do not observe it in our German sample. In Germany, the relationship between differences in average left-right self-placements between group members and non-members and the AMCEs for social support cues appears relatively flat.
3.4.4 Social Support Cues and Political Sophistication
In this section, we analyze how the influence of cues about parties’ social group support on the left-right images of parties varies with political sophistication, using the same aggregation strategy that we used for other cue-categories (described in Section 3.1.4). As shown in Figure 22, political sophistication does not moderate the impact of social support cues on left-right images of parties to the same extent as it does for policies, values, or patterns of partisan cooperation.
The impact of aggregated social group cues by level of political sophistication
Note: Dark points indicate AMCEs, with grey shaded 95% CIs. Each point is estimated based on a moving window of 200 respondents, where respondents are ordered from least to most politically sophisticated. See Figure 9 note for details.
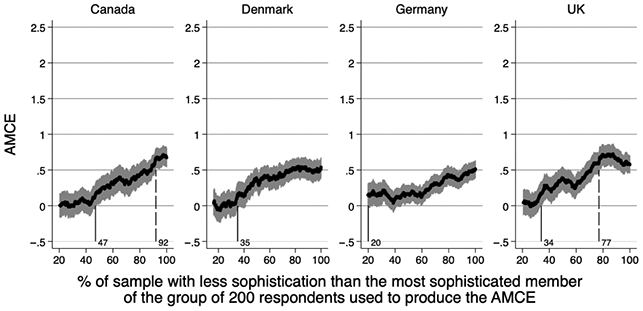
While there is clearly a positive relationship between sophistication and the weight voters put on social support cues (as hypothesized), in all four countries the AMCEs remains below 1 and in Denmark and Germany never even exceed 0.5. Thus, our findings imply that even among individuals with high political sophistication, social group support does not strongly shift perceptions of a party’s left-right position compared to other cue categories.
4 Conclusion and Discussion
In this Element we have relied on the theoretical framework of ecologically rational heuristic inference to organize a variety of theoretical suggestions and empirical results from the large literature on the nature of the left-right generally and voters’ left-right images of parties specifically. We have suggested that voters use a set of party-specific cues as inputs to a partisan left-right heuristic that allows them to form sensible left-right images of parties. We theorized that “ecologically rational” cues are ones that are cheap, simple, and accurate in the context in which they are used and leveraged this proposition to derive empirical predictions about which cues we expect to be most used in different contexts and by different kinds of voters.
With respect to context, we expected voters to give more or less weight to specific types of cues in different contexts – including contexts that vary in levels of polarization (across policies, values, and systems), the salience of specific policies and values, the ideological purity of (real-world) parties’ patterns of cooperation, and the extent to which members of specific social groups have distinct left-right identities. With respect to different kinds of voters, we expected (and found) large differences in the cue weights used by voters with different levels of political sophistication. For these theoretically indicated contextual effects, systematic differences in our estimated cue weights across contexts were consistent with our expectations. For example, the weight German voters give to cooperation cues with the leading parties on the left and right was about half the size that voters in our other countries give to their leading left and right parties – a result strikingly consistent with both the consensus (among our respondents) that the SPD and CDU/CSU cooperate extensively and the rest of our evidence that voters in all of our countries give less weight to cues about cooperation with ideologically promiscuous parties (as shown in Figure 17).
Given the confirmation of the contextual hypotheses listed earlier, which are mostly about heterogeneity within cue categories, in this concluding section we focus on exploring the extent to which the results support our (rough) expectations about the relative importance of the different cue categories as well as considering what we learn from our analysis that we did not expect a priori. Next, we discuss the issue of the generalizability of our findings, pointing again to the important distinction between conjoint designs for studying behavior and conjoint designs for studying meaning, as well as comparing our results to a parallel observational study that we did in conjunction with (and with the same respondents as) our experimental design.
4.1 Summarizing Our Empirical Results by Cue Category
In Section 3, we have presented the results for each cue category separately and only informally examined differences across cue categories. In this section we provide a more systematic comparison. We begin, in Table 7, with a set of common metrics that could be used to aggregate our estimated weights within cue categories, including the one we have already relied on: the strategy of re-coding the specific cues in a category to reflect the (predetermined) left-right direction of the effect (labeled as “Aggregate weight”).
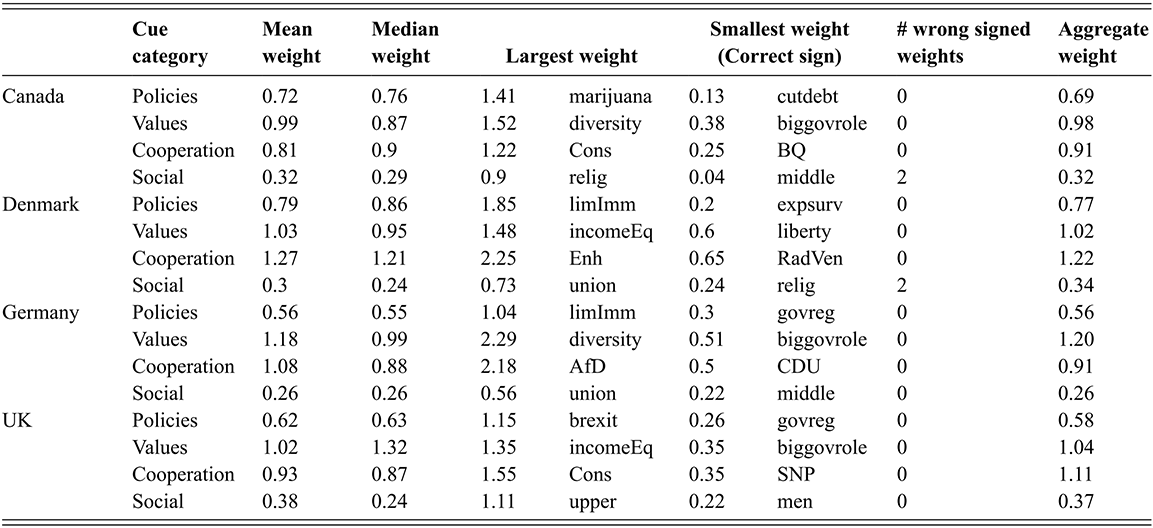
Table 7 Long description
The table is organised by country (Canada, Denmark, Germany, U.K.), and within each country by four cue categories (Policies, Values, Cooperation, Social). The columns are: Cue category, Mean weight, Median weight, Largest weight (value and attribute name), Smallest weight with correct sign (value and attribute name), Number of wrong-signed weights, and Aggregate weight.
Under Canada:
1. Policies: mean 0.72, median 0.76, largest 1.41 (marijuana), smallest 0.13 (cutdebt), wrong-signed 0, aggregate 0.69.
2. Values: mean 0.99, median 0.87, largest 1.52 (diversity), smallest 0.38 (biggovrole), wrong-signed 0, aggregate 0.98.
3. Cooperation: mean 0.81, median 0.90, largest 1.22 (Cons), smallest 0.25 (B Q), wrong-signed 0, aggregate 0.91.
4. Social: mean 0.32, median 0.29, largest 0.90 (relig), smallest 0.04 (middle), wrong-signed 2, aggregate 0.32.
Under Denmark:
1. Policies: mean 0.79, median 0.86, largest 1.85 (limImm), smallest 0.20 (expsurv), wrong-signed 0, aggregate 0.77.
2. Values: mean 1.03, median 0.95, largest 1.48 (incomeEq), smallest 0.60 (liberty), wrong-signed 0, aggregate 1.02.
3. Cooperation: mean 1.27, median 1.21, largest 2.25 (Enh), smallest 0.65 (RadVen), wrong-signed 0, aggregate 1.22.
4. Social: mean 0.30, median 0.24, largest 0.73 (union), smallest 0.24 (relig), wrong-signed 2, aggregate 0.34.
Under Germany:
1. Policies: mean 0.56, median 0.55, largest 1.04 (limImm), smallest 0.30 (govreg), wrong-signed 0, aggregate 0.56.
2. Values: mean 1.18, median 0.99, largest 2.29 (diversity), smallest 0.51 (biggovrole), wrong-signed 0, aggregate 1.20.
3. Cooperation: mean 1.08, median 0.88, largest 2.18 (A f D), smallest 0.50 (C D U), wrong-signed 0, aggregate 0.91.
4. Social: mean 0.26, median 0.26, largest 0.56 (union), smallest 0.22 (middle), wrong-signed 0, aggregate 0.26.
Under U.K.:
1. Policies: mean 0.62, median 0.63, largest 1.15 (brexit), smallest 0.26 (govreg), wrong-signed 0, aggregate 0.58.
2. Values: mean 1.02, median 1.32, largest 1.35 (incomeEq), smallest 0.35 (biggovrole), wrong-signed 0, aggregate 1.04.
3. Cooperation: mean 0.93, median 0.87, largest 1.55 (Cons), smallest 0.35 (S N P), wrong-signed 0, aggregate 1.11.
4. Social: mean 0.38, median 0.24, largest 1.11 (upper), smallest 0.22 (men), wrong-signed 0, aggregate 0.37.
The first observation we can make from the table is that regardless of whether we summarize the cue weights using the mean, median, largest, smallest, or the aggregate weight, cues related to values and partisan cooperation consistently have the largest impact on respondents’ left-right images of parties across all four countries. This is followed by cues about party policy positions, with social support cues being the least impactful. Thus, our overall message about the relative importance of these broad cue categories is the same for all the countries and holds regardless of the aggregation metrics we use.
Second, although policy cues generally rank third, their most significant effects can be almost as large for values and cooperation cues. For example, policy issues like marijuana in Canada, immigration in Denmark, and Brexit in the UK have almost the same, or in one case (Danish immigration), a greater influence than the largest effects from cooperation and values cues.
Finally, we compare, in Figure 23, the aggregate AMCEs for different attribute categories over different levels of political sophistication. Here we are mainly interested in comparisons across cue categories within countries. The first thing to notice is that the general conclusions from our comparisons earlier remain the same in this expanded view – but with important nuances.
Comparing the impact of political sophistication on different attribute categories
Note: Each line simplifies the earlier figure by omitting confidence intervals for clarity. These lines are combined to enable direct comparison of AMCEs across different categories within countries.
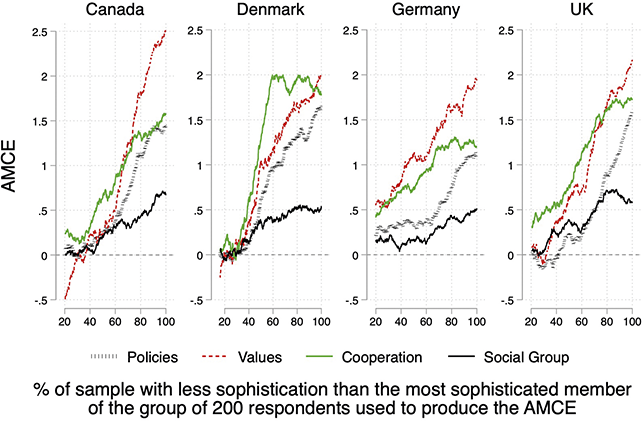
While the evidence earlier suggested that cues about values and partisan cooperation had the largest effects and were about equally impactful for respondents’ left-right images of parties, these graphs alter that conclusion: Values cues seem to matter more than partisan cooperation at the highest levels of political sophistication within each country (with the partial exception of Denmark), while cooperation cues (with the exception of Germany) matter the most for individuals at lower and medium levels of political sophistication.
Interestingly, the impact of cooperation cues, in each country, seems to flatten out once one reaches middle to high levels of sophistication (about the 60th percentile in Germany and Denmark, the 70th percentile in UK, and slightly higher than the 60th percentile in Canada). One reasonable explanation for these results is that the weight voters give to cooperation cues flattens out where it does because this is the level of sophistication beyond which most voters are both aware of the true levels of partisan cooperation between the parties and are using a good approximation of the “true” weight for this cue (i.e., the true association of partisan cooperation with the elite consensus about the left-right position of a party) and so being even more sophisticated does little to change that.
In contrast to cooperation cues, the weight respondents put on values cues (and, to a lesser extent, policy) continues to increase over the whole range of sophistication. This may suggest that even the most sophisticated voters have not fully internalized the extent to which a party’s long-term values determine the elite consensus about the party’s left-right position. That said, the high levels that cue weights for values reach reinforces our earlier conclusion that at the highest levels of political sophistication, respondents likely possess an ideological system that allows them to translate broad party values to the left-right in broadly similar ways – that is, they all understand (and agree with each other about) what the value content of the left-right is (and thus, in aggregate, we get a bigger, directionally consistent, estimated weight for this group).
It is also interesting to note that while cooperation and policy cue weights are smaller for highly sophisticated Germans than in the other countries, this does not hold for values. This makes sense if those sophisticated German voters discount cooperation and policy cues due to the grand coalition (with its necessary strategic policy compromises) but retain an ideological understanding of the long-term values of the party that is more immune to such short-term considerations.
Figure 24 provides a different way of looking at our results. This figure graphs the sizes of the AMCEs for each cue category relative to each other at different levels of sophistication. Given this kind of presentation sacrifices information about the absolute size of these effects, we include the R-squared from the multivariate regression used to estimate the AMCEs for each group of 200 respondents.Footnote 58 Thus, the R-squared gives an indication of the overall predictability of the placements for each sophistication group.
Proportion of AMCE attributable to each cue category
Note: The figure shows each cue category’s proportional contribution to the AMCE across different levels of political sophistication. Each color corresponds to a cue category, with larger segments indicating a greater share of the AMCE explained by that cue. Dashed vertical lines mark where the model’s R2 reaches 0.025, 0.05, and 0.10, respectively.
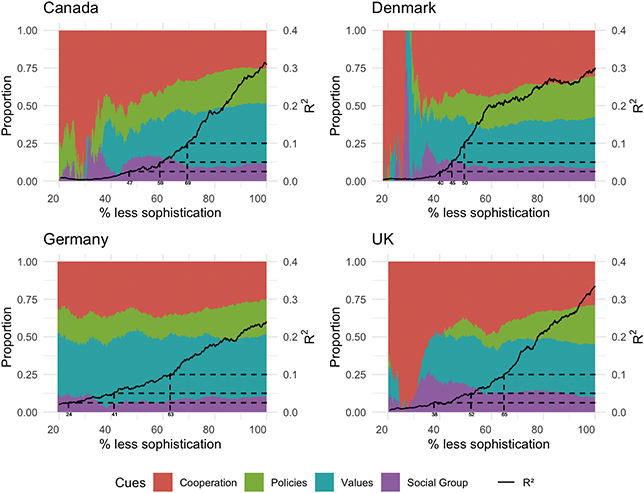
This perspective clearly demonstrates how higher levels of political sophistication lead to left-right placements that are increasingly better predicted by the provided cue information. In every country, the placements of the most sophisticated respondents explain about 30% of the variance in party placements and this number declines (essentially monotonically) with decreasing levels of sophistication. As highlighted earlier, the grand coalition in Germany likely contributes to the slightly lower levels of explained variance among the most sophisticated German voters – by depressing the (absolute) weight these voters assign to policy and partisan cooperation cues.
Furthermore, the R-squared statistics for these samples are notably flat (less than about 0.025, as shown by the bottom dotted line) up to the 40th percentile of sophistication in all countries except Germany. This partially validates Kinder and Kalmoe’s (Reference Kinder and Kalmoe2017) position that most voters lack a true grasp of what left-right is about. If we can explain less than 2.5% of respondents’ left-right party placements, one should question the extent to which they incorporate left-right concepts and language into their understanding of politics. Nevertheless, as Achen (Reference Achen2002) notes, an experimental approach allows us to make clean causal inferences even when the overall predictability of the outcome is low. Thus, even for low sophistication voters, our design can discern small causal effects amid substantial noise from low-sophistication voters’ responses.
Thus, the first thing to notice about the mix of cues used by our respondents is that in Canada, the UK, and Denmark, partisan conflict and cooperation cues dominate among lower-sophistication respondents (below the 30–40th percentile), with their use declining in proportion to other cues as sophistication increases. This aligns with our theoretical expectations, considering the relative availability of information about patterns of partisan cooperation to less sophisticated individuals and the strong real-world correlations between these patterns and parties’ true left-right positions (Martin and Stevenson Reference Lin, Stevenson, Tromborg and Fortunato2001, Reference Martin and Stevenson2010). Further, this supports the idea that lower-information voters rely more on group politics (reflected here in patterns of cooperation and conflict) than programmatic politics to understand the left-right, as suggested by scholars such as Arian and Shamir (Reference Arian and Shamir1983), Achen and Bartels (Reference Achen and Bartels2017), and Kinder and Kalmoe (Reference Kinder and Kalmoe2017).
The second thing to notice about Figure 24 is once the R-squared exceeds approximately 0.05 (between the 40th and 60th sophistication percentile), the variance explained by each cue category stabilizes. While increasing sophistication beyond this point brings minor shifts (i.e., less relative impact from cooperation cues and more from values and policy), these are not dramatic. Thus, respondents in the upper half of the sophistication distribution largely rely on the same cues in similar proportions, though the noise surrounding these regularities continues to decrease with increases in sophistication.
Notably, only in Germany do patterns of partisan cooperation and conflict not serve as the dominant cue for low-sophistication respondents. As previously highlighted in this section, however, this is likely due to Germany’s history of grand coalitions, which dilute the signal value of this cue for cooperation with the major parties on the left and right (which are the parties these voters are most likely to recognize and know something about).Footnote 59
4.2 External Validity and Our Parallel Observational Analysis
This section examines the external validity of our experimental findings. To do so, we highlight our novel parallel observational study (described in OA4.2), conducted with the same respondents (at the same time) as our conjoint experiments. Designed to mirror the conjoint experiment in structure and content, this study enables direct comparison of cue-weights citizens use to form left-right images of parties in hypothetical versus real contexts, and how well these weights are estimated in experimental versus observational data. This approach addresses common concerns about the external validity of conjoint designs by assessing if the same attributes that shape respondents left-right images of hypothetical parties also influence their left-right images of real-world parties.
The results, summarized in OA4.2.4, reveal a generally positive correlation between our experimental and observational estimates of cue weights, with the strongest correlation observed for partisan cooperation cues (r = 0.79). Policy and value cues showed more modest alignment (r = 0.46 and 0.33, respectively), while social group cues demonstrated the weakest correspondence (r = 0.21). While this level of correspondence is encouraging, the results also make it plain that relying solely on the observational study would have led to conclusions that, though broadly similar to what we have reported, diverged significantly in their specifics.
For example, while both analyses converge on the importance of cooperation cues – perhaps reflecting their broad utility even among less sophisticated voters – the substantial impact of values among more sophisticated voters, evident in the experimental study, is largely obscured in the observational one. In the observational regression analysis (OA4.2.4), few of the values that we found to be important in the observational studies are statistically significant and in the right direction: only one of the values (inequality) whose effects were directionally consistent and statistically significant in the conjoint analysis is the same in the observational one.
Table 8 summarizes these differences more systematically. Most importantly, comparing the number of statistically significant effects that were in the expected direction reveals that the experimental analysis provides clear, consistent, and statistically discernable answers, whereas the observational, though showing similar patterns, does do so with much less clarity.
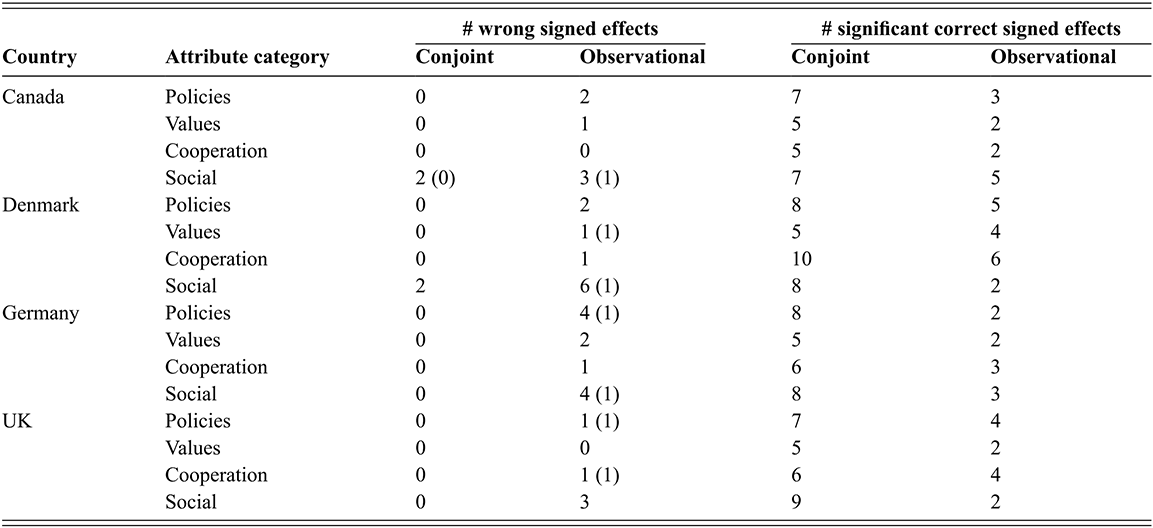
Table 8 Long description
The table is organised by country (Canada, Denmark, Germany, U.K.) and within each country by four attribute categories (Policies, Values, Cooperation, Social) in the row. There are four columns of data, grouped under two headings: the number of wrong-signed effects for Conjoint and for Observational, and the number of significant correct-signed effects for Conjoint and for Observational. Where a value appears in parentheses alongside a number, which indicates the count of statistically significant attributes within that category.
Country: Canada:
1. Policies: wrong-signed for conjoint 0 / for observational 2; significant correct-signed for conjoint 7 / for observational 3.
2. Values: wrong-signed for conjoint 0 / for observational 1; significant correct-signed for conjoint 5 / for observational 2.
3. Cooperation: wrong-signed for conjoint 0 / for observational 0; significant correct-signed for conjoint 5 / for observational 2.
4. Social: wrong-signed for conjoint 2 (0) / for observational 3 (1); significant correct-signed for conjoint 7 / for observational 5.
Country: Denmark:
1. Policies: wrong-signed for conjoint 0 / for observational 2; significant correct-signed for conjoint 8 / for observational 5.
2. Values: wrong-signed for conjoint 0 / for observational 1 (1); significant correct-signed for conjoint 5 / for observational 4.
3. Cooperation: wrong-signed for conjoint 0 / for observational 1; significant correct-signed for conjoint 10 / for observational 6.
4. Social: wrong-signed for conjoint 2 / for observational 6 (1); significant correct-signed for conjoint 8 / for observational 2.
Country: Germany:
1. Policies: wrong-signed for conjoint 0 / for observational 4 (1); significant correct-signed for conjoint 8 / for observational 2.
2. Values: wrong-signed for conjoint 0 / for observational 2; significant correct-signed for conjoint 5 / for observational 2.
3. Cooperation: wrong-signed for conjoint 0 / for observational 1; significant correct-signed for conjoint 6 / for observational 3.
4. Social: wrong-signed for conjoint 0 / for observational 4 (1); significant correct-signed for conjoint 8 / for observational 3.
Country: U.K.:
1. Policies: wrong-signed for conjoint 0 / for observational 1 (1); significant correct-signed for conjoint 7 / for observational 4.
2. Values: wrong-signed for conjoint 0 / for observational 0; significant correct-signed for conjoint 5 / for observational 2.
3. Cooperation: wrong-signed for conjoint 0 / 1 (1); significant correct-signed for conjoint 6 / for observational 4.
4. Social: wrong-signed for conjoint 0 / for observational 3; significant correct-signed for conjoint 9 / for observational 2.
Note: Values in parentheses indicate the number of statistically significant attributes within each category.
Note: The values in parentheses indicate the number of statistically significant attributes within each category.
This pattern is exactly what one would expect if the relationships uncovered by the conjoint analysis are real and robust, but multicollinearity and limited variation in the observational data make it difficult to isolate the effects of individual cues. This not only underscores the advantages of the experimental approach over the observational one but also demonstrates the broad compatibility of the findings from both. Specifically, the observational analysis effectively reveals the largest and most homogeneous (over respondents and cues) relationships in the data (e.g., the impact of cooperation cues which are consistently in the right direction and statistically significant in about two-thirds of the cases). Conversely, cues with smaller weights or that seem to be used by fewer respondents prove less robust (e.g., values cues are mostly in the right direction but are mostly insignificant), leading to less certain conclusions.
James N. Druckman
University of Rochester
James N. Druckman is the Martin Brewer Anderson Professor of Political Science at the University of Rochester. He served as an editor for the journals Political Psychology and Public Opinion Quarterly as well as the University of Chicago Press’s series in American Politics. He currently is the co-Principal Investigator of Time-sharing Experiments for the Social Sciences (TESS) and sits on the boards of the American National Election Studies, the General Social Survey, and the Russell Sage Foundation. He previously served as President of the American Political Science Association section on Experimental Research and helped oversee the launching of the Journal of Experimental Political Science. He was co-editor of the Cambridge Handbook of Experimental Political Science and Advances in Experimental Political Science. He authored the book Experimental Thinking: A Primer on Social Science Experiments. He is a Fellow of the American Academy of Arts and Sciences and has published approximately 200 articles/book chapters on public opinion, political communication, campaigns, research methods, and other topics.
About the Series
There currently are few outlets for extended works on experimental methodology in political science. The new Experimental Political Science Cambridge Elements series features research on experimental approaches to a given substantive topic, and experimental methods by prominent and upcoming experts in the field.
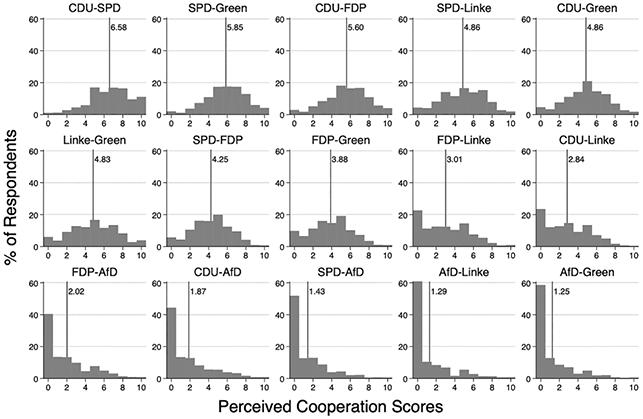
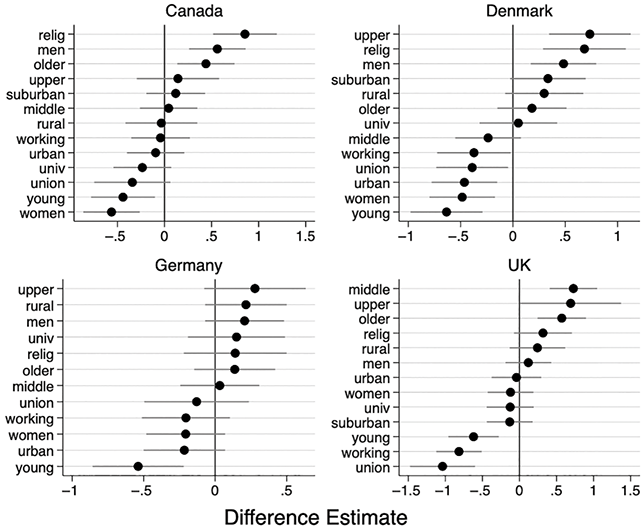
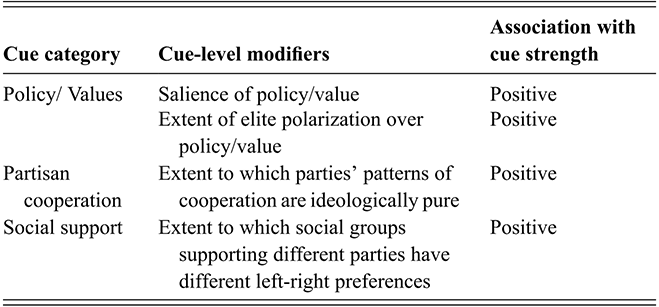
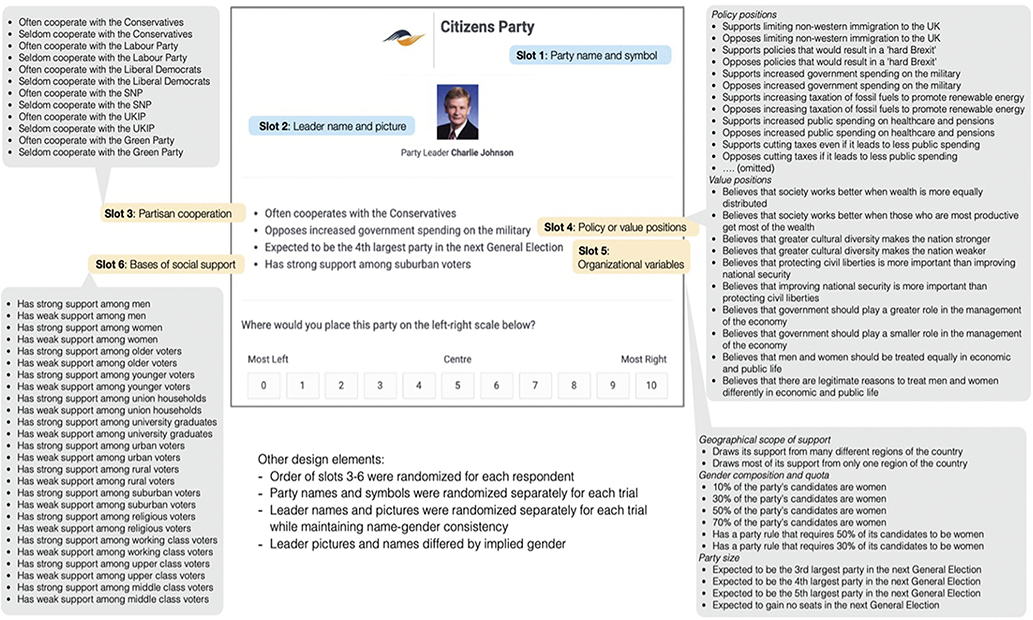
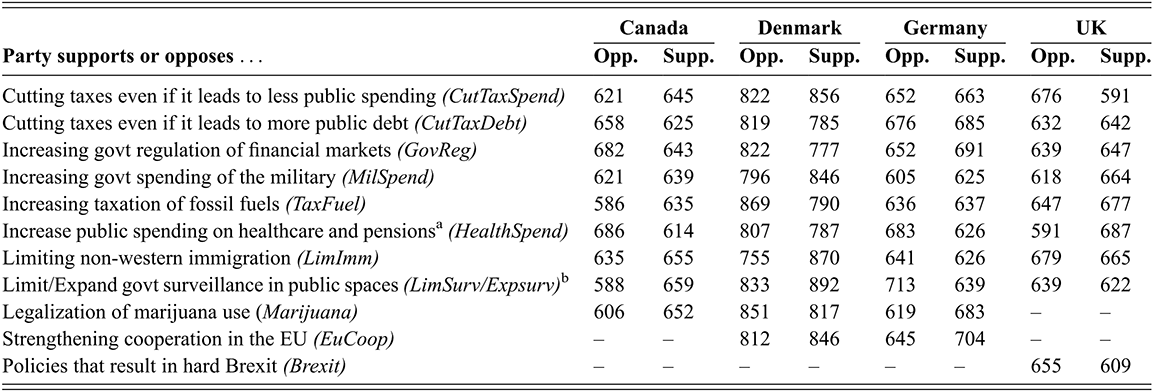
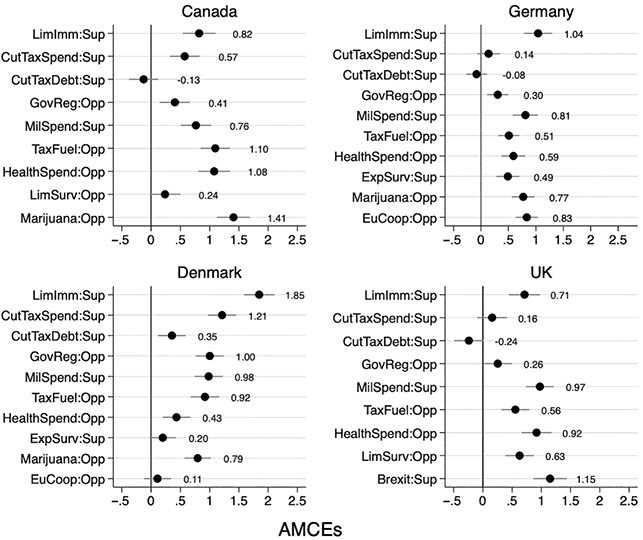
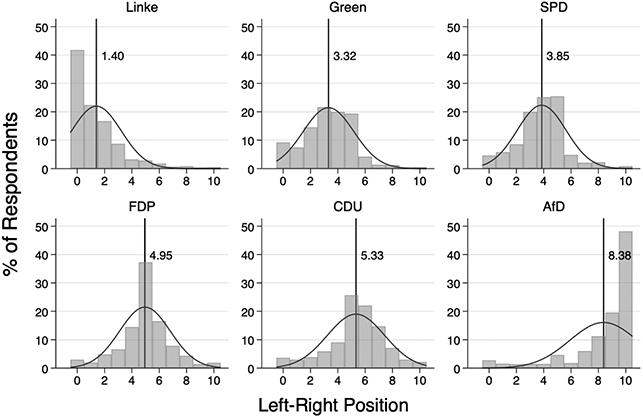
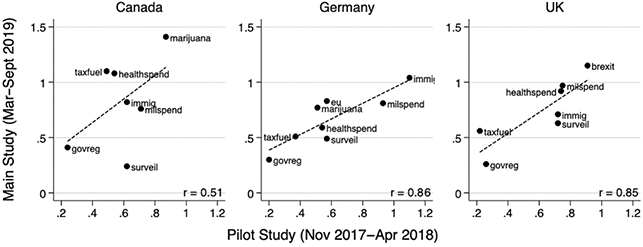
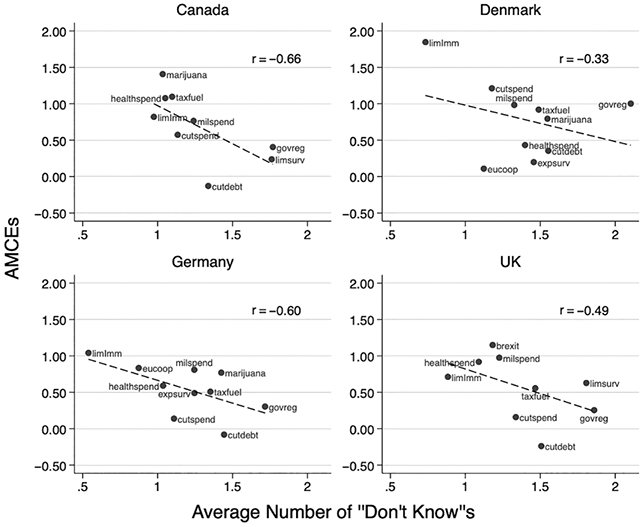
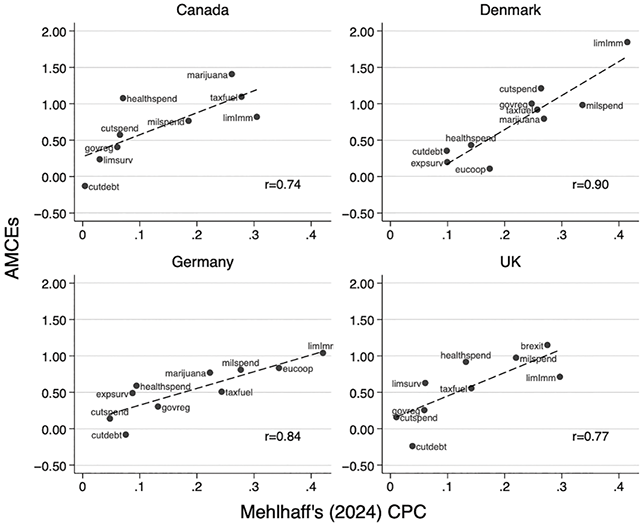
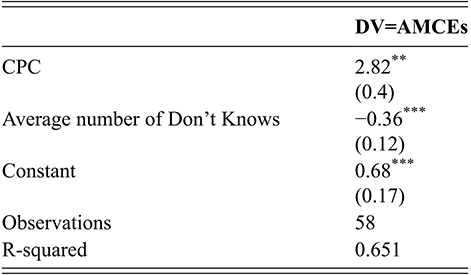
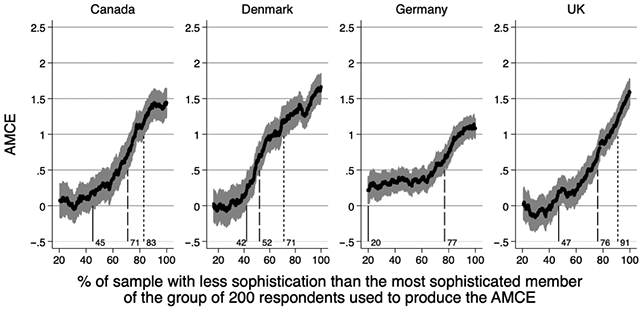
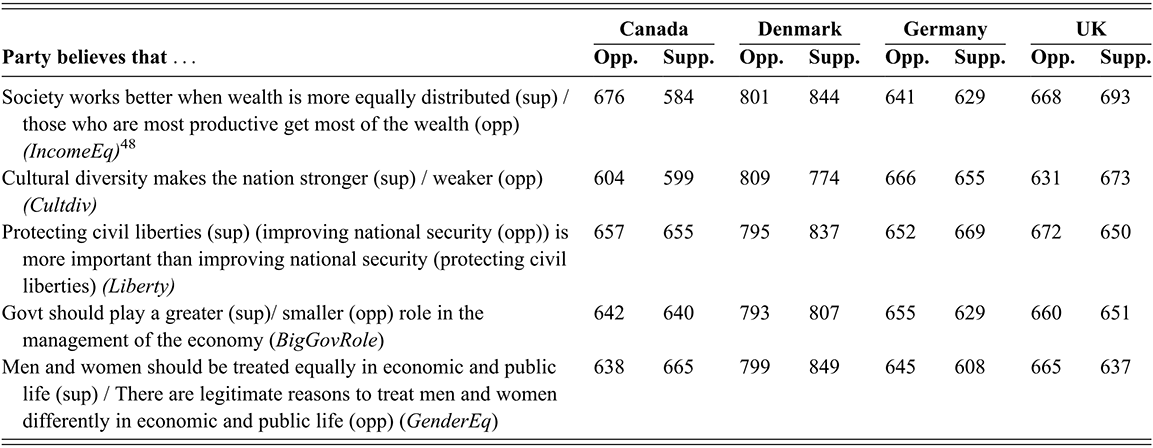
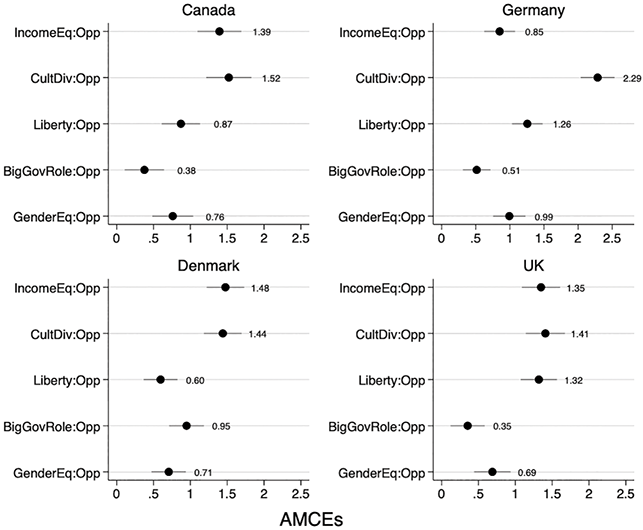
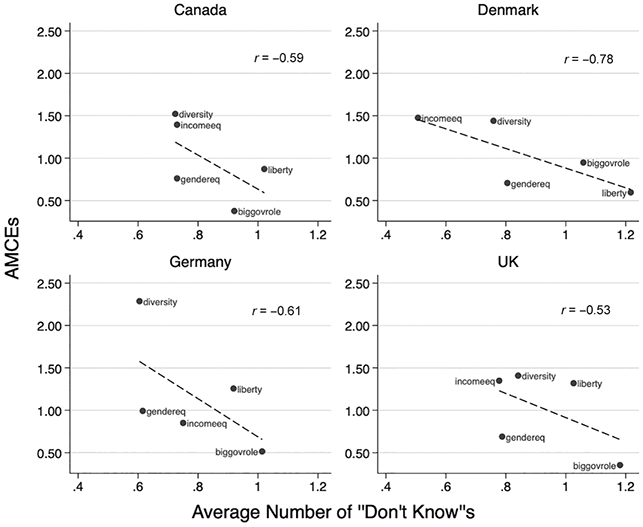
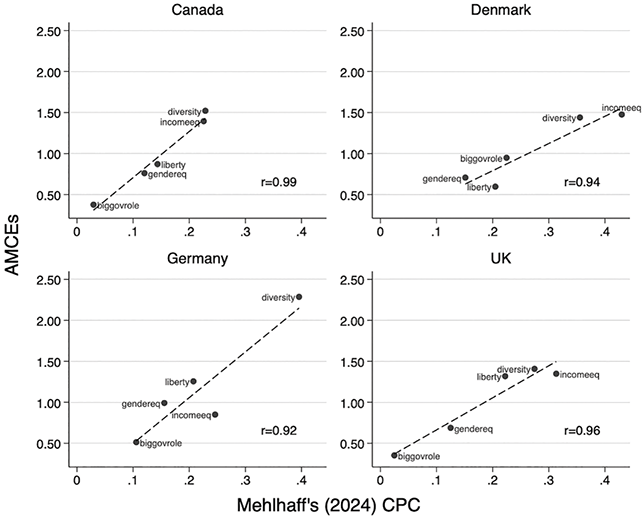
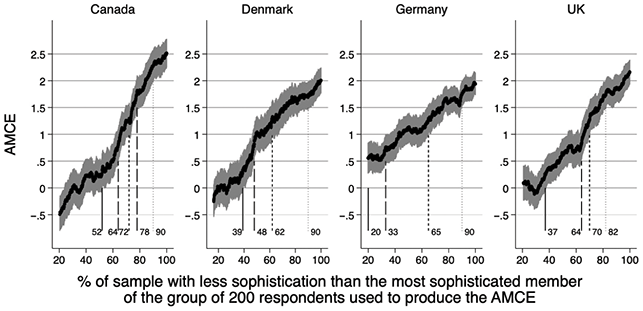
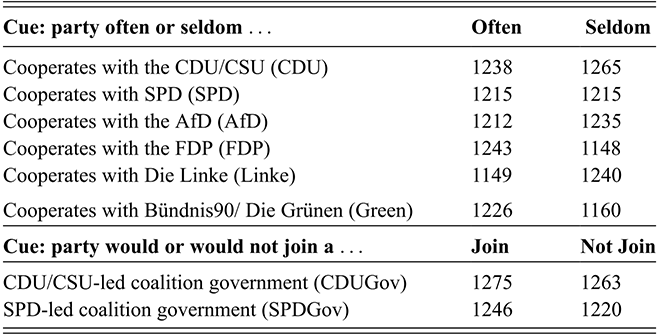
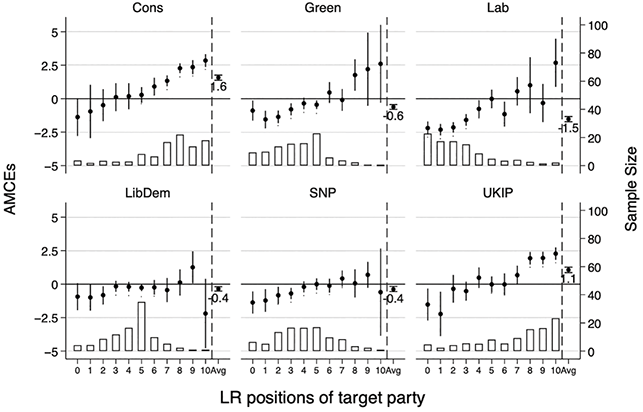
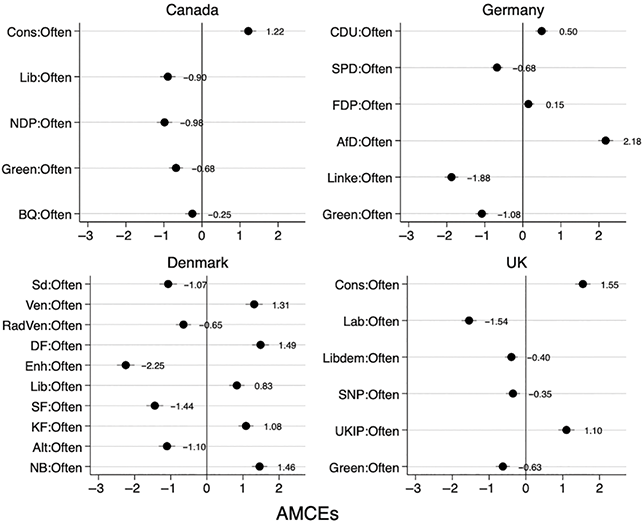
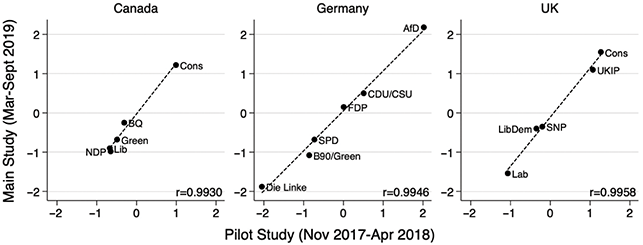
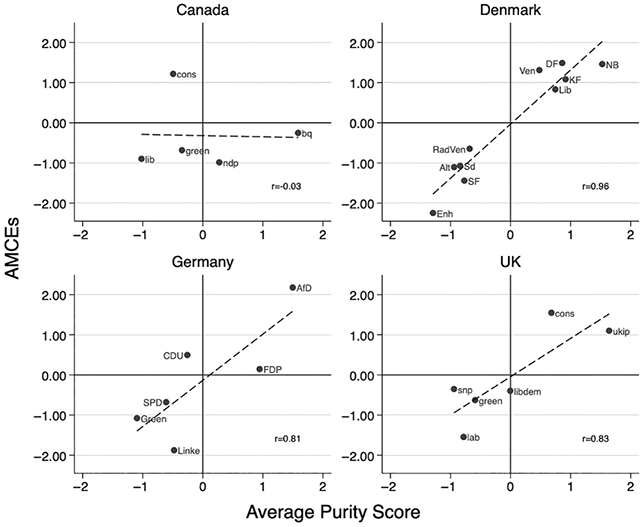
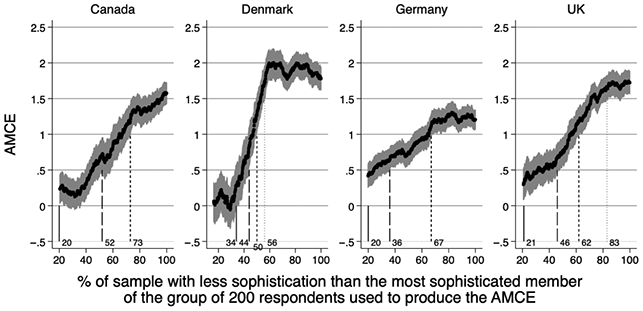
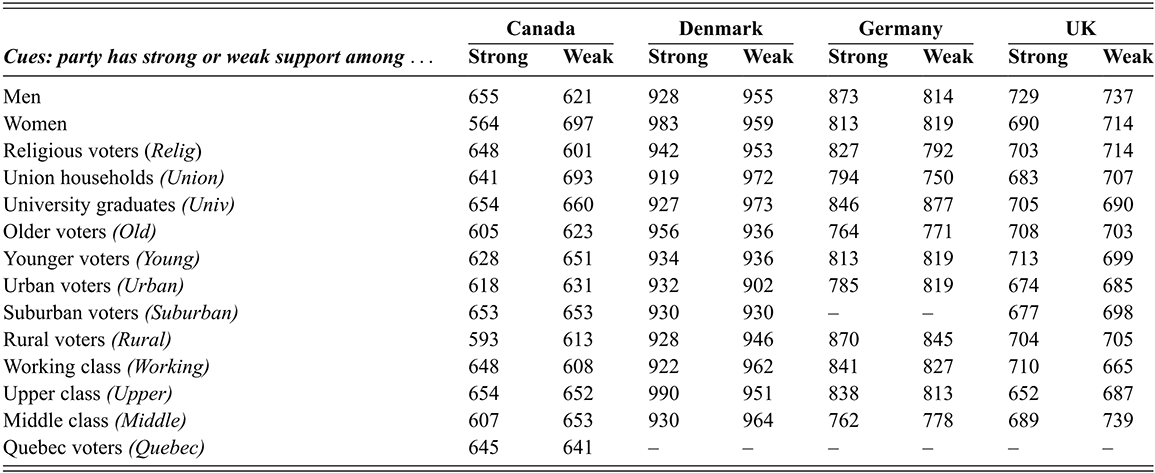
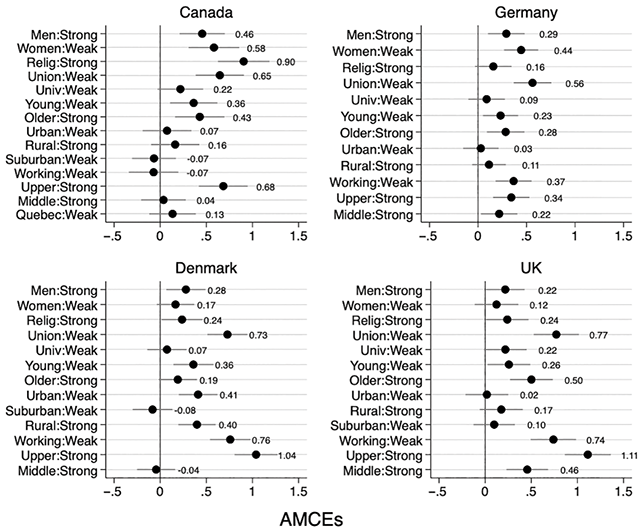
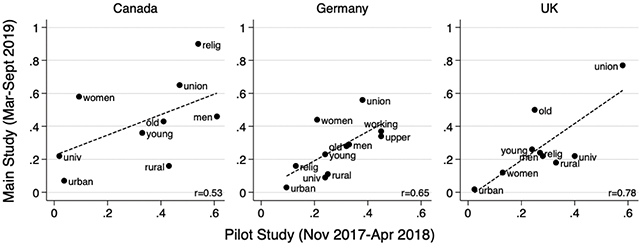
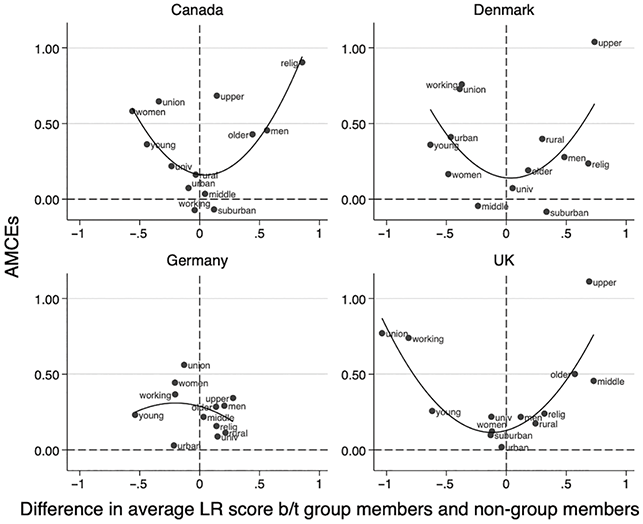
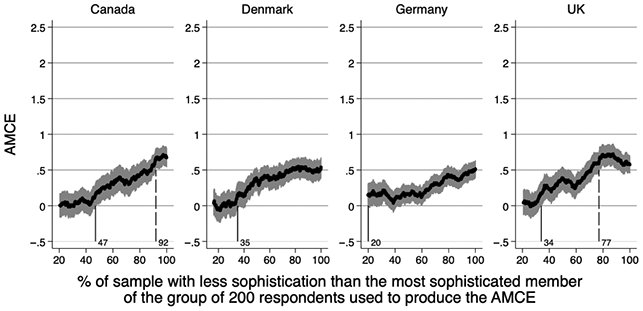
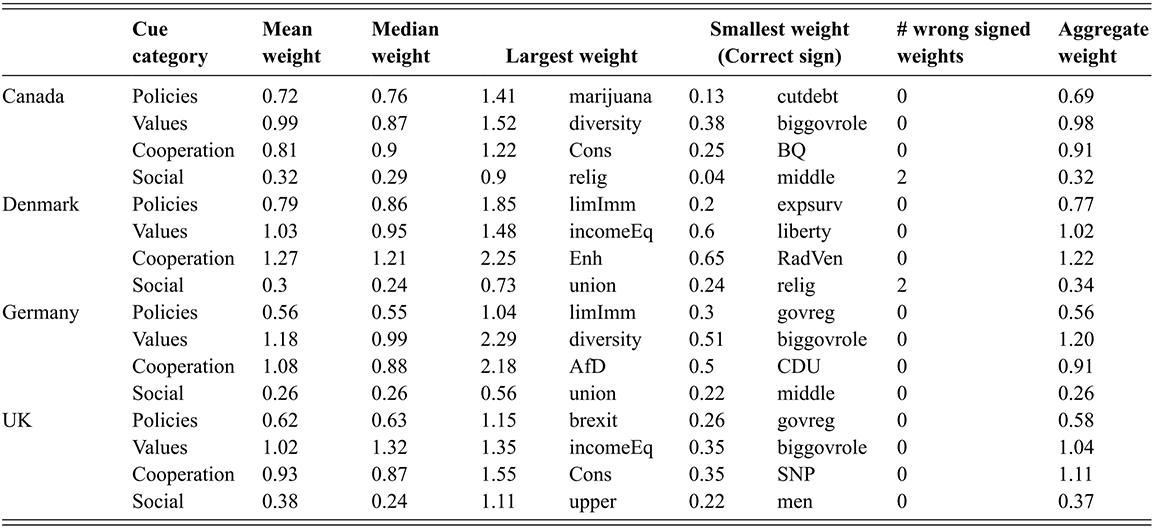
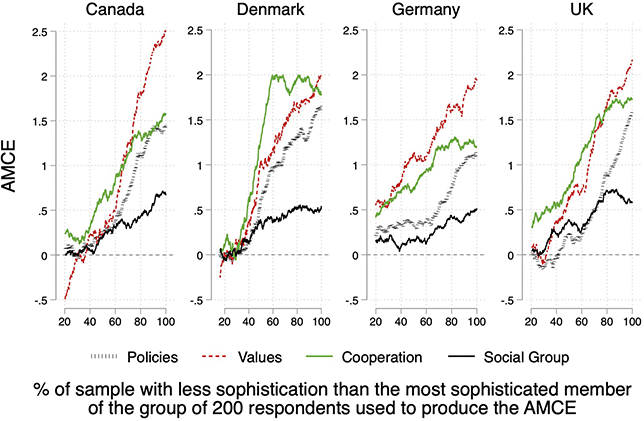
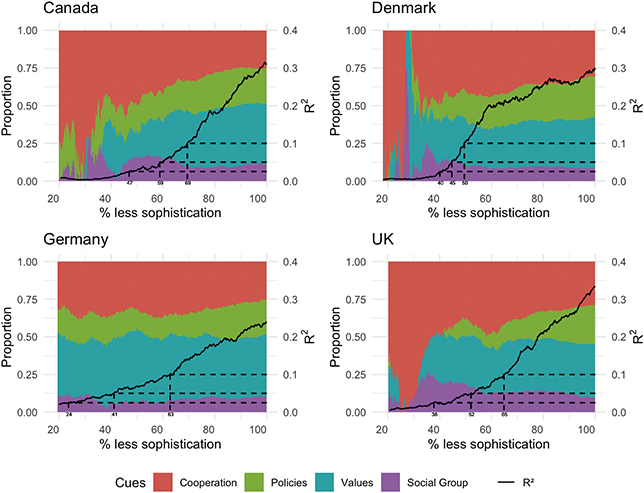
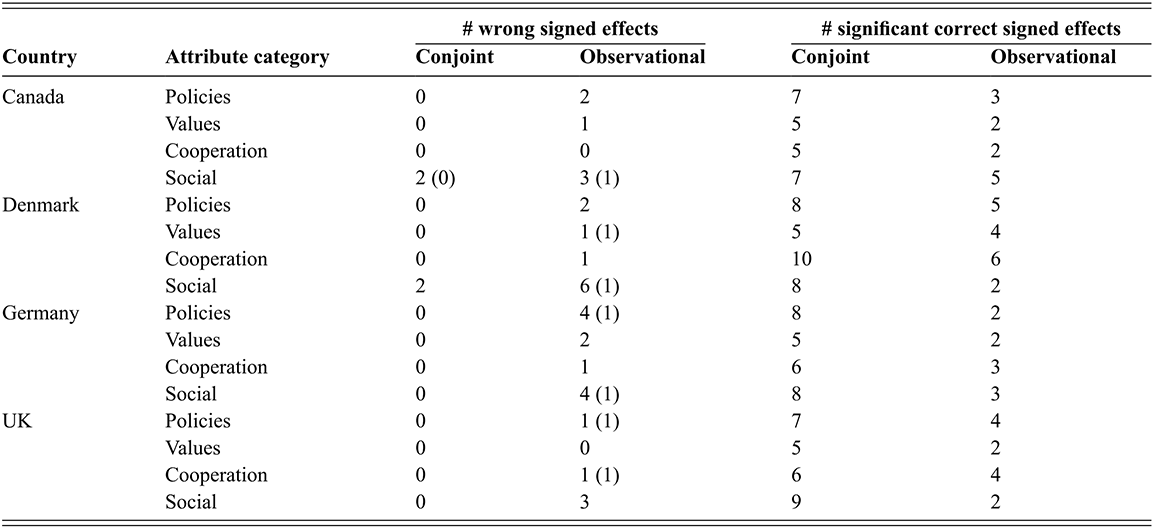

 Open access