


High-resolution airborne and spaceborne remote-sensing datasets have become an important element in the expanding geospatial tool kit of landscape archaeology and heritage management for capturing, analyzing, and visualizing archaeological features across large areas of study (e.g., Casana Reference Casana2020; Hammer et al. Reference Hammer, Fitzpatrick and Ur2022; Hobson Reference Hobson2019; Stone Reference Stone2014; Ur Reference Ur2013). In the South Caucasus—a topographically diverse region that includes the republics of Armenia, Azerbaijan, and Georgia—Hopper and colleagues (Reference Hopper, Anderson, Robinson, Anderson, Hopper and Robinson2018:15) recently ranked satellite remote sensing among the important new directions in regional survey methods. Historic and contemporary satellite imagery, combined with historical maps, can help researchers identify extent sites and trace diachronic changes in land use to provide a richer reading of archaeological landscapes across spatial and temporal scales. These interpretive and methodological affordances complement a significant growth in the South Caucasus over the past few decades of field research prioritizing studies at the regional scale (e.g., Anderson et al. Reference Anderson, Hopper and Robinson2018; Biscione and Dan Reference Biscione and Dan2011; Erb-Satullo et al. Reference Erb-Satullo, Jachvliani, Kalayci, Puturidze and Simon2019; Hopper et al. Reference Hopper, Lawrence, Snape, Chologauri, Priestman, Shumilovskikh, Pitskhelauri, Philip, Sauer, Chologauri, Gabunia, Hopper, Lawrence, MacDonald and Mashkour2020; Özfırat Reference Özfırat2009; Ricci et al. Reference Reinhold, Belinskiy and Korobov2018; Smith et al. Reference Smith, Badalyan and Avetisyan2009)—growth that has stimulated applications of a broad suite of geospatial methods to regional archaeological practice, including geographic information systems (GIS; Cobb et al. Reference Cobb, Earley-Spadoni and Dames2019; Egeland et al. Reference Egeland, Nicholson and Gasparian2010; Haroutunian Reference Haroutunian2016; Lindsay et al. Reference Lindsay, Greene, Marshall, Badalyan, Cromartie, Azatyan, Aghikyan, Mkrtchyan and Smith2022; Lindsay and Kong Reference Lindsay and Kong2020) and geophysical survey (e.g., Herrmann and Hammer Reference Herrmann and Hammer2019; Lindsay et al. Reference Lindsay, Leon, Smith and Wiktorowicz2014; Petrosyan et al. Reference Petrosyan, Azizbekyan, Gasparyan, Dan, Bobokhyan and Amiryan2021).
Nevertheless, despite the proliferation of satellite imagery sources at diverse resolutions and price points, and the subsequent growth of specialized archaeological remote-sensing literature over the past decade, several persistent barriers have worked to slow the advance of remote sensing, particularly in sectors outside of the funding streams of large academic institutions. Some of these challenges are endemic in the technology's user interface design (e.g., data portals that can be difficult to find and use), whereas others stem from a shortage of training and funding opportunities for many heritage practitioners and organizations. Among the initial challenges to researchers new to airborne and spaceborne imagery is sorting out the daunting variety of datasets available, determining which might be suitable for a research project and how to access them. This article aims to reduce some of these barriers by providing a basic overview of free or low-cost remotely sensed datasets available to archaeologists and by illustrating with recent examples of aerial remote sensing uses among archaeological projects in the South Caucasus (Table 1). Petrosyan and colleagues (Reference Petrosyan, Azizbekyan, Gasparyan, Dan, Bobokhyan and Amiryan2021) put their finger on a central challenge in stating that the use of advanced geospatial tools is often beyond the financial reach of many archaeological projects, so this article explicitly focuses on free and low-cost sources of datasets that do not require large financial investments in data or high-performance computers.
Free and Low-Cost Satellite Imagery Sources Commonly Used in Archaeological and Heritage Applications.
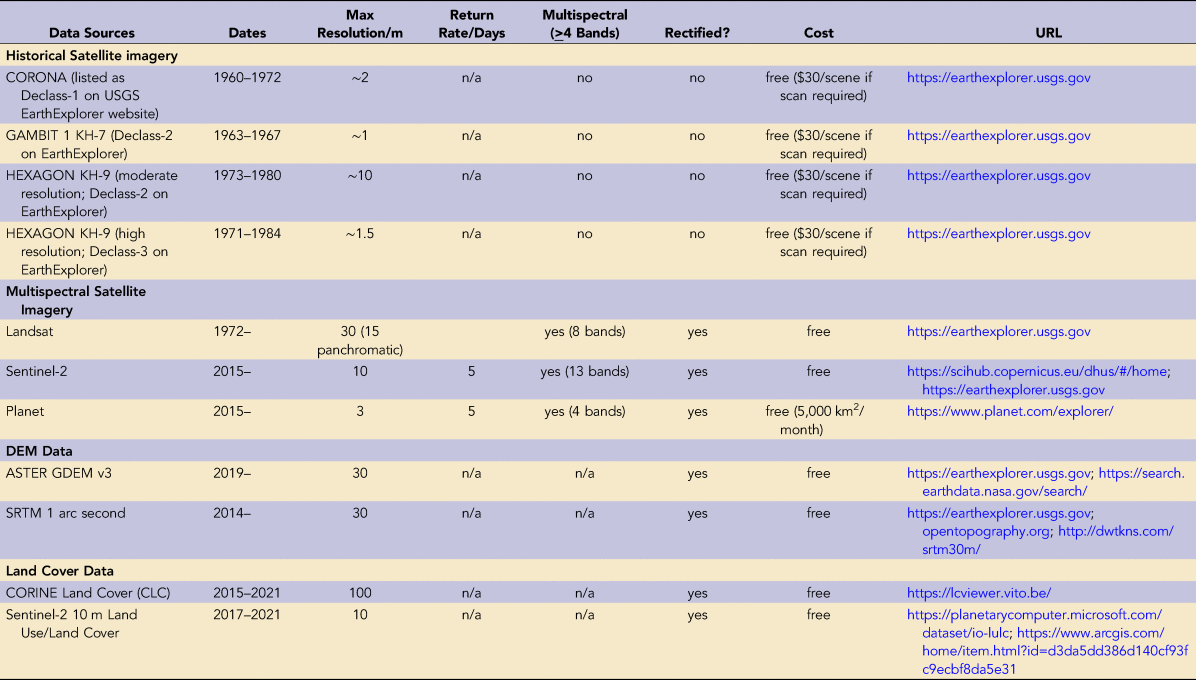
Note: For a comprehensive list of commercial multispectral imagery available, see Luo et al. Reference Luo, Wang, Guo, Lasaponara, Zong, Masini and Wang2019:Table 1.
However, as Opitz and Herrmann (Reference Opitz and Herrmann2018:13) also remind us, the ready accessibility of remotely sensed datasets has democratized the use of these resources to the degree that one can easily underestimate the training and practice required to process and interpret satellite imagery. This article is not meant as a substitute for that training. Rather, our goal is to provide an on-ramp to the vocabulary and range of common datasets and tools available, as well as highlight published examples of how they can be integrated into archaeology projects.
AIRBORNE REMOTE SENSING IN ARCHAEOLOGY
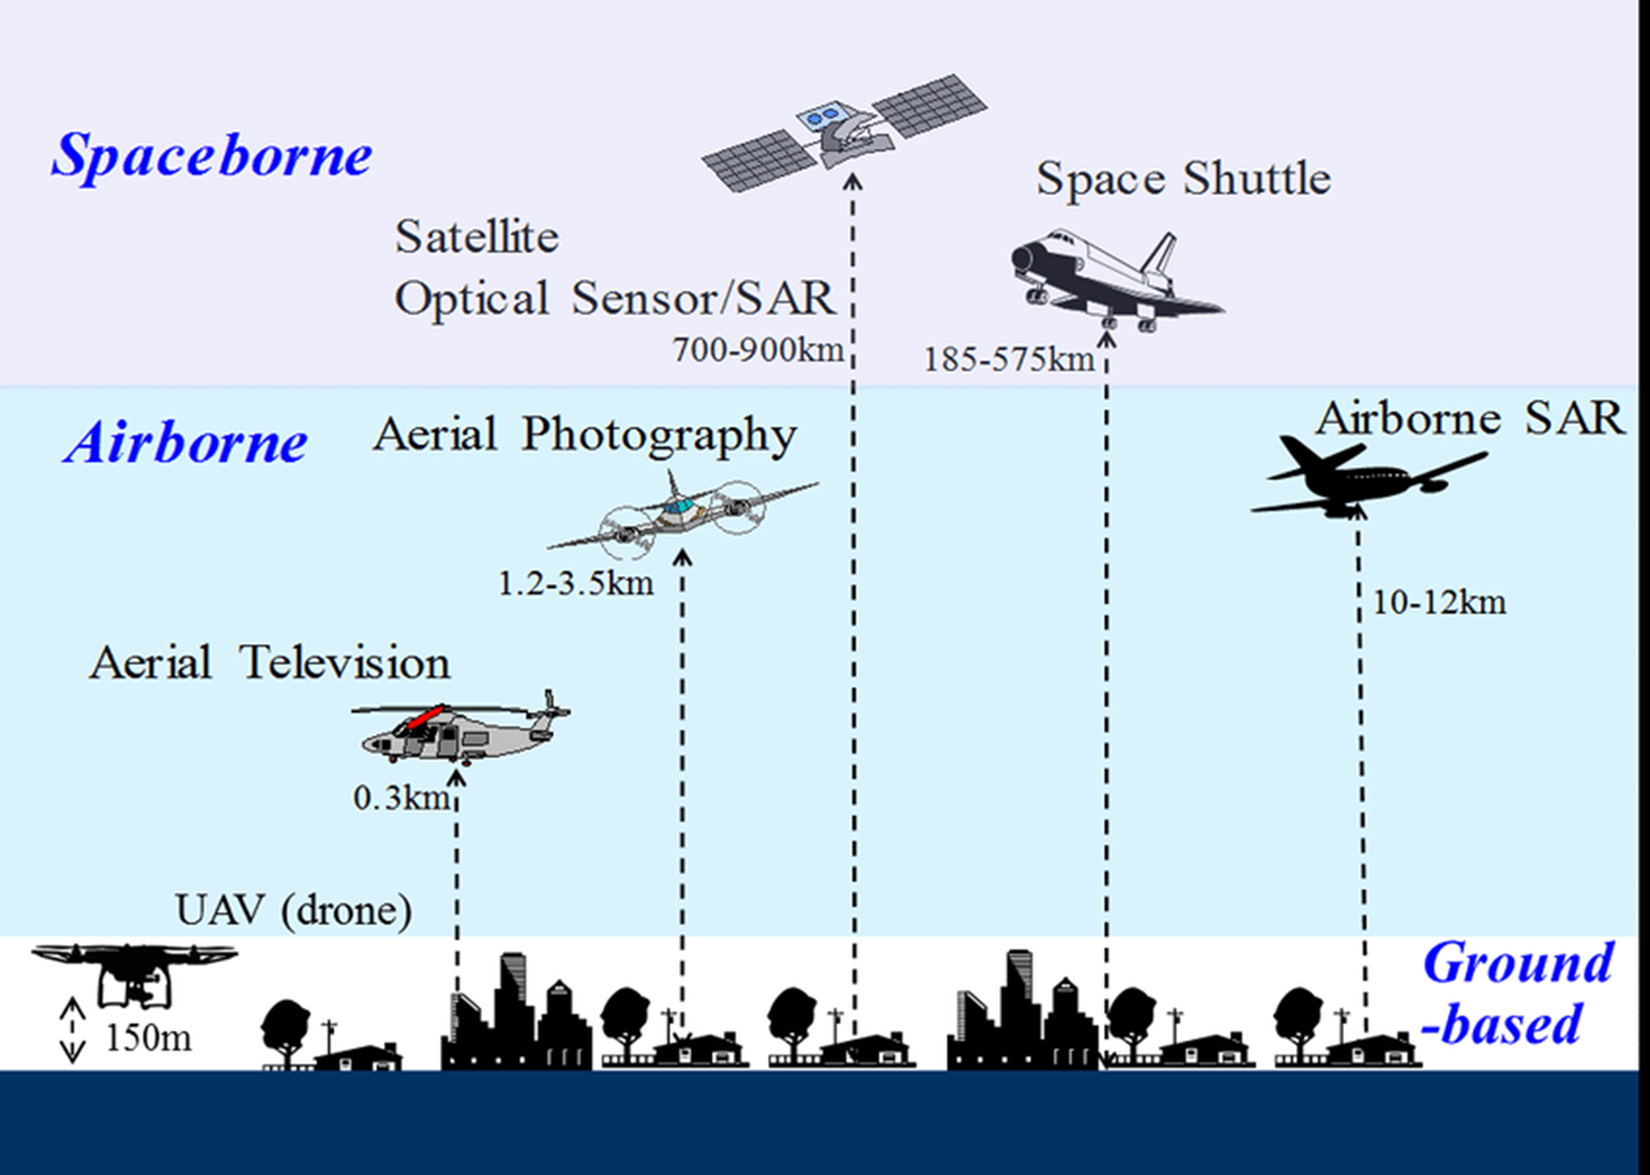
We begin this article with a brief overview of airborne remote sensing in archaeology before moving on to highlight recent use cases of satellite imagery as archaeological practice in the South Caucasus. Broadly speaking, archaeological remote sensing incorporates a class of prospecting methods that employs terrestrial, airborne, or spaceborne sensors to detect archaeological features by their physical, chemical, or magnetic properties (Figure 1). The technology has come a long way since the Royal Engineers’ Balloon Section captured the first aerial photos of Stonehenge in 1906, and further still since the pilot and photographer Mary Bailey pushed the boundaries of both technology and gender in documenting the presence of Roman settlements in Egypt's Kharga Oasis from the air (Caton-Thompson Reference Caton-Thompson1931). Since its earliest days, archaeologists have been quick to grasp the extraordinary power of aerial imaging to aid in the discovery and interpretation of archaeological sites through its ability to reveal traces of ancient human occupation via subtle landscape features, such as crop marks or shadow marks, only visible when viewed from above (Crawford Reference Crawford1923).Footnote 1
Common aerial and satellite remote-sensing platforms (adapted from Yamazaki and Liu Reference Yamazaki and Liu2016:Figure 1ss).
With advances in orbital space flight during the Cold War, the United States National Reconnaissance Office developed a series of classified “Keyhole” (KH) spaceborne optical imaging satellites for intelligence gathering purposes, beginning with several generations of CORONA spy satellites (KH-1—KH-4B, 1960–1972; United States Geological Survey [USGS], Earth Resources Observation and Science [EROS] Center 2018a) and the successive HEXAGON and GAMBIT satellites (USGS EROS 2018a, 2018b). Over the history of the program, the CORONA satellites generated a massive archive of black-and-white scenes spanning much of the globe and comprising the first high-resolution (up to ~2 m) stereo images of the Earth's surface.
Since they were declassified by the US government in 1995, CORONA images have played an important role in the study of historic landscapes, particularly in the Near East (Alizadeh and Ur Reference Alizadeh and Ur2007; Casana Reference Casana2020; Parcak et al. Reference Parcak, Mumford and Childs2017; Ur Reference Ur2003). Prior to the declassification and dissemination of high-resolution spy imagery, however, archaeologists began exploiting the advantages of emerging Earth-observation satellites. With the advent of multispectral imaging under the Landsat satellite program in 1972, spaceborne remote sensing platforms produced a series of breakthroughs in spatial, radiometric, and spectral resolution that have been a boon to archaeological reconnaissance, given that chemical, physical, and biological alterations in soils overlying archaeological sites create variation in spectral reflectance (i.e., anomalies) in bandwidths outside the visible parts of the electromagnetic spectrum (Agapiou Reference Agapiou2017; Luo et al. Reference Luo, Wang, Guo, Lasaponara, Zong, Masini and Wang2019). Recent generations of high-resolution (HR; 5–30 m resolution) and very high-resolution (VHR; <5 m resolution) imaging platforms—including IKONOS, QuickBird, WorldView, and Pléiades—have achieved submeter ground sampling distance with a spectral range of 400–1,000 nm (Lasaponara et al. Reference Lasaponara, Leucci, Masini, Persico and Scardozzi2016; Luo et al. Reference Luo, Wang, Guo, Lasaponara, Zong, Masini and Wang2019; Opitz and Herrmann Reference Opitz and Herrmann2018).
The new generation of spaceborne sensors is producing nearly continuous streams of imagery to satellite data centers totaling several terabytes per day (Agapiou Reference Agapiou2017:86). The current Landsat 7 ETM+ and 8 LDSM satellites collect about 1,200 scenes each day, or about 1 TB/day of data (Rocchio and Campbell Reference Rocchio and Campbell2016). The Sentinel-2 A and B satellites (launched by the European Space Agency in 2015 and 2017, respectively, as part of the Copernicus program) are collecting about 1.5 TB/day, or over 400 TB/year (European Space Agency 2023). Consequently, petabytes of new and archived datasets have stimulated heritage researchers to steer the application of data products and interpretive techniques originally designed for climate and Earth observation toward archaeological research questions. Spectral imaging data are therefore becoming essential tools in prospection, land classification, and heritage monitoring.
The most recent addition to the archaeological tool kit are unmanned aerial vehicles (UAVs, or drones) that can provide archaeologists with affordable and relatively easy-to-use platforms for collecting high-resolution, true-color, multispectral light detection and ranging (lidar) photogrammetric data, and for video capture, which have rapidly become common means for digital site mapping and recording (e.g., Campana Reference Campana2017; Casana et al. Reference Casana, Wiewel, Cool, Hill, Fisher and Laugier2017; Chase et al. Reference Chase, Chase, Awe, Weishampel, Iannone, Moyes, Yaeger and Kathryn Brown2014; Earley-Spadoni et al. Reference Earley-Spadoni, Petrosyan and Gasparyan2019; Erb-Satullo et al. Reference Erb-Satullo, Jachvliani, Kalayci, Puturidze and Simon2019; Herrmann and Hammer Reference Herrmann and Hammer2019; McLeester et al. Reference McLeester, Casana, Schurr, Hill and Wheeler2018; Wernke et al. Reference Wernke, Hernández, Marcone, Oré, Rodriguez, Traslaviña, Averett, Gordon and Counts2016).
In sum, available declassified Cold War–era reconnaissance images, in addition to very high-resolution (<1 m) commercial satellite data (e.g., Maxar WorldView, Planet SkySat), high- to medium-resolution noncommercial products from Sentinel (10 m) and PlanetScope (3 m) platforms, and the rising popularity of affordable UAV technologies, have combined to provide a flood of data-rich 2D and 3D products—georeferenced orthoimagery, digital elevation models (DEMs), and lidar data—that are rapidly transforming archaeological research and heritage management (Bennet et al. Reference Bennett, Cowley and De Laet2014; Opitz and Hermann Reference Opitz and Herrmann2018). In turn, archaeological remote sensing has emerged as a full-fledged disciplinary specialization, fostered in Europe and North American by the growth of university-level courses, dedicated sessions at international conferences, and specialty journals and edited volumes (e.g., Comer and Harrower Reference Comer and Harrower2013; Forte and Campana Reference Forte and Campana2017; Hadjimitsis et al. Reference Hadjimitsis, Themistocleous, Cuca, Agapiou, Lysandrou, Lasaponara, Masini and Schreier2020; Kamermans et al. Reference Kamermans, Gojda and Posluschney2014; Parcak Reference Parcak2009) focusing on the collection, processing, and interpretation of remote-sensing data products.
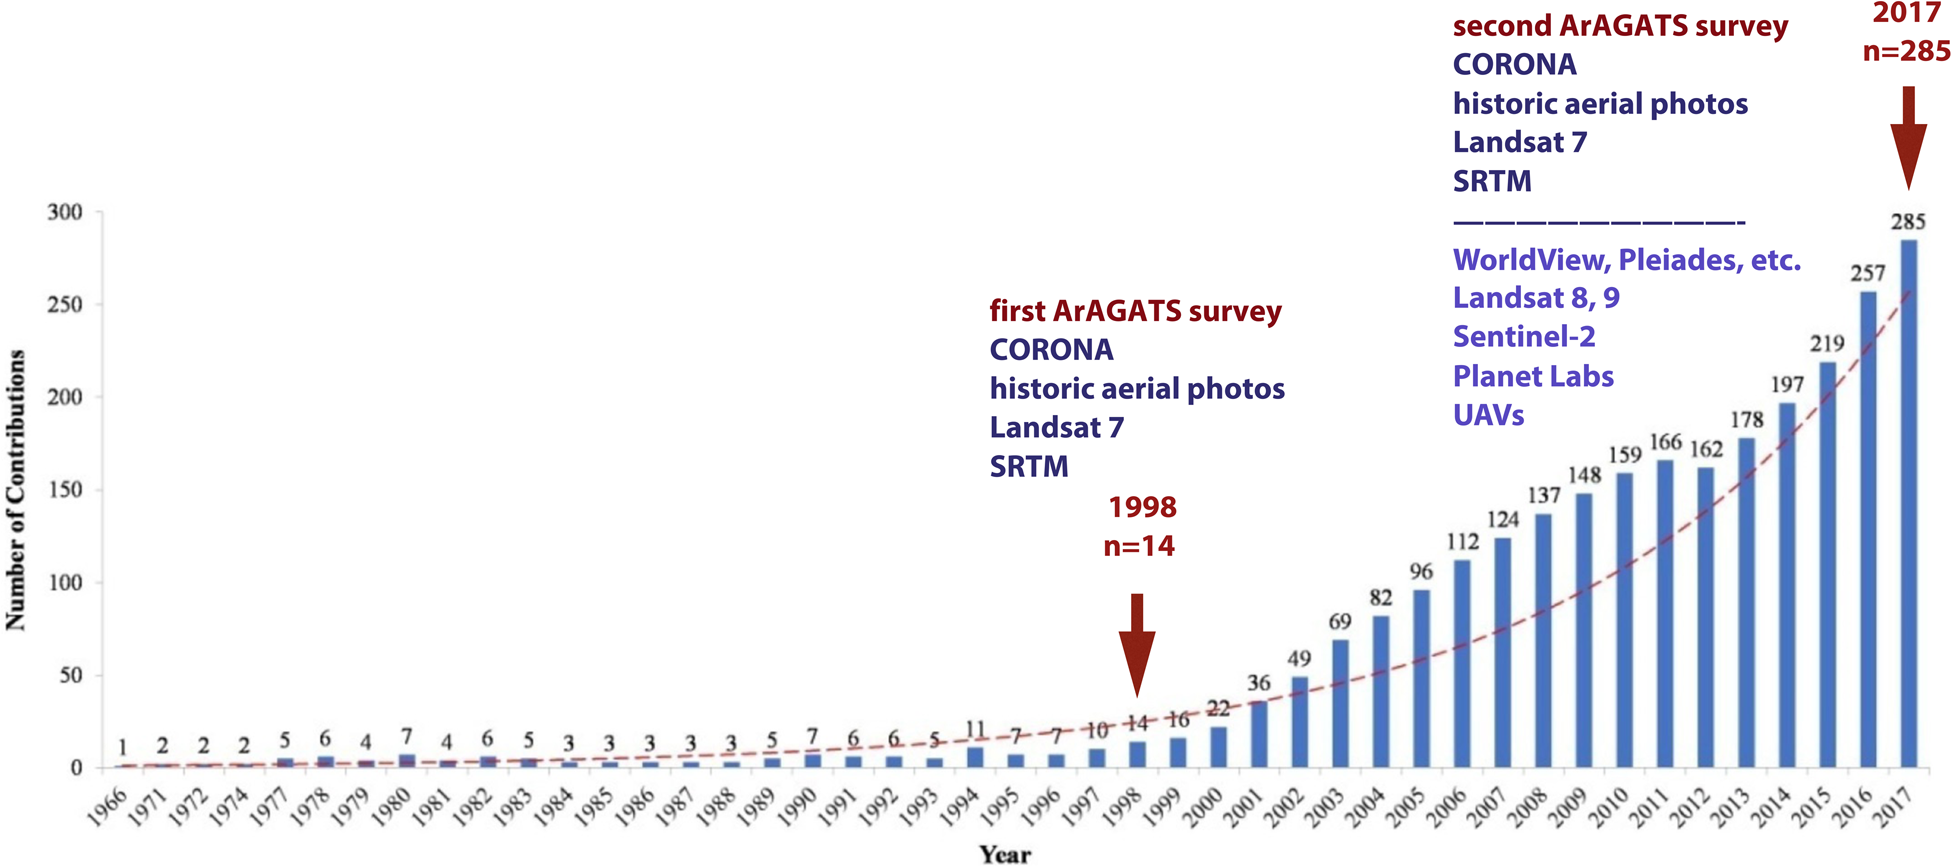
Illustrating the rapid growth of the archaeological remote-sensing literature, in 1998—a year in which only 14 peer-reviewed articles on archaeological remote sensing were published— Landsat 7 and assorted historical air photos were the primary imaging datasets available to Project ArAGATS's initial settlement survey of Armenia's Tsaghkahovit Plain. By contrast, our most recent survey of the upper Kasakh Valley in 2017 was aided by a host of geospatial tools, such as Pléiades-1, PlanetScope, Google Earth, CORONA, and drone-derived imagery (Lindsay et al. Reference Lindsay, Greene, Marshall, Badalyan, Cromartie, Azatyan, Aghikyan, Mkrtchyan and Smith2022), in a year that saw 285 archaeological remote-sensing articles published, a 20-fold increase over the span of our project's history (Figure 2; for overviews of recent publishing trends in archaeological remote sensing, see Adamopoulos and Rinaudo Reference Adamopoulos and Rinaudo2020; Luo et al. Reference Luo, Wang, Guo, Lasaponara, Zong, Masini and Wang2019).
Trends in the number of peer-reviewed articles covering the use of airborne and spaceborne remote-sensing methods in Anglophone cultural heritage literature, illustrating the rising importance of these technologies in archaeology around 1997 along with their use by Project ArAGATS (adapted from Luo et al. Reference Luo, Wang, Guo, Lasaponara, Zong, Masini and Wang2019:Figure 2).
In particular, a growing volume of data is free for noncommercial use and is of sufficient quality and resolution for many archaeological applications. Below, we highlight several of the more popular and affordable resources available for archaeological research, and we discuss some examples of projects already employing them in the South Caucasus, including from Project ArAGATS's recent Kasakh Valley Archaeological Survey (KVAS).
LOW-COST REMOTE SENSING DATASETS AND ARCHAEOLOGICAL APPLICATIONS
In this section, we provide a more detailed review of options for publicly accessible imaging platforms that have proven useful in archaeological research contexts, followed by examples of how some of these datasets have been recently incorporated by projects in the South Caucasus. As noted above, archaeology projects have long benefited from free Landsat imagery, and it remains a useful and cost-effective resource in the Caucasus (Hopper et al. Reference Hopper, Rova and Kvavadze2022; Petrosyan et al. Reference Petrosyan, Azizbekyan, Gasparyan, Dan, Bobokhyan and Amiryan2021) and elsewhere (Agapiou Reference Agapiou2017) for identifying multitemporal changes to the landscape. In what follows, therefore, we focus on more recently available, higher-resolution data sources that are becoming integral for site discovery and monitoring workflows.
Google Earth
Perhaps the most frequent gateways to archaeological remote-sensing, virtual globe platforms such as Google Earth, NASA's WorldWind, and Microsoft's Bing Maps provide free access to select commercial imagery and 3D views of the Earth, as well as simple tools to communicate and share data between international collaborators and with broader publics. Of these tools, Google Earth is the most widely accessible and popular (for a recent overview of Google Earth in archaeological research and heritage management contexts, see Luo et al. Reference Luo, Wang, Guo, Lasaponara, Shi, Bachagha and Li2018). The Pro version of Google Earth, with extended geospatial and sharing capabilities, has been available at no cost since 2015—meaning that Google Earth is the main point of entry to very high-resolution datasets for many projects.
The trade-off for its low cost and ease of use is the lack of real analytical capabilities, although in most cases, transferring data points from Google Earth to more robust GIS software packages such as QGIS or ArcGIS is straightforward.Footnote 2 In addition, relying as it does on the largesse of commercial sources such as Maxar, Google Earth suffers from inconsistent frequency of imagery updates in certain parts of the world—including the Caucasus—making it less suitable for time-series analysis or seasonal land-cover characterizations of archaeological landscapes. For example, in Project ArAGATS's recent survey area of the upper Kasakh Valley in Armenia, we found that Google Earth imagery was limited to capture dates of May 29, 2020; August 23, 2019; August 30, 2017; March 25, 2011; and August 28, 2010, providing a spotty view of seasonal change within our study area.
Moreover, despite its inconsistent coverage, Google Earth provides something of a “global panopticon” where users have unfettered virtual access to private or sacred lands usually off-limits to archaeologists. This has given rise to ethical questions of privacy as well as the security and sovereignty of archaeological data, all of which demand thoughtful consideration by archaeologists using these increasingly ubiquitous geospatial technologies (Caraher Reference Caraher, Averett, Gordon and Counts2016; Davis et al. Reference Davis, Buffa, Rasolondrainy, Creswell, Anyanwu, Ibirogba and Randolph2021; Kansa and Kansa Reference Kansa and Kansa2021; Lindsay et al. Reference Lindsay, Rubinson, Greene, Hammer and Lawrence2018; Myers Reference Myers2010; Opitz and Herrmann Reference Opitz and Herrmann2018; Petrosyan et al. Reference Petrosyan, Azizbekyan, Gasparyan, Dan, Bobokhyan and Amiryan2021; Pollock Reference Pollock2016; Ur Reference Ur2006; VanValkenburgh and Dufton Reference VanValkenburgh and Andrew Dufton2020).
Declassified CORONA and Related Reconnaissance Imagery
The CORONA program (1960–1972) was the United States' earliest photo reconnaissance satellite program. The program produced over 860,000 black-and-white images, which were declassified by the Clinton administration in 1995. The highest-resolution CORONA images, produced by the KH-4B series of satellites between 1967 and 1972, were collected by a panoramic camera on long, narrow film strips, each covering a land area of about 8.6 × 117 km. High-resolution scans of original CORONA negatives are available to download from the USGS EarthExplorer website for free at a maximum resolution of 3600 dpi (7μm), or for $30 per frame for scenes that require a new scan (many, but not all, of the archived negatives have been scanned for download)Footnote 3 (Figure 3; Table 1). By the early 2000s, archaeologists were taking advantage of the rich potential of high-resolution CORONA images—particularly in the relatively flat terrain of the Near East—to identify archaeological sites and ancient landscape features (e.g., urban tell sites and irrigation canals) now obscured or destroyed by recent industrialization, urban expansion, and agricultural intensification (Alizadeh and Ur Reference Alizadeh and Ur2007; Casana Reference Casana2014; Casana and Cothren Reference Casana, Cothren, Comer and Harrower2013; Gheyle et al. Reference Gheyle, Trommelmans, Bourgeois, Goossens, Bourgeois, De Wulf and Willems2004; Hammer Reference Hammer2019; Philip et al. Reference Philip, Donoghue, Beck and Galiatsatos2002; Pournelle Reference Pournelle and Stone2007; Stone Reference Stone2014; Ur Reference Ur2013).
Screenshot of the USGS EarthExplorer platform with red boxes showing example search results for CORONA imagery, filtered to exclude winter months with greater snow cover. The highlighted download button indicates that the image is available for free download but still requires georeferencing.
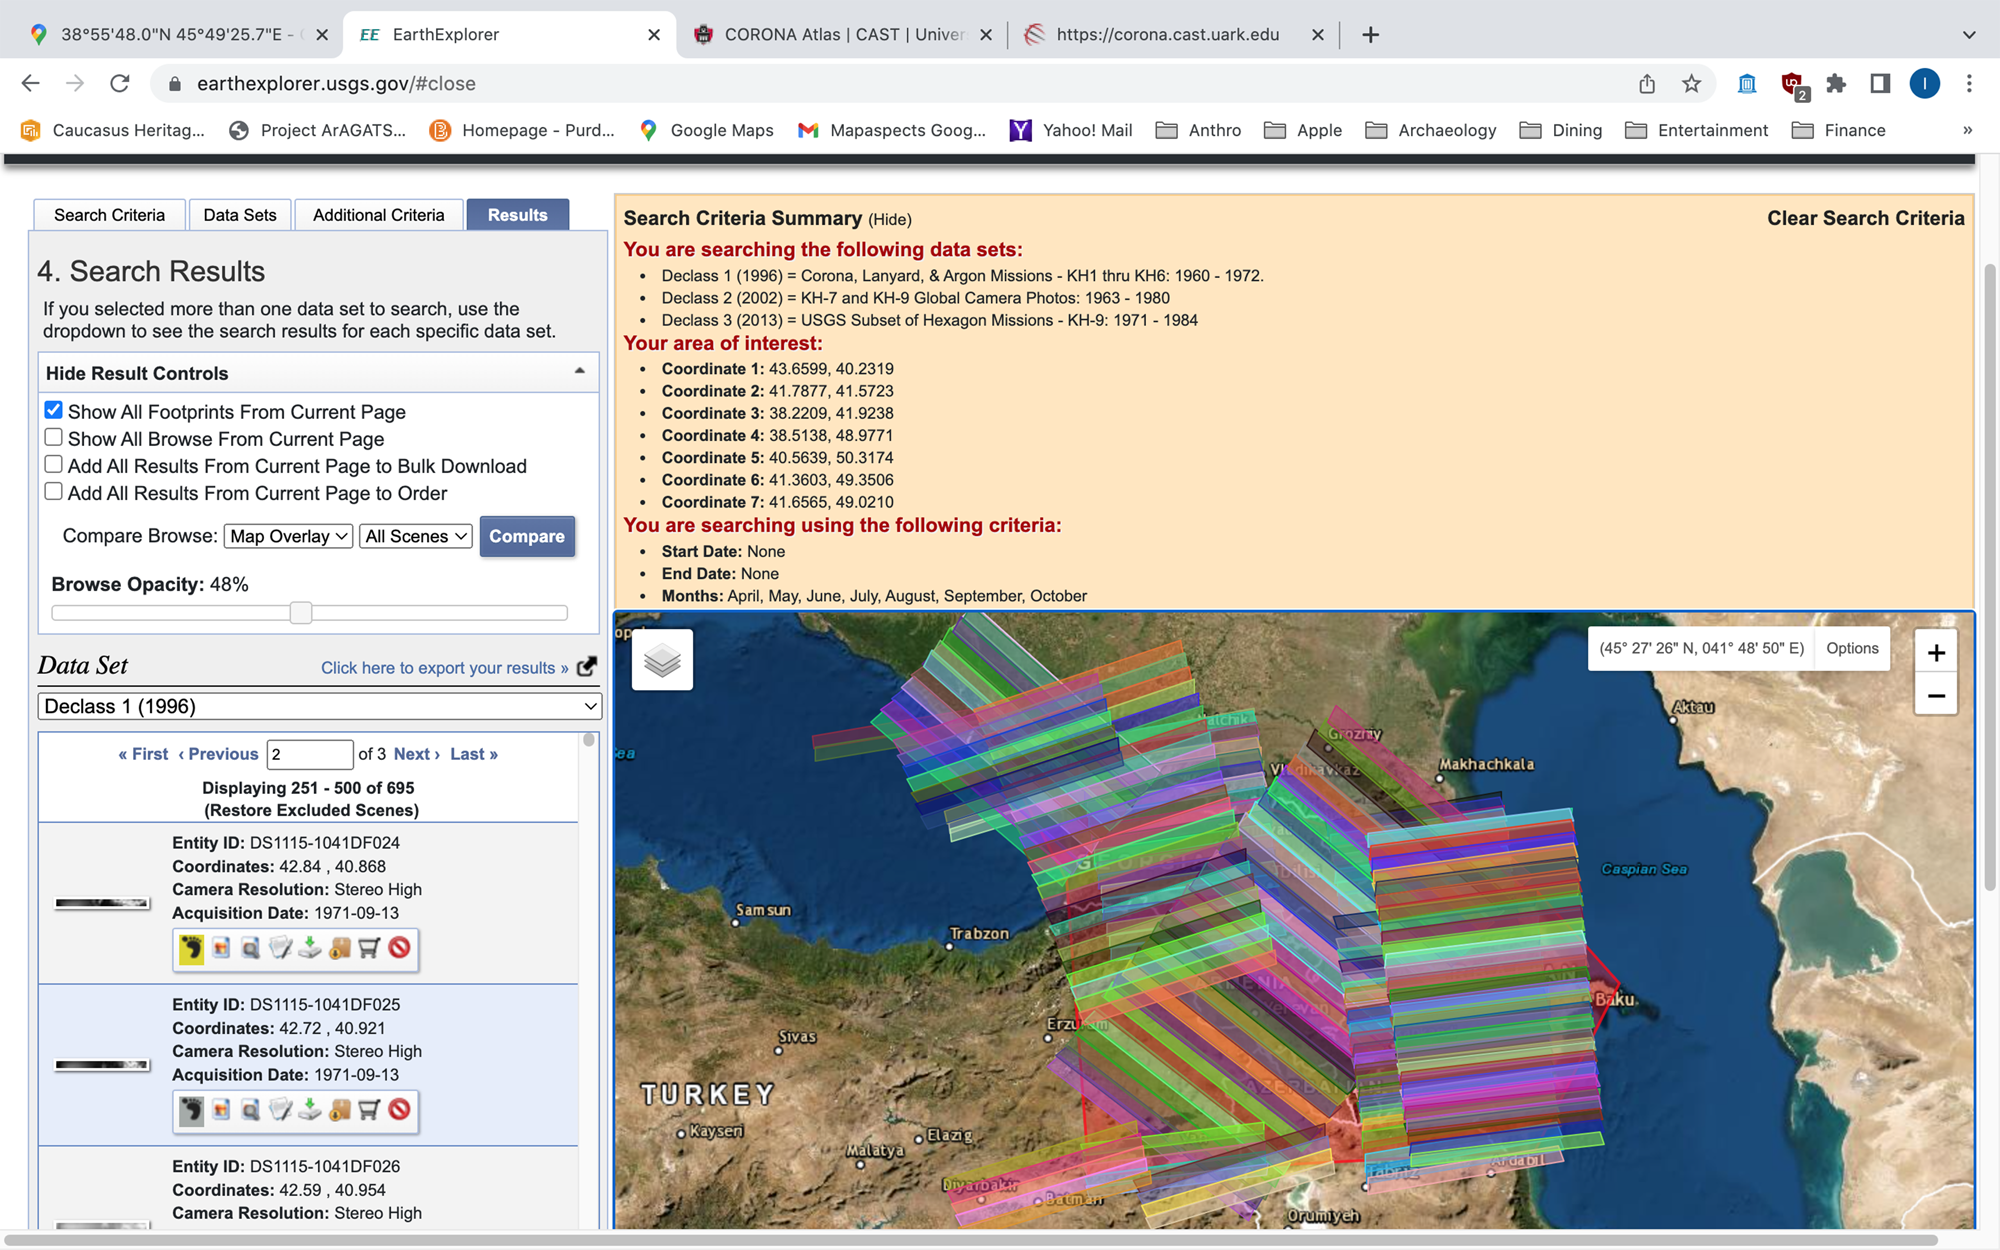
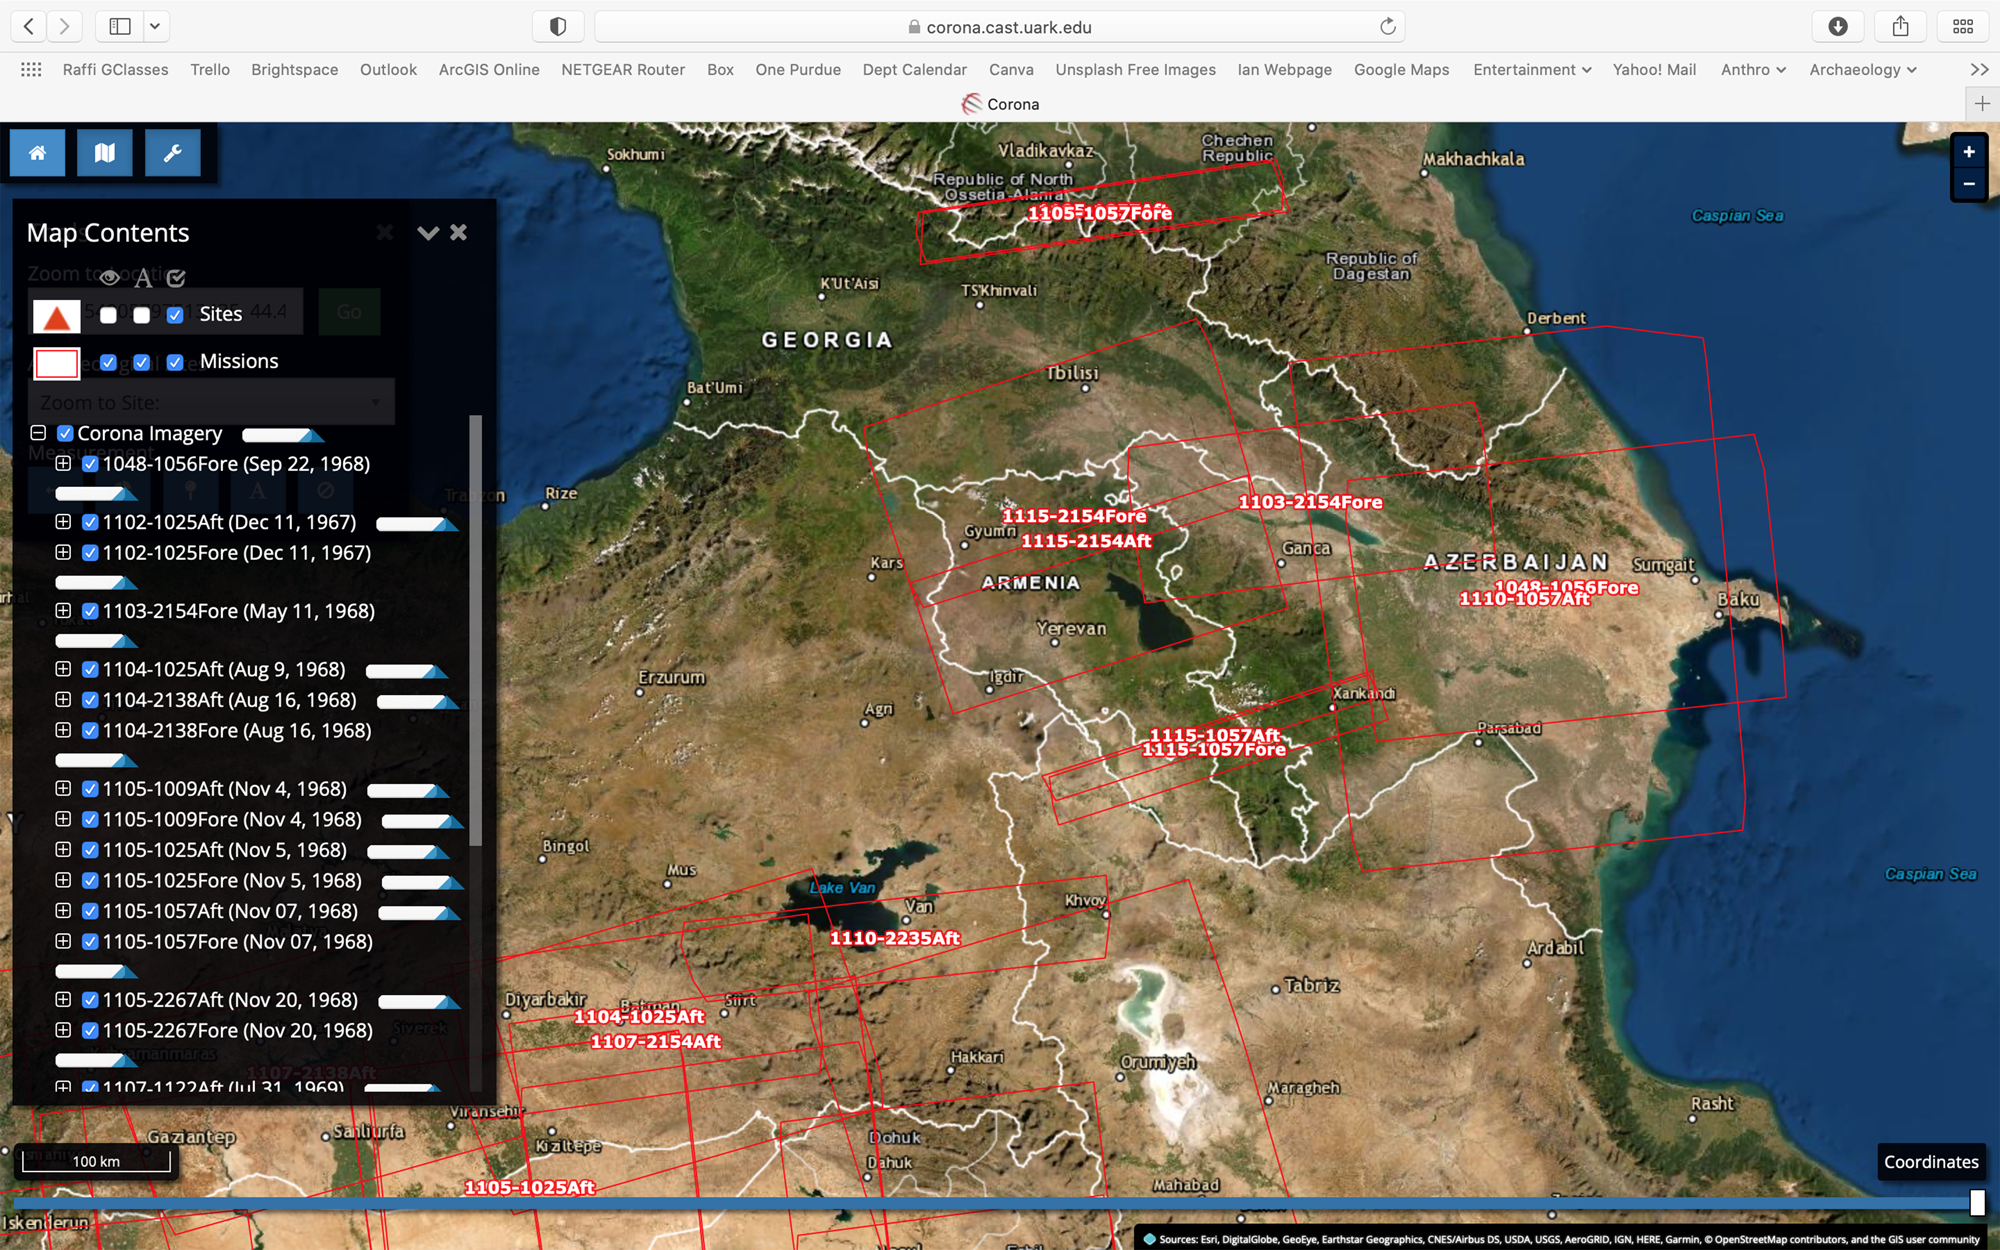
Although the low cost, wide geographic coverage, and high spatial resolution of CORONA images make them uniquely valuable to archaeologists, analysts have noted several technical challenges to their use. First, because the CORONA images are taken in long strips, the images are divided into four segments downloaded as separate files that must be reassembled photogrammetrically. Second, raw CORONA images contain severe geometric distortion due to the panoramic scope of the on-board cameras (Casana and Cothren Reference Casana, Cothren, Comer and Harrower2013) and the lack of embedded geospatial positioning data; this is particularly problematic in regions with high topographic relief—such as the Caucuses—and where 2D techniques for correcting geometric distortion (i.e., “rubber-sheeting”) are less than ideal (Reinhold et al. Reference Reinhold, Belinskiy and Korobov2016). To mitigate the latter challenge, the CORONA Atlas and Sunspot programs at the University of Arkansas (https://cast.uark.edu/research/corona.php) have made significant strides in automating the rectification procedures for CORONA images, and they maintain an interactive web map for downloading previously georeferenced scenes free of charge. This makes the CORONA Atlas a good first place to look for previously georeferenced scenes (Figure 4). And finally, unlike modern land-cover satellites that regularly pass over the same spot on the Earth's surface, coverage of the same area in CORONA imagery may be limited to one or two scenes.
Screenshot showing coverage of georeferenced CORONA imagery in the South Caucasus available for free download from the CORONA Atlas website, developed at the University of Arkansas.
In addition, other Keyhole spy satellites produced products of interest to archaeologists, including the GAMBIT1 KH-7 satellite (1963–1967, declassified in 2002), and the HEXAGON KH-9 satellite system (1971–1984, declassified in 2002 and 2013). Unlike CORONA satellites, which took photos of wide, contiguous areas of land scanning for airfields and missile installations, the GAMBIT system was deployed to take close-up photos of selected targets of strategic interest. As a result, GAMBIT images are a higher resolution (~1 m) than CORONA (~2 m), but the ground coverage is far smaller and discontinuous. In the South Caucasus, for example, GAMBIT images tend to focus on areas of high strategic concern to the West, near major cities such as Tbilisi, Yerevan, Gyumri, and Vanadzor.
The HEXAGON KH-9 spy satellites were launched in the United States as a replacement for the CORONA system and had the same mission of broad geographic coverage to monitor Soviet military capabilities (Fowler Reference Fowler2016; Hammer et al. Reference Hammer, Fitzpatrick and Ur2022). Imagery captured by the HEXAGON's “mapping camera” satellites were moderate resolution (~7–10 m) and declassified in 2002 (USGS EROS 2018b), whereas images from the panoramic “main camera,” declassified in 2013, reached a ground resolution of under 1 m (USGS EROS 2018c). First declassified in 2011, this valuable free resource has only been widely accessible for download since 2020 via the USGS EarthExplorer online platform.
Sentinel-2 Satellite Imagery (European Space Agency)
The Sentinel-2 program was launched in 2015 for the purposes of land-cover map production, soils and forestry research, disaster relief management, and other land surface monitoring goals as part of the European Union (EU) and European Space Agency's (ESA) Copernicus Earth observation program.Footnote 4 Since then, the twin Sentinel-2 satellites (2A and 2B) have provided the Earth science and heritage communities with high-resolution, multispectral optical imagery across 13 spectral bands (4 bands at 10 m ground resolution, 6 bands at 20 m, and 3 bands at 60 m) with a short revisit rate of about 5 days (referring to the period between passes over a site). Prior to Sentinel, the highest-resolution true-color imagery available to the public was 15 m pansharpened Landsat-8 data, so the sharper 10 m Sentinel data offers a remarkable improvement. Sentinel imagery has been slower to catch on with archaeologists, largely due to its lower spatial resolution relative to commercial VHR imagery available on Google Earth. Nevertheless, as we discuss further below, despite having a lower spatial resolution than commercial imagery, the high spectral resolution (in the form of multiple band combinations) and high temporal resolution (meaning rapid return rates) of Sentinel-2 imagery carry high potential value for archaeological studies of land cover analysis, site prospection, and monitoring applications.
Sentinel-2 imagery, like CORONA, can be searched and downloaded for free on the USGS Earth Explorer web page or from the Copernicus Open Access Hub (https://scihub.copernicus.eu), a data portal managed by ESA.Footnote 5 Unlike CORONA, however, Sentinel data comes already georeferenced and so requires less preprocessing than the historic imagery. Sentinel-2 data products can be viewed in any GIS software package, or by downloading the free open-source Sentinel Application Platform (SNAP) program available from the ESA website (http://step.esa.int/main/toolboxes/snap/) and selecting the option to install the SNAP Sentinel-2 Toolbox. Making the most of 13 spectral bands may feel overwhelming at first, but several internet resources provide useful rundowns of the different Sentinel bands and “recipes” of useful band combinations that can help reveal vegetation or geologic features (e.g., https://gisgeography.com/sentinel-2-bands-combinations/).Footnote 6 In the process of learning to work with Sentinel band combinations, it can be easier to start combining bands in the visible and NIR ranges (bands 2, 3, 4, and 8) and work out from there.
PlanetScope Satellite Imagery (Planet Labs Inc.)
An even more recent remote-sensing option available to archaeologists (particularly in noncommercial settings) is PlanetScope imagery from Planet Inc.'s constellation of satellites. These satellites have a nearly daily revisit time, producing 4-band (RGB + near-infrared) imagery at a spatial resolution of approximately 3 m; by contrast, Planet's commercial SkySat imagery has a resolution of 50 cm. Like the Sentinel imagery described above, Planet scenes come orthorectified and projected in UTM coordinates. The imagery is accessible through their interactive map interface, “Planet Explorer” (https://www.planet.com/explorer), where users can define a geographic area of interest and specify image search parameters (dates, cloud cover, etc.) in a manner similar to the Copernicus Hub and USGS EarthExplorer portals. Whereas Planet's imaging products are available to commercial users at substantial cost, university-affiliated students, faculty, and researchers can apply for access to PlanetScope imagery for noncommercial use through Planet's Science Program (https://www.planet.com/science/#programs).
In comparing the different satellite datasets above, Planet's 3 m data carries a distinct advantage in spatial resolution over the Sentinal-2 10 m data. On the other hand, the Sentinel-2 sensor captures data across 12 spectral bands instead of 4, allowing for the calculation of a wider array of vegetation indexes and other forms of spectral analysis (Agapiou et al. Reference Agapiou, Alexakis, Sarris and Hadjimitsis2014; Table 1). Unfortunately, neither PlanetScope nor Sentinel datasets have spatial resolutions fine enough for the reliable detection and interpretation of smaller archaeological features visible in, for instance, WorldView-3's submeter commercial imagery; this may account for why Planet and Sentinel have been slower to be adopted by archaeologists more accustomed to accessing very high-resolution scenes on Google Earth. However, in addition to spatial resolution, it is important to keep in mind the spectral and temporal resolutions of imagery platforms, given that each of these traits can bring value to different aspects of an archaeological workflow as we cover further in the next section.
Digital Elevation Models from the Shuttle Radar Topography Mission (SRTM)
Finally, one of the most versatile remotely sensed datasets available to archaeologists at no cost is the digital elevation models (DEMs) produced by space programs such as the Shuttle Radar Topography Mission (STRM). SRTM was an international project in 2000 to collect radar data from the space shuttle Endeavor to generate what is considered by many the most accurate near-global digital topographic dataset of the Earth's land surface (USGS EROS 2018d). The most recent SRTM V3 data model released in 2014 (SRTM 1 Arc-Second Global) has a ground resolution about 30 m per pixel and an absolute vertical accuracy of 16 m. The dataset is divided into individual 1° × 1° tiles that are free to download as georeferenced image files (e.g., GeoTIFF) from the USGS EarthExplorer, Open Topography, and other public sites (see Table 1). The entire South Caucasus region, for instance, is covered by about 30 SRTM tiles.
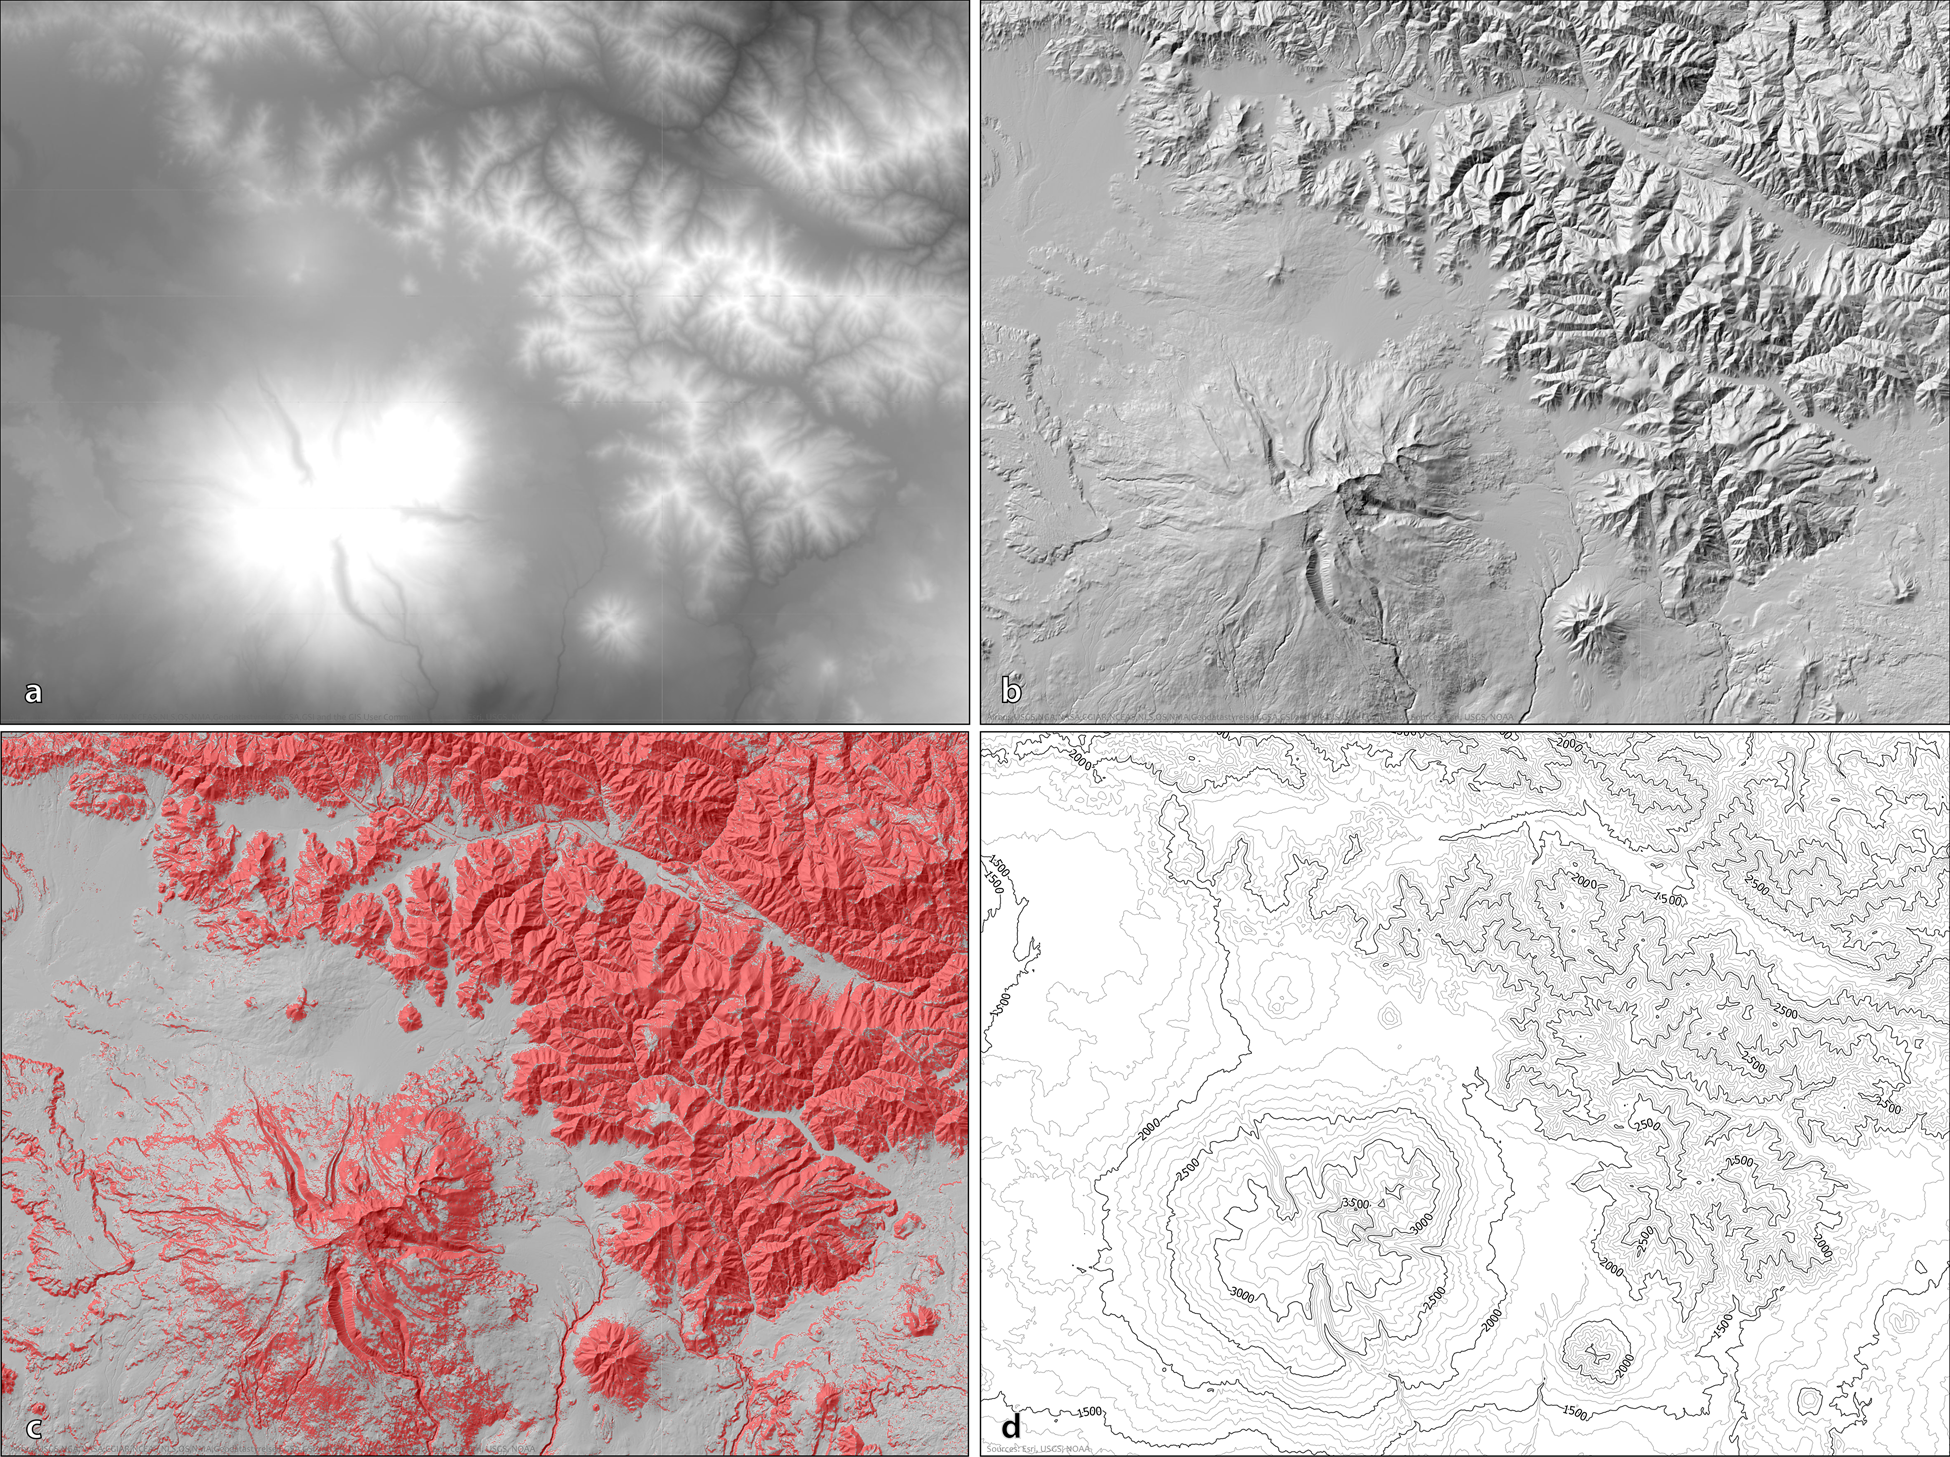
Downloaded files can then be used in remote sensing or GIS software packages. The raw files appear as black-and-white images, with shades of gray in each pixel representing elevation values for that point on the Earth's surface. The vascular lines of high mountains and low river valleys in the raw data resemble a lung X-ray more than usable data, but just a few clicks in a GIS software can generate a variety of derived models useful for analyzing and visualizing the topography of a study area, including hillshade models, slope and aspect calculations, and contour lines (Figure 5). At a much smaller geographic scale—at the site level—similar kinds of data products can now be derived at a much higher resolution using photogrammetric or lidar data collected with UAVs.
Shuttle Radar Topography Mission (SRTM) digital elevation model (DEM) of the Mount Aragats region of Armenia and examples of common elevation products derived from the model using GIS software: (a) raw SRTM DEM data; (b) basic hillshade model created from the DEM; (c) slope calculated as percent from the DEM, symbolized to show slopes greater than 15% in red; (d) contour lines generated from the DEM.
COMMON APPLICATIONS FOR ARCHAEOLOGICAL REMOTE SENSING IN THE SOUTH CAUCASUS
Below, we provide a brief review of three common applications of satellite imagery in archaeological contexts: (a) identifying new sites across broad geographic territories, (b) characterizing the topography and assessing historical variation in land use/landcover of an archaeological landscape, and (c) monitoring the conditions of sites remotely to document impacts of looting, development, conflict, or erosion.
Extensive Survey: Site Discovery And Verification
As Ur (Reference Ur2013:28) has observed, “Regional-scale research demands a regional-scale viewpoint.” We saw earlier that declassified CORONA images, despite the effort required to preprocess the images for use, have been a boon for archaeologists looking for low-cost high-resolution imagery with broad geographic coverage. The ability to identify new sites across large territories has been one of the earliest and most productive archaeological applications of CORONA images in the greater Near East. Jason Ur's (Reference Ur2003, Reference Ur2013) long-term study of declassified satellite images in Syria, Iran, and Iraq pulled back layers of modern agricultural development to reveal “hidden landscapes” of previously undetected pathways, irrigation canals, pastoralist camps, and other off-site landscape features radiating out from and connecting Early Bronze Age urban sites such as Tell-Brak and its neighbors. This uncovered new dimensions to sites that had been studied for decades. These diachronic perspectives open a range of new research questions about the economic ties between ancient cities and their hinterlands, as well as the lived experience of farmers and nomads. But they also help us come to terms with the physical processes of landscape change and their precise impacts on a given site or landscape.
Although CORONAs have found their widest use in the Middle East and North Africa, the use of these images in the Caucasus has been slower to catch on. Reinhold and colleagues (Reference Reinhold, Belinskiy and Korobov2016) and Hopper and colleagues (Reference Hopper, Lawrence, Snape, Chologauri, Priestman, Shumilovskikh, Pitskhelauri, Philip, Sauer, Chologauri, Gabunia, Hopper, Lawrence, MacDonald and Mashkour2020) both discuss the technical challenges of using CORONA images in the high-relief areas of the Caucasus, particularly the pronounced shadows and visual distortions of sites resulting from the mountainous terrain. This is in contrast to the Near East, where mounded tell sites stand out against the low relief of the desert/steppe landscape, and where CORONA images have therefore seen the greatest utility in aerial site prospection.
In spite of these challenges, during the joint Georgian–British investigations of the Dariali Gorge in northern Georgia, Hopper and colleagues (Reference Hopper, Lawrence, Snape, Chologauri, Priestman, Shumilovskikh, Pitskhelauri, Philip, Sauer, Chologauri, Gabunia, Hopper, Lawrence, MacDonald and Mashkour2020) found that pairing CORONAs with commercial WorldView-2 imagery was a useful means of identifying terraced field systems and abandoned settlements. Similarly, Neumann and colleagues (Reference Neumann, Gambashidze, Ricci, Mindiashvili and Gogochuri2018) assembled a productive combination of Landsat, CORONA, GAMBIT, and SRTM digital terrain model datasets, along with historic Soviet-era topographic maps, to identify sites for ground truthing on the Akhalkalaki Plateau as part of a German–Georgian survey in southern Georgia's Javakheti region. They credit the multitemporal and multiscalar satellite data with overcoming some of the ground visibility challenges they faced during pedestrian survey.
In the more level terrain of the Mil Steppe of southwestern Azerbaijan, Ricci and colleagues (Reference Ricci, D'Anna, Lawrence, Helwing and Aliyev2018) note that CORONA imagery formed a “key role” in identifying archaeological sites and landscape features on the German–Azerbaijani Mil Plain Survey project, and as basemaps for visualizing site distributions. And in the similar terrain of the Mughan Steppe near the Iran–Azerbaijan border, Alizadeh and Ur (Reference Alizadeh and Ur2007) found CORONAs equally useful in the early phases of the Mughan Steppe Archaeological Project in identifying Sassanian settlement complexes and canal features marked for on-the-ground investigation.
For extensive survey and site prospection efforts in the Caucasus and elsewhere, Google Earth is often the main source for VHR datasets for archaeology projects. In his 2013–2014 survey of LBA/EIA fortresses in the Kvemo Kartli region of southern Georgia, for example, Erb-Satullo (Reference Erb-Satullo, Anderson, Hopper and Robinson2018) cross-referenced Soviet-era records and site maps of the Mashavera and Debeda River basins with modern Google Earth imagery to relocate legacy sites on the ground for further investigation. Similarly, in assembling potential locations for the classical city of Phasis in the Colchean Lowlands, Naskidashvili (Reference Naskidashvili, Anderson, Hopper and Robinson2018), guided by ancient textual sources and twentieth-century archival research, relied heavily on Google Earth to define areas for intensive pedestrian survey based on the presence of mounds visible in the imagery. Narimanishvili (Reference Narimanishvili2019) found a similar combination of free map services and historical research fruitful in identifying potential LBA/EIA fortifications in Georgia's Javakheti region.
In a recent survey of Armenia's upper Kasakh Valley, Project ArAGATS balanced its systematic transect survey with a program of extensive survey to cover territory prohibitively remote or rugged for transect walking. Manually scanning Google Earth and commercial Pléiades imagery along arable tracts in the Kasakh Valley and the foothills of Mount Aragats and the Tsaghkunyats Range familiarized us with the local surface reflectance associated with various types of fortification, habitation, and mortuary sites. Our discovery and verification of large clusters of Bronze Age kurgan burials in a remote section of the Tsaghkunyats foothills is a good example of this kind of purposive survey strategy of ground truthing and site relocation (Lindsay et al. Reference Lindsay, Greene, Marshall, Badalyan, Cromartie, Azatyan, Aghikyan, Mkrtchyan and Smith2022:Online Figure 3).
To date, uses in the Caucasus of multispectral satellite imagery, such as Landsat, have remained within the confines of the visible (or true color) bands of the EM spectrum, leaving the value of available band combinations relatively unexplored. One of the few projects to make use of multispectral imagery is the Georgian–Italian Lagodekhi Archaeological Project. In their survey of the Alazani Valley in eastern Georgia's Kakheti region, the team relied on an innovative approach to reading the heavily vegetated landscape using band combinations of free multispectral Landsat and Sentinel-2 imagery, informed by three common principles of sensing: (a) vegetation growth rates are altered by underlying archaeological remains; (b) differences in vegetation health and growth rates are most visible in the near-infrared band of the electromagnetic spectrum; and (c) these effects differ over the seasonal growth cycle. In leveraging the frequent return rates of Landsat and Sentinel-2 satellites, the survey team found that anomalies in the forested areas that they interpreted as potential kurgan burials were most visible in autumn imagery and were marked for field verification (Hopper et al. Reference Hopper, Rova and Kvavadze2022).
Assessing Landscape Characteristics and Transformations
In the above survey contexts, where plotting locations of potential sites was a primary goal, the high spatial resolution and affordability were the defining contributions of datasets like CORONA and Google Earth. However, free remote-sensing datasets—such as the global CORINE Land Cover classification layers (Buchhorn et al. Reference Buchhorn, Lesiv, Tsendbazar, Herold, Bertels and Smets2020) and the more recent Sentinel-2 10 m land cover model (Kontgis Reference Kontgis2021)—can also aid in broader characterizations of local ground conditions in a survey landscape, documenting contemporary patterns of land cover/use as well as diachronic alterations to landscapes, both of which are central elements to the initial research design and later interpretive phases of a survey project (see Table 1).
As many archaeologists in the Caucasus have attested (Anderson et al. Reference Anderson, Birkett-Rees, Cleary, Krsmancovic and Tskvitinidze2014; Badalyan and Avetisyan Reference Badalyan and Avetisyan2007; Hammer Reference Hammer2014; Lindsay et al. Reference Lindsay, Greene, Marshall, Badalyan, Cromartie, Azatyan, Aghikyan, Mkrtchyan and Smith2022; Neumann et al. Reference Neumann, Gambashidze, Ricci, Mindiashvili and Gogochuri2018; Smith et al. Reference Smith, Badalyan and Avetisyan2009), Soviet-era amelioration programs of the latter twentieth century—including field clearance, leveling and terraforming, dam construction, irrigation schemes, and managed forest development—led to industrial-scale transformations to landscapes that create perennial challenges for settlement survey. Historic alterations to the terrain and seasonally variable land-cover conditions are two important factors that heavily impact the probabilities of locating archaeological sites, so understanding these processes can help research teams be more efficient in where to focus limited time and resources in a survey area. Here, we review some ways in which remote sensing has been deployed to assess and mitigate the impact of historic landscape transformation on settlement pattern data.
In preparing for their initial 1998 transect survey of the Tsagh kahovit Plain in north-central Armenia, Adam T. Smith and colleagues (Reference Smith, Badalyan and Avetisyan2009)—whose work was among the first published archaeological applications of satellite remote sensing in the South Caucasus—used Landsat, historic air photos, and CORONA images to assess and exclude potential survey quadrants severely impacted by Soviet-era terraforming. In the two decades since, the increased availability of publicly accessibly high-resolution remote-sensing data imagery has enabled more detailed historical landscape analysis and land-cover classifications, which can aid in developing survey strategies that more efficiently target specific survey units for transect walking, in addition to postsurvey analysis of site distributions. Cases of recent field studies below serve to illustrate that historical amelioration activities can vary widely in their scope and intensity, and in their impact on the yield potential of archaeological landscapes.
For example, in his study of the late first-millennium city of Bardha'a (modern Bərdə) in Azerbaijan and its strategic role on the Islamic frontier in the Kura Plain, Wordsworth (Reference Wordsworth, Anderson, Hopper and Robinson2018) used CORONA imagery from 1970 to carry out a historic landscape characterization analysis of the city and its surroundings. Combining textual sources, pedestrian survey, and excavation data with aerial mapping techniques in a GIS environment, Wordsworth's team isolated traces of spatial organization of the historic urban site and its hinterland from Soviet land-use practices prior to the rapid expansion of the town in the 1980s and 1990s. These data reveal shifting river courses, a relict canal, and local land management and boundary systems that appear to have supported a heavier reliance on pastoral production prior to Soviet terraforming and amelioration activities.
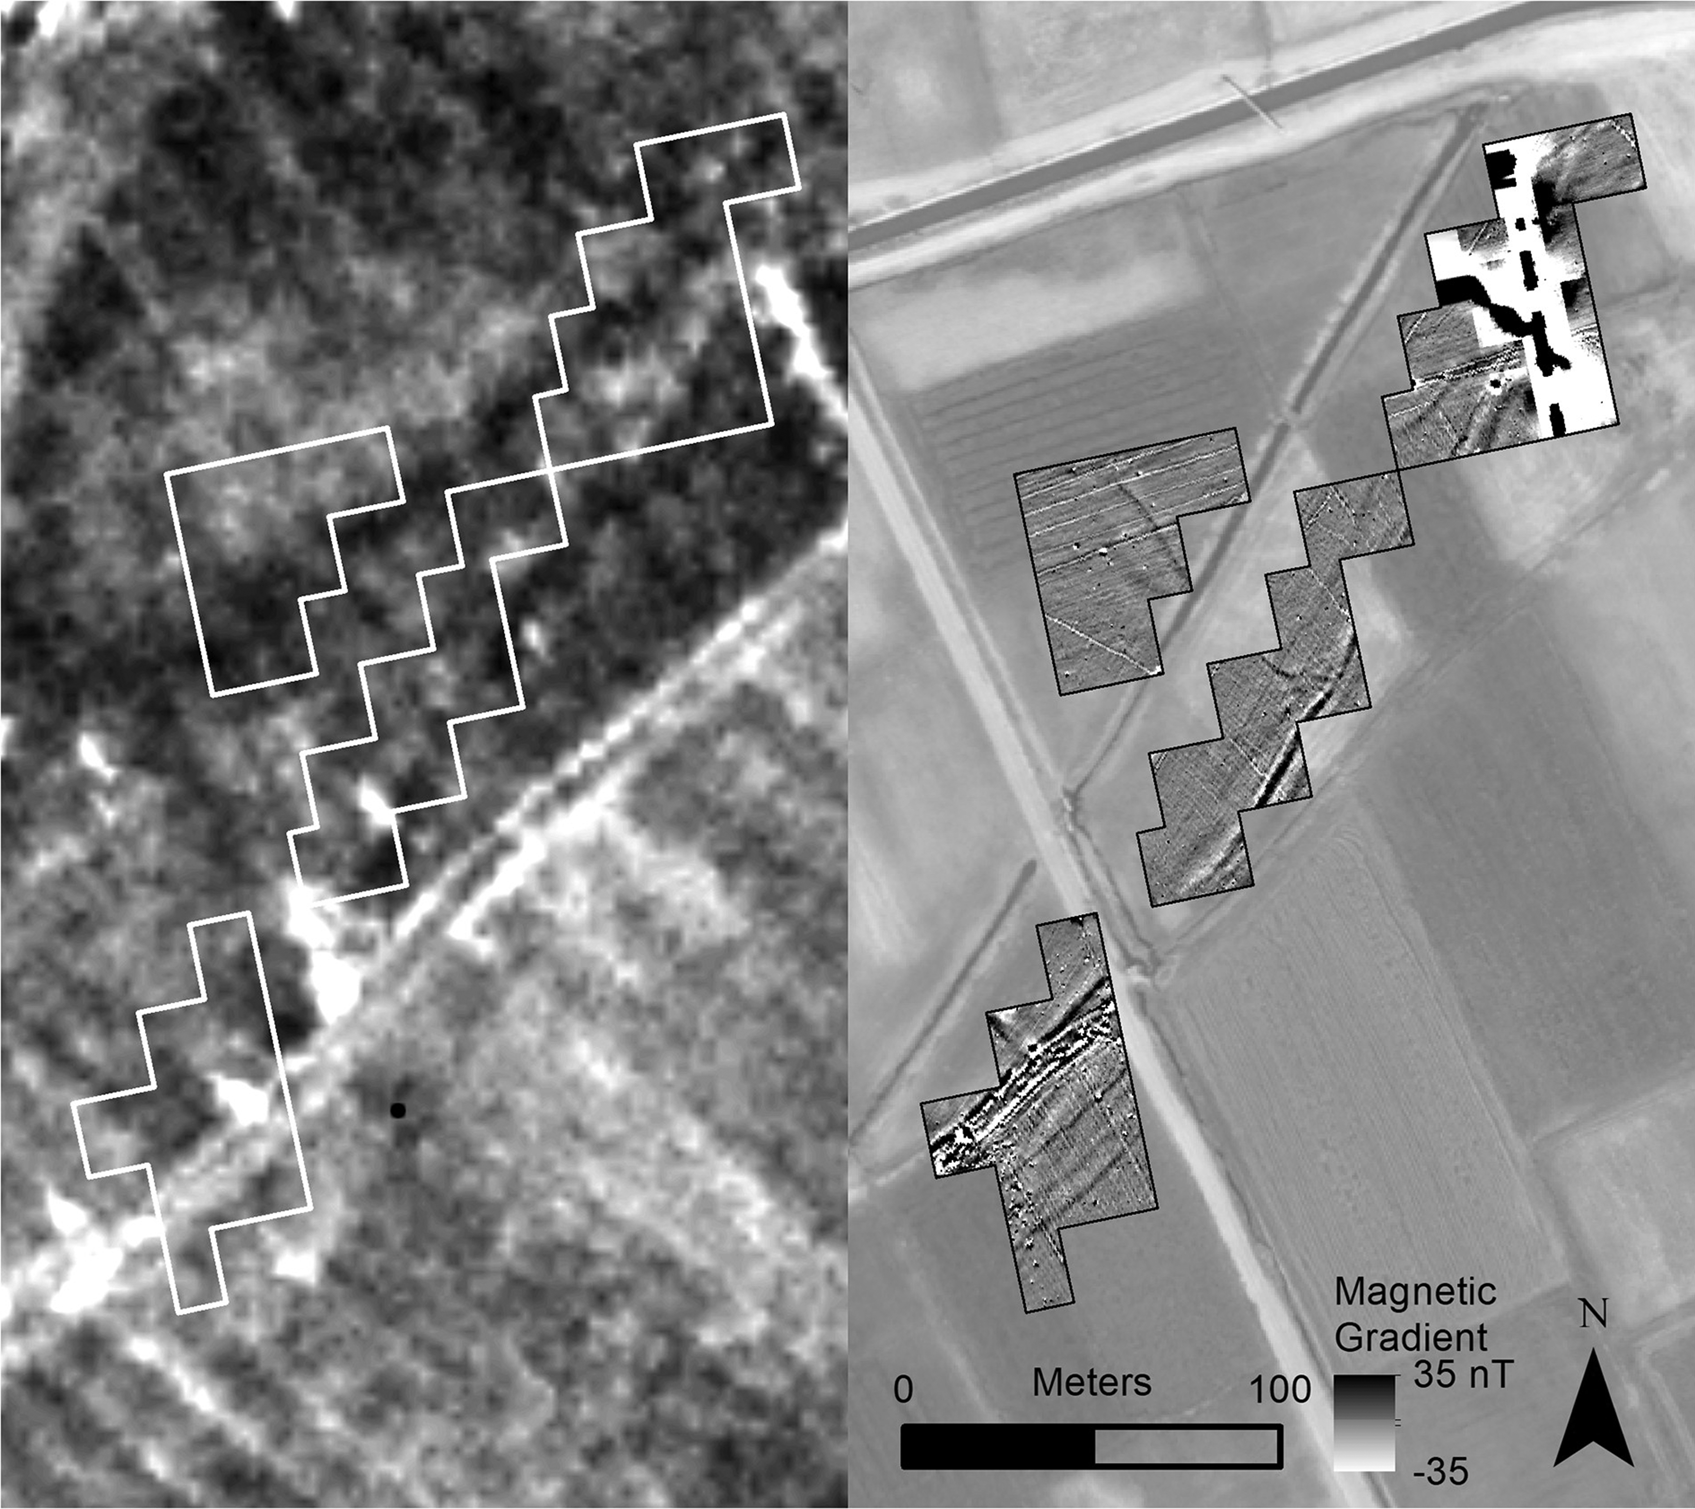
Herrmann and Hammer (Reference Herrmann and Hammer2019) also demonstrate innovative ways of integrating the value of declassified historic imagery as part of a broader remote-sensing tool kit in Hammer's long-term study of the Bronze and Iron Age Oğlanqala-Qızqala complex in Naxçıvan Autonomous Republic (Azerbaijan). They recently used declassified CORONA and HEXAGON imagery of the complex as historical references to cross-check whether anomalies identified during magnetometry and ground-penetrating radar survey, such as canals, were also present in the 1970s imagery (Figure 6). Such a preliminary ground-truthing technique allowed them to “remotely” untangle the palimpsest of linear landscape features while demonstrating the utility of combining aerial and terrestrial remote sensing methods.
Herrmann and Hammer (Reference Hammer2019:Figure 6) used historic CORONA imagery alongside contemporary imagery to help interpret the age of a canal course identified in their magnetic gradiometry survey (reproduced with permission).
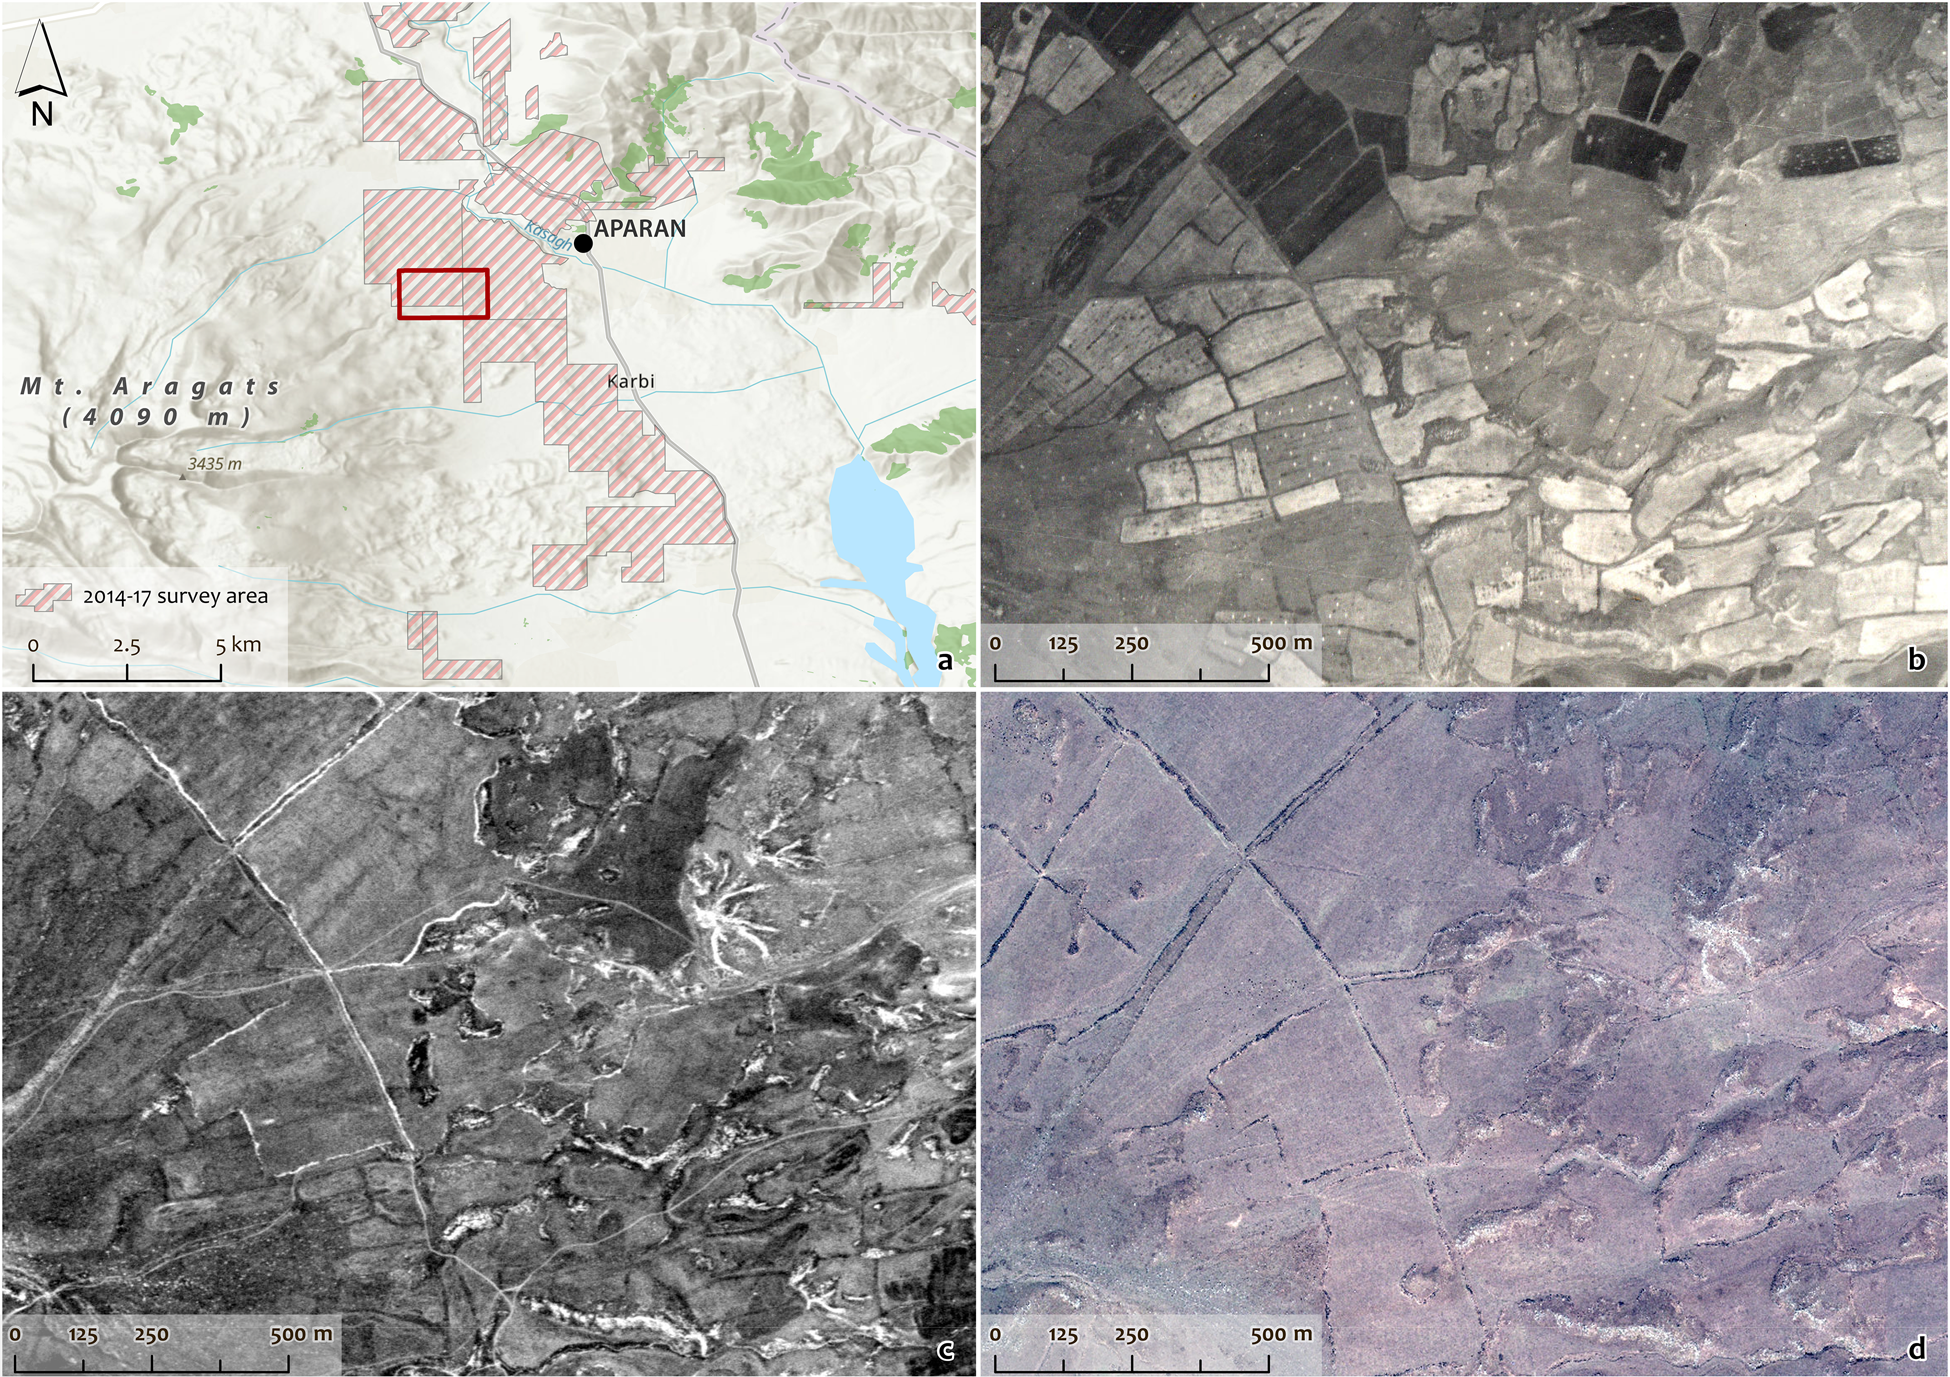
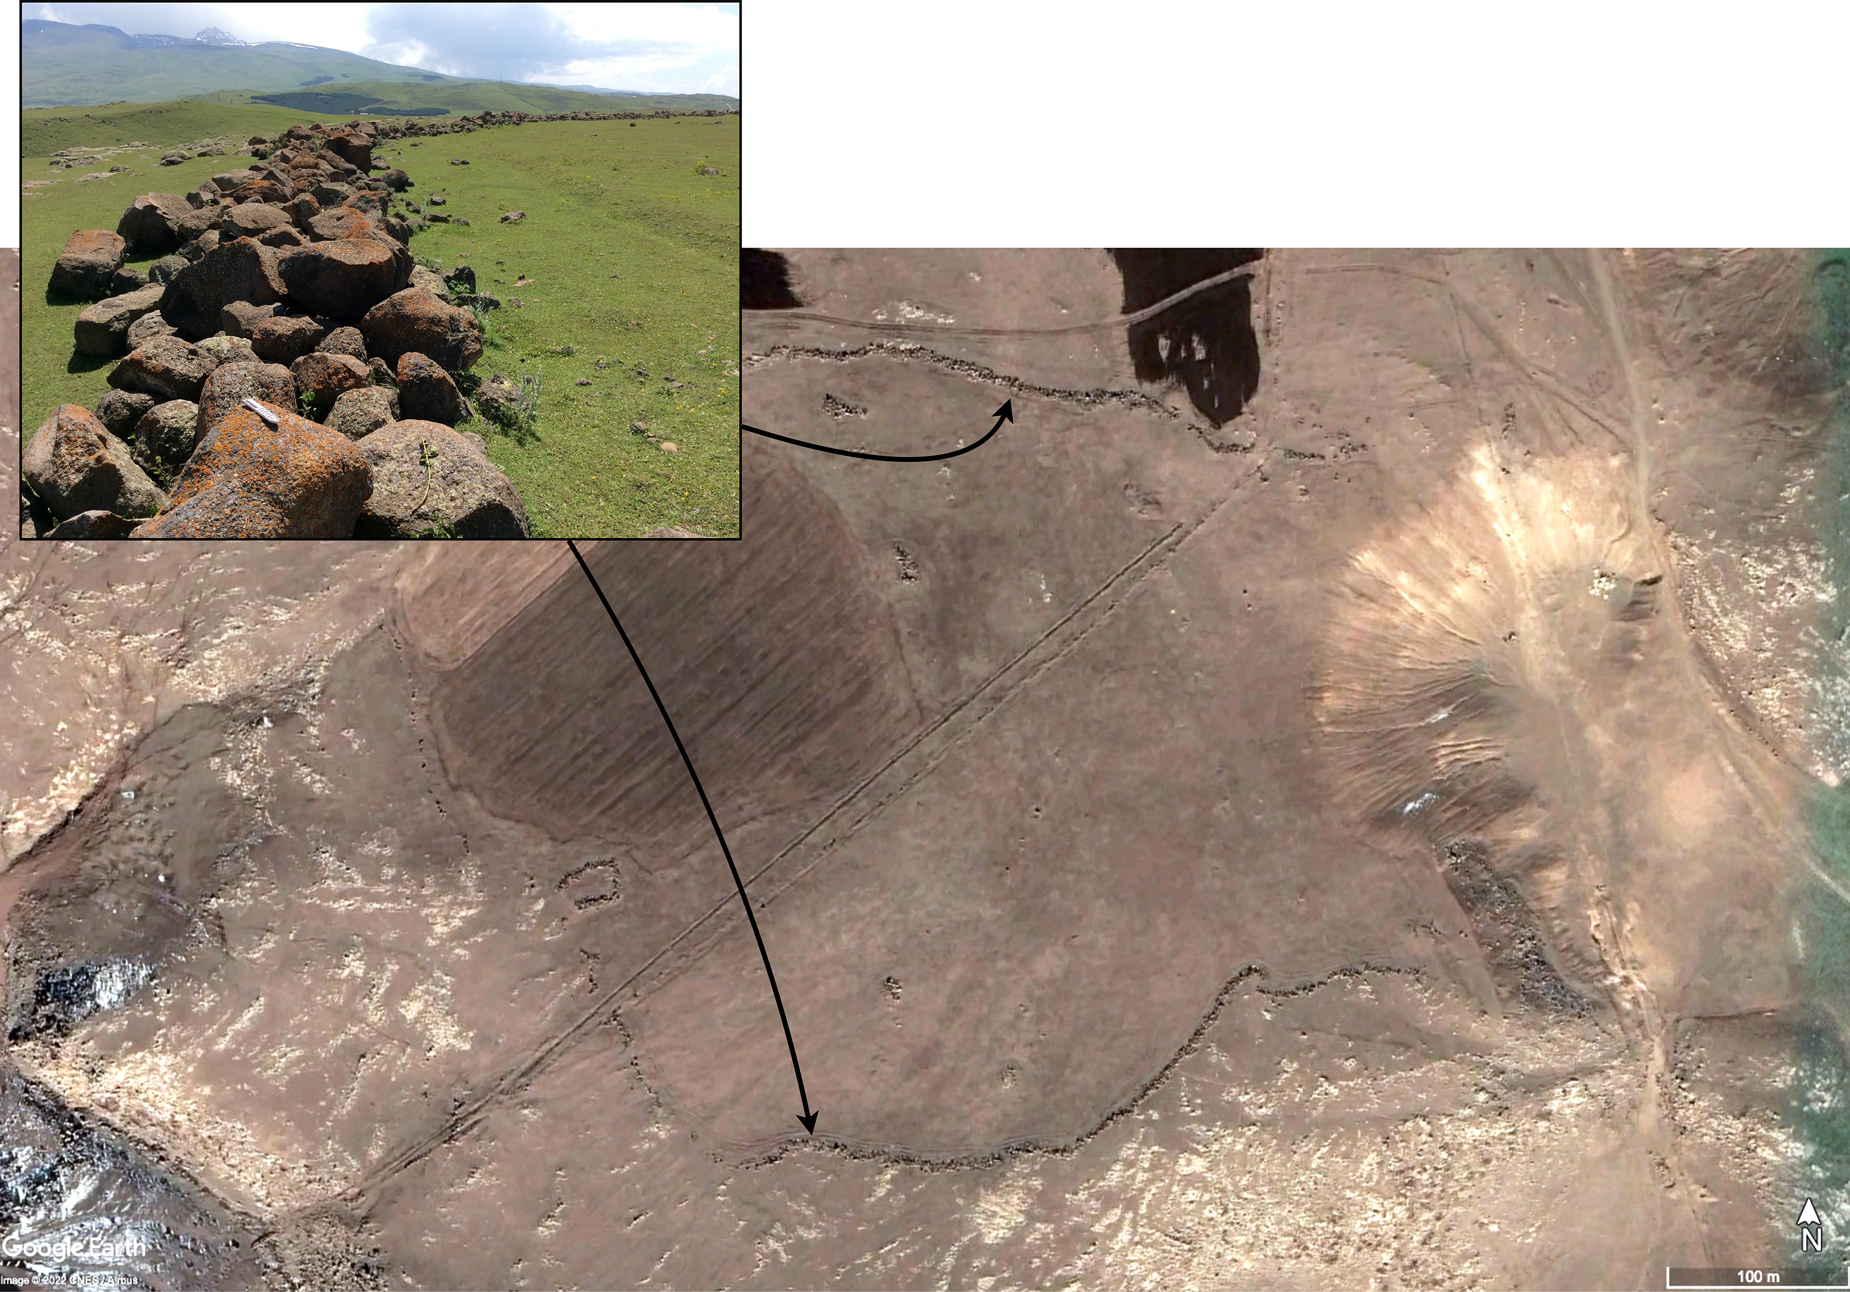
To a surveyor in the South Caucasus, among the most vivid reminders of the Soviet commitment to mechanized agriculture are massive lines of field clearance stones, many stretching several kilometers in length and measuring 1–2 m tall by 3–5 m wide. The stark visibility of field clearance “walls” traceable in Google Earth—paired with historical HEXAGON, CORONA, and Soviet aerial and satellite imagery—make them valuable indexes of historic land use and field management practices traceable in ways that were impossible just a few years ago (Figure 7). In Project ArAGATS's recent survey of Armenia's upper Kasakh River Valley, traces of field clearance activity were encountered in practically every field and pasture—either as variably sized linear accumulations of stones along the boundaries of fields, or as small mounds of cobbles scattered across open fields (Lindsay et al. Reference Lindsay, Greene, Marshall, Badalyan, Cromartie, Azatyan, Aghikyan, Mkrtchyan and Smith2022). The largest clearance walls were concentrated at the base of the Mount Aragats foothills just below the 15% grade, where basalt boulders descending from the Aragats volcano came to rest along the gentler grade of the valley floor and required mechanical interventions (though some lines of clearance boulders were also documented further into the valley near Mirak; Figure 8).
A time-series study of historic and contemporary aerial and satellite images can help trace the evolution of land management systems over the course of the twentieth century and assess their potential impact on archaeological sites. In Project ArAGATS's recent survey area (a) west of Aparan, Armenia, smaller field systems visible in the 1948 air photos (b) were scaled up to larger operations requiring mechanized clearance traceable in the 1970s CORONA imagery (c); the impacts of these amelioration projects remain visible in contemporary Google Earth and commercial satellite data (d) to aid archaeologists in reading the survey landscape.
Large lines of basalt boulders from mechanized field clearance, encountered in Project ArAGATS's survey landscape near the village of Mirak, Armenia, and visible in Google Earth imagery. As seen in Figure 10, several additional lines of boulders are traceable above the Kasakh floodplain just west of Aparan. (Top inset photo credit: Project ArAGATS)
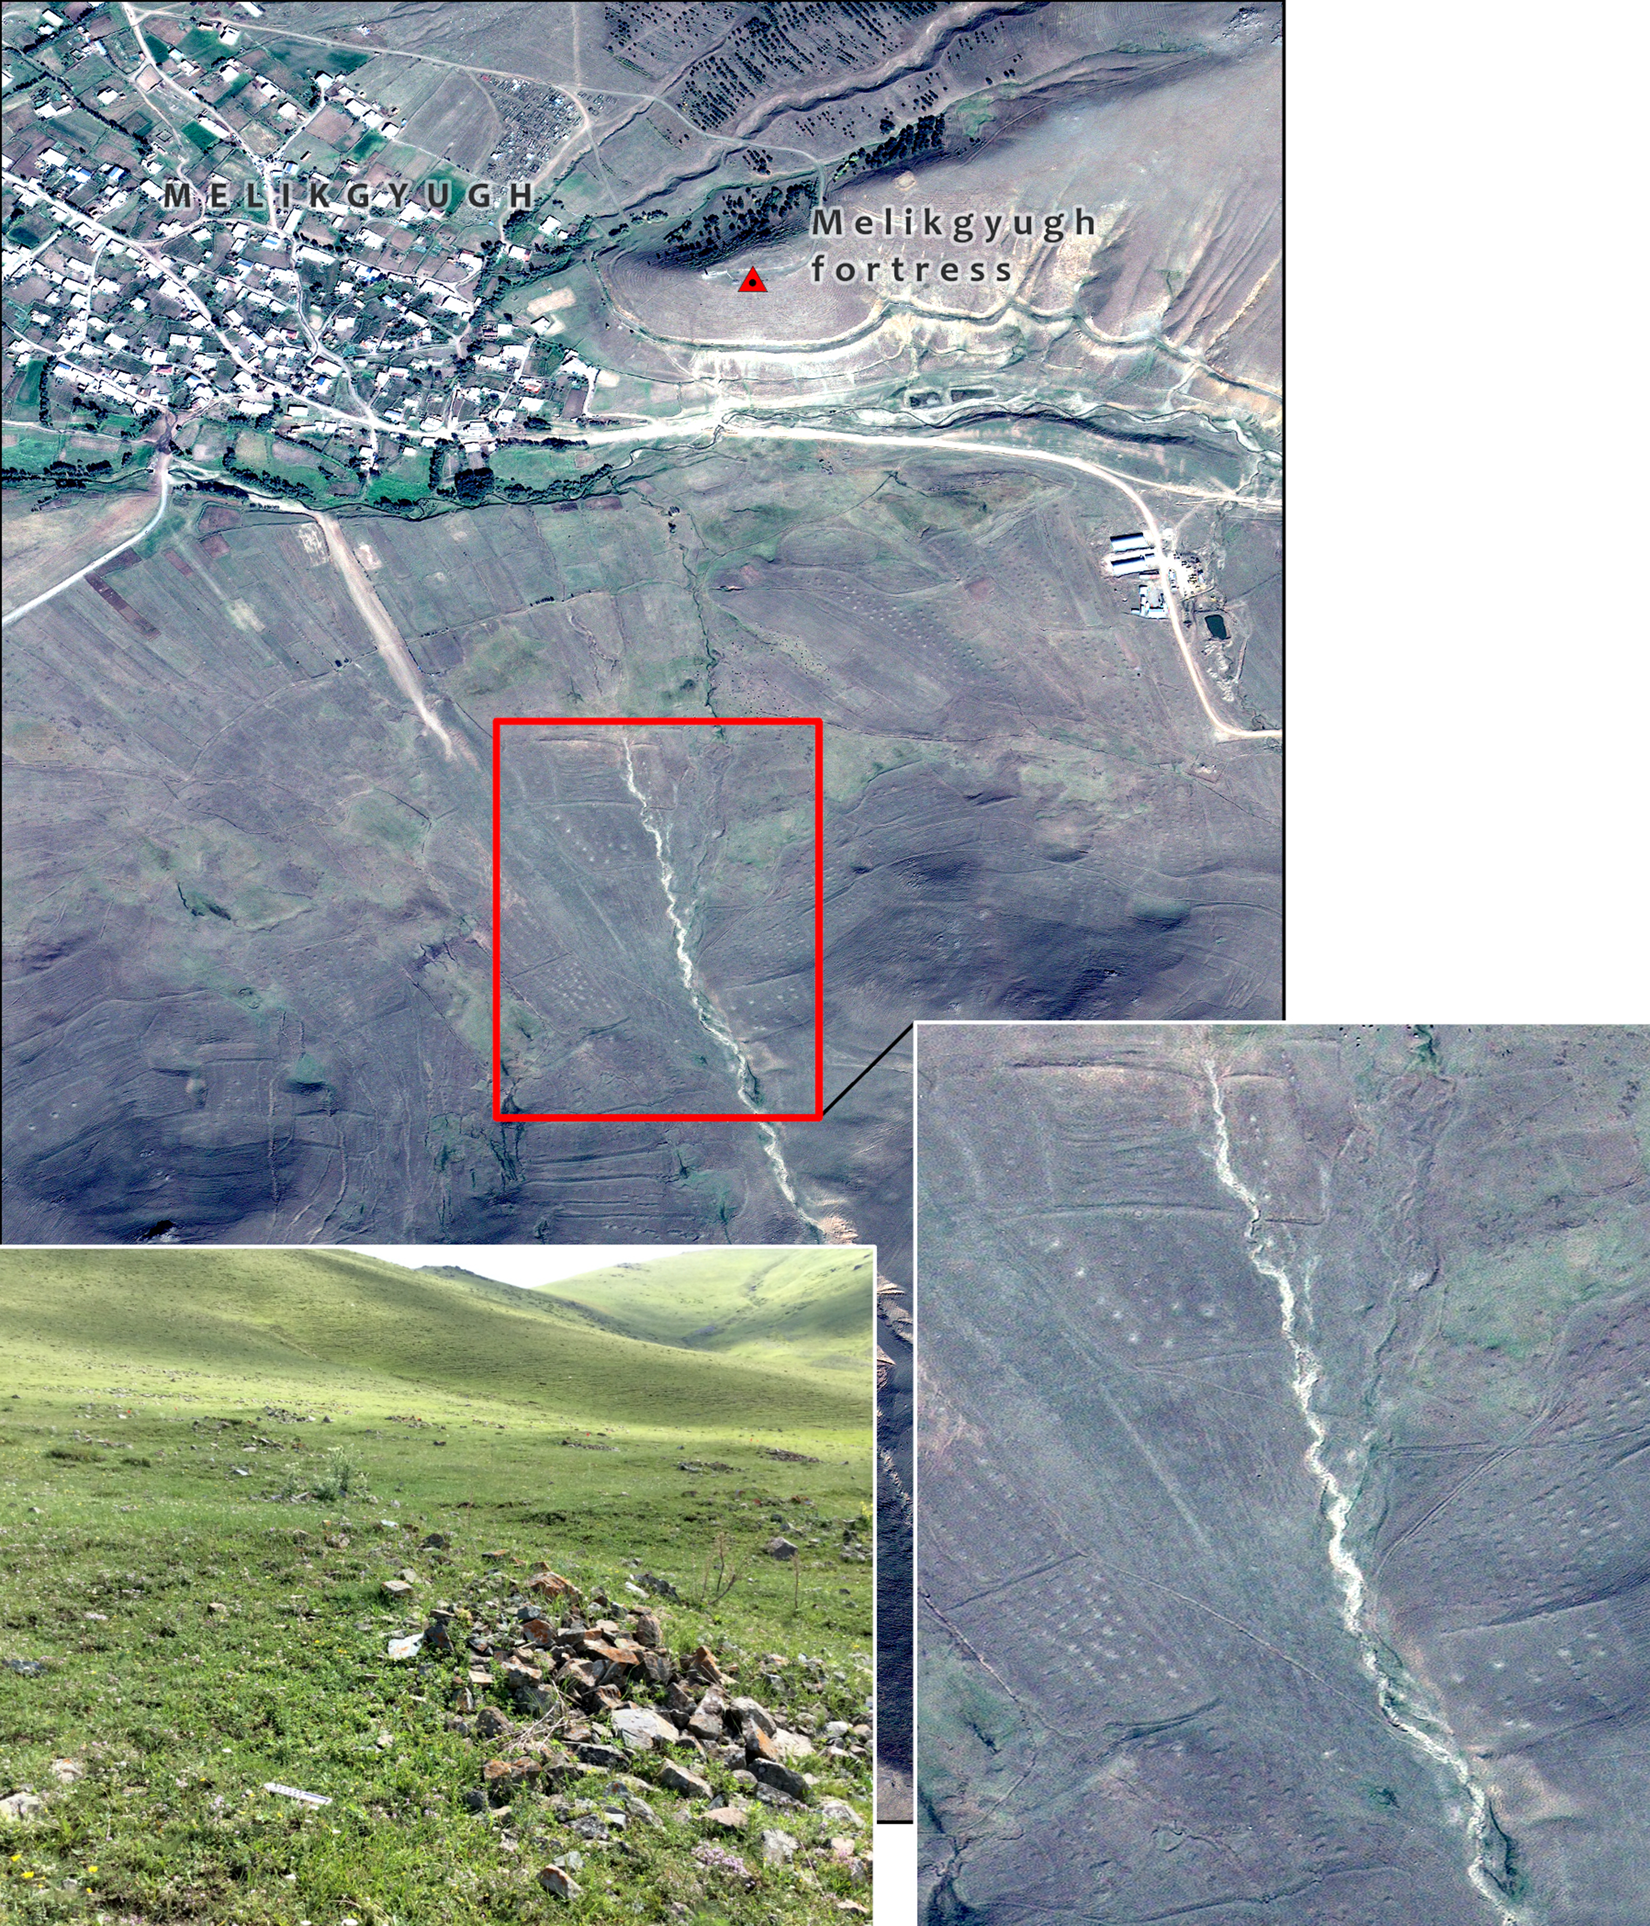
Another common, more localized trace of land reclamation efforts are the ubiquitous piles of stone cobbles manually gathered by farmers and shepherds to improve grazing conditions for their flocks. During our review of Google Earth, Bing, and commercial Pléaides imagery, the size and spatial concentrations of these stone piles led us to interpret them initially as burial clusters targeted for ground truthing; indeed, even in person, the aggregations of these rock piles, which could number in the hundreds, were initially mistaken for clusters of disturbed or eroded cromlechs (stone circles). Whereas the modern surfaces of the mounds are often obscured by accumulated soil and vegetation, in the CORONA and 1948 Soviet air photos, they stand out in fields as clusters of highly reflective points, suggesting they were still relatively new at that time (Figure 9).
Manually gathered piles of cobbles in fields, such as these near the Late Bronze Age fortress and village of Melikgyugh, Armenia, can resemble burials in high-resolution Google Earth or commercial imagery, requiring ground verification. (Bottom left photo credit: Project ArAGATS)
In addition to expanding arable land through field clearance, Soviet-era hydrological development for municipal and agricultural needs led to new irrigation schemes and reservoirs in our Kasakh Valley survey area, including the Aparan and Halavari Reservoirs, which were constructed in 1967 and 1981, respectively (Badalyan and Avetisyan Reference Badalyan and Avetisyan2007). In our survey, these schemes were manifested in large irrigation pipes, cement-lined canals, and other hydrological management systems—including junction stations, cisterns, and sprinklers—impacting fields on the first and second flood terraces of the Kasakh River.
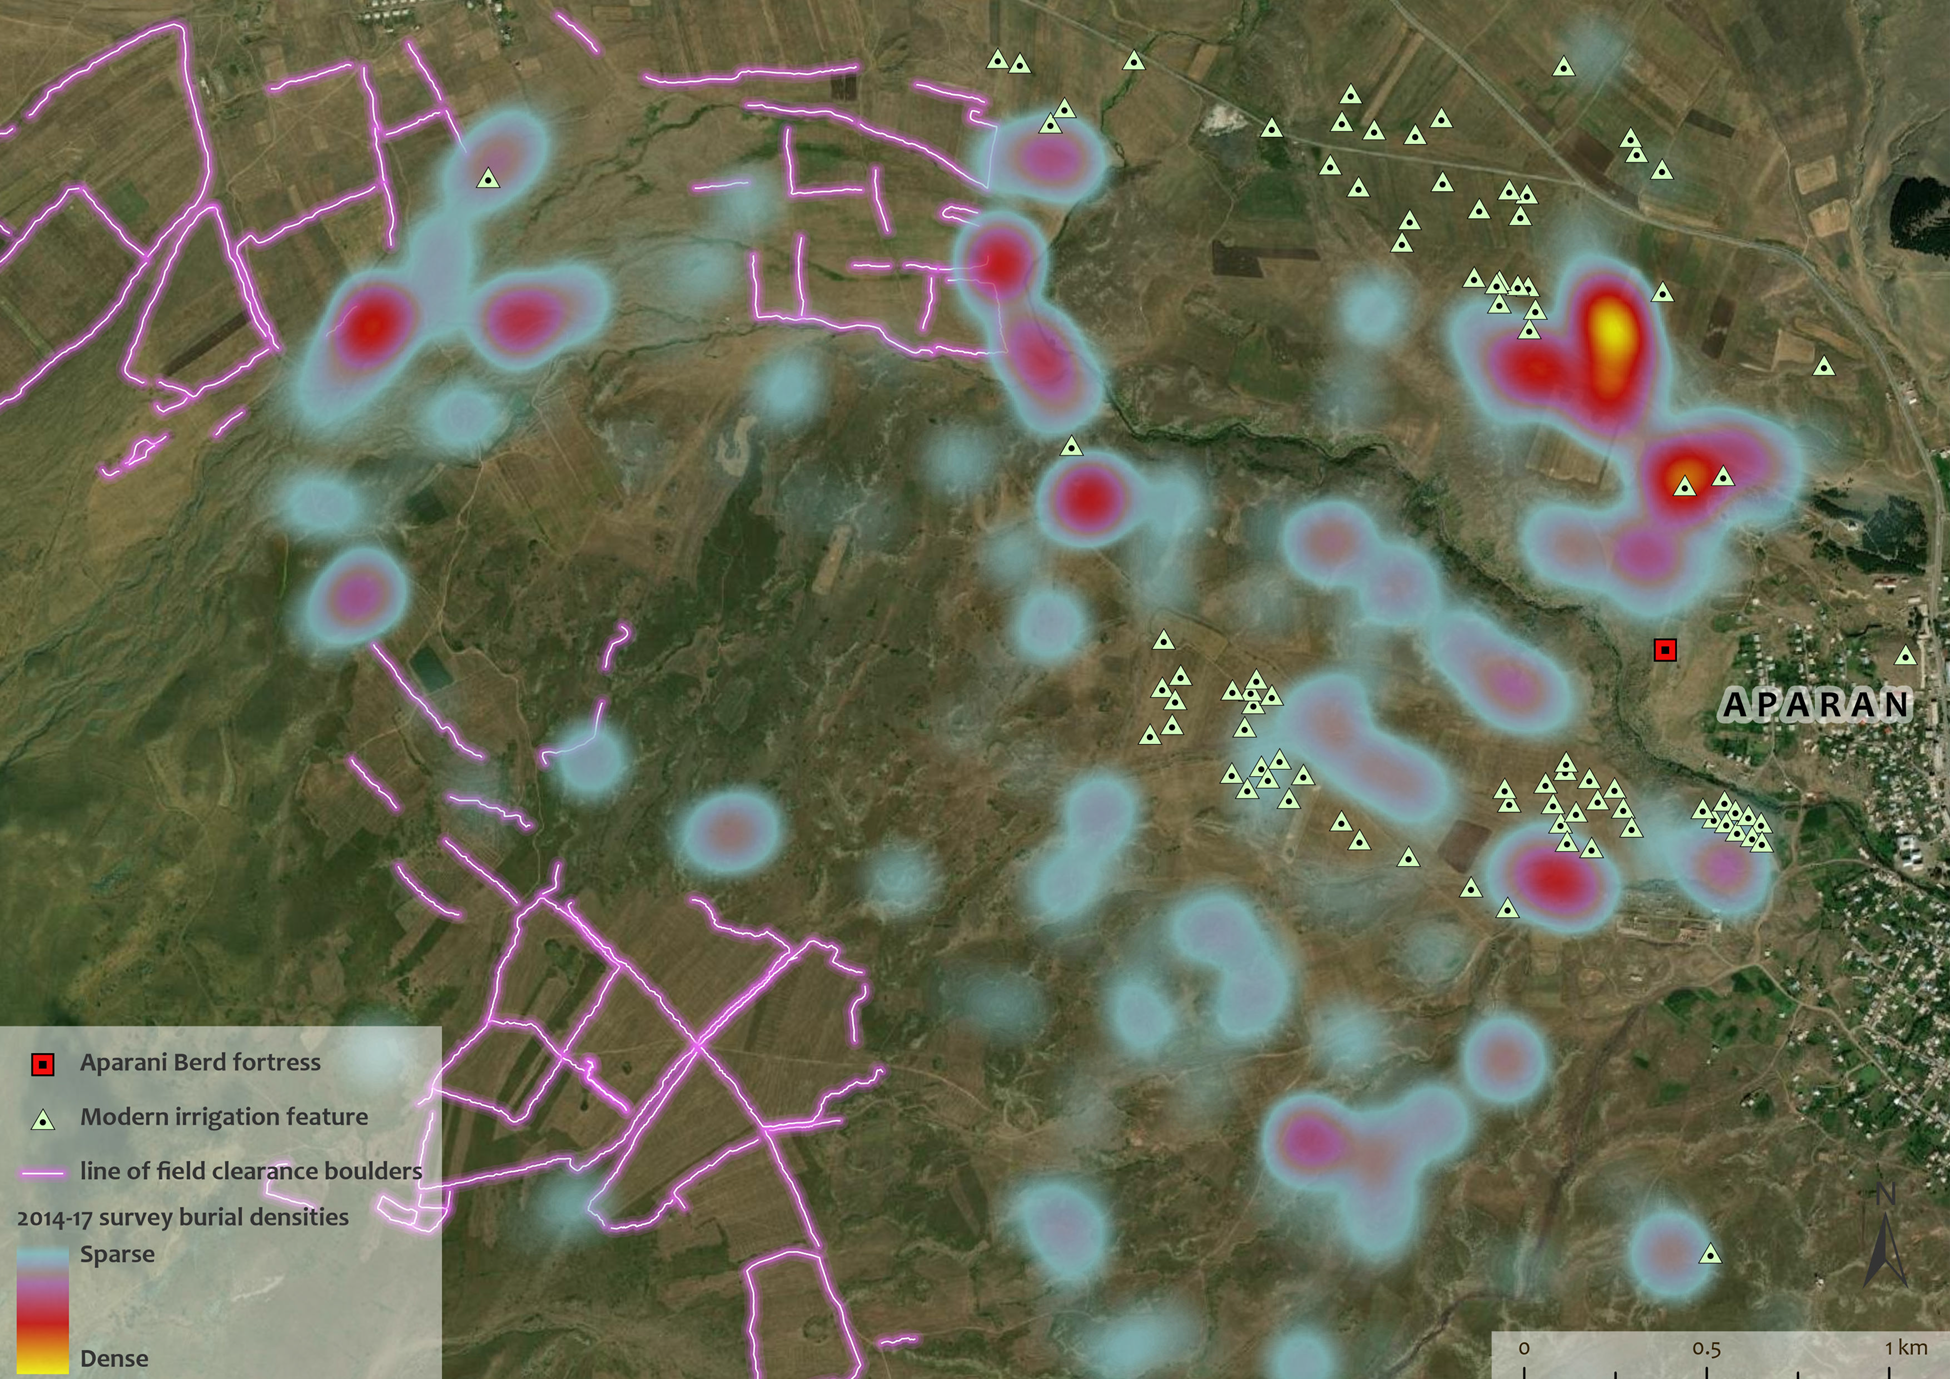
A large network of sprinkler head pipes from the 1970s was recorded in farmed fields on both sides of the Kasakh River to the north, west, and south of Aparan. The irrigation system, consisting of 1 m tall vertical steel pipes set in concrete footings and spaced about 50 m apart, coincides with a noticeable (but by no means complete) drop in burial densities associated with the Aparani Berd fortress (Figure 10). Although the burial distributions were not statistically different from a hypothetical random distribution of sites (as calculated by an Optimized Hot Spot Analysis in ArcGIS), the density patterns observed in a basic Kernel Density model of burials near the sprinklers suggest that the spatial relationship is more than coincidental—enough so that and we began to eliminate these areas from our survey area. From the air, an examination of Google Earth imagery revealed traces of the subsurface irrigation pipes connecting the sprinkler heads as an orthogonal network of thin lines cutting across field boundaries at the north end of the Aparani Berd cemetery.
Map of Project ArAGATS's survey landscape west of Aparan, Armenia, revealing surprisingly high burial densities amid the remnants of intensive Soviet-era amelioration, including hydrological installations and mechanized field clearance.
In circumstances such as this, our aerial survey took advantage of the new generation of drone-mounted multispectral sensors, such as the Parrot Sequoia and MicaSense RedEdge,Footnote 7 which can collect spectral data in the near-infrared band to aid in the detection of anomalies (e.g., near-surface features affecting patterns of vegetation growth) often visible through vegetation indexes such as normalized difference vegetation index (NDVI; McLeester et al. Reference McLeester, Casana, Schurr, Hill and Wheeler2018; Plekhov et al. Reference Plekhov, Gosner, Smith and Nowlin2020). We tested the hypothesis that in areas where the ground surface has been heavily disturbed by amelioration activities, subsurface traces of archaeological sites may remain intact and detectable through remote sensing. In 2017, the authors equipped a DJI Phantom 3 Professional quadcopter with a Parrot Sequoia sensor to test this method at the edges of the extensive cemetery associated with the Aparani Berd fortress, which we hoped would more clearly define the northern and southern termini of the mortuary complex. At the north edge of the cemetery, where fields were disturbed by sprinkler irrigation, our test flights revealed no additional cromlech traces in the multispectral data. However, underground irrigation pipes only faintly observed in true color Google Earth images were clearly visible in the Sequoia's NDVI imagery, particularly in fields that had not yet been mowed. Preliminary exploration of this approach shows that the resolution of low-altitude photography and photogrammetry is useful for capturing subtle, but informative, variations in surface vegetation.
In summary, walking transects across heavily modified fields in our survey area, particularly west of the town of Aparan, helped to verify the low densities of archaeological material near these large clearance features, leading us to reevaluate the potential of similar tracts in our transect area. Nevertheless, evidence for amelioration should not automatically rule out areas for potential survey. The landscapes around Aparani Berd fortress near Aparan yielded dense concentrations of cromlech burials (sites usually most vulnerable to disruption) despite clear evidence for Soviet-era development activities, including power lines, field clearance, and large water-management and sprinkler installations. The Aparani Berd site represents a useful illustration of how archaeological landscapes can persist in the face of profound landscape modifications, where remote-sensing techniques combined with intensive pedestrian survey can aid in the fine-grained analysis of those impacts and on the surviving archaeological remains. This served as a caution to us against ruling out entire landscapes for survey due to the visible remnants of landscape transformation.
Modern Land Cover and Landscape Assessments
The high frequency of Planet and Sentinel-2 image capture makes them beneficial tools for archaeological survey planning by enabling the monitoring of current ground conditions, including seasonal crop and vegetation cycles. Land-cover classification and vegetation indexes can be used to identify cultivated plots and to differentiate plowed areas from fallow or recently harvested fields, neither of which requires the submeter resolution of expensive commercial imagery (Buchhorn et al. Reference Buchhorn, Lesiv, Tsendbazar, Herold, Bertels and Smets2020; Figure 11). In a recent example outside the Caucasus, Plekhov and colleagues (Reference Plekhov, Gosner, Smith and Nowlin2020) found that the use of high-temporal resolution imagery helped to refine their survey area in Sardinia through a clearer understanding of local agricultural cycles (in consultation with local farmers), as well as post hoc analysis of visibility conditions and land-use typologies. Recently cut or plowed areas open to survey were easily identifiable, whereas fields under cultivation or with impenetrable fallow vegetation (identified via NDVI and other band combinations) could be avoided. In short, high-temporal resolution imagery aided more efficient survey coverage than simply visiting randomly selected survey units each day. Similar land-cover analysis and seasonal vegetation index studies can be used to identify springs, bogs, and other wetlands potentially suitable for environmental sampling within a survey area (e.g., Cromartie et al. Reference Cromartie, Blanchet, Barhoumi, Messager, Peyron, Ollivier and Sabatier2020; Joannin et al. Reference Joannin, Ali, Ollivier, Roiron, Peyron, Chevaux, Nahapetyan, Tozalakyan, Karakhanyan and Chataigner2014).
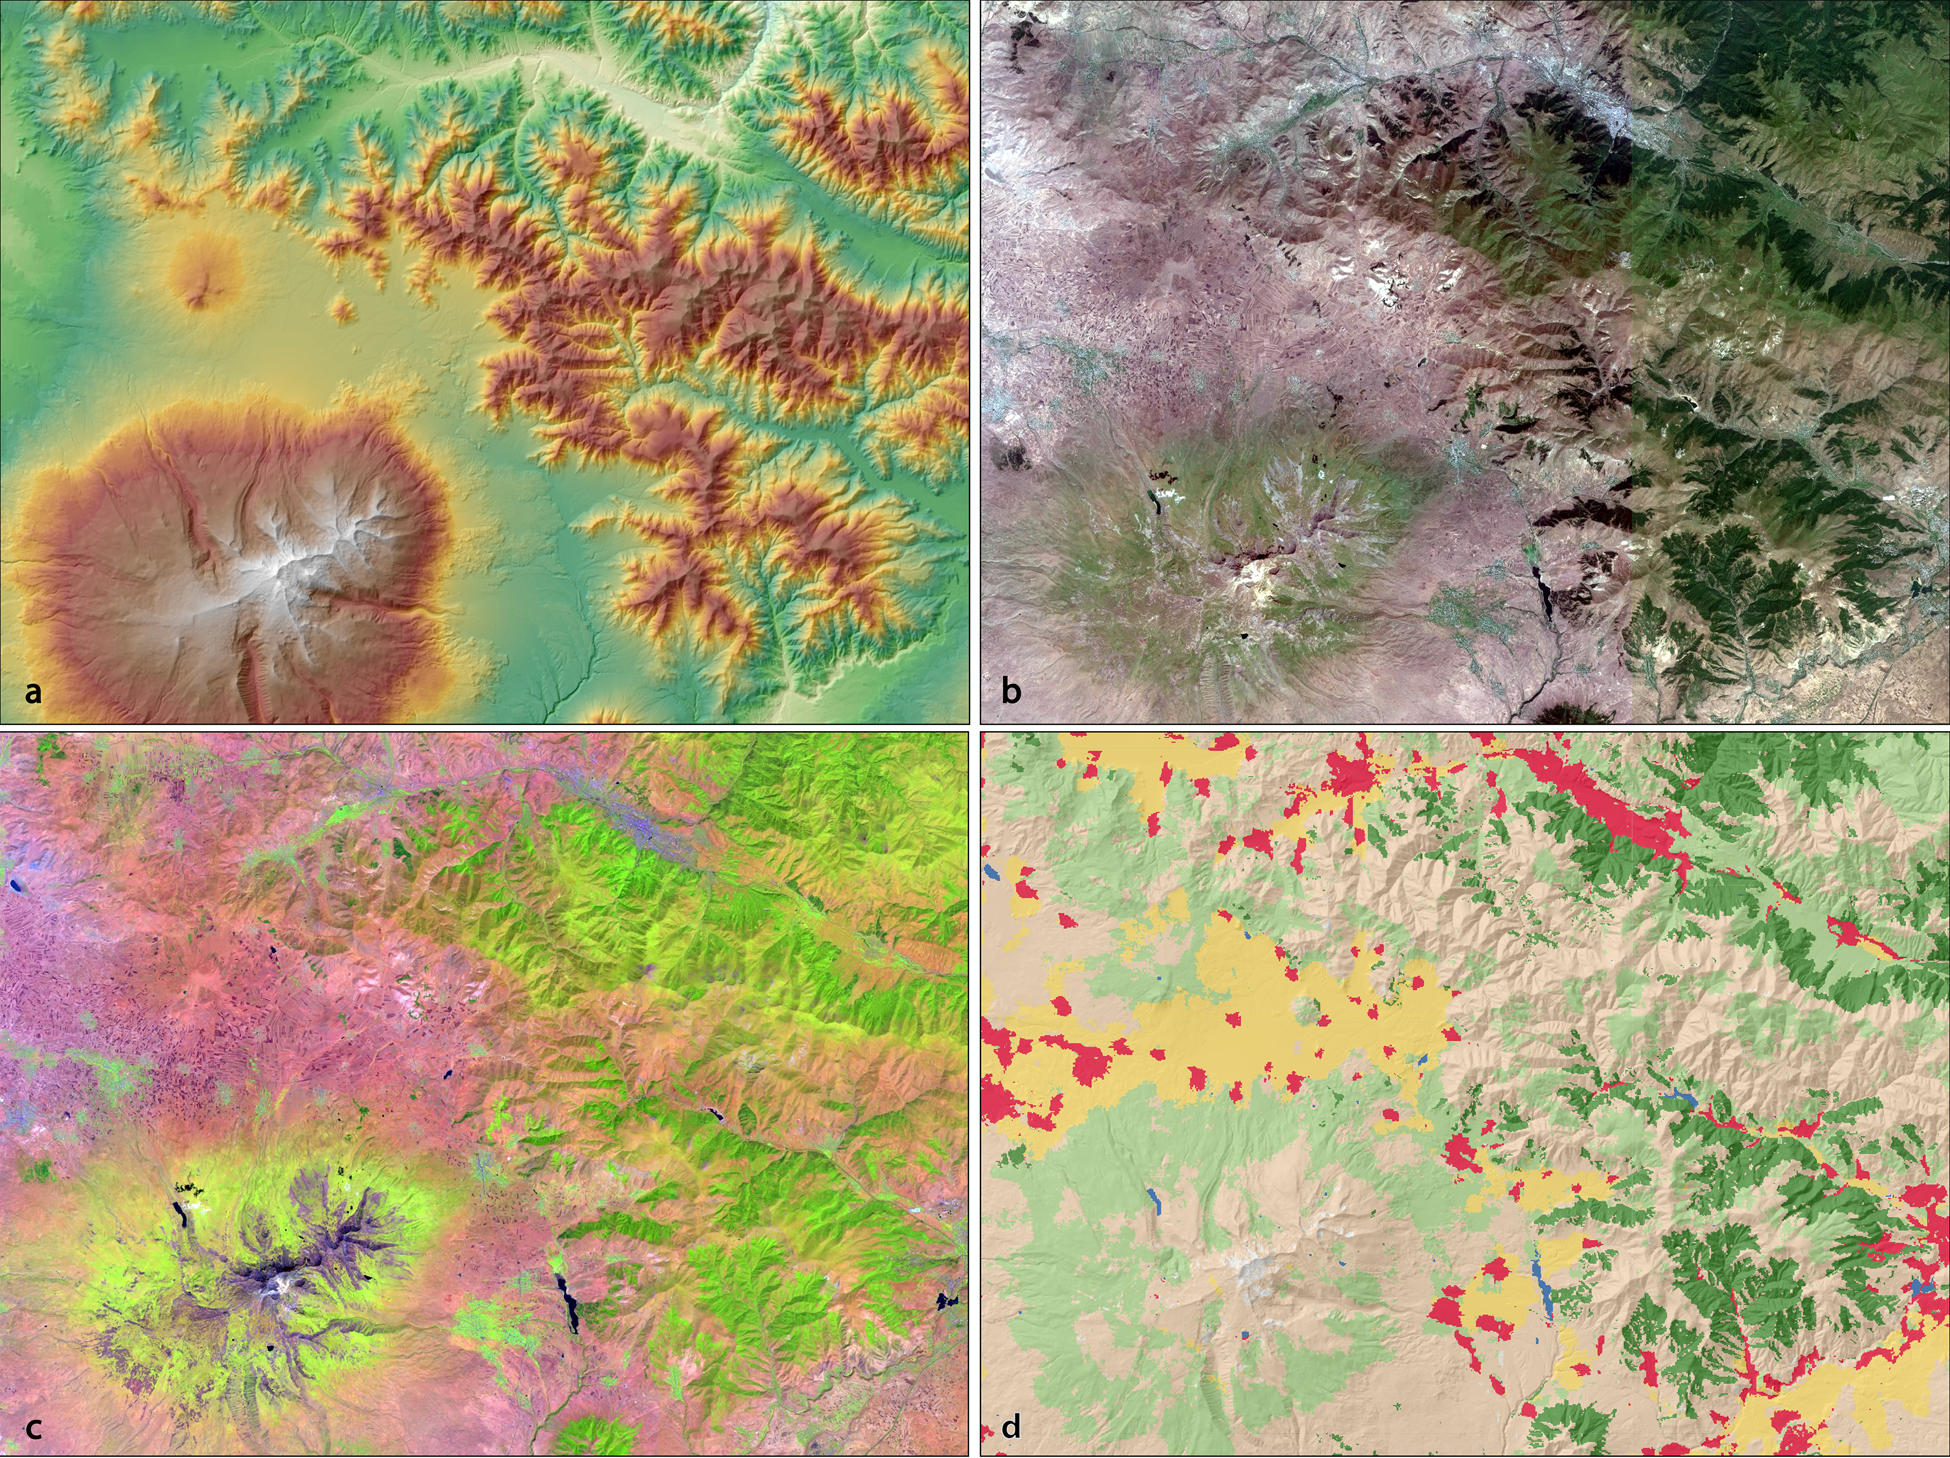
Examples of additional satellite imagery data products for visualizing Project ArAGATS's survey areas in the Mount Aragats region: (a) tinted hillshade derived from SRTM DEM data (30 m resolution); (b) Sentinel-2 satellite image, natural color (10 m resolution); (c) Sentinel-2 satellite image, false color composite (NIR, red, green); (d) Esri 10 m resolution land-cover map representing 10 cover classes—including croplands, shrubs, water, forest, grasslands, and built areas—available from Microsoft's Planetary Computer Explorer platform.
Monitoring Threats and Impacts to Heritage Sites
Although affordable medium- to high-resolution datasets cannot compete with commercial imagery in terms of spatial resolution, Opitz and Herrmann (Reference Opitz and Herrmann2018) and Tapete and Cigna (Reference Tapete and Cigna2018) make a strong case for the advantages of high-temporal resolution imagery in international cultural heritage monitoring projects, such as the Endangered Archaeology of the Middle East and North Africa (EAMENA), the Afghan Heritage Mapping Project (AHMP), and the American School for Oriental Research's Cultural Heritage Initiatives (ASOR CHI). In these large-scale monitoring efforts, assessing the impact of rapidly changing environmental and anthropogenic threats to heritage landscapes requires access to affordable and consistent Earth observation data (see Agapiou Reference Agapiou2017; Bini et al. Reference Bini, Isola, Zanchetta, Ribolini, Ciampalini, Baneschi, Mele and D'Agata2018; Bowen et al. Reference Bowen, Tofel, Parcak and Granger2017; Casana Reference Casana2015; Casana and Laugier Reference Casana and Laugier2017; Danti et al. Reference Danti, Branting and Penacho2017; Khalaf and Insoll Reference Khalaf and Insoll2019; Parcak et al. Reference Parcak, Gathings, Childs, Mumford and Cline2016; Plekhov and Levine Reference Plekhov and Levine2018; Rayne et al. Reference Rayne, Bradbury, Mattingly, Philip, Bewley and Wilson2017). Under these circumstances, the inconsistent temporal coverage of VHR commercial imagery available on Google Earth is a liability that outweighs their higher spatial resolution.
For example, in a recent study, Tapete and Cigna (Reference Tapete and Cigna2018) found through time-series studies in Syria and Libya that the short revisit time and broad width of Sentinel-2 imagery was more valuable than the higher spatial resolution—but less frequent captures—of expensive commercial imagery, particularly in instances such as encroaching urban development where baseline conditions are already well established. In such cases, they conclude that free Sentinel-2 imagery could contribute to a multiscale monitoring program whereby site assessments detected using 3 m PlanetScope or 10 m Sentinel-2 data could provide information to schedule (or “task”) a VHR commercial imagery over a smaller targeted survey to verify the site assessment and interpretation (Tapete and Cigna Reference Tapete and Cigna2018:18). In this sense, multiple datasets are used in tandem to complement each other's strengths.
At a more localized scale, the use of UAVs provides a common way of bridging this gap in resolution, providing the necessary spatial resolution (as well as spectral resolution, if equipped with a multispectral sensor) to assess site and vegetation conditions in a survey area, and they can be deployed on demand as threats to sites are encountered. Indeed, as noted above, UAVs (or drones), are providing archaeologists—many in the South Caucasus—with accessible platforms for collecting high-resolution photogrammetric data on a more localized geographic scale to generate 2D orthoimages and 3D digital surface/elevation models (DSMs, DEMs), contour maps, and other outputs. The increasing availability of multispectral, thermal, and lidar sensors, though still expensive, will only expand the range of specialized data products archaeologists can generate in the coming years (Campana Reference Campana2017; Casana et al. Reference Casana, Wiewel, Cool, Hill, Fisher and Laugier2017; Earley-Spadoni et al. Reference Earley-Spadoni, Petrosyan and Gasparyan2019; Erb-Satullo et al. Reference Erb-Satullo, Jachvliani, Kalayci, Puturidze and Simon2019; Hammer Reference Hammer2019; McLeester et al. Reference McLeester, Casana, Schurr, Hill and Wheeler2018).
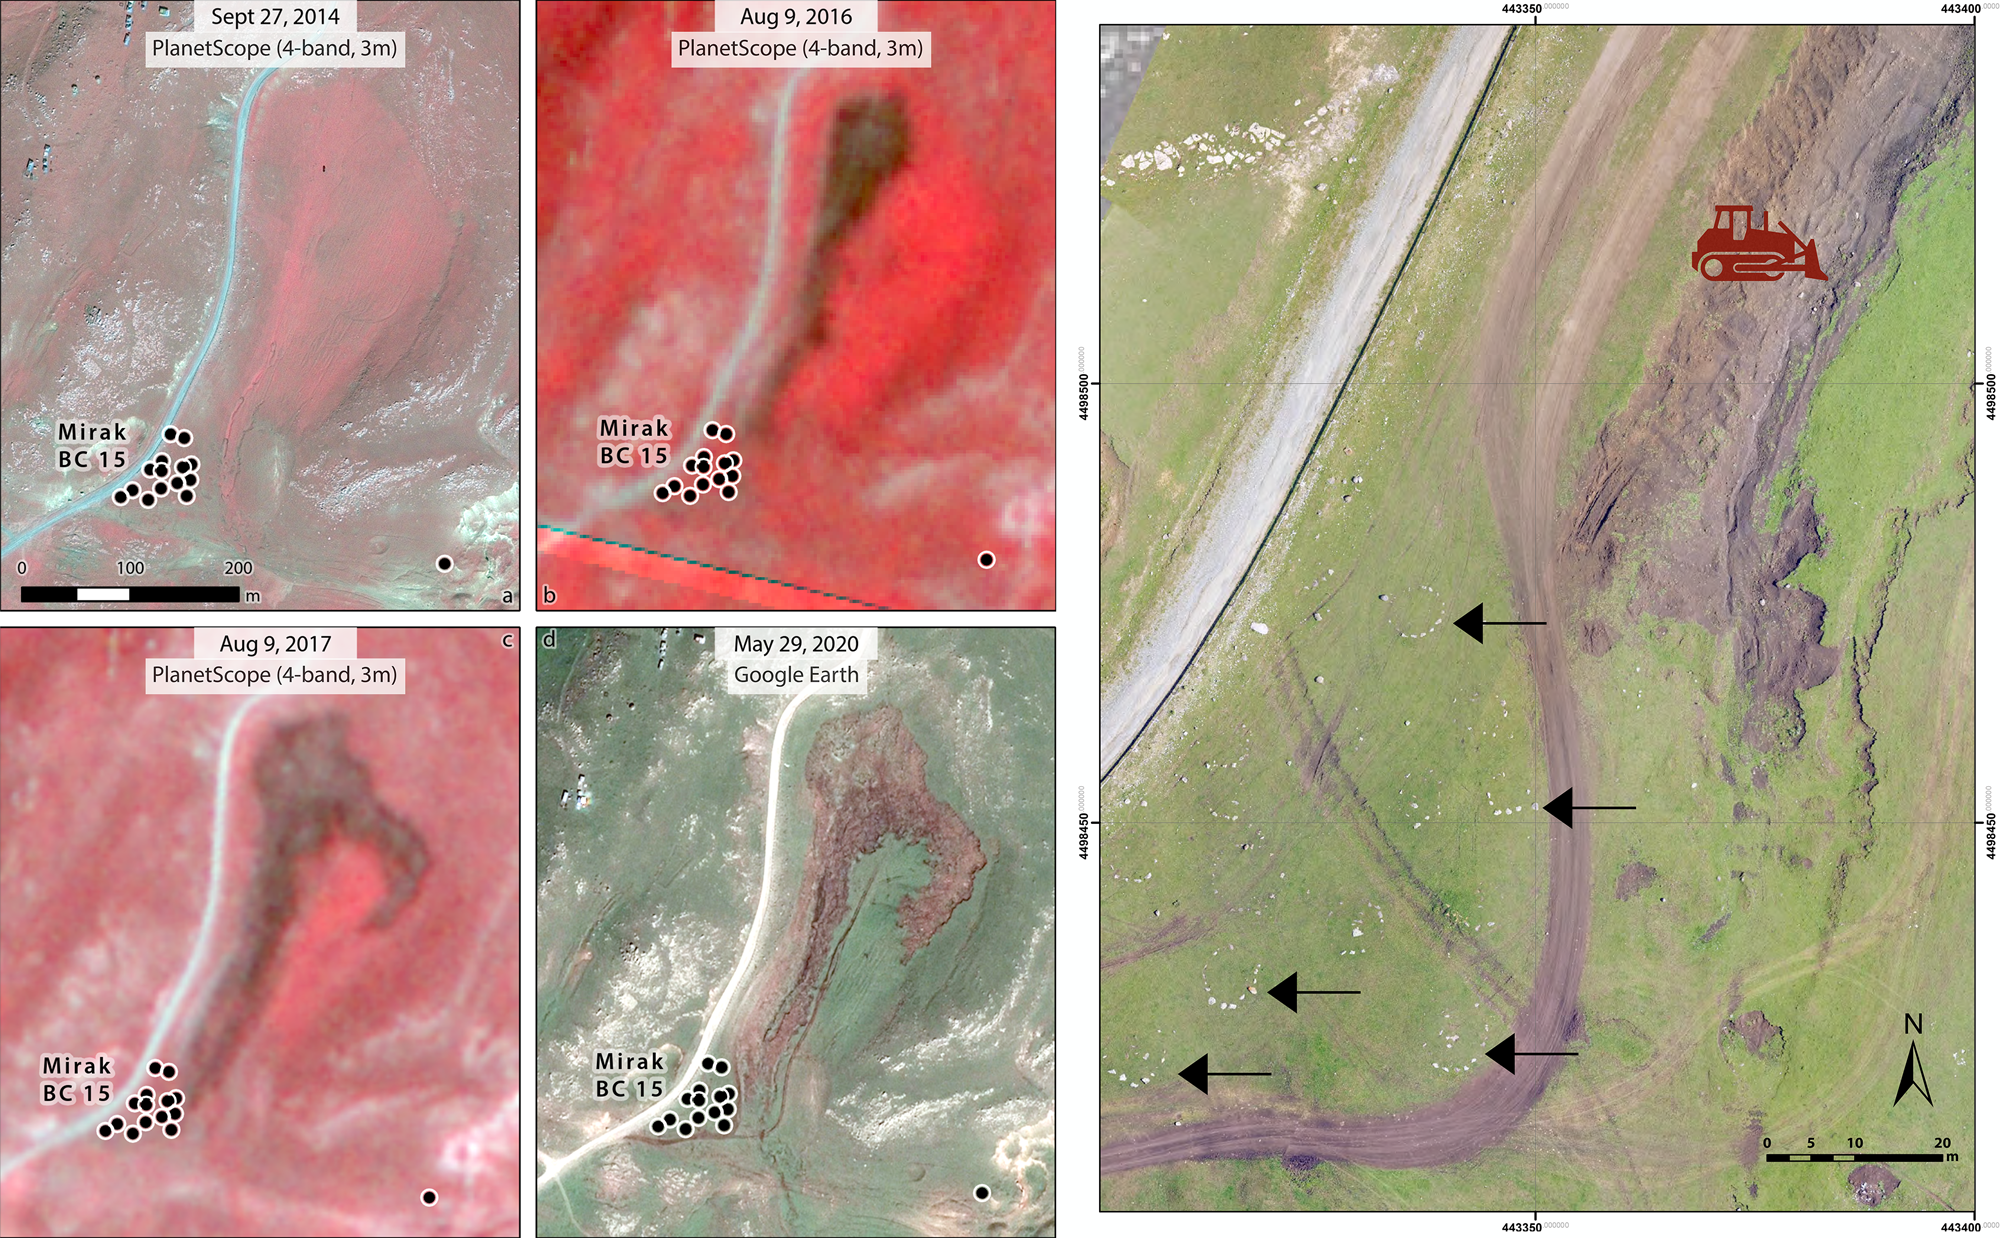
On Project ArAGATS's recent settlement survey of the upper Kasakh River valley, the authors employed a DJI Phantom 3 Professional UAV mounted with a Parrot Sequoia sensor, which, in addition to routine site recording activities, became useful for monitoring potential damage to archaeological landscapes in our survey area. During our survey of the landscape around the village of Mirak, Armenia, several burial clusters were recorded within a 1 km radius of an LBA fortress. During the 2016 season, earth-moving equipment was being used to strip topsoil in an area south of the village for its dark, rich alluvial soils that are sold for landscaping purposes in urban centers, and the heavy equipment had created a 400 m scar adjacent to a cluster of cromlech burials recorded in a prior season. We deployed our project UAV to record the state of damage and to produce a map for local authorities that illustrated the imminent danger to the site. Subsequently, Sentinal-2 satellite imagery allowed us to monitor the threat during the off-season; downloading a time series of 3.7 m resolution images of the threatened burial cluster between August 9, 2016, and August 12, 2019, we observed that the earth-removal efforts expanded toward the northwest—away from the cromlech burials—and seemed to have reached their maximum extent by August 2018 (Figure 12). Higher-resolution imagery on Google Earth captured on May 29, 2020, confirmed that the earth-moving activities have not resumed.
Time series of satellite images used to monitor Mirak topsoil mining near Mirak Burial Cluster 15. Imagery: (a) Pléiades 1, false color composite (NIR, red, green); (b–c) Planet Labs PlanetScope, false color composite (NIR, red, green); (d) Google Earth, natural color.
On a larger scale, the US-based monitoring organization Caucasus Heritage Watch, cofounded by coauthor Lindsay with Lori Khatchadourian and Adam T. Smith, conducted a comprehensive forensic investigation using high-resolution satellite imagery to document the fate of Armenian cultural heritage in Nakhchivan (Caucasus Heritage Watch 2022). This research assembled recent high-resolution satellite imagery, together with declassified CORONA and HEXAGON images from the 1970s and 1980s, Soviet-era topographic maps, and archival research to assess the damage and destruction of hundreds of Armenian cultural heritage sites in Nakhchivan (see also Maghakyan and Pickman Reference Maghakyan and Pickman2019). CHW's results, distributed through its website and a series of public-facing Story Maps (https://storymaps.arcgis.com/stories/48703f664f2f467b8f4f42008d8c75da), verify the destruction of 107 medieval and early modern Armenian monasteries, churches, and cemeteries between 1997 and 2011, illustrating in painstaking detail a program of systematic cultural erasure by Azerbaijani authorities.
CONCLUDING THOUGHTS
Although the availability of cutting-edge technologies has never felt more open to archaeology, access to training and equipment needed to use these tools is not uniformly available, creating significant barriers to entry among many archaeological projects and heritage organizations. This article is an attempt to lower an initial barrier to these technologies by highlighting the sources and utility of low-cost remote sensing tools and some examples of their use. This overview is framed as an initial step for those interested in pursuing the use of archaeological remote sensing and gaining the confidence to explore available datasets in their area of study and more advanced conversations taking place in specialist journals. For those without access to dedicated university courses on remote sensing and GIS, free online training resources available on YouTube—such as the AnthroYeti channel and website (https://anthroyeti.net/) and open-access GIS tutorials and OpenCourseWare (e.g., https://courses.spatialthoughts.com/introduction-to-qgis.html)—can help provide the next level of skill sets to keep pace with this rapidly changing technology.
Acknowledgments
We wish to thank the Armenian and American team members who participated in the KVAS survey discussed here: Karen Azatyan, Salpi Bocchieriyan, Gabrielle Borenstein, Amy Cromartie, Bryan Fagan, Elizabeth Fagan, Alan F. Greene (survey codirector), Elizabeth Hardy, Christopher Stevenson, and Shujing Wang, in addition to ArAGATS founding codirectors Adam T. Smith and Ruben Badalyan. Comments and suggestions from two anonymous reviewers helped improve the framing of this article. No permits were needed for the remote sensing and survey work discussed here.
Funding Statement
The Project ArAGATS survey work discussed here was funded under NSF grant #BCS-1561237, with additional support from Purdue University, Cornell University, Stanford University, and NYU's Institute for the Study of the Ancient World. We are also grateful for the many years of institutional and financial support from the Institute of Archaeology and Ethnography (Academy of Sciences, Republic of Armenia).
Data Availability Statement
No original data were presented in this article.
Competing Interests
The authors declare none.


 Open access