


How do elected autocrats come to power? Prominent explanations point to class conflict, arguing that poor voters prefer a powerful executive ally to democratic institutions that are captured by moneyed elites (e.g., Acemoglu et al., Reference Acemoglu, Robinson and Torvik2013b). These accounts cast the subversion of democracy as a means to an end, the unsavory but unavoidable vehicle by which voters pursue their redistributive preferences.
But many elected autocrats initially attempt to sell democratic deconsolidation as an end in and of itself, even portraying their proposals as vaguely democratizing. These candidates capitalize not on polarization (Graham and Svolik, Reference Graham and Svolik2020; Svolik, Reference Svolik2020), inequality (Acemoglu et al., Reference Acemoglu, Robinson and Torvik2013b), relief (Grillo and Prato, Reference Grillo and Prato2020), or even stealth (Luo and Przeworski, Reference Luo and Przeworski2019; Chiopris et al., Reference Chiopris, Nalepa and Vanberg2021) but rather on cross-cutting frustration with the status quo: anti-system sentiment. Anti-system sentiment can stem from economic grievances that are weakly correlated with income or wealth, creating intra-class rather than inter-class cleavages. Proposals to shake up political institutions may then appeal to voters from across the socio-economic or ideological spectrum.
Turkey's Recep Erdoğan, for example, did not rise to power by mobilizing poor victims’ of the previous years recession; rather, he exploited cross-cutting disillusionment with the status quo (Cagaptay, Reference Cagaptay2002, 2; Carkoglu, Reference Carkoglu2002, 37). Hungary's Viktor Orban, likewise, made his name with a searing pro-democracy speech; he later became prime minister not by rallying the poor against the austerity of the previous government (Lomax, Reference Lomax1999, 120; Scheiring, Reference Scheiring2020, 312), but by appealing to a cross-cutting coalition of voters seeking a “new beginning” (Szilágyi and Bozóki, Reference Szilágyi and Bozóki2015, 162). Orban then “morphed into an opponent of democracy” (Berman, Reference Berman2021, 72), while Erdoğan earned the moniker “New Sultan” (Cagaptay, Reference Cagaptay2020).
Theories focused on inequality or polarization predict that elected autocrats come to power with the support of one side of the socio-economic or ideological spectrum (Acemoglu et al., Reference Acemoglu, Robinson and Torvik2013b; Graham and Svolik, Reference Graham and Svolik2020; Karakas and Mitra, Reference Karakas and Mitra2020). We instead predict a fleeting realignment: that elected autocrats temporarily shift the dimension of political conflict, initially drawing voters from across traditional coalitions (as in Schofield, Reference Schofield2003; Greene, Reference Greene2008; Buisseret and Van Weelden, Reference Buisseret and Van Weelden2020).
We evaluate this prediction using new data on the rise of Venezuela's Hugo Chávez, an emblematic elected autocrat. This case is central to studies of “democratic subversion” (Levitsky and Ziblatt, Reference Levitsky and Ziblatt2018, Chapter 4), “illiberal democracy” (Mounk, Reference Mounk2018), and “democratic backsliding” (Bermeo, Reference Bermeo2016), yet there is no consensus on the roots of Chávez's initial electoral success. Some scholars emphasize class cleavages, while others point to cross-cutting anti-system sentiment; quantitative evidence has come largely from correlations among variables in a handful of public opinion surveys.Footnote 1 Moreover, among scholars who focus on anti-system sentiment, there is no consensus about what (if not class) divided the most anti-system voters from everyone else.
We suggest that Venezuela's long pre-Chávez recession produced uneven harm within class groups, sparking anti-system sentiment among those who fared poorly relative to their socioeconomic peers. We then document three findings consistent with the notion that Chávez came to power not by rallying the poor or the left against their democratic principles, but rather by selling himself as a candidate who would deepen Venezuelan democracy—thus appealing to anti-system voters from across classes and across the traditional political spectrum.
First, we find that Chávez's initial coalition was fleeting. Using an original data set of historical election returns, we show that the bloc that elected Chávez in 1998 quickly splintered. We interpret this fact as evidence of a temporary electoral realignment, after which many Venezuelan voters became “repented Chavistas” (Corrales and Penfold, Reference Corrales and Penfold2015, 44).Footnote 2
Second, we find that voting in the 1998 presidential election—which brought Chávez to power—was less tied to socio-economic status than voting in any other presidential election, 1958–2012. It was not “the poor” or “the left” who elected Chávez in pursuit of specific tax policies; rather, Chávez initially drew voters from across socio-economic and ideological lines.
Third, we provide additional evidence that Chávez openly campaigned on a proposal for sweeping institutional change (Hawkins, Reference Hawkins2010; Handlin, Reference Handlin2017). But far from promising to undermine checks and balances or otherwise promote majoritarian institutions, Chávez vowed to curb Venezuela's “imperial presidency,” push for decentralization, and even establish a prime minister and a fourth branch of government (Section 2.3). The resultant ambiguity allowed many voters to hear what they wanted to hear. We arrive at these findings by drawing quantitative and qualitative comparisons between Chávez's campaign-trail rhetoric and that of his principal opponent, Henrique Salas Römer.
Beyond work on democratic backsliding, these findings contribute to the literature on populism. Two distinct views of populism both claim Hugo Chávez as standard bearer: (1) macroeconomic populism (Acemoglu et al., Reference Acemoglu, Egorov and Sonin2013a), in which “anti-establishment” means “anti-economic-elite” and entails a specific set of redistributive policies that appeal to poor voters, and (2) populism in the sense of Barr (Reference Barr2009), in which “anti-establishment” means “anti-political-establishment” and entails a proposal to change political institutions—a proposal that may hold cross-cutting appeal. The former requires a coalition of the dispossessed, the latter a coalition of the disappointed. We make two contributions. First, in Section 1, we describe conditions under which we would expect anti-system sentiment to span the socio-economic spectrum (and, thereby, conditions under which we would expect cross-cutting support for proposals to reshape political institutions). Second, in Section 2, our empirical analysis reveals that Chávez in 1998 was very much a Barr-type populist—not yet a macroeconomic populist—even shifting political competition from a left–right dimension to a change–status-quo dimension (Handlin, Reference Handlin2017, 17, 43). By proposing an ambiguous “new democracy” to a diverse set of voters disgusted with the status quo (Hawkins, Reference Hawkins2010), Chávez assembled a heterogeneous anti-system coalition. When his new democracy proved not-so-democratic after all, the coalition splintered. In our account, cross-cutting anti-system sentiment—more than class conflict—brought Chávez to power, and merits renewed consideration in the analysis of other cases.
1 Theory: elected autocrats as Riker's heresthetic leaders
Prominent explanations for the rise of elected strongmen focus on distributive conflict and ideological polarization. Acemoglu et al. (Reference Acemoglu, Robinson and Torvik2013b), for example, propose that checks and balances allow the elite to capture policymaking; for the poor majority, when inequality is high, the cost of elite capture outweighs the benefits of checks and balances.Footnote 3 Other accounts point to polarization (e.g., Haggard and Kaufman, Reference Haggard and Kaufman2021). In Svolik (Reference Svolik2020), for example, polarization threatens democracy because voters far enough to the left will vote for the left candidate no matter what—even if the voter values democracy and the candidate subverts it.
What these theories have in common is that candidates who subvert democracy draw electoral support from one side of the socio-economic or ideological spectrum. We instead follow Handlin (Reference Handlin2017, 43) in describing two dimensions of political conflict in Venezuela: an economic dimension (left–right) and an institutional-change dimension (change–stability).Footnote 4 We propose that Chávez won election in 1998 not primarily by leveraging left–right polarization or poor–elite distributive conflict, but rather by exploiting a cross-cutting cleavage that divided the most virulently anti-system voters from everyone else. Chávez came to power by shifting political conflict onto the change–stability dimension, thus “structuring the world so [he] could win” (Riker, Reference Riker1986, ix).
This is not to say that anti-system sentiment in Venezuela was divorced from preferences over economic policy—only that those preferences may have been weakly correlated with income or ideology. Like many scholars before us, we view anti-system sentiment as the consequence (at least in part) of a prolonged recession (e.g., McCoy and Myers, Reference McCoy and Myers2004; Morgan, Reference Morgan2011). But while much of the literature considers how recession fuels class conflict—Dunning (Reference Dunning2008), for example, shows that low oil prices exacerbate poor–elite conflict and thereby spark attacks on democracy—we suggest that recession also provokes intra-class conflict. In Venezuela, the recession sharpened intra-elite and even intra-sector business rivalries, leading the losers of the most recent round of crony-capitalist battles to support Chávez's candidacy (Santodomingo, Reference Santodomingo1999; Gates, Reference Gates2010). It also widened the longstanding system-sentiment gap between formal and informal workers (Díaz-Cayeros and Magaloni, Reference Díaz-Cayeros and Magaloni2009) and between the urban and rural poor. The rural poor voted for Venezuela's traditional parties, whereas the urban poor were long neglected and alienated (Myers, Reference Myers1975; Canache, Reference Canache2002b; Ellner, Reference Ellner, Ellner and Hellinger2003; Velasco, Reference Velasco2015).
These precise mechanisms may be specific to Venezuela, but the logic is general: adverse economic conditions can spawn a set of material grievances whose severity is weakly correlated with income or with preferences over redistribution (or, more generally, with preferences over any single economic policy issue). While a vote for macro-economic populism may be an expression of a preference for specific new institutions that change tax policy in known ways (Acemoglu et al., Reference Acemoglu, Egorov and Sonin2013a,Reference Acemoglu, Robinson and Torvikb), we see a vote for anti-system populism as the expression of a hope that unspecified (or underspecified) new institutions will produce economic outcomes unlike those of the status quo. Such hopes proliferate with recession but are not always predicted by income.Footnote 5 The implication is that, while macro-economic populist coalitions may be defined by income, anti-system populist coalitions unite disparate groups each with their own reasons for a “palpable sense of general unhappiness with the status quo” (Ward et al., Reference Ward, De Neve, Ungar and Eichstaedt2021, 370). In addition to Handlin (Reference Handlin2017), this account builds on Buisseret and Van Weelden (Reference Buisseret and Van Weelden2020) and Greene (Reference Greene2008), who emphasize that outsider candidates can win by activating a second issue dimension, as well as Greene and Robertson (Reference Greene and Robertson2022), who highlight the role of sentiment in generating support for authoritarian leaders.Footnote 6 Schofield (Reference Schofield2003) clarifies how shifts in the dimension of political conflict can occur in equilibrium, developing a model of spatial competition in two dimensions with “activist valence”: valence that is endogenously determined by contributions from individuals. In pursuit of help from disaffected activists who care passionately about the latent dimension of conflict but little about the active one, vote-maximizing candidates shift dimensions, producing electoral realignment (see Miller and Schofield, Reference Miller and Schofield2003).Footnote 7
When anti-system sentiment is widespread, candidates may profitably campaign on promises of institutional change (Barr, Reference Barr2009). Whether that change will deepen or dismantle democracy is often ambiguous ex-ante, in part because the outcome likely depends not only on candidate characteristics (Levitsky and Ziblatt, Reference Levitsky and Ziblatt2018) but also on hard-to-predict circumstances (Corrales, Reference Corrales2018). It is this ambiguity that allows for backsliding by surprise.
2 Backsliding by surprise in Venezuela
We investigate three empirical implications of this proposal.
First, we find that the 1998 election induced a fleeting electoral realignment: a change in which people vote together. Realignment is an empirical implication of the idea of a shift in the dimension of conflict (Miller and Schofield, Reference Miller and Schofield2003). The temporary nature of the realignment is an empirical implication of the idea that Chávez's initial coalition endorsed a vague change platform, not the specific slate of institutions created during his first years in office.
Second, using survey and administrative data, we find that voting in the 1998 and 2000 elections was less tied to socio-economic status than vote choice in other presidential elections, 1958–2012. This result is difficult to reconcile with the idea of 1998 as an election that sharpened class cleavages in voting, but it resonates with our proposal that the left–right dimension of conflict was salient in all elections except 1998 and 2000, which were contested on the cross-cutting change–stability dimension.
Third, using text analysis, we find that, in 1998, Chávez campaigned on a platform of (vaguely defined) institutional change. This finding, too, is consistent with the notion that the change–stability dimension was salient in 1998.
2.1 The 1998 coalition was fleeting
The election of Chávez in 1998 induced a fleeting electoral realignment. The voters who elected Chávez in 1998, we find, often opposed each other in previous elections—and they opposed each other in subsequent elections, too. Chávez's initial coalition coalesced briefly and then dissolved.
This fact is consistent with the notion of a shift in the dimension of political conflict (Miller and Schofield, Reference Miller and Schofield2003), and with the idea that many of Chávez's initial supporters experienced remorse (Corrales and Penfold, Reference Corrales and Penfold2015, 44). But it is difficult to reconcile with the image of far-sighted voters correctly anticipating the content and consequences of Chávez's new political institutions (Acemoglu et al., Reference Acemoglu, Robinson and Torvik2013b).
We observe this fleeting realignment in an original data set of district-level election returns. Beginning with the 1998 elections, these data are publicly available online; for 1958–1993, we digitized returns printed in volumes published by Venezuela's Consejo Supremo Electoral (CSE). Overall, our data include vote shares for 287 districts over twelve presidential elections.Footnote 8
In the absence of electoral realignment, we would expect Venezuela's electoral geography to remain stable. The districts most in favor of Acción Democrática (AD)—one of the two parties that dominated presidential elections from the 1960s through the 1980s—would remain the most pro-AD districts from one election to the next; likewise, the least-AD districts would remain anti-AD. Realignment, in contrast, shows up as a scrambling of the electoral map: the most-AD districts might suddenly vote for the same candidate as the least-AD districts. Realignment produces coalitions of strange bedfellows (e.g., Miller and Schofield, Reference Miller and Schofield2003; Sundquist, Reference Sundquist2011, Table 2).
We measure the (in)stability of Venezuelan electoral geography using the correlation between district-level vote shares in one election and district-level vote shares in subsequent elections (following Miller and Schofield, Reference Miller and Schofield2003; Eubank, Reference Eubank2012, for the United States).Footnote 9 High inter-election correlations suggest stability. Low inter-election correlations reveal realignment: a mixed-up electoral map.
We find that Venezuela's electoral geography remained remarkably stable for 35 years, abruptly changed with the election of Hugo Chávez in 1998, and then abruptly changed back by the time of his re-election in 2006. To see this, consider Figure 1. The first point in this figure—the one corresponding to 1963—marks the correlation between AD's vote share in the 1963 presidential election and AD's vote share in the 1958 presidential election (the first election after Venezuela's transition to democracy).Footnote 10 Unsurprisingly, this correlation was high: 0.86. Over the five years between 1958 and 1963, Adeco districts (i.e., pro-AD districts) stayed Adeco. The other points in Figure 1 mark the correlation between AD vote share in subsequent elections (1968, 1973 … 1993) and AD vote share in 1958. Naturally, the correlation weakened somewhat as time progressed. But it remained high: in 1993, the correlation with AD's 1958 vote share was 0.54. (We present all corresponding scatter plots in Appendix Figure E.4.)
Chávez's election temporarily scrambled Venezuela's electoral map. Using an original panel data set of municipal election returns, this figure plots the bivariate correlation (across municipalities) between (i) AD's vote share in 1958 and (ii) AD's or Chávez's vote share in each year indicated on the x-axis.
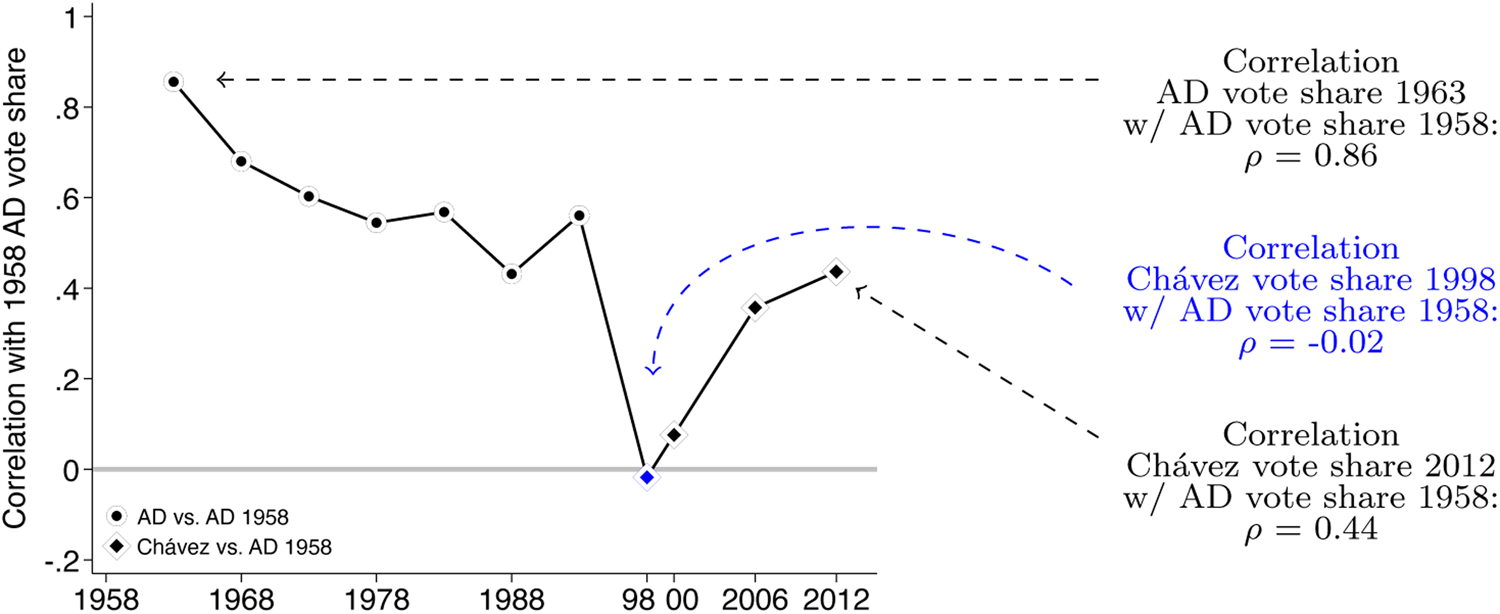
That changed in 1998. The old AD coalition split; some Adeco districts voted for Chávez, others against. The correlation between the vote share of AD's eventual candidate in 1958 and AD's candidate in 1998—Chávez's principal opponent—was almost exactly zero ($\widehat \rho = 0.01$ ). So was the correlation between Chávez's vote share in 1998 and AD's vote share in 1958, which we plot in Figure 1 ($\widehat \rho = -0.02$
 ). After decades of stability, the 1998 election scrambled Venezuela's electoral map.Footnote 11
Remarkably, Venezuela's traditional geographic voting blocs reemerged in 2006 and 2012, when Chávez was twice reelected. Indeed, by 2006, Chávez had largely captured former AD municipalities. The correlations between (a) the vote share of AD's candidate in 1958 and (b) Hugo Chávez's vote share in 2006 and 2012 were 0.34 and 0.44, respectively (Figure 1). Districts sorted back into the voting blocs of the 1960s, 1970s, and 1980s. The old Adeco coalition re-formed as Chavismo.
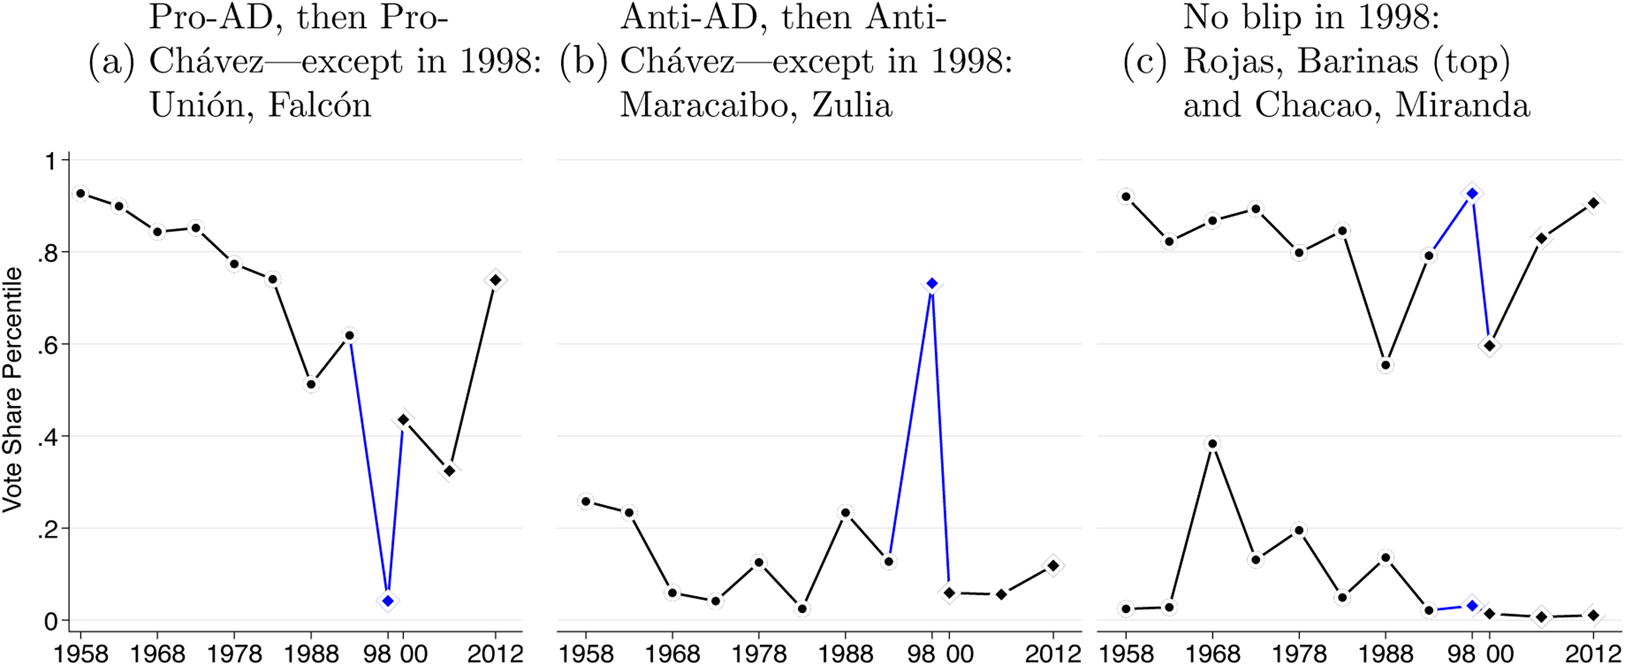
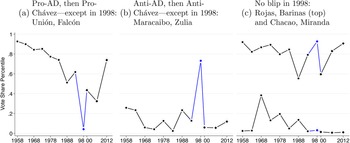
Consider, for example, the district of Unión, in the foothills of the sierra of Falcón state, an eight-hour drive northwest of Caracas. Unión is rural and agricultural; the capital has fewer than 10,000 residents. For decades, Unión was AD country: in 1958, AD won 82 percent of the vote in Unión, putting Unión in the 92nd percentile of AD vote share across all districts; in 1993, Unión still ranked in the top 40 percent most-Adeco districts (Figure 2a). And eventually, by 2012, Unión became Chavista, ranking in the 73rd percentile of Chávez vote share. But in 1998, Unión was one of the least-Chavista districts in the whole country, in the 4th percentile of district-level Chávez vote share. The urban district of Maracaibo, Zulia—part of one of Venezuela's biggest cities—followed the opposite trajectory: it was anti-AD for decades and later became anti-Chávez, but strongly endorsed Chávez in 1998, with a Chávez vote share in the 72nd percentile nationwide (Figure 2). Yet other districts remained anti-AD/anti-Chávez or pro-AD/pro-Chávez throughout, with no blip in 1998 (e.g., Chacao and Rojas, respectively, Figure 2c). Thus in every election except 1998, Unión voted with Rojas and Maracaibo with Chacao; in 1998, in contrast, Unión voted with Chacao and Rojas with Maracaibo. These examples illustrate the dynamic behind the temporary scrambling of Venezuela's electoral map.
Four examples to illustrate the dynamic of fleeting realignment. The evolution of vote share in these four municipalities illustrates the dynamic driving the temporary-realignment result in Figure 1. Each line plots one municipality's percentile in the distribution of AD vote share (through 1993, marked with circles) and then of Chávez vote share (from 1998, marked with diamonds). (a) Unión was pro-AD from 1958 to 1993 and later became Chavista—but ranked among the least-Chavista municipalities in 1998. (b) Maracaibo was anti-AD from 1958–1993 and later became anti-Chávez—but not in 1998. (c) Yet other municipalities voted as expected in 1998. (a) Pro-AD, then Pro-Chávez—except in 1998: Unión, Falcán, (b) Anti-AD, then Anti-Chávez—except in 1998: Maracaibo, Zulia. (c) No blip in 1998: Rojas, Barinas (top) and Chacao, Miranda.
We interpret this result as evidence that the 1998 election induced a fleeting electoral realignment, the result of a momentary shift in the dimension of political conflict. Rather than capture one or another traditional voting bloc, Chávez won with the support of voters from across the traditional political spectrum. But this strange-bedfellows coalition quickly splintered. This fact is difficult to reconcile with the idea that voters correctly anticipated the content of Chávez's early power grabs, deemed those power grabs in their own material interest, elected Chávez accordingly, and were satisfied with the consequences. Rather, our finding of a fleeting electoral realignment is consistent with the idea that people did not get what they voted for.
2.2 Voting in 1998 was less tied to socio-economic status than voting in other elections
These results suggest the presence of (roughly) two winning coalitions in Venezuela: the old Adeco (pro-AD) coalition that later reelected Chávez, and the coalition that brought Chávez to power in 1998. We now characterize these two coalitions. To use a reductive but perhaps useful shorthand, the first coalition—the old Adeco coalition that later became Chavismo—united poorer, less-educated, and rural voters against wealthier, more-educated, more-urban opponents (for additional evidence of strong socio-economic differences in AD support, see Baloyra and Martz, Reference Baloyra and Martz1979, 75).Footnote 12 The latter—Chávez's 1998 coalition—united a heterogeneous group of anti-system voters: “alienated but educated” city dwellers (as Myers, Reference Myers1975, characterized Venezuela's anti-system vote in the 1970s), scattered rural elites (Gates, Reference Gates2010), business rivals of Chávez's opponent in the 1998 election (Santodomingo, Reference Santodomingo1999; Gates, Reference Gates2010), a faction of the traditional elite left (such as the Movimiento al Socialismo; see also Morgan, Reference Morgan2011), voters concerned about crime (Pepinsky, Reference Pepinsky2017; Kronick, Reference Kronick2020), and also the urban poor (Canache, Reference Canache2002b). This potpourri was more socioeconomically diverse than the old AD coalition (cf. Ellner, Reference Ellner, Ellner and Hellinger2003, 19). Far from an unprecedented bloc of poor and left-wing voters, Chávez's initial coalition picked up a diverse anti-system current in Venezuelan politics. Across districts, his vote share was correlated with that of past anti-system candidates on the left and on the right (Appendix C).
This characterization resonates with the work of scholars who emphasize that Chávez's initial supporters “hailed from all walks of life” (Weyland, Reference Weyland2003, 836) and that his 1998 coalition “united different classes” (Corrales, Reference Corrales2005, 106). Handlin (Reference Handlin2017) argues that, in 1998, voters’ enthusiasm for institutional change spanned social classes and cut across the left–right dimension of conflict. Our findings support these accounts, contradicting work that instead highlights a sharp class cleavage in early voting for Chávez and his referenda (e.g., Buxton, Reference Buxton, Ellner and Hellinger2003: 123; Ellner, Reference Ellner, Ellner and Hellinger2003; Acemoglu et al., Reference Acemoglu, Robinson and Torvik2013b). Our findings are consistent with the idea of a shift in the dimension of conflict, of the type described by Schofield (Reference Schofield2003) and Miller and Schofield (Reference Miller and Schofield2003).
We provide new empirical evidence. Previous work has relied largely on qualitative data and on analysis of a handful of surveys taken immediately before the 1998 election. These intra-survey correlations are informative, but different scholars have used the same data to draw conflicting conclusions about the relative importance of socio-economic status in explaining vote choice in 1998 (e.g., Roberts, Reference Roberts, Ellner and Hellinger2003, 134; Seawright, Reference Seawright2012, 66–67). We instead use two new sources of data: a collection of historical public opinion surveys, and, beginning in 1998, a voting-booth-level correlate of socio-economic status. These data allow us to evaluate whether voting was more or less tied to socio-economic status in 1998 than in other presidential elections. We find that, far from sharpening class cleavages in voting, the 1998 election dulled them.
First, using the public opinion surveys, we consider the relationship between educational attainment and (self-reported) vote choice in each election.Footnote 13 Education is often used to study the class bases of political parties in Latin America (Canton and Jorrat, Reference Canton and Jorrat2002; Lupu and Stokes, Reference Lupu and Stokes2009), and Handlin (Reference Handlin2013) makes a strong case for it in Venezuela in particular. An index of education and wealth might better capture socio-economic status (Handlin, Reference Handlin2013), but we cannot consistently measure wealth across these surveys.Footnote 14
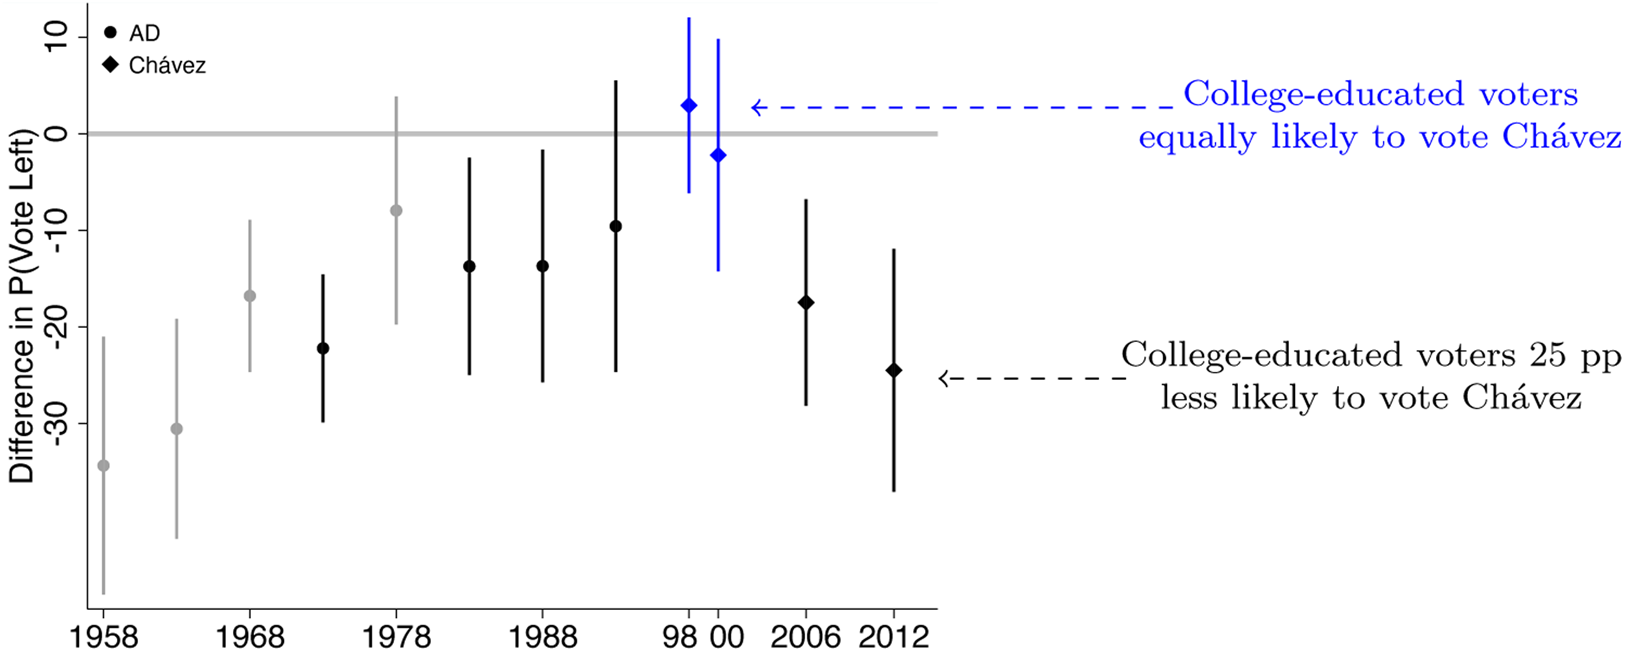
For each election 1958–1993, we estimate the difference between (i) AD vote share among those with at least college education (high school in ≤1973) and (ii) AD vote share among those with less than primary education. For 1998–2012, we estimate an analogous difference for Chávez's vote share:

where VoteADit, VoteChávezit, Collegeit, and <Primaryit are indicators for each voter's (self-reported) vote choice and educational attainment.
We find a steep education–voting gradient in every presidential election except 1998 and 2000. Between 1958 and 1993, college-educated voters were much less likely to vote AD than voters who did not finish primary school (Figure 3); similarly, in 2006 and 2012, college-educated voters were much less likely to vote Chávez than those who did not finish primary school. These differences are intuitive: both AD and Chávez sat to the left of their main rivals on the ideological spectrum (Baloyra and Martz, Reference Baloyra and Martz1979, 119; Lupu, Reference Lupu2016, 103). But in 1998 and 2000, the education-voting gradient flattened. In those elections, the most- and least-educated voters were equally likely to vote for Chávez.Footnote 15
Voting tied to education in every year except 1998 and 2000. Points mark estimates from Equation (1): the difference between (i) AD vote share among college graduates (high school in ≤1973)$^{{\dagger}}$ and (ii) AD vote share among those without primary education, for 1958–1993; for 1998–2012, analogous quantities for Chávez's vote share. $^{{\dagger}}$
 We pool high school and college education in ≤1973 because there are too few college-educated respondents. Sources: 1973 survey from Baloyra and Martz (Reference Baloyra and Martz1973); 1983 survey from Baloyra and Torres (Reference Baloyra and Torres1983); 1988 survey from Baloyra and Torres (Reference Baloyra and Torres1983); 1993–2006 surveys from Lupu (Reference Lupu2010); 2012 from LAPOP (2012). Grayed-out points rely on retrospective reports from later surveys rather than contemporaneous responses; readers may therefore take them with a grain of salt.
Relative to other survey-based evidence, ours has the advantage of drawing comparisons across many elections. But our analysis does not escape known problems of using survey self-reports to study correlates of voting behavior. For one thing, stated vote intentions may differ from actual votes cast, and this intention–behavior gap may covary with education. For another, educational attainment—the only aspect of socio-economic status that is consistently measured across all of the surveys in our data—captures only one part of what we seek to estimate.
For these reasons, we also use administrative data to study the relationship between vote choice and socio-economic status, finding a similar pattern. In particular, for 1998 and subsequent elections, we pair electoral returns at the voting booth level with a voting-booth-level, election-specific measure of formal-sector employment.Footnote 16 We construct this measure using data that other researchers scraped from the website of Venezuela's social security institute. These data, which Hsieh et al. (Reference Hsieh, Miguel, Ortega and Rodriguez2011) and Guerra Guevara (Reference Guerra Guevara2019) generously shared with us, indicate which individuals held formal-sector employment in which years. We merge this person-specific formal-employment indicator to the voter registry, allowing us to estimate the proportion of registered voters in each booth who held formal-sector employment in the two years prior to each election, or percent formal.Footnote 17 This proportion, which varies across voting booths from 0 to 40 percent (see Appendix Figure D.3), captures a meaningful component of socio-economic status in Venezuela: Ellner (Reference Ellner2012), for example, describes informal-sector workers as marginalized or semi-marginalized (108).
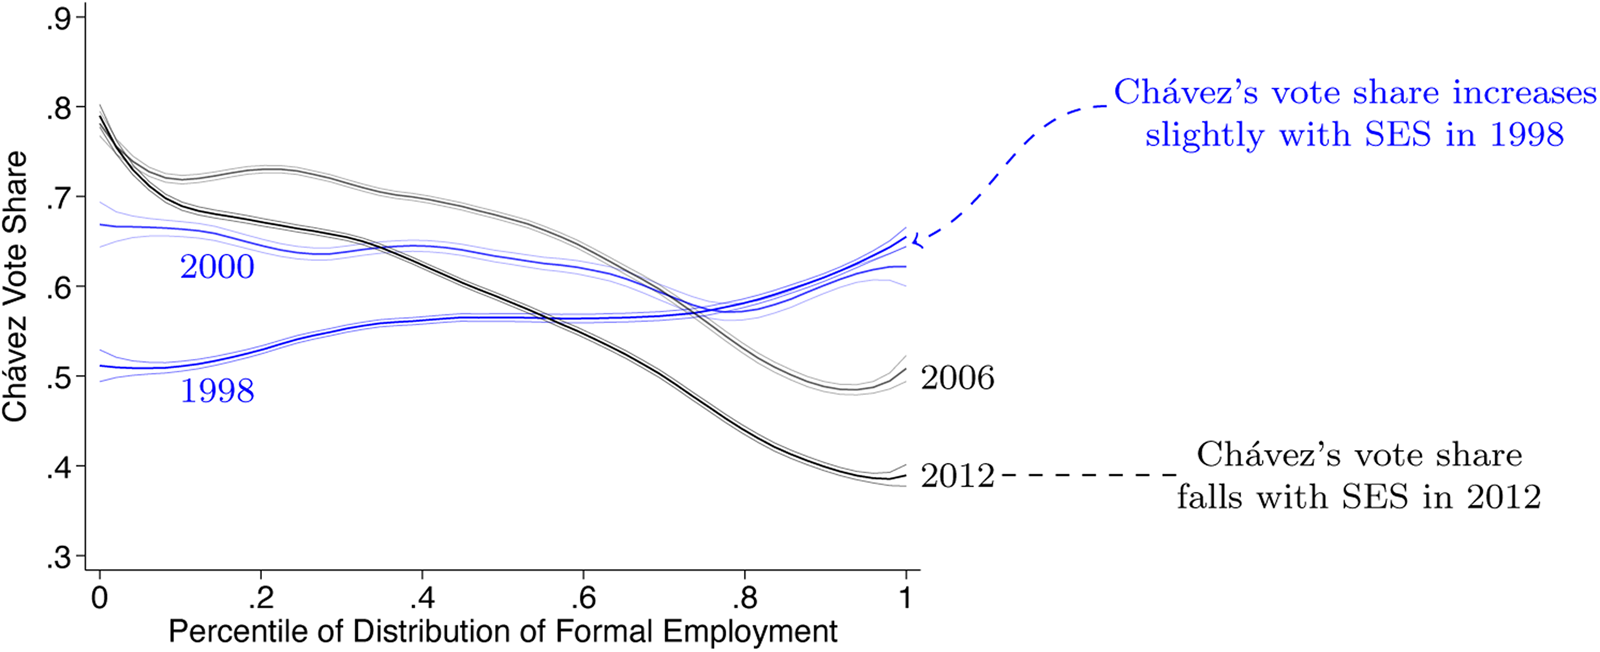
Because the distribution of percent of voters with formal-sector employment is skewed, and because the maximum changes over time (see Appendix Figure D.3), Figure 4 plots Chávez's vote share against each voting booth's percentile in the election-specific distribution of percent formal (such that observations are distributed uniformly along the x-axis by construction). The results echo those of the survey analysis in Figure 3. In 1998, Chávez's vote share actually increased slightly with the proportion of voters with formal-sector employment; by 2006, in stark contrast, voting booths with the highest proportions of formal-sector voters supported Chávez at rates 30 percentage points lower than those of voting booths with the lowest percent formal. By 2012, the difference had widened to 40 percentage points.
Voting–SES gradient reverses after 1998. This graph uses voting-booth-level data (N = 10K–30K) to plot the relationship between Chávez's vote share (y-axis) and a measure of socio-economic status (increasing along the x-axis), specifically, each voting booth's percentile in the distribution of the fraction of voters with formal-sector employment. Consistent with Figure 3, Chávez's vote share actually increased slightly with SES in 1998, turned negative in 2000, and then became more negative in 2006 and 2012. Individual-level data on formal-sector employment were scraped from the Venezuelan Social Security Institute (IVSS) and shared with us by Hsieh et al. (Reference Hsieh, Miguel, Ortega and Rodriguez2011) and Guerra Guevara (Reference Guerra Guevara2019). Individual-level voter registration and voting-booth-level electoral returns published by the Venezuelan electoral council.
This finding, which emerges both from survey data and from administrative data, is hard to reconcile with the hypothesis that the 1998 election sharpened class cleavages in voting, or with the notion that Chávez won in 1998 primarily by mobilizing lower-class voters (though it is consistent with Ellner's view that “following his original electoral triumph Chávez relied increasingly on the support of the marginalized sectors,” Reference Ellner, Ellner and Hellinger2003, 20, emphasis added; see also Dunning Reference Dunning2008, 174). Instead, our findings support the idea that Chávez's initial coalition drew voters from across the socio-economic spectrum and from across traditional political divides.
2.3 Chávez campaigned on institutional change
In Svolik (Reference Svolik2020), incumbents get away with subverting democracy by exploiting left–right polarization. Voters don't value autocratic maneuvers for their own sake; rather, they accept packing the electoral council (e.g.) as the price they pay for an executive with favorable distributional policies.
This implies a prediction for campaign rhetoric: candidates should flaunt their economic policies and hide their plans to rewrite the rules. In Chiopris et al. (Reference Chiopris, Nalepa and Vanberg2021) and Luo and Przeworski (Reference Luo and Przeworski2019), elected autocrats rely on stealth: voters don't hear about institutional change one way or the other. In contrast, our proposal of a shift in the dimension of political conflict implies active campaigning on institutional change (Miller and Schofield, Reference Miller and Schofield2003; Schofield, Reference Schofield2003).
The Venezuelan case is long on anecdotal examples of such campaigning. Chávez named his political party the Fifth Republic Movement, an expression of his intent to re-found the nation.Footnote 18 On the campaign trail, he referred to the Venezuelan political system as a “moribund democracy” and proposed a constituent assembly (Chávez Frías, Reference Chávez Frías1998). He slammed his political opponents for trying to “put makeup on rot,” declaring himself the only candidate who would take the necessary step of “eradicating the rot,” even comparing himself to a doctor excising cancer from the body politic (ibid). Handlin (Reference Handlin2017), based on interviews and press accounts, concludes that Chávez attempted to “reframe the presidential contest itself as a referendum on [rewriting the constitution]” (87).
Of course, we could also provide examples of Chávez lamenting the plight of the poor and emphasizing economic policy. To characterize his rhetoric somewhat more systematically, and to compare it with that of Henrique Salas Römer—Chávez's principal opponent in the 1998 presidential campaign—we focus on a small set of television interviews: those conducted on the long-running talk show Front Page, hosted by network executive Marcel Granier. During the campaign, Granier interviewed Chávez once and Salas Römer three times. Each of the four interviews lasted approximately 60 minutes. The limitation of this approach is that the corpus is small; the advantage is that it allows us to observe both candidates in roughly similar settings.
We approach the Front Page interviews in two ways. First, we estimate and compare the frequency with which each candidate addressed two particular topics: institutional change and poverty.Footnote 19 Second, we describe the interviews qualitatively.
To estimate the prevalence of our two topics of interest in this corpus, we first construct topic-specific dictionaries. Using pre-trained word embeddings, we identify terms that tend to co-occur with the seed words constituent assembly (for the institutional change topic) and poverty (see Appendix A for details). We then use the resulting dictionaries to estimate the prevalence of each topic in each candidate's Front Page appearances. Table 1 presents the results. Chávez spoke about the constituent assembly at approximately twice the rate of Salas Römer, while Salas Römer spoke much more (than Chávez) about poverty and inequality. Moreover, while both candidates devoted more time to institutional change than to poverty, the difference was considerably larger (both in absolute terms and in relative terms) for Chávez than for Salas Römer. Given the small size of the corpus, these results are far from definitive. But they are consistent with the widely held view of Chávez as a candidate who campaigned on his proposal to remake Venezuela's political institutions.
Chávez stressed constitution, opponent talked more about poverty
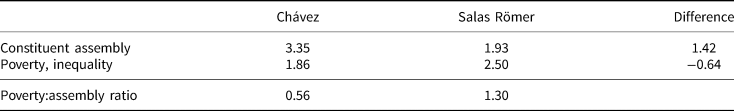
Using topic-specific dictionary words (see main text), we compare the (normalized) frequency with which Chávez and his opponent addressed two themes—the constituent assembly and poverty—during appearances on the television show Front Page.
Theme prevalence per 1000 words.
Qualitatively, the Front Page interviews help clarify why there was ambiguity about the direction of institutional change under Chávez, despite his past as leader of a (failed) coup d'etat. We address three points: (1) how he described his vision for a new Venezuelan democracy, (2) the coup itself, and (3) Chávez's language toward his political opponents.
Many accounts portray Chávez in 1998 as a candidate who promised to raze horizontal accountability, empower the president, and promote majoritarian institutions. We argue that this is a reading colored by hindsight. Far from promising to dismantle checks and balances, candidate Chávez vowed to curb Venezuela's presidentialism, “which still [had] an imperial feel” (Table 2). He proposed to introduce a prime minister, to establish a fourth branch of government, to promote a more federal state, and to advance “a real process of decentralization and de-concentration of power.” The communication director for the Salas Römer campaign, Miguel Rodríguez Siso, said in an interview for this project that Chávez “appropriated the decentralization proposal” that Salas Römer (as governor of a major state) had long championed, echoing Salas Römer's own comments in one of his interviews on Primer Plano (Table 2). This is not to say that there were no signs that Chávez would move in a majoritarian or delegative direction; for one thing, he proposed to hold a referendum on convening a constituent assembly, thus embracing the “plebiscitary appeals” that are a hallmark of anti-system populism (Barr, Reference Barr2009). Yet these signs were sufficiently ambiguous that several veterans of Venezuela's decade-old decentralization efforts joined the Chávez campaign, lending credibility and credence to his claim to carry the mantle of democratizing reform.
Comparison of campaign rhetoric from TV interviews on Front Page
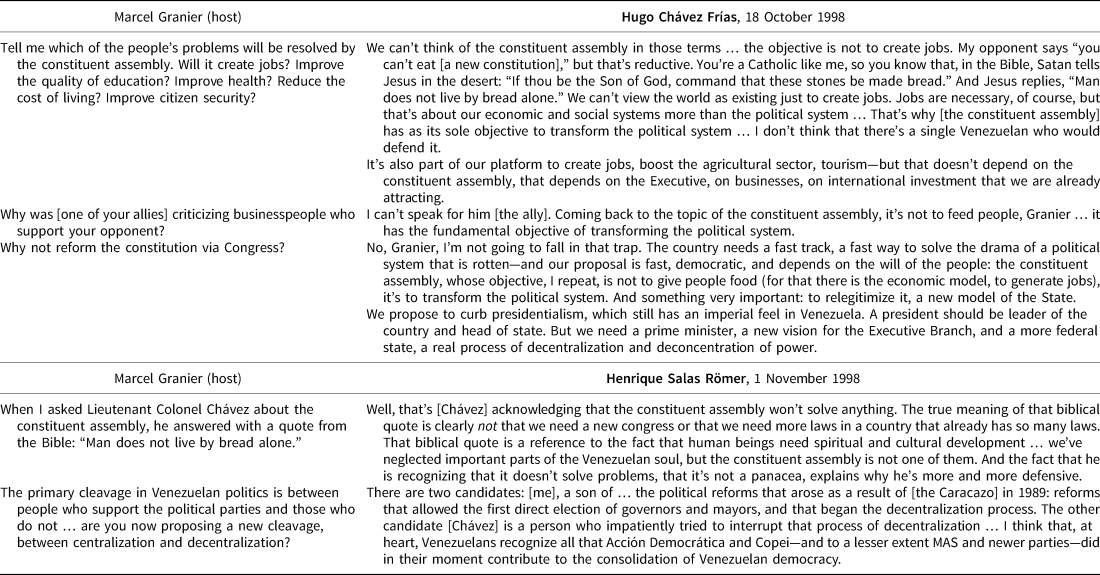
Nor did Chávez imply that the new political institutions would shift economic policy in one direction or another. Indeed, he explicitly and repeatedly separated the constituent assembly from specific economic policy outcomes, allowing voters to project their own hopes onto a vague vision. Asked whether the constituent assembly would solve Venezuelans’ material problems, Chávez cited Jesus saying “Man does not live by bread alone” and explained that economic outcomes “do not depend on the constituent assembly” (Table 2). The objective of the constituent assembly was “not to feed people,” Chávez said, and, in case anyone missed it: “the objective, I repeat, is not to give people food.” We view these statements as evidence of an effort to deemphasize the mapping from political institutions to economic policy (to say nothing of economic outcomes).
Similarly, some scholars interpret Chávez's past as the leader of a (failed) coup d'etat against the elected government of Carlos Andrés Perez as an unmistakable sign of authoritarian intentions, part of an “obvious antidemocratic record” (Levitsky and Ziblatt, Reference Levitsky and Ziblatt2018, 21). But Chávez told voters that his resort to violence had been valid only because then-president Pérez had himself used violence, sending security forces to kill hundreds of civilians (see Table 2). Asked whether a coup would be justified against the unpopular administration of Rafael Caldera, Chávez answered with an emphatic no, emphasizing that, whatever Caldera's failings, his “was not a government that had sent troops to fire on the people.” This ambiguity is consistent with the conclusion of Canache (Reference Canache2002a), who studies the evolution of support for Chávez between 1995 (three years after his coup attempt) and 1998. Using two public opinion surveys, Canache finds that, in 1995, Chávez drew most of his support from the minority of Venezuelans who expressed ambivalence about democracy. By 1998, in contrast, Chávez drew at least half of his support from Venezuelans unequivocally committed to democracy. For Canache, this result supports the converted militant hypothesis: that Chávez successfully convinced a significant fraction of voters that he would protect democracy. In fact, some of the most committed democrats in Venezuelan politics in the 1990s (e.g. Teodoro Petkoff; Handlin, Reference Handlin2017) were themselves converted militants, having left the guerrilla after the 1960s. For these reasons, we contend that Chávez's history did not entirely negate his claim that he would democratize Venezuelan political institutions.
Moreover, the most dramatic alleged example of Chávez's violent language was fabricated. An influential attack ad apparently included audio of him promising to “eliminate Adecos from the face of the earth, fry their heads in oil, and dissolve them in acid.” Marcel Granier, host of Primer Plano, repeated this line in his interview with Salas Römer. But, as it turned out, someone had hired actor Gonzalo Cubertos to impersonate Chávez saying these lines; when Cubertos publicly admitted this, the Venezuelan electoral council ordered the attack ad off the air, allowing Chávez to tell audience after audience that the fabrication was evidence of his commitment to peace: if his discourse were really so violent, he pointed out, his opponents would not have had to fabricate evidence to the contrary (Socorro, Reference Socorro2018).
3 Alternative explanations
We interpret these three findings as evidence that Chávez first won election not primarily by exploiting class conflict but rather by tapping into cross-cutting anti-system sentiment. One alternative interpretation is that the fleeting electoral realignment we observe in 1998 had little to do with Chávez and everything to do with the collapse of the Venezuelan party system (Morgan, Reference Morgan2011; Lupu, Reference Lupu2016). It stands to reason that widespread rejection of traditional parties would shuffle coalitions, at least temporarily. Yet party-system collapse does not always redraw cleavages. Seawright (Reference Seawright2012) argues that voters’ abandonment of traditional parties in Peru—comparable in magnitude to that of Venezuela—led an outsider (Alberto Fujimori) to win simply by capturing an existing bloc: the ideological right (141). Chávez, in contrast, while certainly appealing to left-wing voters, was vehemently opposed by the former icon of the Venezuelan left, while one of the country's most prominent right-wingers briefly joined Chávez's commission on rewriting the constitution (Corrales and Penfold Reference Corrales and Penfold2015, 17).Footnote 20
A second way to rationalize the cross-cutting Chávez vote as the direct result of income considerations is to follow Weyland's observation that economic losses make voters risk-loving, or at least risk-tolerant (Reference Weyland2004). If we view outsider candidates as risky, Venezuela's 1980s–1990s economic collapse should have whet voters’ appetites for outsiders. This explanation is not incompatible with ours, though (on its own) it does not clearly explain either voters’ preference for Chávez over other outsiders or the quick disintegration of the initial coalition.
Other scholars might point to the 1999 referendum on Chávez's new constitution as evidence against our emphasis on ambiguity: by then, with all 350 articles of the constitution written and published, what ambiguity might remain? Voters approved that constitution in a referendum, suggesting, perhaps, that they endorsed not only Chávez's vague call for change but also his specific, centralizing institutional reforms and their policy consequences (Acemoglu et al., Reference Acemoglu, Robinson and Torvik2013b). We would counter, first, that even after the constitution was drafted there remained considerable ambiguity about the mapping between de jure institutional arrangements and policy outcomes (Shepsle, Reference Shepsle1986, 75); Crisp (Reference Crisp2000, 234) even expressed optimism about certain features of the new electoral system. Second, Chávez's most authoritarian moves (in that period) occurred not through the constitution itself but around and outside of it, through a series of decrees not submitted to voters (Brewer-Carias, Reference Brewer-Carias2005). These decrees, the most dramatic of which arrived after the popular referendum on the new constitution, granted such power to Chávez that they alienated even some of the constitution's architects and most zealous champions.
Finally, we note that our results are not inconsistent with polarization and/or inequality as explanations for subsequent votes for Chávez (in particular, his reelection in 2006 and 2012), as proposed especially by Svolik (Reference Svolik2020). In those years, we find, the pro-versus-anti-Chávez vote did split along socio-economic lines (Handlin, Reference Handlin2013; cf. Lupu, Reference Lupu2010). Indeed, if our argument is correct, Chávez's initial coalition fell apart, requiring him to assemble a new one in its place.
4 Conclusion
In 2017, well before the election of Jair Bolsonaro as President of Brazil, a Brazilian comedy group made a video in which a woman arrives at a department store determined to exchange her president (Zorra, 2017). The salesman walks her around a showroom pointing to possible alternatives: monarchy (“classic!”), parliamentary democracy (“cool!”), and, finally, a military regime. “I like this one,” the customer says. “If anything goes wrong, I'll just bring it back.” The general on the display responds: “Take me back? I don't think so. You're stuck with me for a minimum of twenty years.” As his officers escort the customer out of the store, the salesman calls after her: “Sorry, once you activate it, it's on autopilot!”
This captures the spirit of our argument. Elected autocrats come to power not because voters correctly anticipate the consequences for (re)distributive policy but because of ambiguity about the direction of future institutional change, and because of uncertainty about the mapping between institutional arrangements and policy outcomes. Exploiting this uncertainty together with cross-cutting anti-system sentiment, Hugo Chávez won election with a mandate to democratize Venezuela—only to usurp power “by surprise” (Stokes, Reference Stokes2001), quickly alienating many of his early allies.
Our empirical analysis focuses on Venezuela, but the argument is general. Evo Morales in Bolivia and Rafael Correa in Ecuador, for example, both campaigned on promises to cure the ills of their countries’ democracies by remaking political institutions; both of the resulting new constitutions then concentrated power in their respective presidencies (Corrales, Reference Corrales2008; Corrales and Penfold, Reference Corrales and Penfold2014; Anria, Reference Anria2016, Reference Anria2018; Corrales, Reference Corrales2018). Sufficient numbers of Bolivian and Ecuadoran voters disliked this outcome that they subsequently voted to reinstate (or maintain) presidential term limits (AP, 2018; Idrobo et al., Reference Idrobo, Kronick and Rodríguez2022). These cases underscore our conclusion that ambiguity and anti-system sentiment merit renewed attention in the study of democratic deconsolidation.
Supplementary material
The supplementary material for this article can be found at https://doi.org/10.1017/psrm.2023.1.
Acknowledgments
We thank Richard Dinapoli and Nicolás Idrobo for excellent research assistance, and the Penn Program on Opinion Research and Election Studies for generous financial support. For comments, we thank Andrés Uribe, Javier Corrales, Thad Dunning, David Hausman, Marc Meredith, Francisco Monaldi, Francisco Rodríguez, Arturas Rozenas, Josh Simon, Tara Slough, Hillel Soifer, Dawn Teele, Francisco Toro, Adam Ziegfeld, and workshop participants at the University of Pennsylvania, the University of Chicago, Rice, Temple, Stanford, Davis, Harvard, Johns Hopkins, and APSA.
Conflict of interest
The authors declare none.


 Open access