





1. Introduction
Pine Island Glacier (PIG), West Antarctica, has exhibited significant changes in ice velocity and geometry over the last few decades. Between 1995 and 2017, the loss of ice from PIG raised global sea level by ~1.5 mm, with the trend of mass loss accelerating from 2 ± 1 Gt a−1 between 1992 and 1997 to 55 ± 4 Gt a−1 during 2012–2016 (see Fig. 3 in Shepherd and others, Reference Shepherd2019). It has been suggested that PIG is poised to undergo irreversible retreat, should its grounding line continue to migrate further backwards (Favier and others, Reference Favier2014). There are therefore good reasons to study the glacier and its floating extension, and it is imperative that we understand the factors responsible for its dynamical behaviour. Of particular interest in this context is the Pine Island Ice Shelf (PIIS) where it has been suggested that changes over time in the buttressing, provided by the ice shelf to the grounded ice upstream of the grounding line, are primarily responsible for the observed speed-up of the grounded sections of PIG over the last few decades (Gudmundsson and others, Reference Gudmundsson, Paolo, Adusumilli and Fricker2019; De Rydt and others, Reference De Rydt, Reese, Paolo and Gudmundsson2021; Joughin and others, Reference Joughin, Shapero, Smith, Dutrieux and Barham2021).
The term ice-shelf buttressing denotes the additional stress exerted by the ice shelf on the upstream grounded ice, as compared to the stress exerted by the ocean alone in the absence of an ice shelf. Ice-shelf buttressing can be impacted in several ways. Ocean-induced thinning of the ice shelf can, for example, reduce the buttressing forces (Gudmundsson and others, Reference Gudmundsson, Paolo, Adusumilli and Fricker2019). This process is an effective mechanism at reducing buttressing, as ocean-induced melt reaches all the way up to the grounding line where most of the buttressing is concentrated (Fürst and others, Reference Fürst2016; Reese and others, Reference Reese, Gudmundsson, Levermann and Winkelmann2018). Loss of frontal ice through calving can also impact ice-shelf buttressing if the calved area is laterally confined or partly pinned on bedrock. Another possible mechanism of ice-shelf buttressing reduction is increased fracturing and general mechanical weakening of ice (Lhermitte and others, Reference Lhermitte2020). This process is often described as ‘ice damage’ (Borstad and others, Reference Borstad2012; Krug and others, Reference Krug, Weiss, Gagliardini and Durand2014; Mobasher and others, Reference Mobasher, Duddu, Bassis and Waisman2016; Sun and others, Reference Sun, Cornford, Moore, Gladstone and Zhao2017; Clayton and others, Reference Clayton, Duddu, Siegert and Martínez-Pañeda2022).
For PIG, a recent study of De Rydt and others (Reference De Rydt, Reese, Paolo and Gudmundsson2021) suggests the frontal retreat has caused mass loss comparable with thinning between 1996 and 2016. Joughin and others (Reference Joughin, Shapero, Smith, Dutrieux and Barham2021) concluded that changes in the speed of the PIIS from 2017 to 2020 could be largely attributed to loss of significant section of the ice shelf through a series of calving events within that period, with changes in effective ice rheology through formation of localized ice-shelf fracture playing secondary role in comparison.
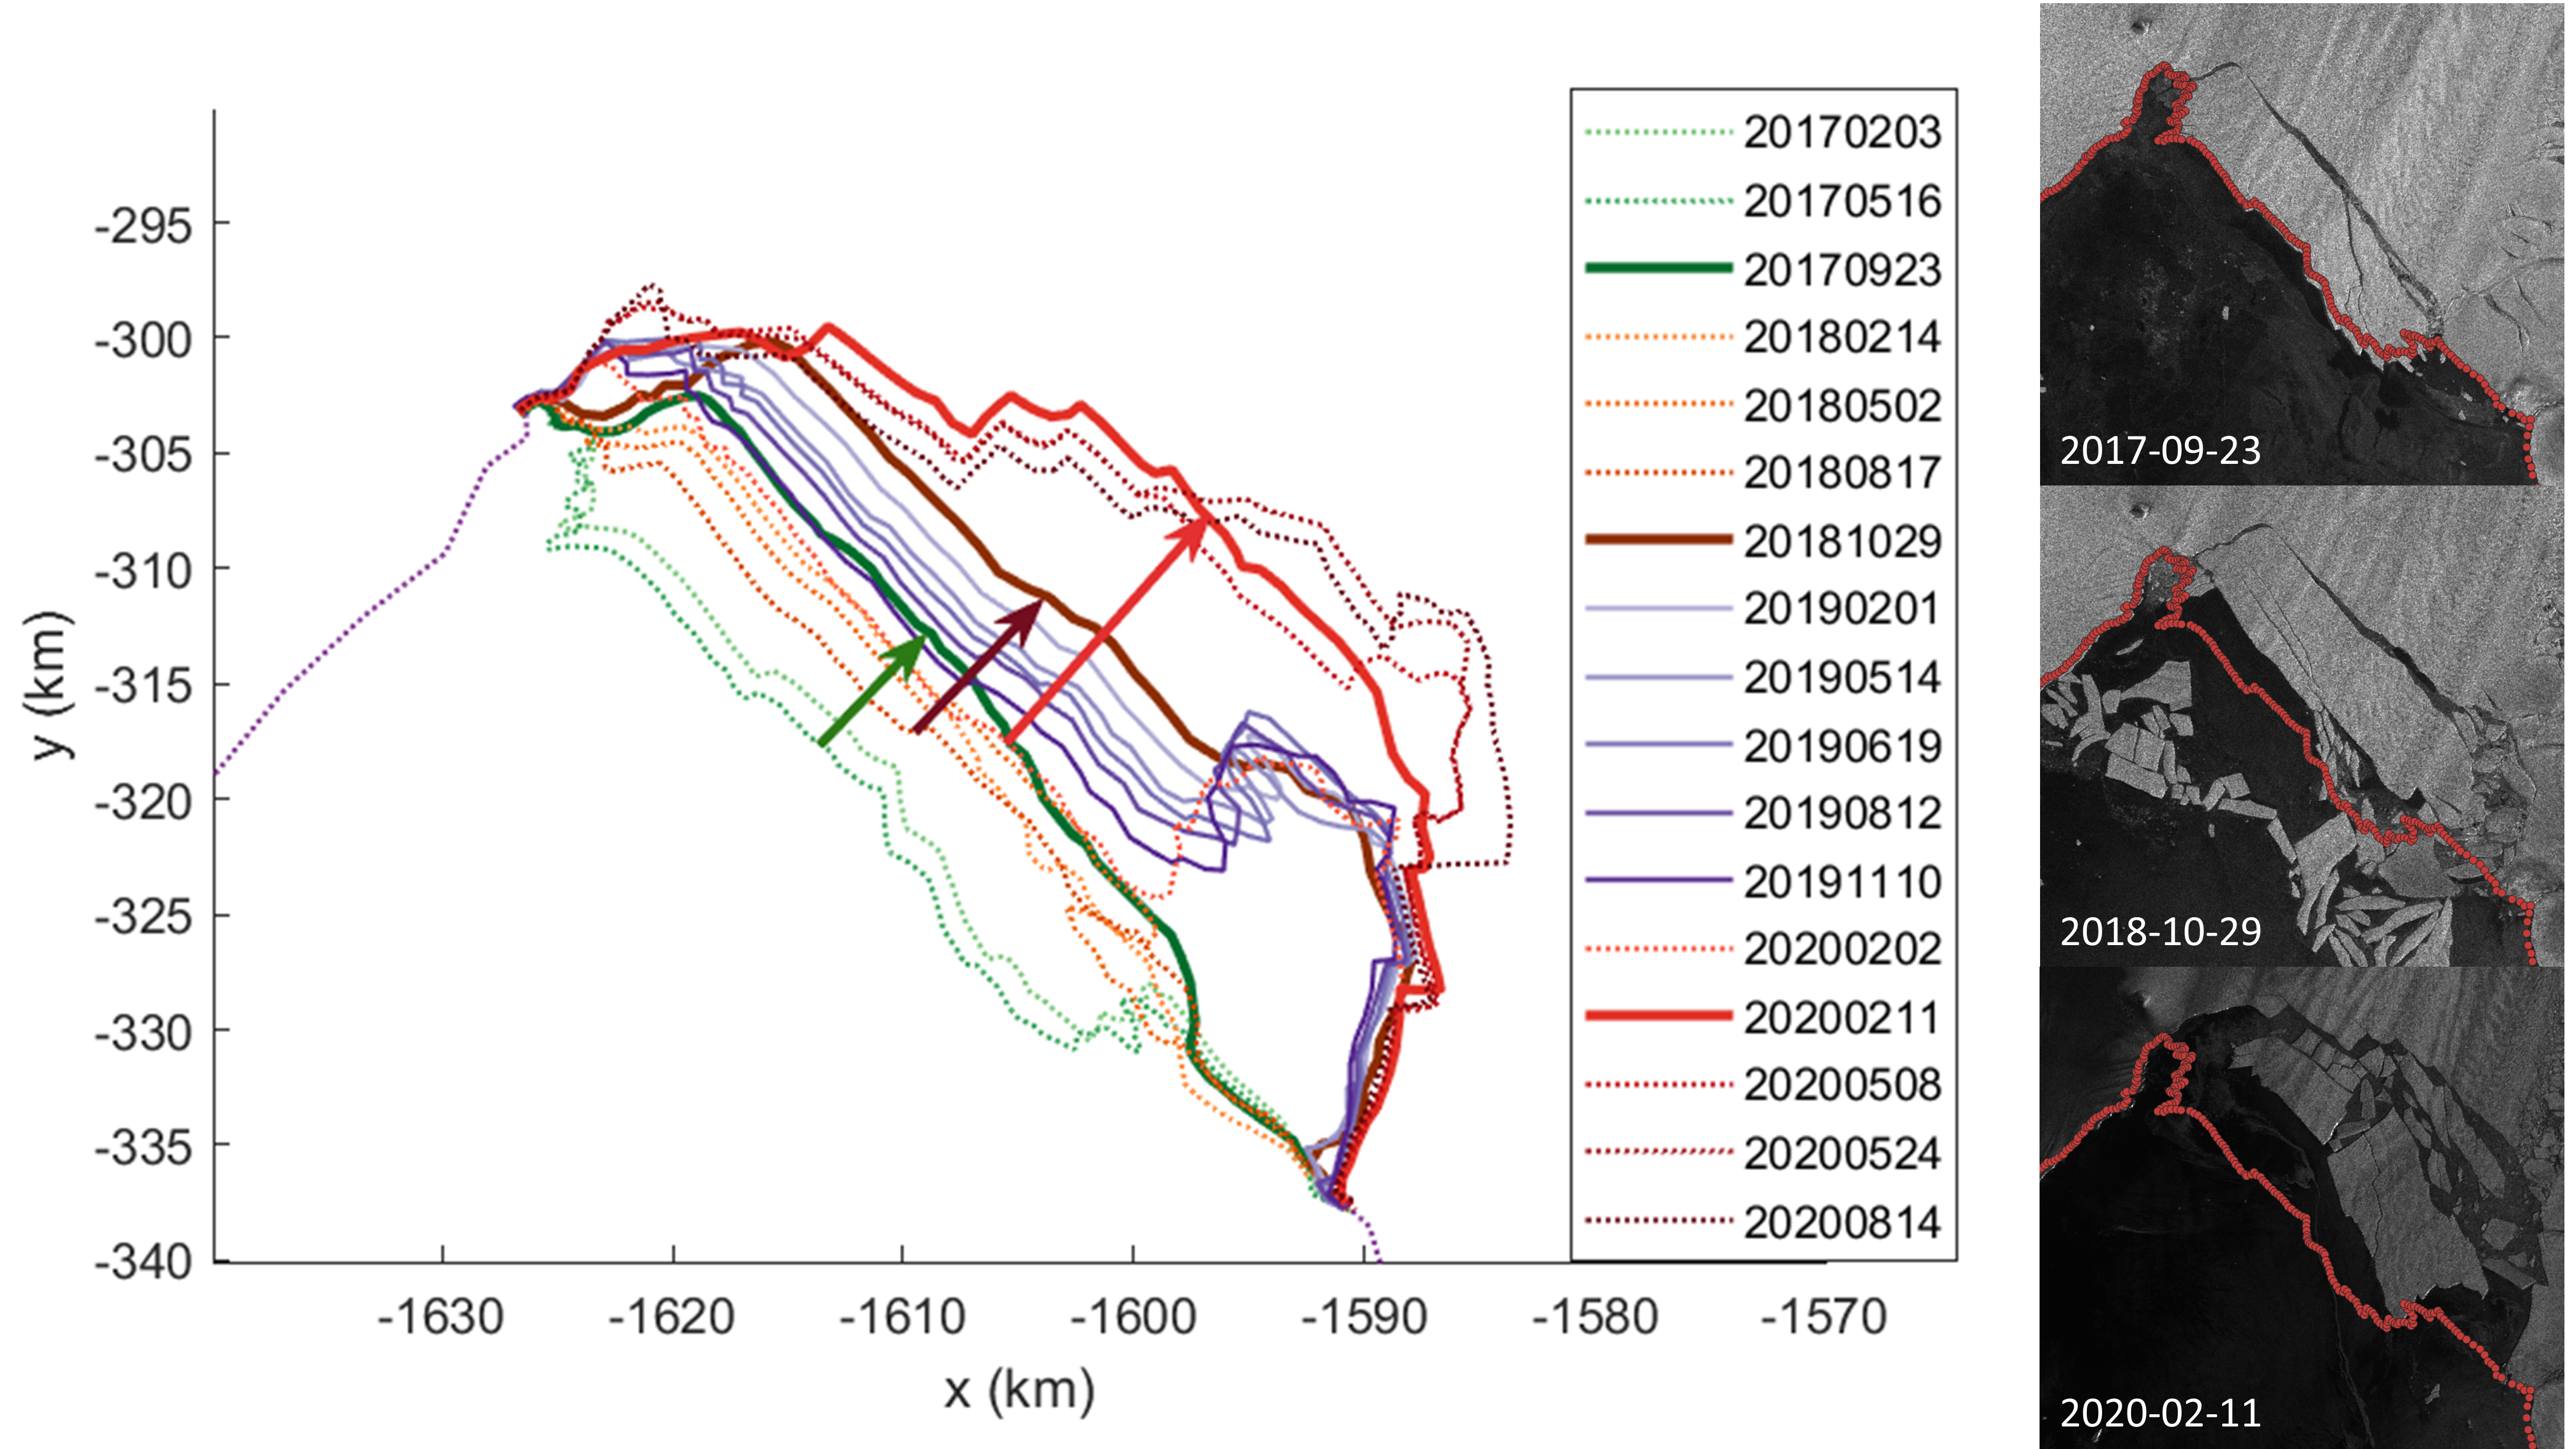
The key aim of this paper is to further investigate the importance of three processes: ice-shelf thinning, calving and damage evolution in impacting recent flow behaviour of PIIS. A series of recent calving events has provided an excellent opportunity to do this, and observations and modelling has already suggested that these calving events were sufficiently large to cause measurable changes in ice flow (Joughin and others, Reference Joughin, Shapero, Smith, Dutrieux and Barham2021). From 2017 to 2020, three calving events took place (Fig. S1, movies 1 and 2). After each calving event, the ice front advanced but never reached its original location before the next calving event, i.e. the calving rate was larger than the frontal ice velocity between 2017 and 2020.
In ice-flow models, damage is often considered resulting from fracture processes impacting the effective structural integrity of the ice. When the ice is treated as a continuum, the resulting impact on the rheology is sometimes included by modifying the ice softness A in Glen's flow law, i.e. $\,\dot{\!{\epsilon }} = A{\rm \tau }^n$ , where $\,\dot{{\! \epsilon }}$
 is the effective strain, τ the effective stress and A and n are the rheological parameters (Krug and others, Reference Krug, Weiss, Gagliardini and Durand2014; Sun and others, Reference Sun, Cornford, Moore, Gladstone and Zhao2017; Huth and others, Reference Huth, Duddu and Smith2021). In reality, A is also influenced by several other processes such as developing fabric, anisotropy and changes in englacial temperature (Cuffey and Paterson, Reference Cuffey and Paterson2010). Detailed assessment of changes in damage therefore requires modelling those processes, and in particular englacial temperature, T. However, we can define areas committed to damage where the estimated value of the ice-softness factor A higher than the maximum possible value obtained for temperate ice. This maximum value for intact temperate ice has been estimated from lab experiments to be about 1.67 × 10⁻⁷ kPa−3a−1 (e.g. Spring and Morland, Reference Spring and Morland1983; Cuffey and Paterson, Reference Cuffey and Paterson2010), and 0.74 × 10⁻⁷ kPa−3a−1 from ice-flow modelling of a temperate glacier (Gudmundsson, Reference Gudmundsson1999). Here, we provide such a lower estimate of damage by calculating the damage mask M defined as having numerically the value unity over areas where estimated A is larger than the experimentally determined maximum possible value of A, i.e. that for temperate ice (Cuffey and Paterson, Reference Cuffey and Paterson2010), and zero otherwise.
Our primary interest is in determining if ice damage changes over time, and specifically if ice-flow modellers may need to include changes in ice damage to describe changes in the flow field of PIIS over 2017–2020, for which accurate estimates of ice velocity changes are available at 3-month intervals. We do this by conducting a series of numerical perturbation experiments to test several hypotheses, starting with the hypothesis that all observed changes in ice-shelf velocities from 2017 to 2020 were due to calving alone, with no significant additional impact due to changes in ice thickness or ice damage.
Specifically, we consider these three hypotheses:
H1: By optimizing the basal slipperiness over time, the ice-flow model can reproduce observations to better than some tolerance when the calving front changes are prescribed as observed, and the ice softness and thickness are fixed.
H2: By optimizing the basal slipperiness over time, the ice-flow model can reproduce observations to better than some tolerance when the calving front and thickness changes are prescribed as observed, and the ice softness is fixed.
H3: By optimizing the basal slipperiness and ice softness over time, the ice-flow model can reproduce observations to better than some tolerance when the calving front and thickness changes are prescribed as observed.
Thus, we only introduce ice damage as a potential contributing factor once other alternatives have been rejected. The tolerance we use is 5% of observed speed.
Joughin and others (Reference Joughin, Shapero, Smith, Dutrieux and Barham2021), using the same dataset, concluded that changes in damage only played secondary role in the 2017–2020 response. As we show below, while our results broadly agree with those presented in Joughin and others (Reference Joughin, Shapero, Smith, Dutrieux and Barham2021), we nevertheless find that observed velocity changes cannot be fully replicated without introducing changes in ice damage within the ice-shelf margins.
2. Materials and methods
2.1 Data
Using an ice-flow model, we test the hypotheses H1–H3. For this, we utilize several datasets including (i) measurements of ice-flow velocities, which we obtain from Joughin and others (Reference Joughin, Shapero, Smith, Dutrieux and Barham2021), (ii) bedrock geometry and glacier upper and lower surface topographies, which are based on the BedMachine Antarctica, V2 (Morlighem and others, Reference Morlighem2020), (iii) estimates of ice-shelf thinning rates, which are based on Adusumilli and others (Reference Adusumilli, Fricker, Medley, Padman and Siegfried2020) and Bamber and Dawson (Reference Bamber and Dawson2020) and (iv) changes in calving front positions, which we extracted from Landsat 8 and Sentinel 1 A/B satellite imagery.
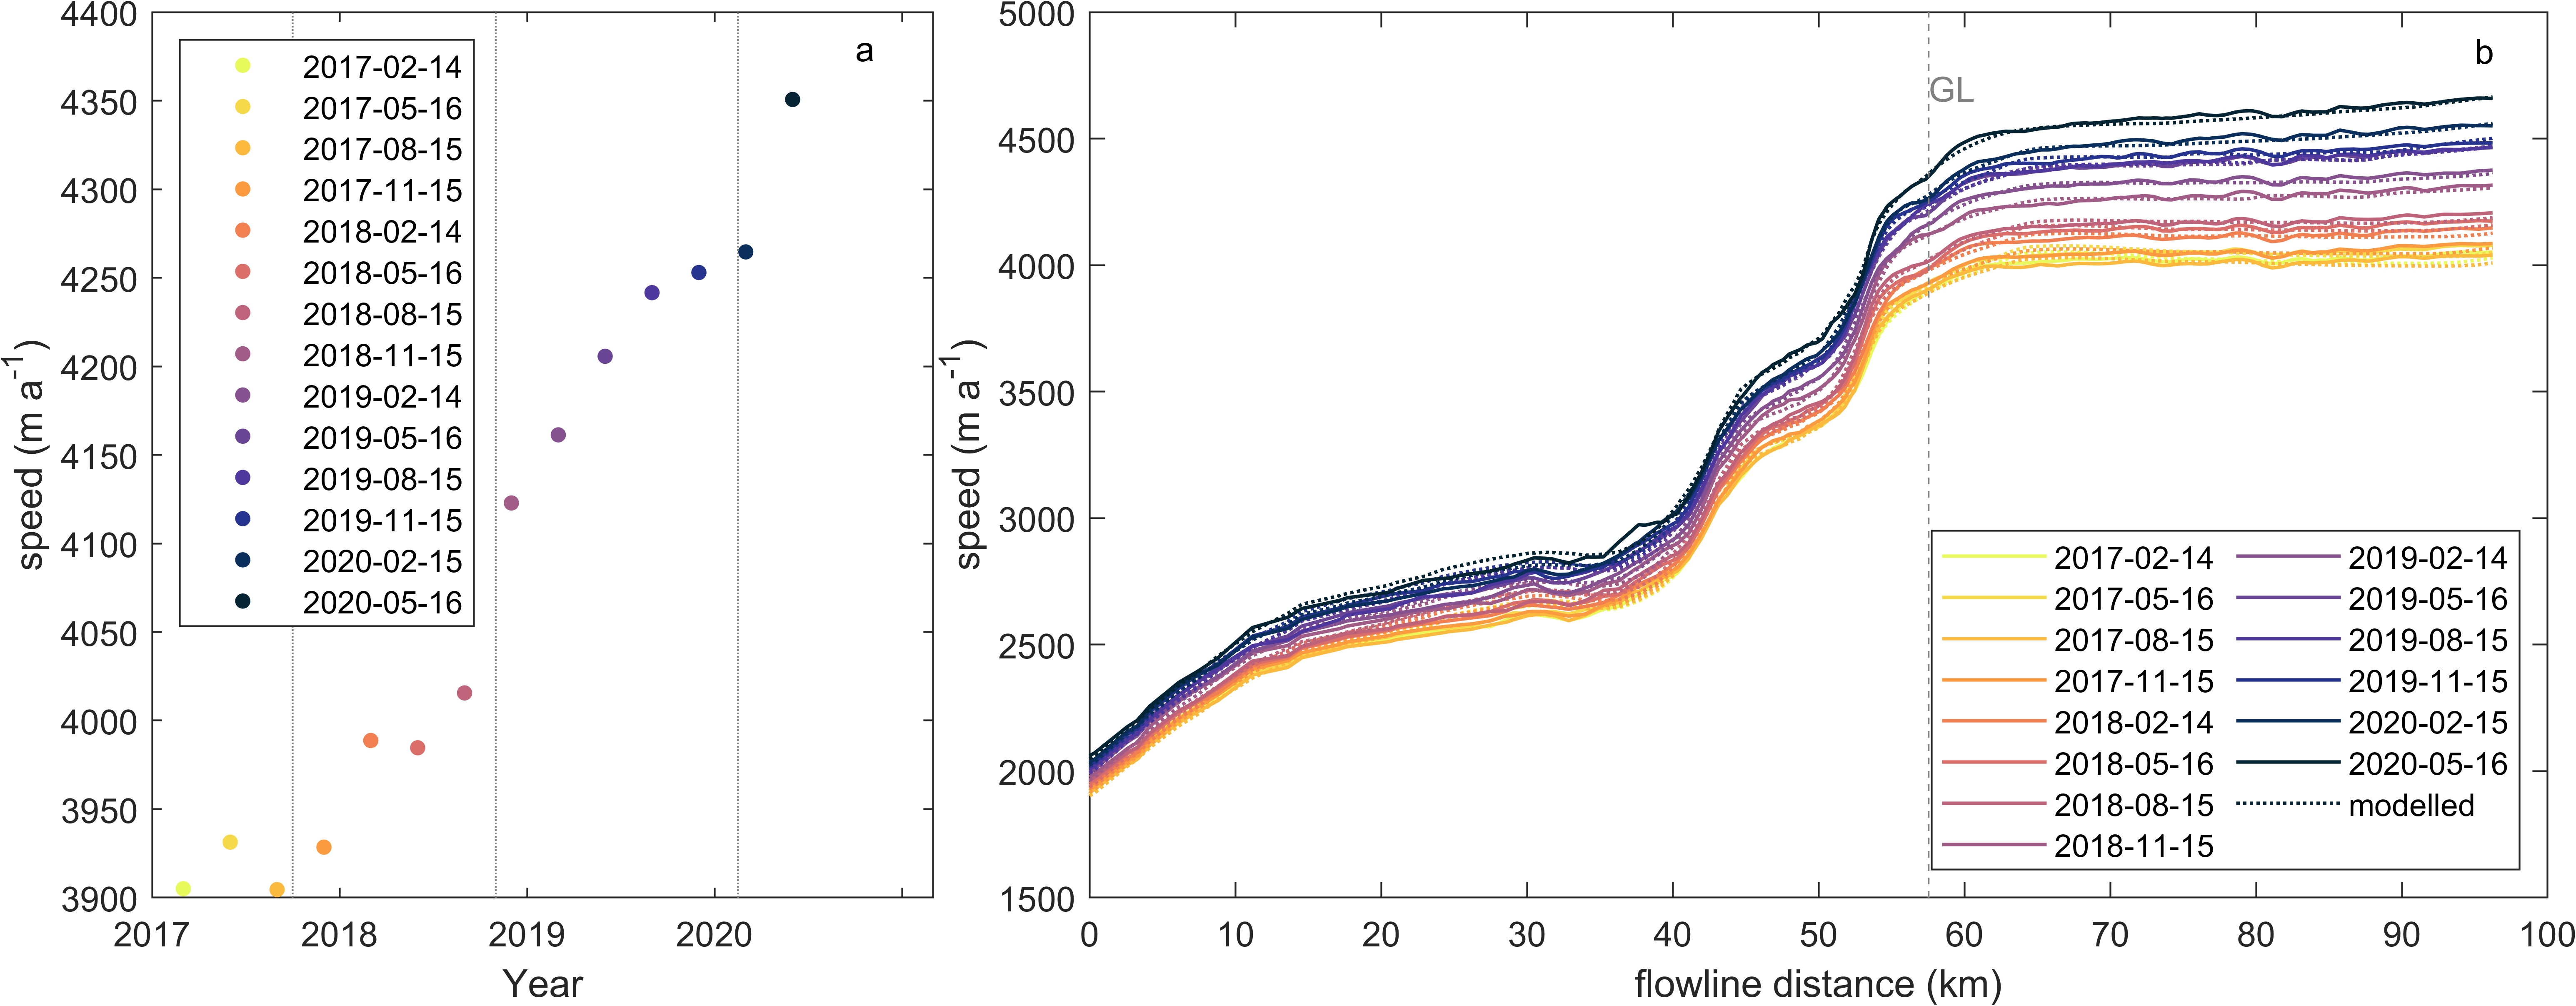
Figure 1 and Fig. S2 present changes in velocity across the ice shelf (Fig. 1), at the grounding line (Fig. S2a), and along the flowline (Fig. S2b) starting upstream from the grounding line and extending to the calving front. As discussed in Joughin and others (Reference Joughin, Shapero, Smith, Dutrieux and Barham2021), the observational data show significant temporal variability in ice-flow speeds during the period from 2017 to 2020.
Measured ice-flow speed and ice velocity changes of Pine Island Glacier and its location (red box in inset). The background map is ice-flow speed derived from Sentinel 1A/B on September 2019. The purple lines indicate the position of the grounding line. The overlaid arrows present the difference of the velocity fields between 15 February 2020 and 14 February 2017, that is before the first calving event on 23 September 2017 and after that last calving event on 11 February 2020. All datasets are based on Joughin and others (Reference Joughin, Shapero, Smith, Dutrieux and Barham2021).

Three substantial calving events took place between 2017 and 2020 (Fig. S1, movie 2). The first calving event took place on 23 September 2017 with frontal retreat of ~7 km, the second one on 29 October 2018 with frontal retreat of ~10 km and the third and the final one within the observation period took place on 11 February 2020 with frontal retreat of ~19 km (Fig. S1). From 2018 onwards, the southern margin experienced more retreat, and satellite imagery reveals both progressive backwards migration of the calving front and concomitant increase of crevasses extent and density within the southern lateral margin (Fig. S1).
2.2 Methodology
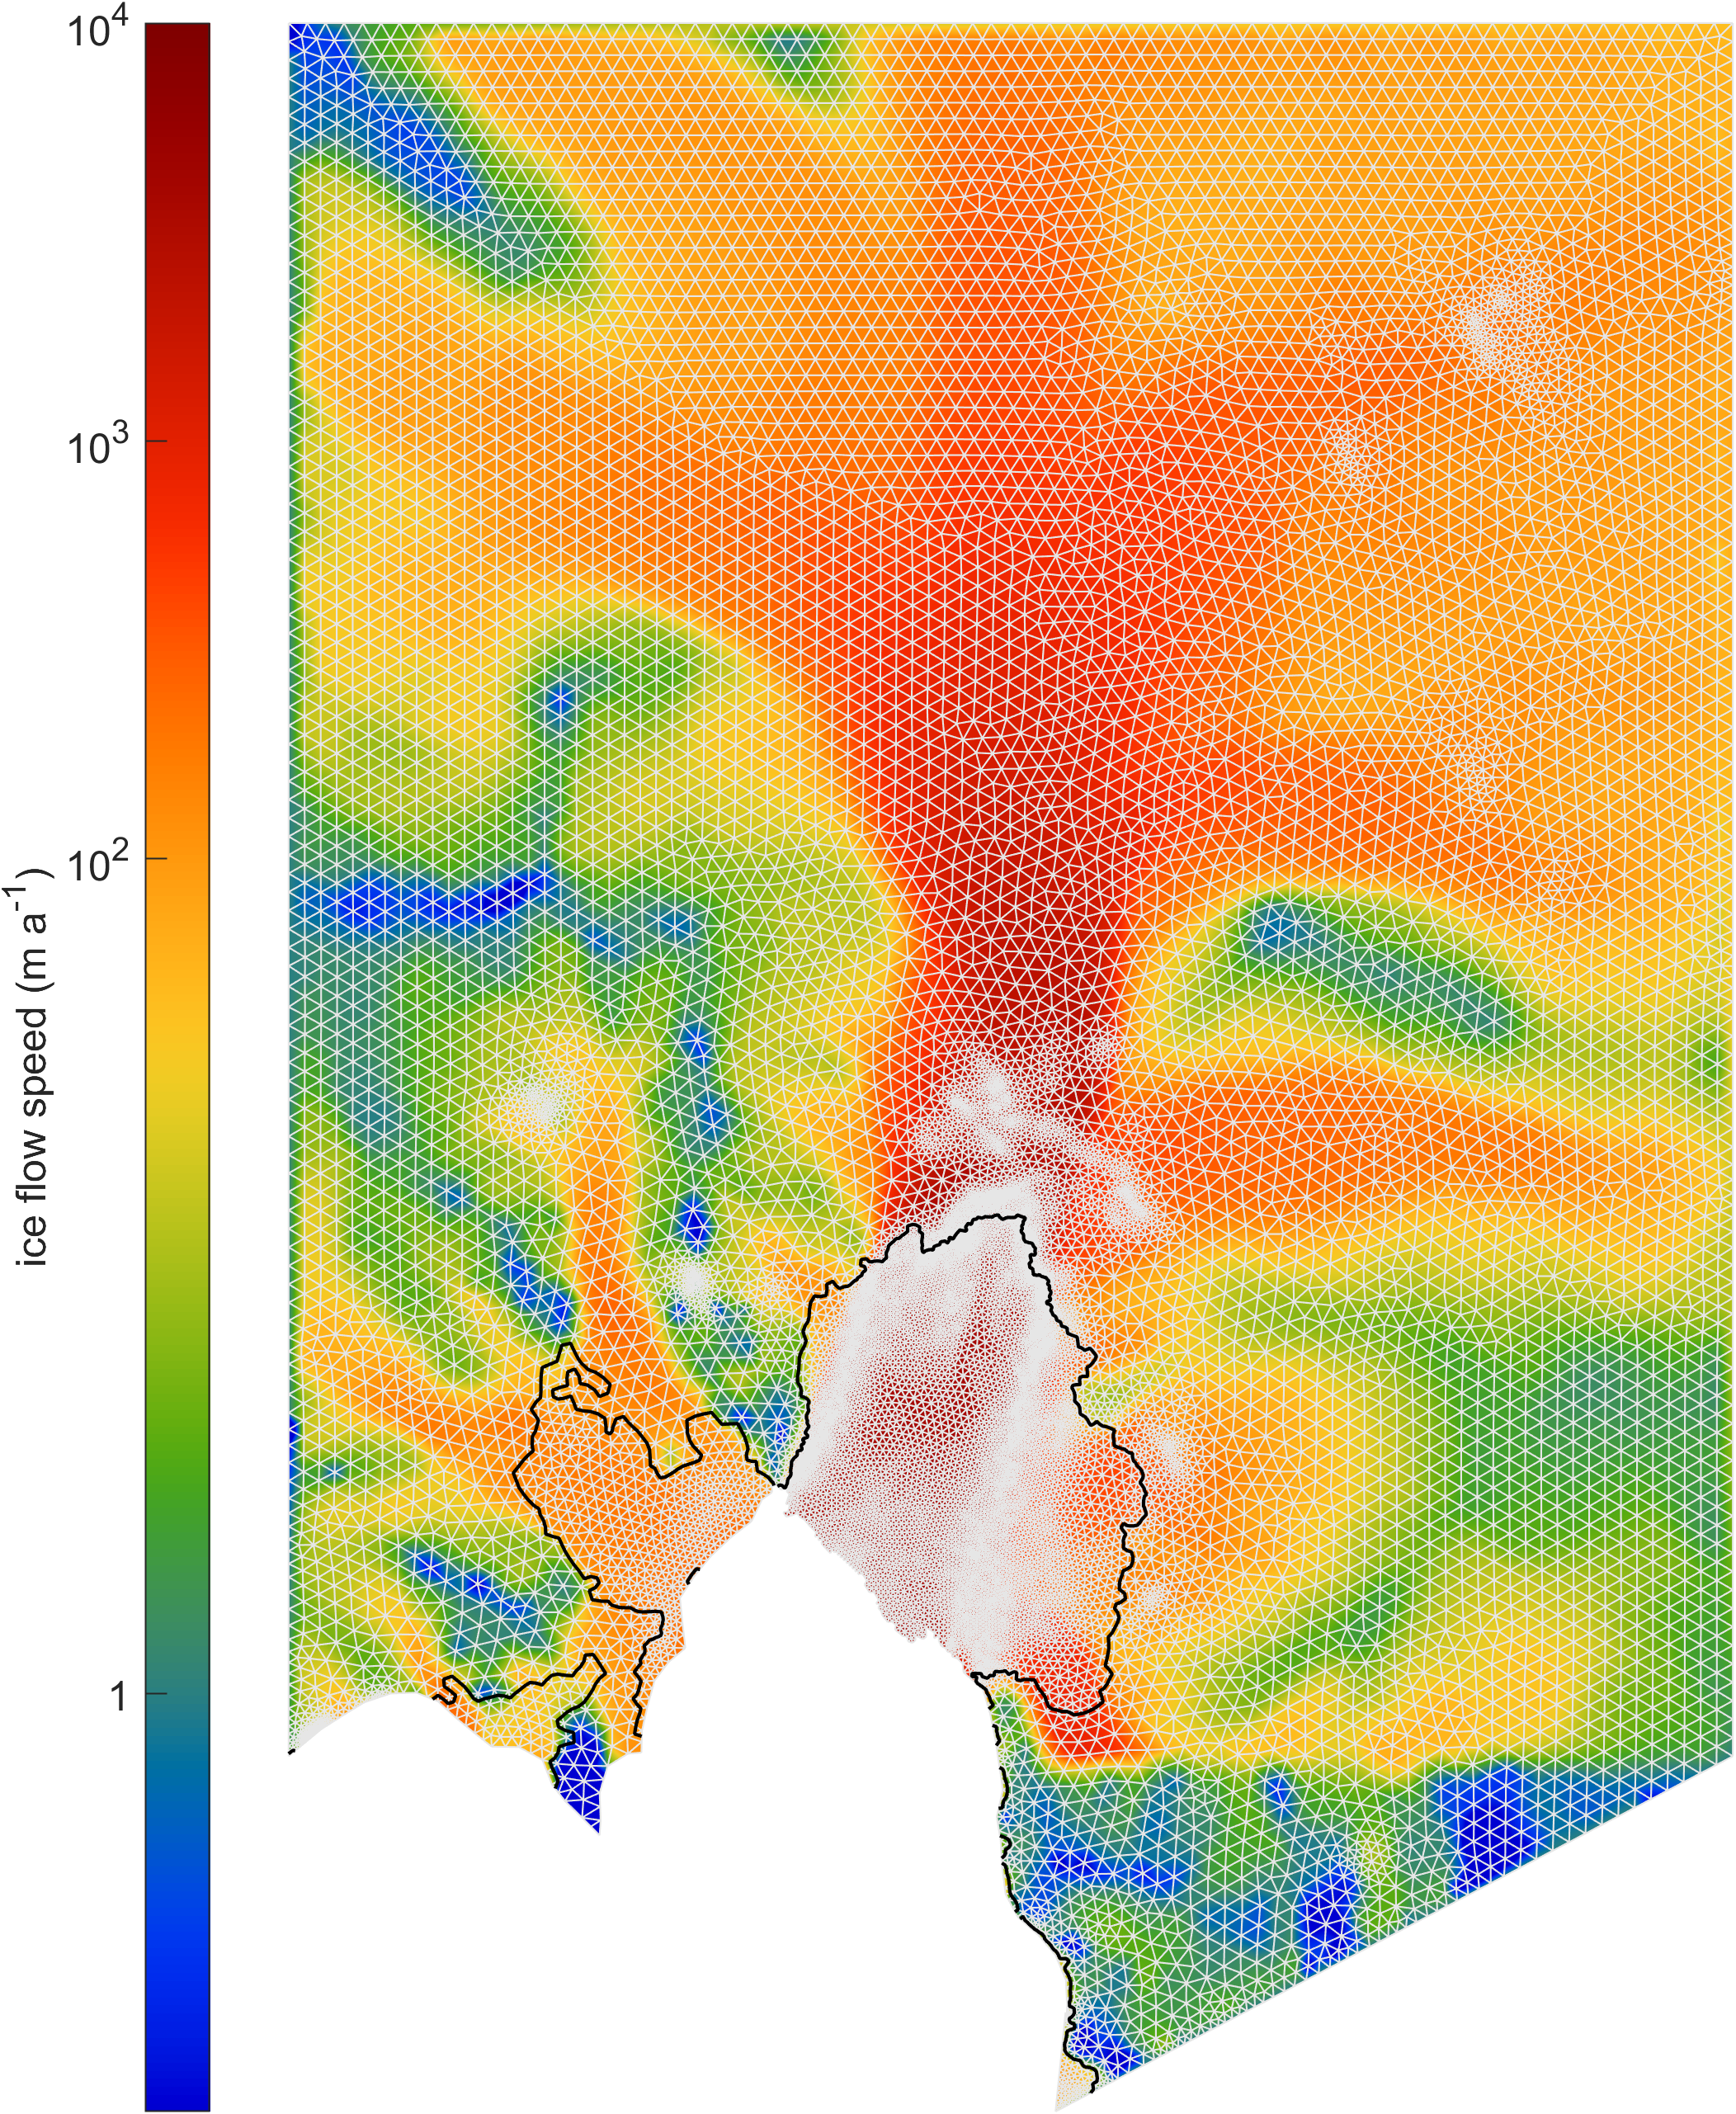
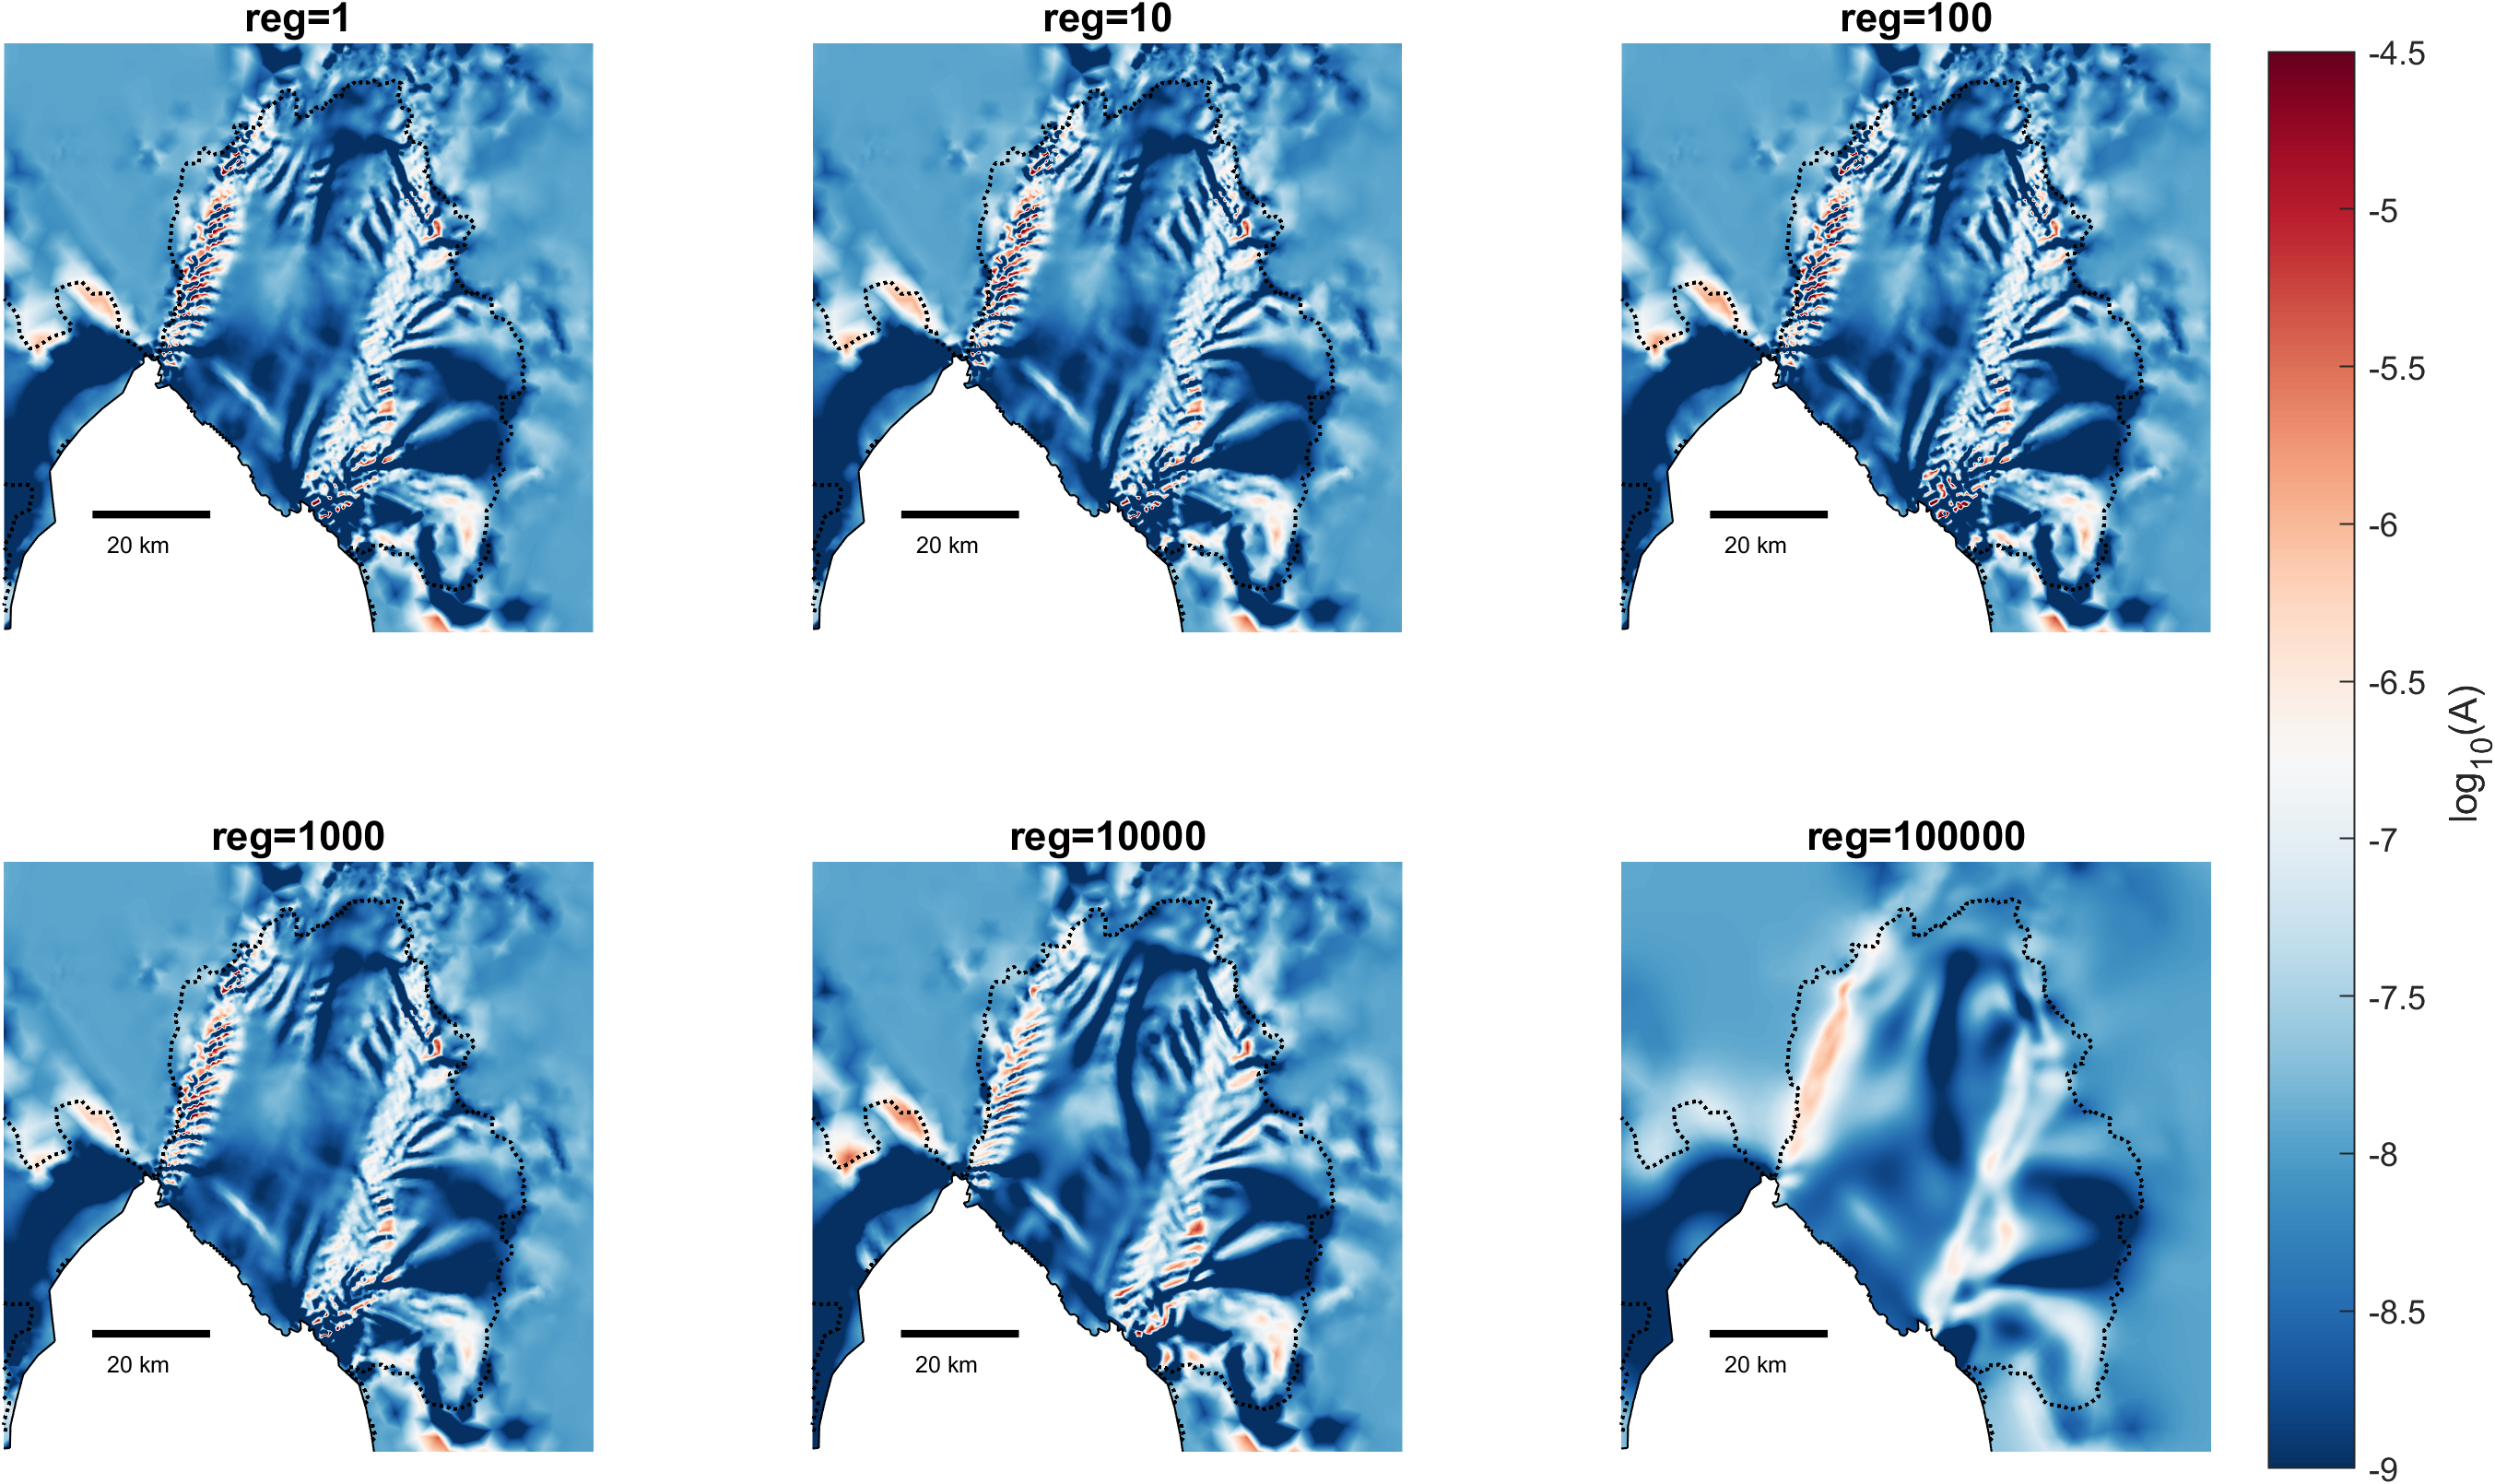
We use the finite-element ice-flow model Úa (Gudmundsson, Reference Gudmundsson2020) to solve a set of inverse problems (MacAyeal, Reference MacAyeal1993) to test hypotheses H1–H3. The model solves the shallow-shelf approximations on a domain that includes the ice shelf and parts of the upstream grounded area with finiteelement mesh refined locally down to 500 m according to the observed stain rates (Fig. S3). In this formulation of ice dynamics, two of the key model parameters are optimized using an adjoint method: the ice-softness factor (A) and the basal slipperiness parameter (C). The ice-softness factor, A, is a rheology parameter representing how easily the ice deforms under stress. The basal slipperiness parameter, C, is a parameter in the sliding law relating basal velocity and basal drag. The A distribution is strongly dependent on englacial temperatures which vary slowly with time. The prior value of A is calculated as a function of temperature using the Arrhenius relation for ice (Cuffey and Paterson, Reference Cuffey and Paterson2010). The optimal values of A and C are obtained by minimizing a cost function: J = I + R, where I is a likelihood term and R a Helmholz regularization operator. It can be shown that this approach is equivalent to selecting a Matérn covariance function for A and C (Lindgren and others, Reference Lindgren, Rue and Lindström2011). Our regularization parameters, i.e. the coefficients of the Helmholtz equation, were selected by performing an L-curve analysis (Hansen, Reference Hansen1992). As part of the calculations done for the L-curve analysis, we conduct a large number of inversions for different values of our regularization parameters. While some details of our inverted A fields depend somewhat on the exact values of the regularization parameters, changing their numerical values by a factor of two did not significantly change the extent of ice-shelf areas affected by damage (see Fig. S4). Hence, our results are insensitive to the exact value of the regularization parameters chosen. Fractures within the ice can also impact the effective A value obtained in an inversion, and this contribution to A is often referred to as the ice damage. Ice fractures can appear almost instantaneously, so changes in A over timescale of months to a few years are most likely due to ice damage rather than changes in ice temperatures.
Within our modelling framework, accounting for upstream velocity changes could be done by limiting the computational area to the ice shelf alone, and then prescribing the observed velocities at the grounding line as boundary conditions. However, doing so usually results in unrealistic stress fields where the inflow velocity boundary conditions are applied. We therefore opted for extending the computational boundary to a 250 km × 361.5 km domain to cover the tributaries of PIG (Fig. 1, Fig. S3). To ensure that modelled upstream velocities, and in particular the velocities at the grounding line, are close to measurements before and after the calving events, we solve the inverse problem to infer the basal sliding parameter distribution, C, both before and after a given calving event.
Calving is simulated by deactivating elements downstream of calving fronts. Basal sliding upstream of the grounding line is described using Weertman sliding law (Weertman, Reference Weertman1957) with stress exponent m = 3. We did some additional inversion experiments using m = 1 and m = 5 and found, as expected, that the sliding law stress exponent had little effect on the inverted A distribution over the floating ice shelf.
The key steps of our methodology can be formally described as follows. Inverting for A and C, is the operation:

where R is the retrieval method (i.e. the inversion), v are observed velocities and G the ice-shelf geometry. For those retrieved A and C fields we then calculate the velocities as

where u are modelled velocities, and F is our forward model, which here is the ice-flow model Úa. Using this notation, inverting for A and C based on data from time t = t 1 can be expressed as

Updating C using velocity and geometry data from time t = t 2, while using an A estimate from t = t 1 is the retrieval:

and the corresponding modelled velocities are u = F(A 1, R C(v 2, A 1, G 2), G 2). We refer to this experiment, i.e. updating frontal geometry and basal slipperiness, as experiment Inv C. Updating both A and C, and frontal geometry, is referred to as experiment Inv AC. Note that we always update the frontal geometry (one exception to this rule is shown in the supplement) to reflect changes due to either calving or frontal advance due to ice advection.
To test H1, we take the value of A from a simultaneous inversion for A and C at the time t = t 1, i.e. just before a calving event. Then we invert for C using velocity data obtained at t = t 2 (i.e. just after the event), while keeping A unchanged. If the ice-flow model can reproduce the velocity field with sufficiently small errors, we accept H1 and conclude that the velocity changes are possibly caused by the upstream dynamics and calving. Formally, this experiment can be summarized as: calculate velocities at t = t 2 as u 2 = F(A 1, R C(v 2, A 1, G 2), G 2), where (A 1, C 1) = R AC(v 1, G 1), and inspect the size and distribution of the velocity residuals r 2 = u 2 − v 2. This is referred to as experiment Inv C.
If H1 is rejected, we test H2 by now additionally including the influence of ice thickness changes and adjust the grounding line locations accordingly. Similarly to when testing H1, if t 1 < t C < t 2, where t C is the time of a calving event, we initially invert for A 1 and C 1 at t = t 1, then update our estimate of C for t = t 2 by performing a new inversion, which now also includes estimates of ice thickness changes. Hence, our estimate for C 2 is now $C_2 = R( {v_2, \;A_1, \;G_2^\ast } )$ , where $G_2^\ast$
 is a modified ice-shelf geometry where we have both updated the frontal geometry and applied a prescribed ice thickness changes across the glacier. This is referred to as experiment Inv CT.
Only if both H1 and H2 are rejected, do we test H3. When testing H3, we invert for both A and C at the time after the calving event, in addition to prescribing the geometry changes as done in H2. Formally, we first estimate (A 2, C 2) = R(v 2, G 2) at t = t 2. The residuals at t = t 2 are calculated as r 2 = u 2 − v 2, where the modelled velocities u 2 are calculated as u = F(A 2, C 2, G 2). This is experiment Inv AC.
3. Results
In this section, we present the results of the experiments exploring the effect of changes in the ice-softness factor, A, during 2017–2020, on ice velocity.
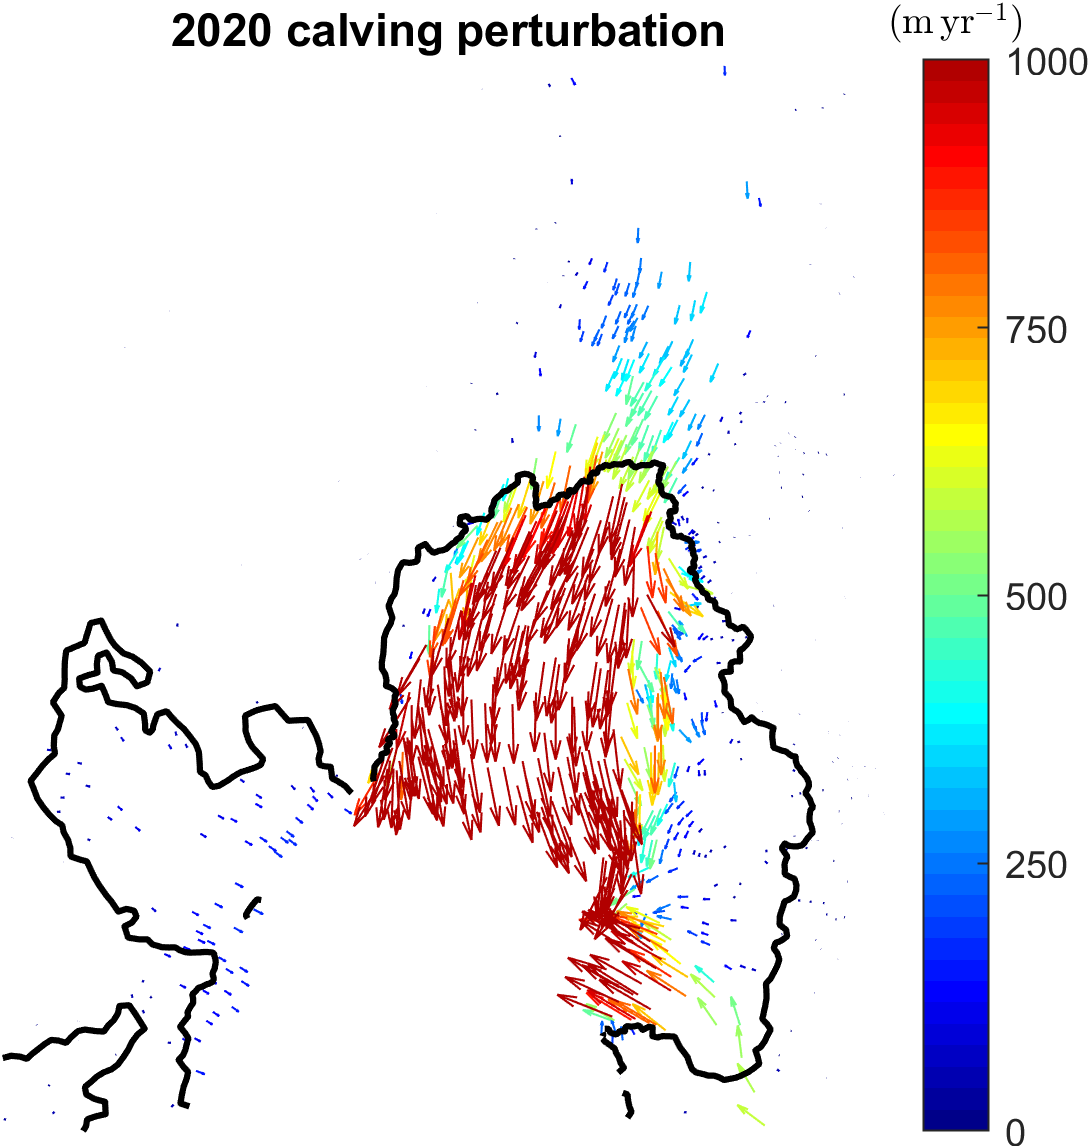
Before testing the hypotheses H1–H3, we initially duplicated the diagnostic calving perturbation experiment of Joughin and others (Reference Joughin, Shapero, Smith, Dutrieux and Barham2021) where the total 2017–2020 loss is simulated as a single event. In good overall agreement with Joughin and others (Reference Joughin, Shapero, Smith, Dutrieux and Barham2021), we found that this resulted in a significant speedup comparable to that observed. However, we also find that the simulated impact of the calving events did not produce a perfect fit to the observational data, and analyses of the velocity residuals showed that these were not randomly distributed (Fig. S5). Nevertheless, our results support the general conclusion of Joughin and others (Reference Joughin, Shapero, Smith, Dutrieux and Barham2021) ‘that the recent speedup can be largely attributed to the loss of a large (20%) section of the shelf from 2017 to 2020’.
After having established that the observed changes in velocity cannot be explained fully through calving alone, we explore the role of changes in A in further impacting ice velocities. We do this by conducting a series of inversion for A, starting by analysing velocity changes in the intervening periods between calving events (Section 3.1).
Finally, we present the results of experiments (Inv C, Inv CT and Inv AC) described in Section 2.2 for the three major calving events that took place on 23 September 2017, 29 October 2018 and 11 February 2020 (Section 3.2).
3.1 Estimate of changes in ice-softness factor for a period between calving events
In a further initial experiment (see Fig. 2), we focused on the period in between the substantial calving events, when no ice front retreat took place. With these experiments, we evaluate the effect of the evolution of A while the ice front is not retreating. Here we present the results from 15 August 2019 to 15 November 2019 as an example, while similar behaviour is observed in between all three calving events. Using the geometry and velocities from 15 November 2019, we inverted for both A and C, resulting in a good fit to observed velocities from that time. We then again inverted for C over the grounding area using the 15 August 2019 velocities, but without updating our estimates of A. This resulted in considerable differences between calculated and measured velocities from 15 August 2019 (Fig. 2a), showing that updating conditions upstream of the grounding line is not sufficient to produce good fit to the data over the ice shelf. Hence, some further processes, presumably acting over the ice shelf itself, must have played some additional role in producing the changes in velocities over the 3-month period from 15 August 2019 to 15 November 2019.
Misfit between modelled and observed velocities from 15 August 2019. (a) Velocity misfit when inverting for basal slipperiness, C, using velocity data from 15 August 2019 and using ice-softness factor, A, from an inversion done using velocity data from 15 November 2019 (experiment Inv C). (b) As in (a) but with added uniform thinning of 2.5 m applied over the ice shelf (experiment Inv CT). (c) As in (a) but now also inverting for A using velocity data from 15 August 2019 (Inv AC). As evident from the size and distribution of the velocity residuals in the panels, obtaining good fit to velocities requires changes in the ice-softness factor A. No calving event happened between 15 August 2019 and 15 November 2019.

We then additionally perturbed the ice-thickness distribution, using estimates of the rate of surface elevation change of the whole glacier from Adusumilli and others (Reference Adusumilli, Fricker, Medley, Padman and Siegfried2020). This also resulted in significant, albeit smaller, non-random distribution of velocity residuals (Fig. 2b). Hence allowing for both changes in upstream conditions and ice-shelf thinning is also not sufficient to explain observed changes.
Finally, we inverted for both A and C using 15 August 2019 velocities, and now obtained almost a perfect fit to observed velocities over the whole ice shelf (Fig. 2c). When inspecting the changes in the ice-softness distribution, A, we found that the changes were concentrated in the margins of the ice shelf. This numerical experiment, hence, suggests that changes in ice damage, as reflected by changes in our inverted A fields, were partly responsible for the observed changes in velocity from 15 August 2019 to 15 November 2019, and that the observed velocity changes cannot be fully explained without introducing some changes in ice damage.
It is possible that our data sources of ice-shelf thinning might not be completely exact and consequently, our perturbation in ice thickness over the ice shelf might be somewhat inaccurate. However, ice-shelf thinning is expected to produce general decrease in velocities, not increase as is observed here, and furthermore to have a wide-ranging spatial pattern whereby ice-shelf velocities change gradually with distance. It is, hence, difficult to see how possible errors in ice-thickness estimates might produce the type of spatially localized changes in velocities within the marginal areas. Nevertheless, we conducted further experiments where we both prescribed uniform average thinning rates, and spatially variable thinning based on measurements (Adusumilli and others, Reference Adusumilli, Fricker, Medley, Padman and Siegfried2020; Bamber and Dawson, Reference Bamber and Dawson2020). The difference in velocities was, as expected, almost negligible compared to the observed changes in ice velocities. In conclusion, from this initial experiment, we can already conclude that the effective rheological ice-softness parameter, A, must have changed over time, with the changes primarily concentrated within the ice-shelf margins.
3.2 Testing hypotheses H1–H3
We now test hypotheses H1–H3 using the methodology defined above and consider each of the three calving events individually. Again, we use the velocity data from Joughin and others (Reference Joughin, Shapero, Smith, Dutrieux and Barham2021), available at 3-month intervals, and pick data periods just before and just after each event.
Before presenting results jointly for all three calving events, we start by focusing on observed and modelled changes for the 29 October 2018 calving event (Fig. 3). Our approach for the other two calving events is identical and results for all three calving events are summarized in Figure 4.
(a) Observed velocities from 15 November 2018, after the calving event of 29 October 2018. (b) Velocity misfit when inverting for basal slipperiness, C, using velocity data from 15 November 2018 (experiment Inv C) and using ice softness factor, A, from an inversion done using velocity data before the calving event (15 August 2018). (c) As in (a) but now also inverting for A using velocity data from 15 November 2018.

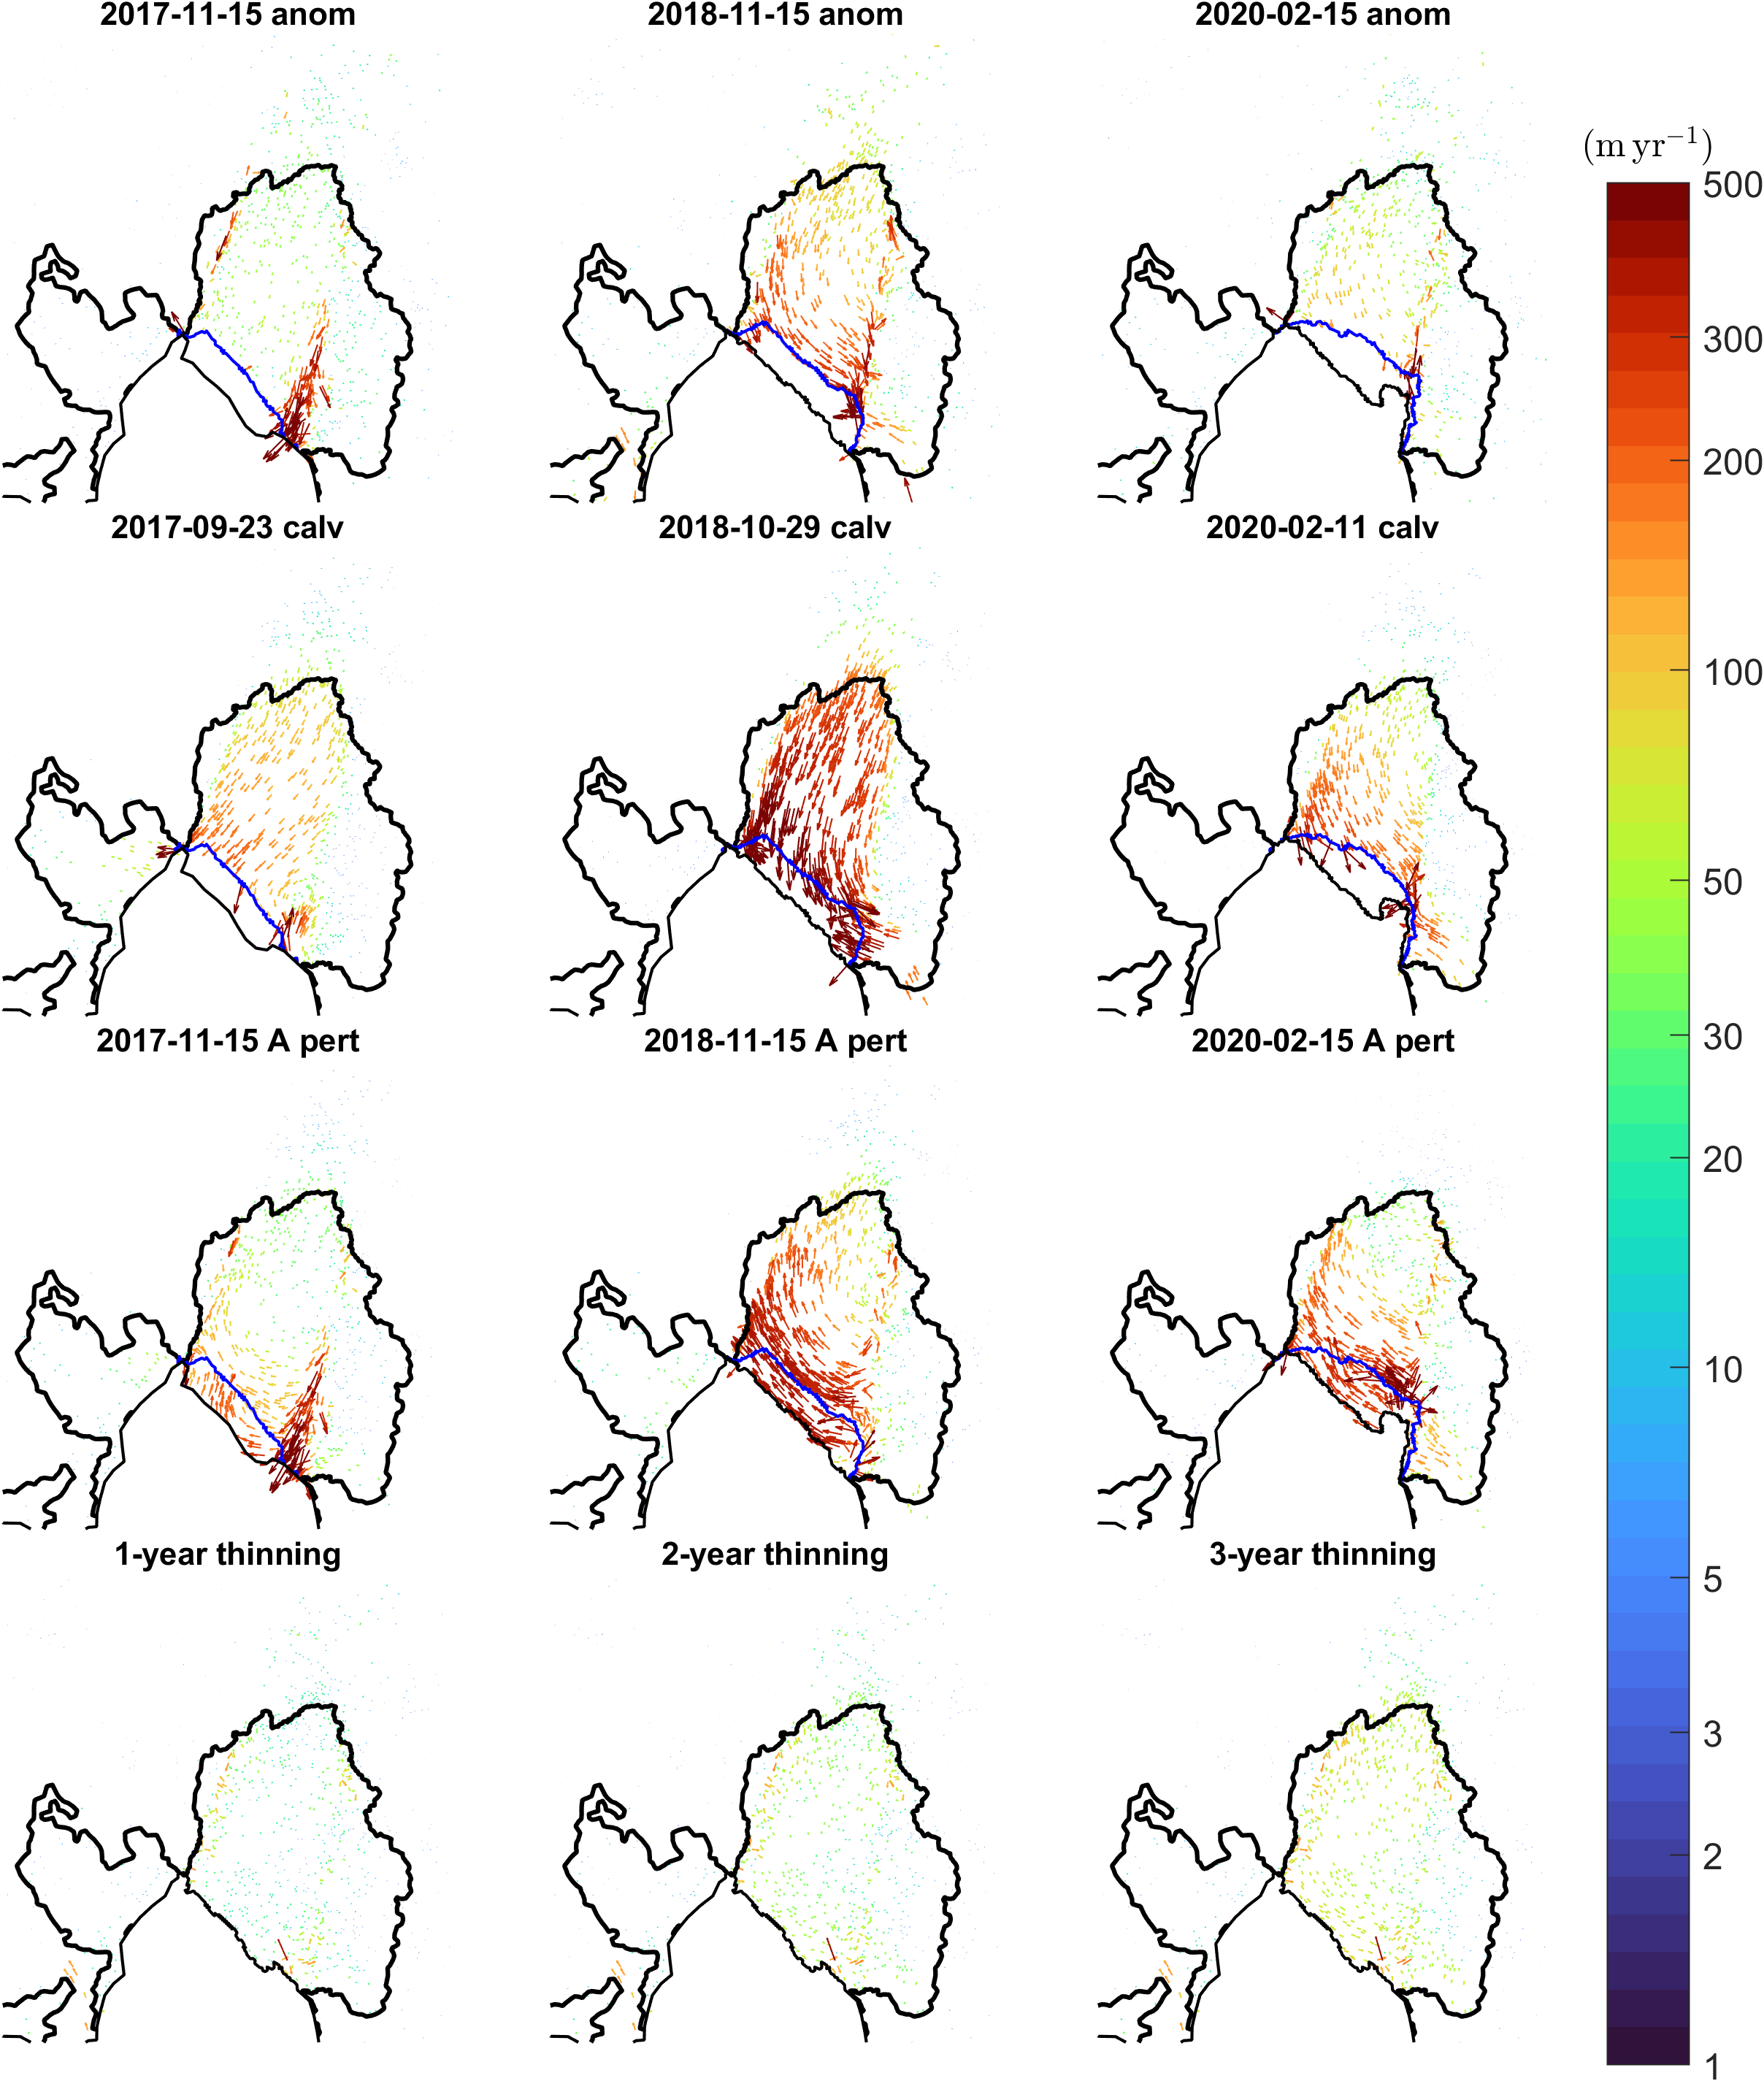
Topmost row (a 1 to a 3) shows observed changes in velocities using datasets just prior and just after the three calving events of 23 September 2017, 29 October 2018 and 11 February 2020. The following three rows show modelled velocity changes when updating estimates of C only (b 1 to b 3, experiment Inv C, also labelled as H1), updating estimates of C and applying unform thinning (c 1 to c 3, experiment Inv CT, also labelled as H2) and updating both A and C (d 1 to d 3, experiment Inv AC, also labelled as H3). For columns 1–3 the prior and after dates were 15 August 2017 and 15 November 2017, 15 August 2018 and 15 November 2018, and 15 November 2019 to 14 February 2020, respectively. Only when inverting for both A and C are observed (row a) and modelled (row d) velocity changes in good agreement.

Figure 3a shows observed velocities on 15 November 2018, or about 16 days after the calving event on 29 October 2018. We tested H1 by assimilating velocity data from 15 August 2018, or about 75 days before the calving event, and then changed the geometry of the ice-shelf front as observed. H2 was then tested by additionally changing the ice thickness based on estimates of thinning rates from Bamber and others (Reference Bamber and Dawson2020). Modelled velocities were in both cases similar, and we therefore only show the velocity residuals for the H2 experiment (Fig. 3b). As Figure 3b shows, the velocity residuals exceeded 500 m a−1 in places and modelled speeds deviate from observations by more than 5% over large parts of the ice shelf. The velocity residuals are, furthermore, not randomly distributed. The velocity residuals near the calving front have similar direction to the ice flow, suggesting a too high modelled ice velocity, while velocity residuals next to the grounding line are against the ice-flow direction, suggesting an underestimation of ice velocity. Furthermore, the ice-flow direction is shifted towards the southern margin upstream of the ice front. Thus, both H1 and H2 can be rejected, i.e. we cannot match observed velocities within 5% by changing the frontal geometry and upstream basal slipperiness (H1) and additionally the ice-shelf thickness (H2). We then investigated if H3 could also be rejected by now also allowing changes in ice-shelf softness (A). The results of that experiment are shown in Figure 3c. Now we obtain good fit to velocity with velocity residuals randomly distributed and speed residuals less than 5%, and generally less than about 1%. We thus conclude that for this calving event, both H1 and H2 can be rejected but H3 not.
The same experiments were then conducted for the two other calving events, and the results are summarized in Figure 4. For added clarity, we show the observed velocity differences between before and after each calving event and compare those with the modelled velocity residuals for each inversion experiment. Figure 4, panels a 1to a 3, show observed changes in ice velocities associated with the three calving events on 23 September 2017, 29 October 2018 and 11 February 2020. As above, these observed changes are calculated using data presented in Joughin and others (Reference Joughin, Shapero, Smith, Dutrieux and Barham2021), which provides velocity datasets at 3-month intervals.
When only updating our estimate of C following the calving events, and leaving A unchanged (experiment Inv C), we can replicate some of the observed changes (see panels b 1 to b 3 in Fig. 4). However, the spatial pattern of modelled changes is both qualitatively and quantitatively different from observations. We are, for example, not able to replicate the large and highly localized changes in velocities following the 23 September 2017 calving event along the southern margin (compare panels b 1 and a 1 in Fig. 4). For the 29 October 2018 calving event, the spatial pattern of modelled velocity changes across the whole ice shelf is significantly different from observations, with too little changes close to the grounding line, too large changes towards the calving front, and the observed localization of velocity changes along both the southern and northern margins is missing in our model results (compare panels b 2 and a 2 in Fig. 4). Similarly, for the third calving event from 11 February 2020, the modelled spatial pattern is clearly qualitatively different from that observed (compare b 3 and a 3 in Fig. 4). The direction of the velocity residuals also indicates a too high velocity near the ice front, too low velocity near the grounding line and a shift of ice-flow direction towards the southern margin. These differences are large enough that visual inspection alone shows that this modelling experiment, i.e. Inv C cannot replicate several key features of observed changes. We therefore reject hypothesis H1 and conclude that while ice-shelf frontal retreat did impact velocities, it was not the sole driver of recent PIG speedup.
We then tested H2 by additionally allowing for the thinning of the ice by performing the numerical experiment Inv CT. The results are shown in panels c 1 to c 3 in Figure 4. As evident from the figure (compare with panels a 1 to a 3), simulated changes are almost identical to those of experiment Inv C, and similarly at variance with observations. H2 is, thus, also rejected.
Finally, we test H3 by performing experiment Inv AC where we now allow the ice-softness factor, A, to change with time. The agreement with observations is now almost perfect (compare panels top and bottom rows in Fig. 4). Importantly, this agreement can only be obtained by allowing for significant changes in A. These changes are too large to be ascribed to temperature effects alone, indicating, as we discuss in more detail below, significant changes in ice damage. Further quantitative estimates of the differences between observed and modelled changes are provided in the last row of Figure 4 in the form of histograms. Those show clearly how much smaller the residuals for H3 are, as compared to H1 and H2.
To better understand the impact of individual perturbations in isolation, we also conducted further numerical experiments where we only changed frontal positions, or only the ice-softness factor A, or only applied uniform thinning, according to observed changes (see Fig. S6). None of these replicated observations. This experiment showed that changing the ice-softness factor alone cannot replicate observed changes, further supporting the conclusion that changes in both frontal geometry and ice-softness factor are needed for that purpose.
In summary, for all three calving events, we reject hypotheses H1 and H2, but do not rule out H3 based on available data.
3.3 Evidence for significant and widespread changes of ice damage
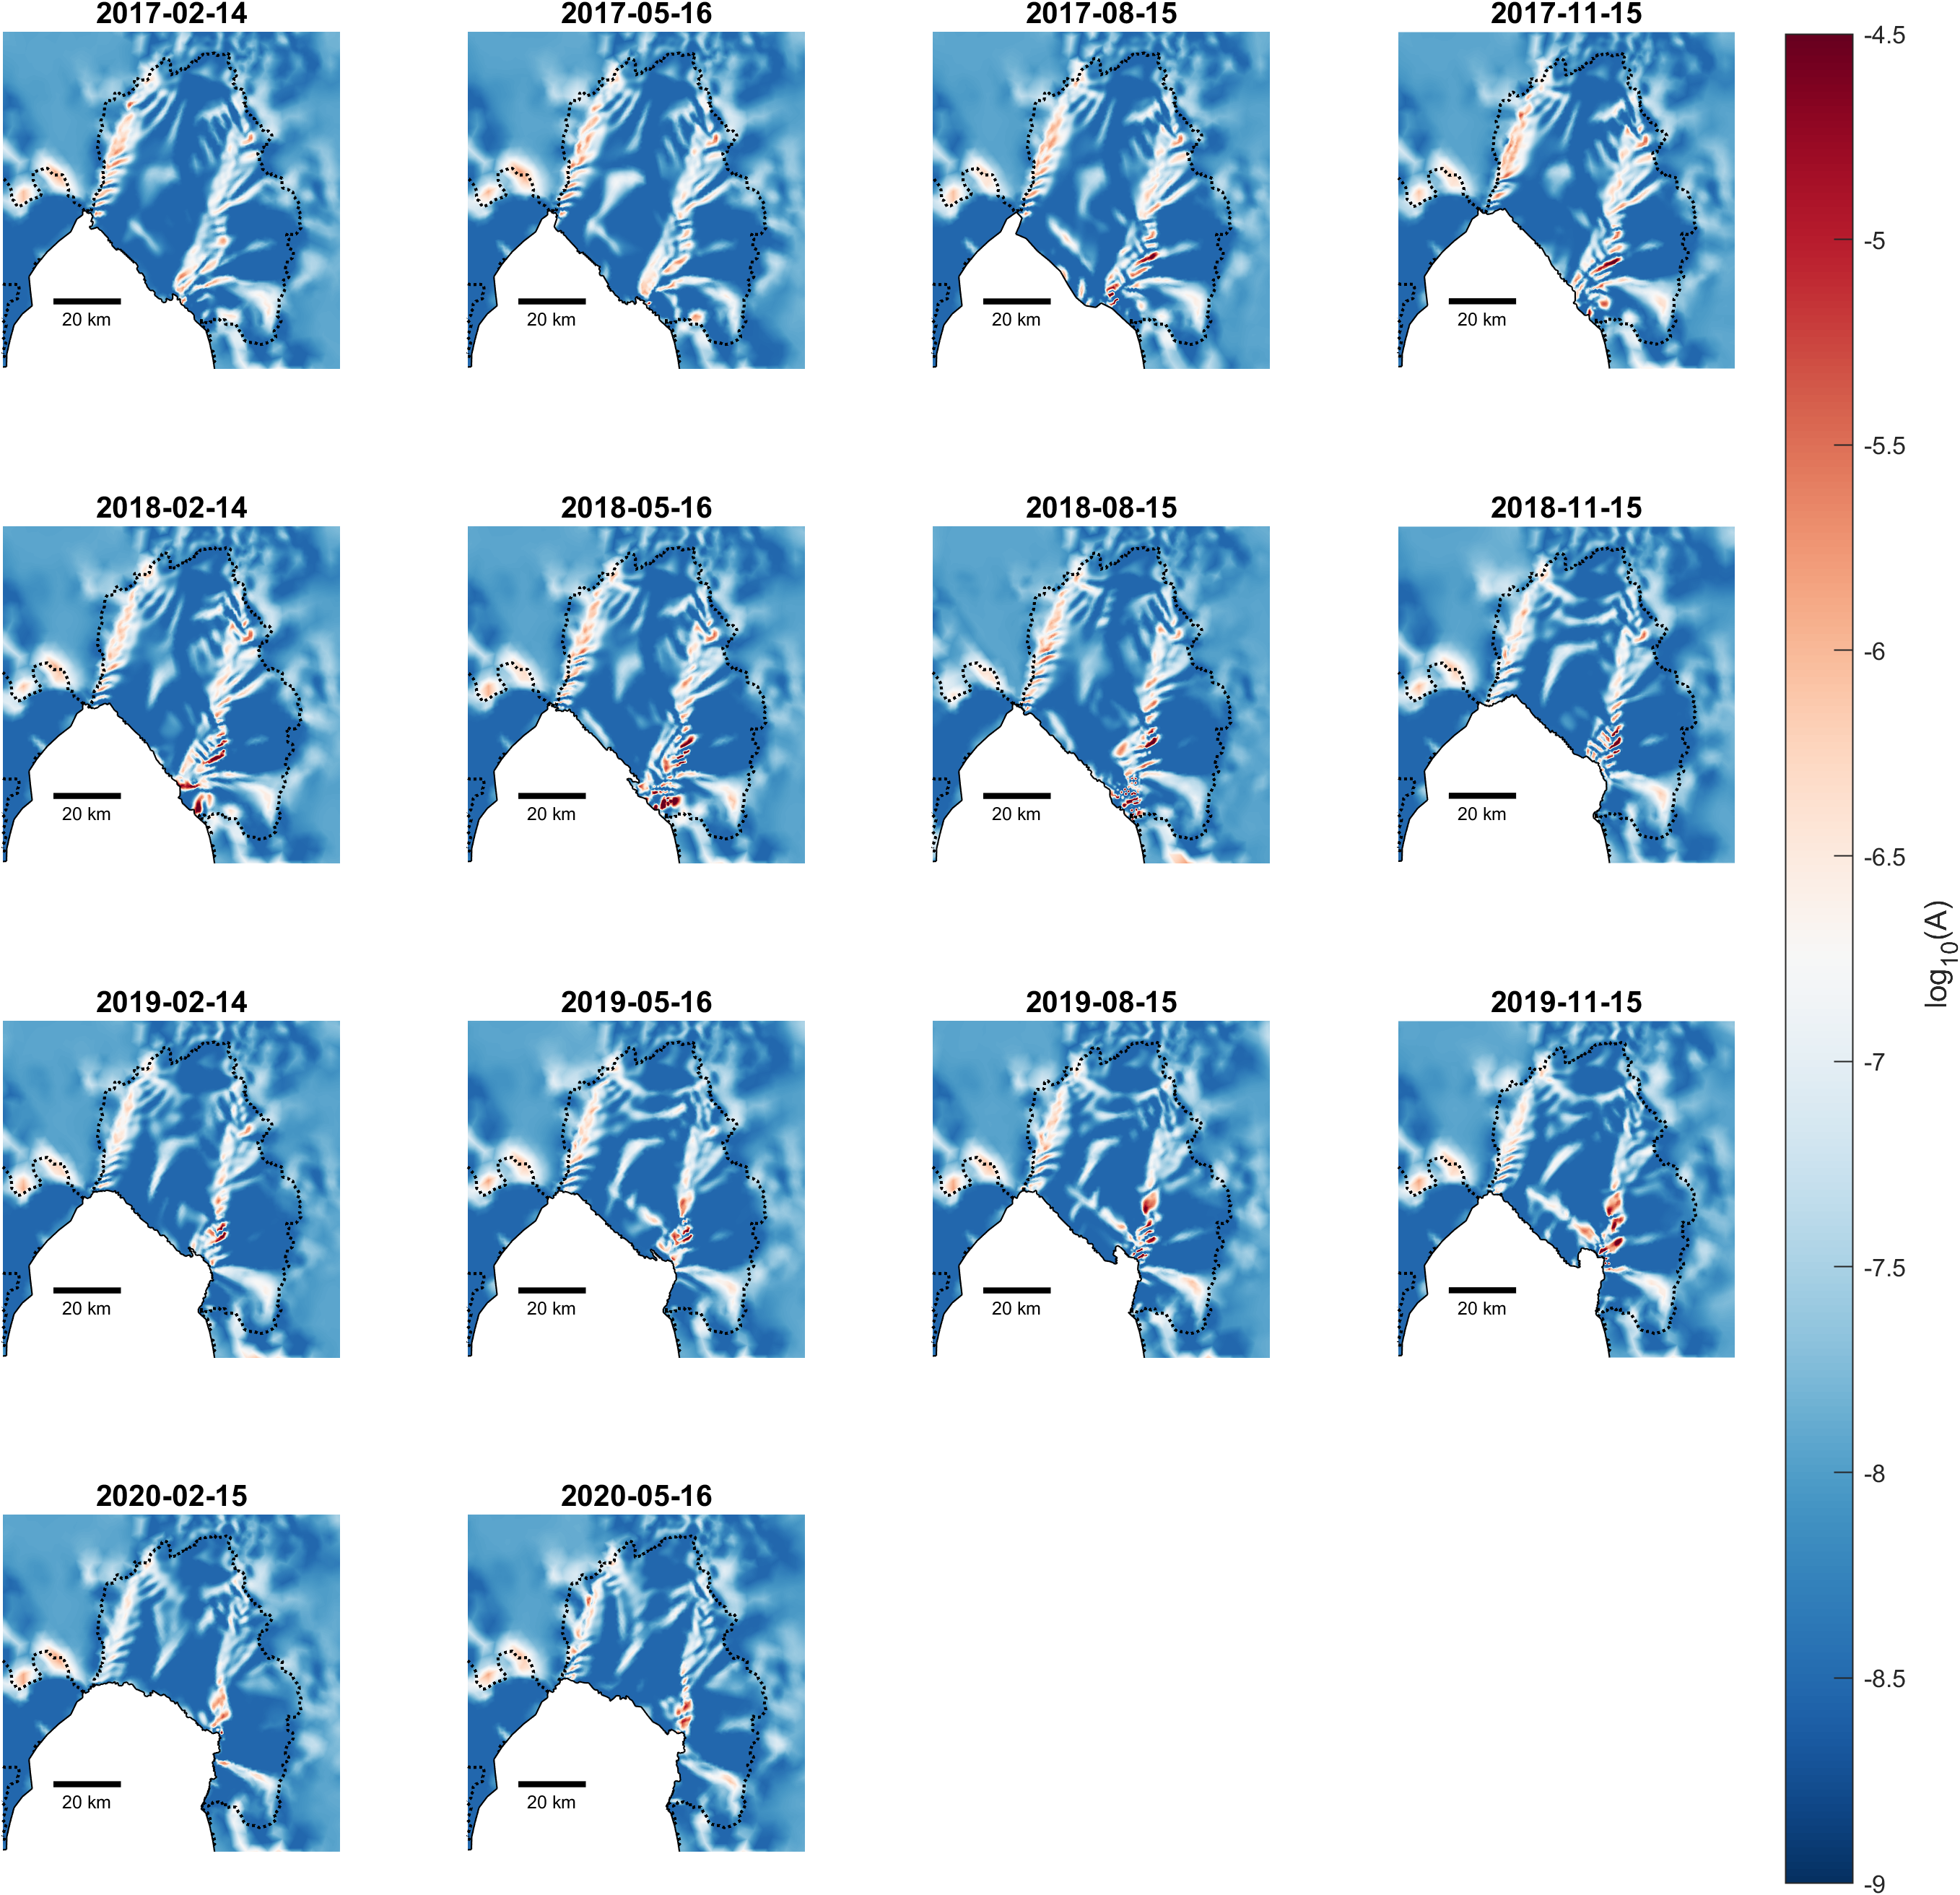
As discussed above, our experiments show that the observed changes in velocities cannot be replicated in an ice-flow model without evolving the ice-softness factor A. Our inversions consistently show the largest changes in A being concentrated within the ice-shelf margins and in areas coinciding with locations of frontal rifts (compare panels c and d in Fig. 5). In those locations, the estimated values of A are in places several orders of magnitudes larger than the estimates of ${\ A} = 1.67 \times 10^{{-}7}\,{{\rm kP} }{{\rm a} }^{{-}3}{ {\rm a}}^{{-}1}$ for temperate ice, as summarized from lab measurements (Spring and Morland, Reference Spring and Morland1983), and ${\ A} = 0.74 \times 10^{{-}7}\,{ {\rm kP} }{ {\rm a}}^{{-}3}{ {\rm a}}^{{-}1}$
 from ice-flow modelling of a temperate glacier (Gudmundsson, Reference Gudmundsson1999). Comparison between our estimated spatial map of A values and satellite imagery shows that the areas over which A values exceed the temperate ice estimates by more than a factor of ten coincide close with crevassed and fractured areas (see Fig. 5). We therefore interpret these areas of high A values as indicative of evolving ice damage. We find clear evidence of significant changes in damage over time as in Figure 5 when comparing panel a showing estimated damage in February 2017 with panel c showing an estimate from November 2019. As explained above, observed changes in velocity cannot be replicated without introducing this variation in the effective A field.
Ice rheology softness factor A on February 2017 (a) and November 2019 (c) as estimated by the inverse method, where the black contour presents the grounding line. The unit of A is kPa−3a−1 and lab measurements suggest a value of A of about 10−7 kPa−3a−1 for temperate ice. All values above about 10−6 are therefore most likely effective values indicating the presence of ice damage in those areas. Satellite images of this area on February 2017 and February 2020 from Landsat are shown in (b) and (d) correspondingly.

We conducted further series of inversions for ice softness at intervals of 3 months covering the period from February 2017 to May 2020. The results (see Fig. S7) show systematic temporal and spatial changes in A fields, with formation of weak transverse bands associated with rifting that later gave rise to a calving event, and particularly noticeable increase in ice damage within the southern ice-shelf margin. Note that areas to both sides of the southern margin are afloat. Hence, the location of that margin does not coincide with any topographical barrier providing lateral confinement. The damage evolution in this area is therefore most likely internally driven, and not clearly attributable to any specific bed geometrical factors. The increase in ice damage within the southern margin coincides with the formation of a transversally oriented rift, which in our inverted A fields start to become evident in May 2019 (see Fig. S7), or at the same time as a noticeable increase in ice damage within the frontal regions of the southern side margin. Both developments may therefore have been linked.
4. Conclusions
In agreement with Joughin and others (Reference Joughin, Shapero, Smith, Dutrieux and Barham2021), our numerical simulations capture the instantaneous and significant speedup caused by recent calving events of PIIS. However, we also find that damage evolution impacted ice-shelf velocities and without accounting for changes in damage over time, observed ice-shelf velocities cannot be correctly replicated, neither qualitatively nor quantitatively. Qualitatively, the pattern of velocity changes, for example the changes in ice-flow velocity within the margins, cannot be reproduced without including changes in ice damage. This is, for example, evident when looking at observed and modelled changes in velocities from 15 August 2017 and 15 November 2017 shown in Figure 4, panels a 1 to d 1. Including calving without evolving the ice-softness factor A gives rise to too high velocity near the calving front, too low velocity at the shear margins and near the grounding line, and velocity direction shifting too much towards the southern margin. This is likely due to the advection of the damage field and healing/enhancing of damage because of local stress changes, which indicates the local damage changes due to advection and stress field changes may supress or enhance the speedup of the ice flow at different locations. Without including changes in ice damage, and only including changes in frontal position due to the calving event 23 September 2017, the general pattern of velocity changes within the southern ice-shelf margin cannot be replicated. Quantitatively, the differences between observed and modelled velocity changes are in places as large as 300 m a−1, or about as large as the observed changes. We also see clear evidence of the importance of damage evolution within the lateral margins when considering the 3-month period from 15 August 2019 to 15 November 2019, when no calving event took place.
Many ice-flow models of present-day conditions either assume that ice rheology parameters are only dependent on ice temperature or implement data assimilation method to estimate ice-softness factor A that is compatible with observation, and then keep those inverted fields fixed in transient simulations. This approach would not allow observed changes in speeds to be generally reproduced to within 5% of observed speed, with deviations as large as 15% in places (e.g. compare Figs 3a, b).
Developers of ice-flow models usually make careful decisions about which processes to include in their models. The list of processes that one can envision impacting large-scale ice flow is large and, it appears, ever expanding. However, unless the impact of these processes on ice flow is quantified and shown to be significant in relevant situations, there is arguably limited justification for including these processes in ice-flow models. Here, we have attempted to provide a clear quantification of the evolution of ice damage and its impact on ice-shelf flow by conducting a case study of the PIIS. This ice shelf is, admittedly, somewhat unique in that its ice-flow velocities have changed quite significantly over a period of only a few years. A recent work on Thwaites glacier also suggested that the variation in ice speed of Thwaites ice shelf since 2015 can be accounted for by the observed changes of fracturing (Surawy-Stepney and others, Reference Surawy-Stepney, Hogg, Cornford and Davison2023). The large ice shelves of the Antarctic Ice Sheet, Filchner Ronne and Ross ice shelves, currently show no comparable changes in ice velocities. Significant changes in ice velocity of other ice shelves, for example, the observed doubling of the ice-flow velocities of Brunt Ice Shelf (Gudmundsson and others, Reference Gudmundsson, de Rydt and Nagler2017) have been attributed to the loss of pinning points, rather than changes in ice damage. It is possible that the high flow velocities of PIIS and Thwaites ice shelf provide particularly favourable conditions of fast evolution of ice damage.
Supplementary material
The supplementary material for this article can be found at https://doi.org/10.1017/jog.2023.76.
Acknowledgements
This work was supported by the TiPACCs (European Union's Horizon 2020 research and innovation programme under grant agreement no. 820575) Tipping Points in Antarctic Climate Components, the NSFgeo-NERC grant (V013319) A new mechanistic framework for modelling rift processes in Antarctic ice shelves, and the NSFPLR-NERC grant (NE/S006745) PROPHET (Processes, drivers, predictions: Modelling the response of Thwaites Glacier over the next century using ice/ocean coupled models), as a part of the International Thwaites Glacier Collaboration.
Open research
The open-source ice-flow model Úa used for the numerical simulations is preserved at https://doi.org/10.5281/zenodo.3706624.




 Open access

