1. Introduction
As a social investment state emerges as a new form of welfare state that places less emphasis on income replacement considered passive and more on activation and investment in human capital, education has often been described as a policy strategy to simultaneously achieve distributive and redistributive equality (Giddens, Reference Giddens1998; Morel et al., Reference Morel, Palier and Palme2011). Redistribution in these new welfare states is achieved by distributing educational opportunities, which helps people overcome skill deficits and increase their employability, thereby maintaining or increasing their income (Midgley, Reference Midgley1999; Jenson and Saint-Martin, Reference Jenson and Saint-Martin2003; Taylor-Gooby, Reference Taylor-Gooby2004).
The concept of a social investment state is based on the belief that increasing educational opportunities improve educational and economic inequality. It coincides with the conventional human capital perspective, taking the ‘the more is the better’ approach to education expansion (Schultz, Reference Schultz1961; Becker, Reference Becker1964).
However, Hirsch (Reference Hirsch1977) casts doubt on this human-capital approach by shedding light on the positional characteristics of education. In this theory, education has a positional value with quantitative expansion because its social and economic value in absolute terms (e.g. whether to attain a college education or not) becomes less important, whereas the relative value (e.g. the same college degree, but differences in prestige or economic rewards in the labour market) becomes more important. Thus, positionality generates competition among individuals with similar education attainments to advance their relative educational and economic status, resulting in costs and risks. This is referred to as ‘positional competition’.
From a positional viewpoint, the link between education expansion and educational and economic equality is not as evident as predicted in the human capital framework, but rather, increasing educational opportunities may lead to paradoxical consequences, which can be described as ‘equal rights to be unequal’ (Marshall, Reference Marshall1950, p. 19). This approach to education expansion emphasising that ‘more is not always better’ inspires us to examine whether education expansion is an effective policy strategy to improve educational and economic equality, as expected in the idea of a social investment state.
Positionality is revealed when education has social and economic value and thus works as a power and resource, as indicated by the phrase ‘human capital’. Attaining higher education (HE) has a larger impact on economic prospects for individuals than other education levels. Thus, this study focuses on HE, which has significantly expanded in developed countries over the last 2 decades. There is a considerable cross-national variation in the pattern of HE expansion, whereas primary and secondary education is almost universal in developed countries.
This study fills the gap in the previous studies in two ways. First, the prior studies have focused on the distinction between developed and developing countries, which is ‘a greatly simplified dichotomy’ (Buchmann and Hannum, Reference Buchmann and Hannum2001, p. 95). This study, however, captures the variations in education provisions within developed countries. Second, comparative welfare-state research has mostly concentrated on educational equality, neglecting economic equality, as Busemeyer and Trampusch (Reference Busemeyer and Trampusch2011) pointed out. However, this study considers consequential income distributions as the outcomes of education expansion.
The most significant contribution of this study is to take the positional approach to education expansion. This approach contrasts with the literature’s general assumption that countries can reduce educational and economic inequality by increasing quantitative educational opportunities. However, scholars have increasingly recognised education as a positional good (Bills, Reference Bills2016; Shavit and Park, Reference Shavit and Park2016; Hannum et al., Reference Hannum, Ishida, Park and Tam2019). Building on this, we turn our attention to the costs and uncertainty of educational investment caused by positionality.
Also, this study responds to the call for the contextualisation of theory to improve our understanding of the different meanings of a common phenomenon in different national settings (Locke and Thelen, Reference Locke and Thelen1995; van de Werfhorst, Reference Van de Werfhorst2011). The expansion of HE is a common and universal phenomenon across countries, but we expect that this same phenomenon has different characteristics (i.e. whether to be positional or not) and implications (i.e. whether to reduce income inequality or not) within a given context. We consider Esping-Andersen’s welfare regime (Reference Esping-Andersen1990) a relevant contextual factor associated with positional education. We argue that welfare states providing education is an important institutional condition under which positionality is counteracted or encouraged.
2. Theoretical background
2.1. The conditions for positional competition
The problem of positional education is that it generates positional competition for the relative value of education. Of course, not all competitions necessarily lead to suboptimal consequences. Although competition often can efficiently distribute resources and improve performance, this is not the case in positional competition. It increases costs and risks that directly fall on the family and students. It also does not necessarily lead to performance improvement, as it occurs when people are already homogenised to some extent regarding the quality of their performances due to the dispersion of HE.
According to Hirsch (Reference Hirsch1977), there are two environmental conditions for positional competition. First, quantitative expansion in absolute terms is a necessary condition for competition. He uses an analogy of ‘congestion’, in which a substantial number of people with similar levels of education are in limited places with some explicit or implicit hierarchy (Hirsch Reference Hirsch1977, p. 3). He argues that the impacts of an increase in college graduates on the economic outcomes for individuals differ depending on whether the labour market is congested with people having similar educational attainments, assuming that demands for the workforce with a college education are structurally given and temporarily constant.
Second, positional competition is intensified when the expansion is accompanied by the commercialisation of education, meaning that education is produced and exchanged in the market as with a commodity. Commercialisation has several implications for positional competition. Firstly, competition becomes individualised as it takes place in the market among individuals in isolation. Such individualised competition is characterised by a lack of effort to pool costs and risks caused by competition, such as collective actions and state intervention.
Secondly, individualised competition in the market induces people to perceive education as a means for pursuing self-interest, thereby fuelling and reinforcing positional competition. Specifically, on the consumer side, individuals use education to advance or defend their positions by utilising their financial resources; on the supplier side, the profit-seeking suppliers in the market provide various options responding to demands in the name of diversity of choices (e.g. private institutions); the rewards of positional competition are personally granted.
2.2 The link between positionality and welfare regimes
The two factors make education positional coincide with the two underlying dimensions of Esping-Andersen’s welfare regime types (Reference Esping-Andersen1990): stratification and commodification (Arts and Gelissen, Reference Arts and Gelissen2002; Hicks and Kenworthy, Reference Hicks and Kenworthy2003). He classified countries into three regime types by those two dimensions – conservative, liberal and social democratic regimes.
The first factor for positional competition, the quantitative expansion of HE, is structurally conditioned by the degree of stratification in welfare regimes. Stratification is featured by social order structured by social class, which typifies a conservative regime. On the contrary, liberal and social democratic regimes oppose the traditional conservative regime by promoting individual freedom and universalism through broad class unity.
Social stratification is reflected in stratified education systems in ways that restrict access to HE (Kerckhoff, Reference Kerckhoff2001; Willemse and Beer, Reference Willemse and Beer2012). In a stratified education system, students are often separated into vocational and academic schooling tracks depending on their social backgrounds (Allmendinger, Reference Allmendinger1989; Shavit et al., Reference Shavit, Arum and Gamoran2007). The quantity of HE, therefore, is affected by the degree of stratification in the educational system in different welfare regimes.
The de-stratified educational system is commonly regarded as an indicator of educational equality. However, from a positional perspective, the de-stratification of education is potentially positional because HE is more likely to be expanded in a de-stratified education system. The paradox of education expansion caused by positionality involves the paradox of de-stratification.
The second dimension, commodification, in Esping-Andersen’s welfare regimes refers to reliance on the market to provide welfare services. The similarities between commercialisation as one of the positional factors and commodification are obvious. They display the common recognition that the market plays a limited role as a provider of welfare services, including education.
According to Esping-Andersen’s welfare regimes (Reference Esping-Andersen1990), commodification implies that people rely on the sale of their labour for their survival. The fundamental rule of commodification is featured by self-responsibility against the risks in life because welfare services are not provided as social rights but rather through the market. Consequently, people are forced to seek individualised solutions to social risks, such as human capital improvement. Thus, people tend to invest in their education even though education is commercialised and incurs high costs because of its commercialisation.
Commodified welfare services are a hallmark of liberal political regimes. In contrast, conservative and social democratic regimes provide welfare services as social rights by reducing people’s dependency on the market. The same is true of the provision of HE. HE is provided as a commercial good in the liberal regime, as parents and students pay for the service, whereas it is publicly provided in the conservative and social democratic regimes.
Figure 1 illustrates the configuration of HE provisions in the three welfare regime types according to the two dimensions of welfare regimes. In countries with conservative regimes, access to HE is restricted, which leads to educational stratification. However, expenses on HE are publicly supported, which means HE is de-commodified; in countries with social democratic regimes, there is relatively open access to HE with public financial support. This shows the de-stratified and de-commodified HE provisions; in liberal regime countries, the access to HE is open, implying de-stratified HE, but HE is commodified and thus highly relies on private expenditure. Therefore, we expect that HE is positional in the liberal regime, given that education is positional when a quantitative expansion is accompanied by commodification.
Educational welfare regimes. Sources: Pechar and Andres (Reference Pechar and Andres2011); Willemse and de Beer (Reference Willemse and Beer2012); West and Nikolai (Reference West and Nikolai2013).

2.3. Hypotheses of the effect of HE expansion on income inequality
The relationship between educational expansion and income inequality has received considerable scholarly attention in economics. Adopting the human capital theory (HCT), studies have provided empirical evidence of the reducing effect of education expansion, measured as the average number of years of schooling in the country, on income inequality (De Gregorio and Lee, Reference De Gregorio and Lee2002; Coady and Dizioli, Reference Coady and Dizioli2018). HE expansion, measured as the influx of high-skilled workers into the labour market, also reduces income inequality (Castello-Climent and Domenech, Reference Castello-Climent and Domenech2014).
These results can be explained theoretically by two mechanisms. First, educational expansion causes a shift in the composition of HE groups due to a transfer from low-education and low-income groups to high-education and high-income groups. Second, the wage compression effect subsequently occurs because an increase in the number of workers with HE reduces the wage premium on their HE and skills. Therefore, ceteris paribus, an increase in the supply of college graduates reduces their relative wages (Mincer, Reference Mincer1974; Knight and Sabot, Reference Knight and Sabot1983). Thus, the HCT hypothesis is as follows:
H1: HE expansion generally reduces income inequality (HCT hypothesis).
We construct the second hypothesis using the job competition theory (JCT). Thurow (Reference Thurow1975) questions the linear effect of education expansion. This is because JCT’s theoretical reasoning fundamentally differs from that of HCT. The JCT emphasises that appropriate job opportunities equivalent to HE are important to determine the effect of HE expansion. The problem is that job opportunities are not instantly increased in response to the supply of labour with HE because the JCT’s job structure is rigid.
Also, wages are not as flexible as in HCT but are somewhat inherent to job types; therefore, from the JCT viewpoint, the imbalance between supply and demand caused by HE expansion is likely to be resolved not by adjusting wages but by introducing the competition in ‘a labour queue’ where job candidates are ranked by their educational backgrounds (Thurow, Reference Thurow1975, p. 92). One’s advance in this queue is automatically offset by the retreat of others in this queue. Therefore, attaining HE in JCT does not directly mean transferring to a high-income group as in HCT.
Literature using micro-data has provided evidence that attaining HE does not guarantee high economic returns for all college-educated workers, even though educational opportunities have increased considerably (Dolton and Vignoles, Reference Dolton and Vignoles2000; McGuinness, Reference McGuinness2006). If transfer to the high-income group assumed in HCT is uncertain, the reducing effect of education expansion on income inequality predicted in HCT is also uncertain.
Previous empirical studies in cross-national settings have shown that the reducing effect of education expansion on income inequality is decreasing in developed countries, where high levels of education expansion occur compared with developing countries (Coady and Dizioli, Reference Coady and Dizioli2018). This reducing effect was even reversed in Checchi (Reference Checchi2001). Therefore, we draw our second hypothesis as follows:
H2: The reducing effect of HE expansion on income inequality is attenuated as HE expands (JCT hypothesis).
JCT challenges whether the reducing effect of HE expansion is sustained. JCT and positional theory are similar at this point. However, what distinguishes positional theory from JCT is that positional theory considers the commercialisation effect, which is another important factor for the positionality of education along with the quantitative expansion. By combining the effect of the continued expansion of education and commercialisation, positional theory challenges the following HCT assumptions.
HCT predictions rely on two key assumptions (Acemoglu and Autor, Reference Acemoglu and Autor2012): (a) the equal probability of belonging to a high-income group, regardless of social and economic backgrounds, because the composition of the high-income group is assumed to be determined only by educational attainments (composition assumption) and (b) educational investments certainly paying off in the labour market (compensation assumption).
However, the positional competition challenges the compositional assumption. Since positional competition creates costs for students and families, economic resources strongly affect the outcomes of positional competition. On the one hand, positionality creates ‘social closure’ by restricting access to opportunities for those who cannot afford educational investments (Alon, Reference Alon2009). On the other hand, the advantaged groups are highly likely to develop and facilitate a strategy to enhance their relative position, utilising their financial resources. The strategy is directed to recover the scarcity of their education under the quantitative abundance of HE and attain a quantitatively similar but qualitatively different education (e.g. prestigious schools) (Lucas, Reference Lucas2001). Therefore, people’s initial socioeconomic positions affect the probability of belonging to a high-education and high-income group.
Second, positional competition also raises questions about the assumption of compensation. It is uncertain whether investing in education will yield a positive return, as there is always a risk of not receiving a payoff in positional competition. Indeed, college education becomes less effective in providing entry to a higher position in the job hierarchy. The uncertainty involved in the positional competition is analogous to a ‘conditional economic lottery’ (Thurow, Reference Thurow1975, p. 92).
A real paradox of education expansion is that, despite uncertainty and risks, educational actors are forced to continue to invest in their education, as they would otherwise fall behind. An ‘educational arms race’ is set up in this way (Goldthorpe, Reference Goldthorpe2013, p. 22). Consequently, the educational game is zero-sum at best in ways that people maintain their current position at the individual level, or one’s advance or gains are offset by the other’s retreat or losses at an aggregated level.
Worse, it may produce a negative sum. Considering the opportunity costs, positional competition causes loss that would not be created if the resources were devoted differently at the societal and individual levels. This loss implies ‘social waste’, which forms a contrast to ‘social investment’ described in recent welfare state literature (Hirsch, Reference Hirsch1977, p. 51). Moreover, although people generally bear the costs caused by positional competition, we cannot neglect the fact that even the same costs and risks impose differential burdens on people depending on their power and resources in the market (Korpi, Reference Korpi2001). At the same time, the returns on educational investments are likely to be higher for the advantaged groups than the disadvantaged groups because they are likely to possess socially and economically valued college education due to their qualitative differentiation strategy.
Therefore, the positional theory predicts that the expansion of positional education may become a ‘brake’ on the reducing effect of education expansion on income inequality and further accelerates income inequality (Hirsch, Reference Hirsch1977, p. 11). We draw a positional hypothesis of the relationship between HE expansion and income inequality as follows:
H3: HE expansion initially reduces income inequality but eventually increases it as it expands, particularly when HE is commodified (positional hypothesis).
3. Methods
3.1. Data
We restricted our samples to developed countries because economic prosperity is also necessary for education expansion beyond basic education and positional competition for relative socioeconomic positions beyond people’s absolute advancement in societies (Hirsch, Reference Hirsch1977). Furthermore, the welfare regime categorisation that our contextualisation relies on has been established in the literature for developed economies and democracies (Bradley et al., Reference Bradley, Huber, Moller, Nielsen and Stephens2001). We extended our analysis to the countries regarded as a fourth regime type in addition to the three types of welfare regimes, such as Southern European (Rhodes Reference Rhodes1996), Mediterranean (Gal Reference Gal2010) and East Asian countries (Esping-Andersen, Reference Esping-Andersen1997; Kwon, Reference Kwon1997). The data are provided by the Organization for Economic Cooperation and Development (OECD), which covers twenty-five developed countries from 2000 to 2020.
3.2. Variables and measures
HE expansion
We conceptualised HE expansion as the inflow of workers who have completed college education into the labour market (Park, Reference Park1996). We measured the HE expansion as a 1-unit increase in the population proportion with HE. The OECD provides data on the population with tertiary education, defined as those having completed the highest level of education by age group as a proportion in the same age group. We chose the 25–34-year-old age group to capture the recent HE expansion.
Positional HE
We have discussed the two contextual factors for positional education: congestion as the considerable quantitative expansion and commercialised education. To measure the degree of congestion, we used the same variable as our main independent variable, the proportion of the population with tertiary education in the 25–34-year-old age group. It enables us to examine the effects of HE expansion on income inequality at the different initial levels of HE expansion (Bol Reference Bol2015).
Second, we measured the degree of commercialisation of HE using the data on public spending on tertiary education as a percentage of total education spending provided by the OECD. In this measure, private spending refers to the contribution to the costs of education by households, for example, students and their families, and other private entities, including private businesses and non-profit organisations. However, since private entities contribute only a small proportion of the total spending, we employed this indicator to determine the financial burden on students and families due to HE commercialisation. This measure shows a small degree of time variation, which is useful as a proxy for the contextual and structural conditions under which educational expansion occurs.
Income inequality
The Gini coefficient is the most commonly used measure of inequality in previous studies on the relationship between education expansion and economic inequality. It provides information on overall inequality in countries (Sen, Reference Sen1997; Cowell, Reference Cowell2009). The income used to calculate the Gini index is equivalent to household disposable income, referring to income after tax and accounting for transfer earnings; the reference unit is a household, and the observations are adjusted for the size and composition of the household (Atkinson et al., Reference Atkinson, Rainwater and Smeeding1995).
Controls
HE expansion as the inflow of labour with HE is a supply-side factor; therefore, we controlled for demand-side factors that might affect positionality and income inequality. These include GDP per capita Footnote i (Alderson and Nielsen, Reference Alderson and Nielsen2002) and skill demand,Footnote ii as the capacity of a country that accommodates workers with HE is measured by the size of the tasks undertaken by college workers (Acemoglu and Autor, Reference Acemoglu and Autor2012); unemployment rates,Footnote iii as a proxy for overall job opportunities in the labour market (Di Stasio et al., Reference Di Stasio, Bol and Van de Werfhorst2016); and openness,Footnote iv which is likely to increase the demand for skilled workers, measured as the ratio of exports to imports as a share of GDP following previous studies (Moller et al., Reference Moller, Huber, Stephens, Bradley and Nielsen2003; Castello-Climent and Domenech, Reference Castello-Climent and Domenech2014).
3.3. Methodological strategy
We undertook two analyses. Our first analysis is to identify the configuration of the countries on the basis of the correspondence between two factors for positional education and two dimensions of welfare regimes (Analysis 1). This first analysis plays a role in complementing our second analysis, a conventional regression analysis, by illuminating the cases left in the ‘black box of purely statistical analysis’ (Goldthorpe, Reference Goldthorpe2006, p. 204) and making specific country cases ‘visible’ (Shalev, Reference Shalev2007, p. 264).
In Analysis 1, we adopted a two-dimensional analysis and arranged the countries in two dimensions constructed by positional factors (Bonoli, Reference Bonoli1997). We then classified countries using k-means cluster analysis to identify which groups of the countries were located in the positional section. Our cluster analysis was carried out at three points in time to trace the change in the formation of the countries and to check the consistency of group membership and the patterns of HE provision over time. We also conducted an analysis of variance (ANOVA) and post hoc Scheffé test to survey the validity of our grouping – whether the differences between groups were statistically meaningful and, if so, which groups were significantly different in a one-to-one comparison.
We then analysed the relationship between HE and income inequality using regression (Analysis 2). The research model is illustrated in Figure 2: H1 examines a generalised relationship between HE expansion and income inequality without contextual variables, such as the initial levels of the expansion and the degree of commercialisation (human capital hypothesis); second, we specified and contextualised the relationship between HE expansion and income inequality depending on the initial levels of HE expansion in H2 (job competition hypothesis); H3 is our main analysis testing how positional HE, defined as the combination of congestion as a considerable quantitative expansion and commodification, affected the relationship between HE expansion and income inequality (positional hypothesis).
Research model.

We measure the congestion as the considerable quantitative expansion using the same variable as our main independent variable. Thus, our equation produced a squared term for the HE expansion variable and tested the curvilinear relationship between HE expansion and income inequality.
In addition, the positional hypothesis goes further and includes another component of positional education: commodification, measured by public spending. Consequently, the positional model contains a three-way interaction term. Therefore, we obtain the following equation:
 $$\eqalign{ & {Y_{it}} = {\beta _0} + {\beta _1}POPU + {\beta _2}PUBEX{P_{it}} + {\beta _3}POPU_{it}^2 + {\beta _4}POP{U_{it}}PUBEX{P_{it}} \cr & \quad \quad \quad + {\beta _5}POPU_{it}^2PUBEX{P_{it}} + {\beta _6}{X_{it}} + {\alpha _i} + {\varepsilon _{it}} \cr} $$
where the subscripts refer to country $i$
and year
$i$
and year $t$
, respectively;
$t$
, respectively; $Y$
is a measure of income inequality;
$Y$
is a measure of income inequality; $POPU$
stands for the proportion of the population with HE; and
$POPU$
stands for the proportion of the population with HE; and $PUBEXP$
denotes the public expenditure on HE as a proportion of total spending on HE. There are three interaction terms:
$PUBEXP$
denotes the public expenditure on HE as a proportion of total spending on HE. There are three interaction terms: $POPU \times POPU$
,
$POPU \times POPU$
, $POPU \times PUBEXP$
and
$POPU \times PUBEXP$
and $POPU \times POPU \times PUBEXP$
. Finally,
$POPU \times POPU \times PUBEXP$
. Finally, $X$
denotes the aforementioned set of control variables that influenced income inequality independently of our two main explanatory variables, and two error terms –
$X$
denotes the aforementioned set of control variables that influenced income inequality independently of our two main explanatory variables, and two error terms – $\alpha $
stands for a country-specific constant over time characteristic of the country, and
$\alpha $
stands for a country-specific constant over time characteristic of the country, and $\varepsilon $
collects the error term, which varied across countries and time.
$\varepsilon $
collects the error term, which varied across countries and time.
About the modelling strategy, the Hausman test suggested a fixed-effect (FE) model in which a unit-specific and time-invariant component that might affect income inequality is controlled. However, there is a limit to fully estimating the effect of positionality on the relationship between HE expansion and income inequality using FE model because ‘in controlling out context, FE models effectively cut out much of what is going on – goings-on that are usually of interest to the researcher’ (Bell and Jones, Reference Bell and Jones2015, p. 134). The same applies to this study’s hypothesis that an increase in population with HE may have a different effect on income inequality depending on the components inherent to the countries (i.e. historically built welfare regimes). In particular, our positional hypothesis includes the interactions between the effect of the relatively unchanging and time-invariant variable (i.e. public spending on HE) and the time-varying variable (i.e. the increase in population with HE). We, therefore, estimated a random effect, along with the FE effect, which allows for a between-country effect based on the assumption that unit-specific components are randomly distributed across the cases.
Our data have many missing values. If the data were complete, there would be 525 observations for all variables because we have twenty-five countries for 21 years. The number of observations for each variable differs because of missing data (Table 1). Therefore, we used the multiple imputation (MI) method (Rubin Reference Rubin1987), considered ‘the optimal method’ compared with list-wise deletion, for dealing with missing values (van Ginkel et al., Reference Van Ginkel, Linting, Rippe and Voort2020, p. 297).
Descriptive statistics

Note: Note: td Dev., standard deviation; Min, minimum; Max, maximum.
The purpose of MI is to correctly reproduce the variance and covariance matrix for estimation we would have observed had the data been completed. In MI, therefore, imputed values should preserve the structure in the data as well as the uncertainty about the structure, and thus, we should decide upon the distribution of the data (Craig, Reference Craig2010). We assumed that all variables in the imputation model jointly follow a multivariate normal (MVN) distribution.Footnote 1 It uses a Bayesian approach (with a Markov chain Monte Carlo algorithm) to obtain imputed values from the estimated multivariate normal distribution. MVN is the most common parametric approach for MI. Simulation studies have shown that MVN leads to reliable and unbiased estimates in most cases unless the sample size is extremely small and the proportion of missing data is high (e.g. Lee and Carlin, Reference Lee and Carlin2010). We also should note that we used the transform-then-impute method to treat quadratics and interaction – i.e., calculate the interactions or squares in the incomplete data and then impute these transformations as with any other variables, as suggested by von Hippel (Reference Von Hippel2009).
4. Analysis and findings
4.1. The configurations of the countries (Analysis 1)
We found five groups in 2000 and 2015 and three groups in 2020.Footnote 2 The clusters had statistically significant between-group differences in our two dimensions, population with HE and public spending on HE, and also had a large effect size as seen in Eta-squared, showing more than 80 per cent of the total variance in population with HE and public spending is explained by between-group differences in our two dimensions (see the results of ANOVA in Table 2), suggesting that there is a sharp distinction between clusters and considerable similarities between cases within a cluster in both dimensions.
ANOVA and one-to-one comparison between clusters

Note: Significance levels are *p < 0.05, **p < 0.01, and ***p < 0.001.
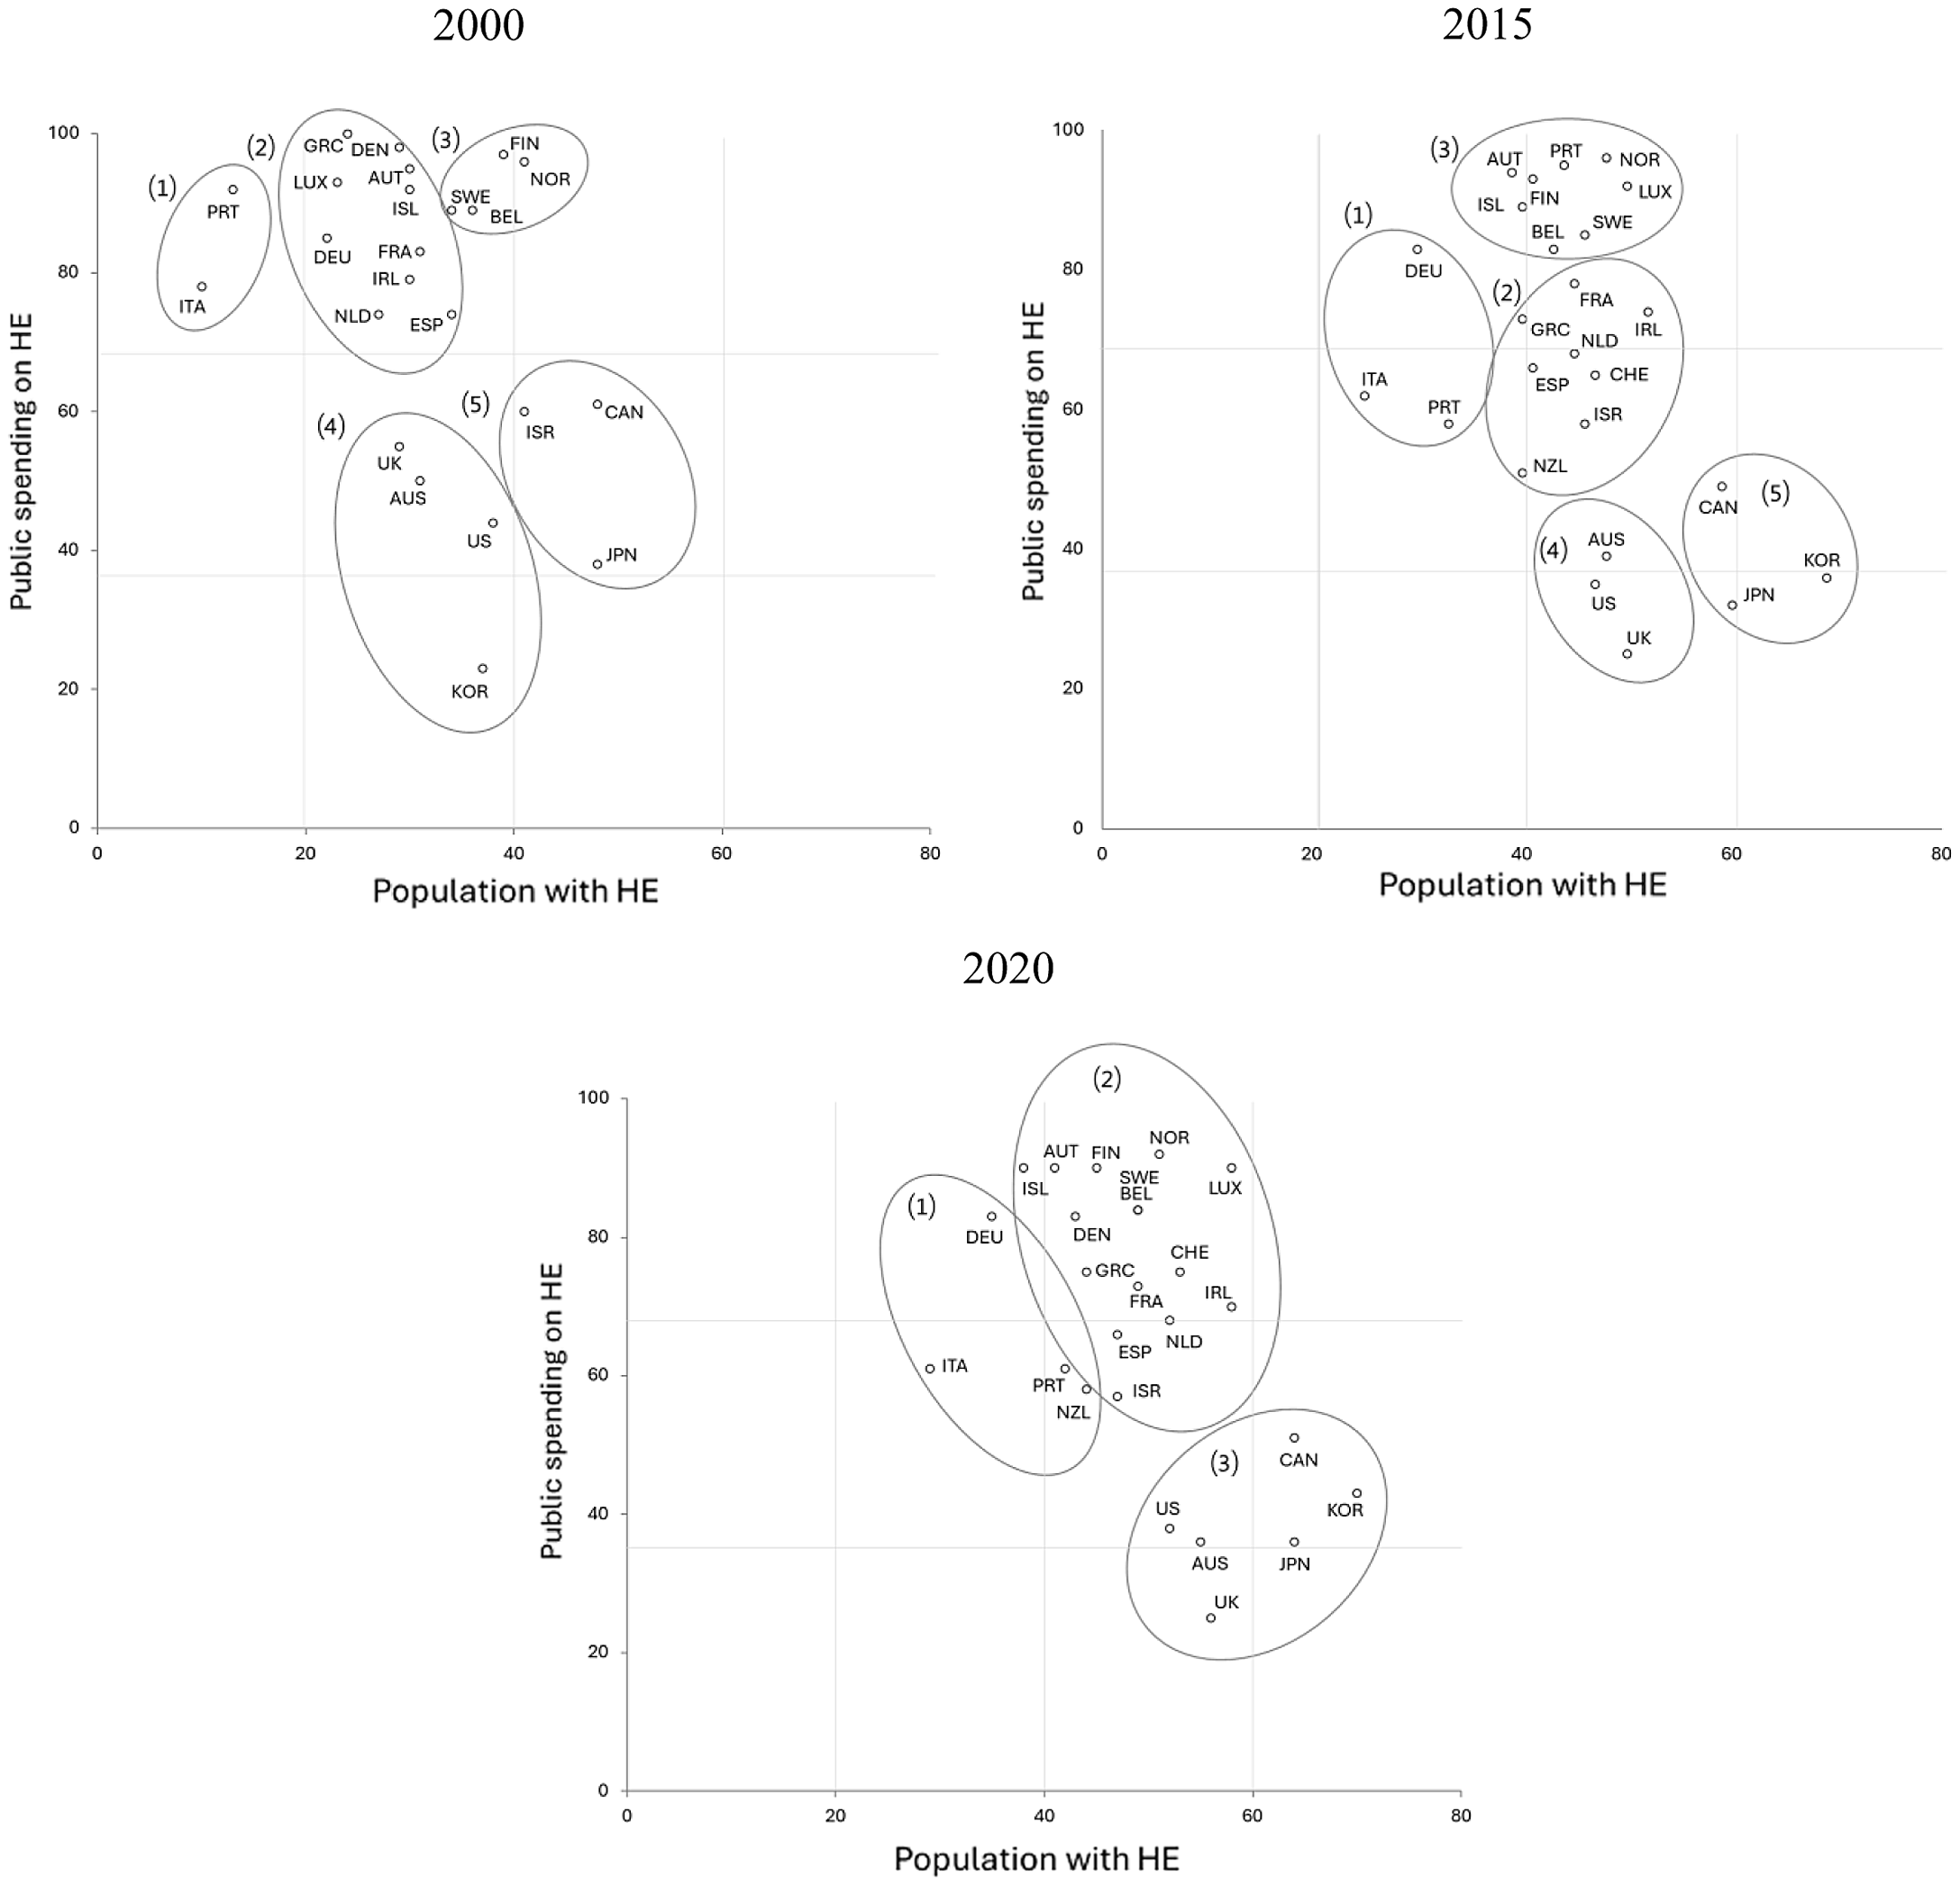
Figure 3 presents the results of the cluster analysis. We should note that unstandardised values are used in Figure 3 and Table 3 to readily identify the configuration of the countries in reality. The results show that Cluster (C) 4 (C4) and C5 in 2000 and 2015 and C3 in 2020 are located on the lower right in the graphs, where two positional factors intersect.
The configurations of the countries by two dimensions. Notes: Unstandardised values; the population with HE (x-axis) is measured as the proportion of the population with HE in the 25–34-year-old age group (percentage); public spending on HE (y-axis) is measured as a proportion to total spending on HE (percentage); no data for CHE, NZL in 2000 (CHE, Chile; NZL, New Zealand).

The mean values of two dimensions and income inequality in five clusters

Notes: Unstandardised values are reported; popu, proportion of the population with HE in the 25–34-year-old age group (%); pubexp, public spending on HE as a proportion of total spending on HE (%); GM, grand mean; SD, standard deviation.
AUS, Australia; AUT, Austria; BEL, Belgium; CAN, Canada; DEN, Denmark; FIN, Finland; FRA, France; DEU, Germany; GRC, Greece; ISL, Iceland; IRL, Ireland; ISR, Israel; ITA, Italy; JPN, Japan; KOR, South Korea; LUX, Luxembourg; NLD, Netherlands; NZL, New Zealand; NOR, Norway; PRT, Portugal; ESP, Spain; SWE, Sweden; UK, United Kingdom; US, United States of America.
Scholars have pointed out that welfare regime consistency is, in principle, difficult to achieve because socioeconomic changes or demands for new policies continuously generate policy dynamics (Abrahamson, Reference Abrahamson1999; Kasza, Reference Kasza2002). Indeed, C2 and C3 showed noticeable changes – the countries in C2 in 2000 are usually classified as conservative-regime countries in literature; however, those countries moved to C3 in 2015, having Nordic countries with social democratic welfare regimes.Footnote 3 It contradicts the traditionally defined characteristics of conservative regimes, such as the reluctance to expand HE. It suggests that welfare regimes can be changed (Palier, Reference Palier2000). However, the positional groups (C4 and C5 in 2000 and 2015 and C3 in 2020) showed a strikingly consistent and enduring pattern: a relatively high proportion of people with HE and low public spending on HE.
C4 and C5 displayed a significant difference in HE expansion, as seen in the Scheffé test in Table 2. C5 showed the highest proportion of the population with HE (45.7 per cent and 62.6 per cent of the population completed HE in 2000 and 2015, respectively, where the mean values were 31.5 per cent and 45.1 per cent, respectively, see Table 3).
However, these are strikingly similar in the commodification dimension. C4 showed the lowest levels of public spending (43.0 per cent and 37.5 per cent, where the mean of all cases is 75.9 per cent and 67.2 per cent in 2000 and 2015, respectively), and C5 showed the second lowest levels of public spending (53.2 per cent and 39.2 per cent in 2000 and in 2015 in respect), as shown by Table 3. In addition, the difference in the levels of public spending on HE between C4 and C5 was insignificant, according to the Scheffé test in Table 2.
In contrast to the similarities within positional groups, C4 and C5, in commodification, the differences between positional groups and other clusters in the proportion of public spending on HE are significant (see the Scheffé test in Table 2). The same is true of C3 in 2020. In sum, the positional groups, such as C4 and C5 in 2000 and 2015 and C3 in 2020, are distinguished from the others by commodification. In other words, the countries were configured in a manner forming a sharp divide between de-commodification and commodification – in 2000, C1, C2 and C3 versus C4 and C5 and, in 2015, C1 and C2 versus C3 – as if there was a diagonal line across the graph in Figure 3.
Such a divide parallels income inequality; C4 and C5 demonstrated higher income inequality than the other three clusters (Table 3). Differences in the Gini coefficient between the groups with the lowest and highest levels of public spending on HE are particularly significant, as shown by the differences between C3 and C4 in 2000 and 2015 and C2 and C3 in 2020.
4.2. The effect of HE expansion on income inequality (Analysis 2)
Table 1 presents the descriptive statistics for all variables used in Analysis 2.
Interpreting the results of a three-way interaction term is complex. Plotting the relationship allows a quick indication of the three-way interactions. A plot in Figure 4 shows that when public spending was low, the increase in population with HE reduced income inequality in the initial phase of HE expansion, but such a reducing effect was attenuated, and then income inequality increased with the increase in the population with HE (U-shaped relationship). By contrast, when public spending was high, the HE expansion initially increased income inequality but eventually reduced income inequality as HE increased from low to high expansion levels (inverted U-shaped relationship). The fixed and random effect models showed a similar pattern.
The relationship between HE expansion and income inequality.

Table 4 presents the results of the regression analysis. There was no autocorrelation, and a robust standard error was used. Note that the Gini coefficient is relatively constant within a given country over time, and the variation of time-varying predictors within a panel is limited. This is why the R-squared value is very small in our FE model. Also, we needed to rescale the independent variables to make the coefficients presented in Table 4 interpretable for the same reason.
The relationship between HE expansion and income inequality

Note: N = 521; population with HE, public spending on HE, skill demands, and unemployment rates are divided by 100 to rescale them. † p < 0.1, *p < 0.05, and **p < 0.01.
Model 1 is a baseline analysis that used only controls, without explanatory variables of interest. Our main explanatory variable is the proportion of the population with HE. In addition to that, there are two contextual variables we are interested in: the initial levels of the population with HE (as a proxy for congestion as a considerable quantitative expansion) and the levels of public spending on HE (as a proxy for de-commodification). In Model 2, we tested the effect of the proportion of the population with HE independent of those two contextual variables (HCT hypothesis). We found no significant effect of HE expansion on income inequality in Model 2. Thus, Hypothesis 1 was not supported.
Model 3 includes one contextual variable, quantitative HE expansion, to test the JCT hypothesis. The result showed that the relationship between HE and income inequality was U-shaped, indicating that the increase in the population with HE reduced income inequality in the initial phase, but it eventually increased income inequality. The turning points, where the reducing effect turns to the increasing effect, are approximately 35.1 per cent and 36.9 per cent in the fixed and random models, respectively. Thus, Hypothesis 2, in which the attenuated reducing effect was expected, was partly supported.
Finally, we tested the effect of the increase in the population with HE on income inequality when two contextual factors were combined in Model 4 (positional hypothesis). The three-way interaction in Model 4 was significant (p < 0.01), suggesting the different effect of the increase in the population with HE on income inequality depending on how the two positional factors are combined.
According to the simple slope testFootnote 4 , when public spending was low (−1 SD = 46.8 per cent), the increase in population with HE reduced income inequality, but the slopes gradually became gentler as a population with HE increased from low (−1 standard deviation [SD] = 30.4 per cent, β = –0.0003) to average (mean = 41.2 per cent, β = 0.0000). Then, the increase in population with HE increases income inequality, and the slopes are gradually steeper from average to high levels (+1 SD = 52.0 per cent, β = 0.0003; +2 SD = 62.8 per cent, β = 0.0007).
By contrast, when public spending was high (+1 SD = 89.0 per cent), the increase in population with HE had an increasing effect on income inequality at extremely low levels of the population (−2 SD = 19.6 per cent, β = 0.0003), but soon had a reducing effect (−1 SD = 30.4 per cent, β = –0.0002), and the slopes were gradually steeper (mean = 41.2 per cent, β = –0.0007; +1 SD = 52.0 per cent, β = –0.0012; 2 SD = 62.8 per cent, β = –0.0018).
5. Discussion
To synthesise the findings in Analyses 1 and 2, we can state that HE expansion has a limit to its reducing effect on income inequality in countries with a liberal welfare regime, where HE is likely to be positional as a result of the combined effects of considerable quantitative expansion and commercialisation of HE. We also have shown that HE expansion increased income inequality in the traditional conservative model, depicted as the ‘elite model’, where a relatively low proportion of people attained publicly funded HE (Ansell, Reference Ansell2008). It formed a striking contrast to the social democratic model, in which HE was publicly provided to a high proportion of people, and HE expansion increasingly had a reducing effect on income inequality.
We can identify two sources that may affect different capacities to deal with educational positionality in the different regimes: employment structures and the degree of existing social protections. First, although the demand side was controlled for in our analyses, the capacity to contain the increased supply of educated workers can explain why HE was positional in one regime but not in the other. We could not test the mechanism existing on the demand side, because it is difficult, if not impossible, to calculate the demand for college-educated workers across the three regimes.
Fortunately, however, previous works have provided knowledge of differences in job structure and job creation among the three regimes from previous work. The social democratic regime is characterised by providing quality jobs for highly educated workers and active job creation by the government through public employment. On the contrary, in the conservative regime, job creation is limited due to the contribution-based labour protections, and the demand for college-educated workers is relatively low because of late post-industrialisation (De la Porte and Jacobsson, Reference De la Porte, Jacobsson, Morel, Palier and Palme2011). In liberal regimes, market-led job creation is encouraged, resulting in a distinct divide in job quality. Therefore, the labour market that job candidates with a college education intend to enter is more likely to be congested in a liberal regime when there is an inflow of labour with a college education. This suggests that education positionality can be counteracted or encouraged through employment policies.
Another key factor influencing educational positionality is the degree of social protection.Footnote 5 As positional competition entails costs and risks, pooling and sharing these costs may be able to mitigate the financial impacts on individuals. This suggests policy complementarities between education and social protection policies (Hemerijck et al., Reference Hemerijck, Burgoon, Di Pietro and Vydra2016). As the ‘twin pillars’ of the new welfare state, old social protections and new social investment strategies, including increasing educational opportunities, can effectively mitigate inequality when they coexist (Esping-Andersen, Reference Esping-Andersen2002; Vandenbroucke and Vleminckx, Reference Vandenbroucke and Vleminckx2011, p. 4).
6. Conclusion
This study has examined the effect of HE expansion on income inequality in twenty-four to twenty-five developed countries from 2000 to 2020. Although HE expansion reduced income inequality, we found evidence that the reducing effect was attenuated and eventually increased income inequality when HE had positional characteristics, defined as the combination of congestion referring to a considerable quantitative expansion and commodified education.
We found that HE is likely to be positional in countries classified as liberal regimes in the comparative welfare regime literature and the two East Asian countries (Japan and Korea) in our sampled countries. This indicates that positionality is revealed or mitigated depending on the states’ position in the HE provisions, especially related to the two dimensions of welfare regimes, stratification and commodification.
From a theoretical framework, our analysis found conditional support for either human capital theory or positional theory. This means our findings do not entirely support one theory while contradicting the other. Therefore, our findings do not render all HE expansions effective or ineffective in reducing income inequality.
Particularly, our findings have implications for liberal countries. The redistributive and insurance roles of education are more important in the liberal regime than in other regimes because social protections are less developed in this regime. However, this study showed that HE expansion has a limited role in redistribution and may also create socioeconomic risks due to positional competition. Therefore, liberal countries may mitigate positionality by weakening the characteristics of education as a commodity; for example, it may directly reduce the proportion of private spending on HE and reduce the risks involved in positional competition by indirectly compensating for possible income loss through income maintenance policies.
This study has limitations that should offer opportunities for future research. The theories we employed are firmly established, suggesting a certain causal arrow. In this study, we put positional education before income inequality on the basis of the reasoning that the inflow of the population with college education causes a shift in income distribution across the population. It is inadequate to think that the increase in the Gini index instantly affects the educational decisions of individuals, thereby increasing the number of people who participate in HE. However, causality may work in the opposite direction – higher income inequality accentuates the relative economic positions of individuals, thereby reinforcing the educational positionality. This is possible when it should be assumed that economic inequality does not vary over time as one of the structural conditions under which individual educational decisions are made.
Although we assume that self-interested individuals will likely employ various strategies to advance their relative positions, their interests are structurally generated to some extent. If so, higher economic inequality may increase the willingness of individuals to participate in positional competition to advance their positions. Therefore, there is a need for further investigation at the micro-level of how risks involved in educational investments are perceived and educational decisions are made in different welfare-regime settings where cross-regime variations in economic inequality exist.
Acknowledgements
I especially thank the two anonymous reviewers for their constructive comments.
Competing interests
The author declares none.