


Introduction
Conservation triage is the process of prioritizing efforts to ensure effective allocation of scarce resources (e.g., financial, knowledge) in order to maximize conservation returns (Bottrill et al. Reference Bottrill, Joseph, Carwardine, Bode, Cook and Game2008). Considering that biodiversity conservation is severely underfunded (Echols et al. Reference Echols, Front and Cummins2019), particularly in tropical developing countries (Brooks et al. Reference Brooks, Wright and Sheil2009), there is an urgent need to prioritize efforts to protect areas of high biodiversity and conservation value (Gerber et al. Reference Gerber, Runge, Maloney, Iacona, Drew and Avery-Gomm2018). The generally accepted strategy for promoting biodiversity conservation is the establishment of protected areas (PAs) (Kullberg et al. Reference Kullberg, Di Minin and Moilanen2019), but their performance is contingent on the amounts of financial and technical resources allocated to ensure effective management (Barnes et al. Reference Barnes, Glew, Wyborn and Craigie2018). If resources are limited, PAs can be underfunded, understaffed or inefficiently managed (Le Saout et al. Reference Le Saout, Hoffmann, Shi, Hughes, Bernard and Brooks2013). Ideally, PAs should be established in order to promote biodiversity, enhance ecosystem services and safeguard features of particular conservation value within landscapes (Bertzky et al. Reference Bertzky, Corrigan, Kemsey, Kenney, Ravilious, Besançon and Burgess2012). However, they are often established in landscapes with the lowest opportunity costs (Joppa & Pfaff Reference Joppa and Pfaff2009). Therefore, prioritization of PAs within existing networks will be necessary at an international scale given continued and intense human pressure on protected land (Jones et al. Reference Jones, Venter, Fuller, Allan, Maxwell, Negret and Watson2018).
Conservation triage generally relies on spatial data in order to identify and quantify biodiversity and other features of conservation value across diverse landscapes (Kukkala & Moilanen Reference Kukkala and Moilanen2013). It often requires cumbersome pre- and post-data processing and a detailed assessment of whether its results are relevant for local conditions and the identified conservation goals (Lehtomäki & Moilanen Reference Lehtomäki and Moilanen2013). Moreover, prioritizing areas within an existing PA network may be particularly challenging (Alagador et al. Reference Alagador, Cerdeira and Araújo2014). PAs are often discrete units within heterogeneous and fragmented landscapes surrounded by different types and intensities of land use that can make spatially explicit and computationally intensive methods challenging (Margules & Pressey Reference Margules and Pressey2000). Conservation triage of existing PAs may thus be hindered by data limitations on biodiversity and inherent complications associated with the use of biogeographical spatial data (Brooks et al. Reference Brooks, Mittermeier, da Fonseca, Gerlach, Hoffmann and Lamoreux2006). Consequently, conservationists should employ tools that are not computationally demanding, particularly in developing countries with scarce institutional support and technical capacity (Gardner et al. Reference Gardner, Raxworthy, Metcalfe, Raselimanana, Smith and Davies2015).
One alternative solution is to employ multivariate methods that use indicators of pressures and/or threats to habitat conservation (e.g., rates of habitat loss) in order to help predict the potential of PAs to maintain continuous and diverse habitats that reduce their vulnerability to degradation, fragmentation and the loss of rare and endemic species (Nolte et al. Reference Nolte, Agrawal and Barreto2013). Understanding the current state of expert knowledge (SoK) associated with a site’s biodiversity might be an important first step towards prioritizing existing PAs (Keppel Reference Keppel2014). The use of expert knowledge in conservation has been crucial to the elucidation of the distribution and status (e.g., conservation, endemism) of different taxa (Martin et al. Reference Martin, Kehoe, Mantyka-Pringle, Chades, Wilson and Bloom2018) and their responses to land-use and climate change (Murray et al. Reference Murray, Goldizen, O’Leary, McAlpine, Possingham and Choy2009). However, development pressures may hinder experts’ future ability to study and understand the biodiversity covered by PAs (Barber et al. Reference Barber, Cochrane, Souza and Veríssimo2012). Since relative species diversity may be dependent on how much we know about a site (Murray et al. Reference Murray, Goldizen, O’Leary, McAlpine, Possingham and Choy2009), SoK is an important variable to include in the prioritization of PAs within an existing network. In fact, using observed diversity as a criterion for conservation triage without controlling for SoK can potentially misestimate the total diversity in PAs (Brown et al. Reference Brown, Gordon, Carvalho, Yesuf, Goodman, Raherilalao and Wohlhauser2018).
The aim of this study is to investigate the performance of site prioritization techniques that can be used to rank the conservation priority of PAs established within an existing network. Our objective is to demonstrate how individual and aggregate priority ranks of PAs can be produced by simple heuristic techniques (sensu Gardner et al. Reference Gardner, Raxworthy, Metcalfe, Raselimanana, Smith and Davies2015) that are not computationally demanding. Our multivariate ranks are intended to provide flexibility to stakeholders in terms of the allocation of priorities and to be easily implemented in biodiversity hotspots around the world. We show that employing different methods and including SoK in the estimation of species diversity have significant effects on the ranking of PAs, and we discuss the merits of using individual- and aggregate-based rankings when prioritizing PAs for conservation under limited financial and technical resources. We use five key variables (SoK, forest loss, acceleration in forest cover loss/gain, PA size and multi-taxon species diversity) and the mostly terrestrial PA network of Madagascar (Fig. 1) (Goodman et al. Reference Goodman, Raherilalao and Wohlhauser2018) in order to illustrate the applicability of the method.
(a) Vegetation types of the 98 mostly terrestrial protected areas (PAs) on Madagascar and (b) major land cover types on the island (modified from European Space Agency Climate Change Initiative (ESA CCI) 2015 global datasets). Numbers in brackets in panel a denote numbers of PAs for each type of vegetation. Map projection: Geographical Coordinate System (GCS) using the WGS1984 datum.

Methods
Study setting
Madagascar is an area of global conservation priority characterized by high species diversity and heterogeneity (Goodman & Benstead Reference Goodman and Benstead2004), high rates of floral and faunal endemism (Callmander et al. Reference Callmander, Phillipson, Schatz, Andriambololonera, Rabarimanarivo and Rakotonirina2011) and documented vulnerability to habitat change for certain taxonomic groups (Raxworthy & Nussbaum Reference Raxworthy and Nussbaum2000). Within the terrestrial PAs of the island, forest ecosystems make up one of the main types of natural vegetation with a rich assortment of plants and animals, including many endemics even at higher taxonomic levels. The native vegetation of the island is treated in detail elsewhere (Gautier et al. Reference Gautier, Tahinarivony, Ranirison, Wohlhauser, Goodman, Raherilalao and Wohlhauser2018, Lowry II et al. Reference Lowry, Phillipson, Andriamahefarivo, Schatz, Rajaonary, Goodman, Raherilalao and Wohlhauser2018), with specific reference to the PA system of Madagascar. Loss of natural forests is the greatest threat to the terrestrial biodiversity of the island, and the pressure remains considerable (Vieilledent et al. Reference Vieilledent, Grinand, Rakotomalala, Ranaivosoa, Rakotoarijaona, Allnutt and Achard2018, Yesuf et al. Reference Yesuf, Brown and Walford2019).
In an effort to address continued habitat loss, Madagascar has experimented with different PA governance strategies, ranging from strict to shared governance (Virah-Sawmy et al. Reference Virah-Sawmy, Gardner and Ratsifandrihamanana2014). The country has also invested heavily in broadening its PA network through the Durban Vision, going from 47 sites to 122 sites between 2003 and 2015, which increased the total area under protection (terrestrial and marine) from 1.7 million ha to 7.1 million ha (Gardner et al. Reference Gardner, Nicoll, Birkinshaw, Harris, Lewis, Rakotomalala and Ratsifandrihamanana2018). The main conservation goals of Madagascar’s PAs have evolved over time (Langrand & Roland Reference Langrand, Roland, Goodman, Raherilalao and Wohlhauser2018). Many PAs were originally established for biodiversity conservation, scientific research and recreation (International Union for Conservation of Nature (IUCN) categories Ia, II and IV). However, there has been a recent shift towards promoting multiple-use sites that allow sustainable extraction of natural resources (e.g., construction and fuel wood) in order to encourage poverty mitigation and community development (IUCN categories V and VI) (Rakotoson & Razafimahatratra Reference Rakotoson, Razafimahatratra, Goodman, Raherilalao and Wohlhauser2018). Therefore, the current conservation goals for Madagascar’s PA network are diverse, ranging from conserving biodiversity and maintaining ecosystem services to promoting the sustainable use of natural resources and maintaining genetic diversity (Langrand & Roland Reference Langrand, Roland, Goodman, Raherilalao and Wohlhauser2018).
Variables used to rank PAs
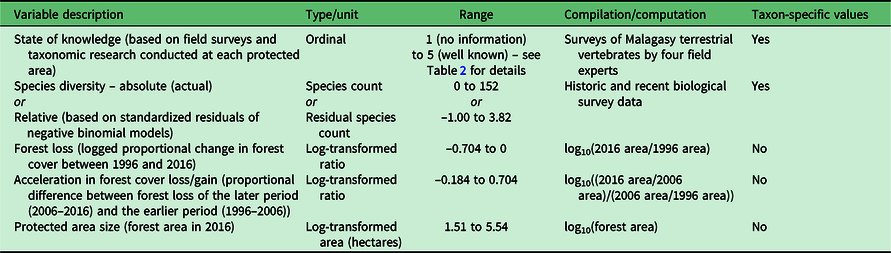
The study focused on 98 mostly terrestrial PAs on Madagascar (Fig. 1) (Goodman et al. Reference Goodman, Raherilalao and Wohlhauser2018). The ranking of PAs was based on five sets of variables collected at each site (Table 1), as follows:
1. SoK: taxon-specific SoK was assessed by four different experts for eight vertebrate taxonomic groups (amphibians, reptiles, birds, tenrecs, rodents, bats, carnivorans and lemurs) at each of the 98 sites. Over 100 years of field surveys and associated taxonomic research was conducted between them on Malagasy terrestrial vertebrates: amphibians and reptiles (APR), birds (SMG and MJR), tenrecs and rodents (SMG and VS) and bats, carnivorans and lemurs (SMG). This variable is a measure of their assessment of the relative level of knowledge for each group at each site, which includes the degree of local research in the form of biological inventories and associated taxonomic research, superimposed on the habitat and elevational complexity of the site. SoK was an ordinal variable ranging from 1 (no information) to 5 (well known) (Table 2).
2. Species diversity: absolute species diversity (number of species) for each of the eight taxonomic groups was compiled from historic and recent biological survey data available for the 98 sites. Given the strong dependence of species diversity on SoK across all taxa, even when controlling for differences in PA size (Appendix S1.1, available online), we also estimated relative species diversity within each of the eight taxonomic groups using standardized residuals from negative binomial models of species diversity regressed onto SoK (Appendix S1.2) in order to account for between-site variance in species diversity within SoK categories. We used the standardized residual values as measures of relative species diversity for each taxon across sites when taking SoK values into account.
3. PA size: forest cover at each site was assessed for 1996, 2006 and 2016 (Goodman et al. Reference Goodman, Raherilalao and Wohlhauser2018). PA size was calculated as the base-10 logarithm of remaining forest area (in hectares) within each PA as of 2016. Forest cover was not detected for four PAs (Lac Alaotra, Ampanangandehibe-Behasina, Ibity and Itremo), either because the forest parcels were too small or because no forest was present (e.g., Lac Alaotra is a lake).
4. Forest loss: forest cover change was calculated as the logarithm of overall relative change in forest cover between 1996 and 2016 (i.e., the difference in the logged values of forest cover in 2016 and 1996, or log(2016 area/1996 area)). Positive values indicate an increase in forest cover, while negative values indicate a loss (higher-magnitude values indicate a greater change). While most accurately described as logged proportional change in forest cover, hereafter this variable is referred to as ‘forest loss’.
5. Acceleration in forest cover loss/gain: the acceleration in forest cover change was calculated as the logged proportional difference between forest cover change of the later period (2006–2016) and the earlier period (1996–2006) as log((2016 area/2006 area)/(2006 area/1996 area)). Negative values indicate an increase in forest loss or slowing/reversal of forest gain, while positive values indicate a slowing or reversal of forest loss.
Description of the five variables used to build individual and aggregate priority ranks of protected areas. Variables designated as having taxon-specific values are recorded separately for eight different taxonomic groups at each site. These eight values are combined into a single site-specific value following procedures described in the ‘Methods’ section.
Explanation of the state of knowledge (SoK) classification (modified from table 391 in Brown et al. Reference Brown, Gordon, Carvalho, Yesuf, Goodman, Raherilalao and Wohlhauser2018, pp. 1693–1705). SoK was specified differently for birds and lemurs (specimens were generally not important for specific identification as these organisms are relatively easy to identify visually) and other land vertebrates (specimens were often important for specific identification as many of the species can only be identified in hand or based on different morphological characteristics).

The conservation goals of our prioritization scheme, as applied to the existing terrestrial PA network of Madagascar, were to: (1) identify priority PAs where knowledge gaps indicate more research effort is needed in order to understand the local biodiversity given current rates of forest loss; (2) identify priority PAs where habitat degradation has increased in recent years and are therefore particularly vulnerable to the loss of unique species in the near future and in urgent need of conservation intervention; and (3) identify priority PAs of high species diversity and therefore of high conservation value.
Combining taxon-specific variables
While some variables had site-specific values that did not differ by taxon (forest loss, acceleration in forest cover loss/gain and PA size), others had eight values per site, each associated with a different taxon (SoK and species diversity). We used two different approaches in order to combine information across all eight taxa into single site-specific values for those variables: either by estimating the first principal component (PC1) of a principal component analysis (PCA) of all eight taxon-specific variables in order to generate site-specific PC1 scores (Appendices S1.3 & S1.4) or by calculating an unweighted mean of the values across all eight taxonomic groups for each site. Rankings based on either the PCA-generated values or the unweighted means of taxon values were likely to be similar given that all taxa loaded in the same direction on PC1 when partitioning the variance among variables (Appendix S1.5).
Triage scenarios (individual and aggregate methods)
After completion of all of the above procedures, all site-specific variables were standardized to mean zero and unit variance. In order to generate aggregate ranks, we first binned sites into different priority groups by identifying natural breaks in the distribution of standardized values for each variable or creating bins one standard deviation wide if no natural breaks were apparent (Appendix S1.6). Sites that fell within the same bin for a given variable (e.g., SoK) were considered of equal priority with respect to that variable. We used the following subjective criteria:
1. SoK: we split standardized data into five bins one standard deviation wide. We assigned highest priority (lowest rank) to PAs for which SoK was low.
2. Forest loss: we used natural breaks in standardized forest loss (forest cover in c. 2016 relative to c. 1996) in order to assign sites to four bins. We assigned highest priority to PAs with high proportional forest cover loss.
3. Acceleration in forest cover loss/gain: we used natural breaks in the rate of change of forest loss to assign sites to three bins (corresponding to increasing loss in the 2006–2016 period relative to the earlier period, little to no difference between the two periods or decreasing loss in the 2006–2016 period). We prioritized PAs with accelerated forest cover loss.
4. PA size: we split standardized log-transformed data for forest area remaining in each PA in 2016 into five bins one standard deviation wide. We assigned highest priority to small PAs with low remaining forest cover.
5. Relative species diversity: we used natural breaks in standardized residual species diversity across taxa when SoK was held constant in order to assign sites to five bins. We prioritized PAs with higher-than-expected species diversity.
We first ordered sites by SoK priority bin, then within each SoK priority bin by forest loss priority, then within each forest loss priority bin by acceleration in forest cover loss/gain priority, then by PA size priority and finally by relative species diversity priority. This procedure produced an overall priority ranking for each site. We assigned identical overall priority ranks to sites that fell within the same priority bins for all variables. We used these criteria to build two aggregate rankings because we used two different procedures in order to produce site-specific SoK and relative species diversity values: a mean ranking based on variables constructed from unweighted means of taxon values and a PCA ranking that included variables produced by the PCA of taxon values.
Alternative aggregate priority rankings
The aggregation methods described above imposed a priori assumptions about the relative importance of different types of information in prioritizing PAs. For example, more importance was placed on SoK than on any other variable. It then used the other variables to rank within SoK bins. We also implemented the Markov chain (MC) algorithm by Dwork et al. (Reference Dwork, Kumar, Naor and Sivakumar2001) using R code from Wilkinson and Van Duc (Reference Wilkinson and Van Duc2017). This method finds consensus among various expert opinions when the same set of objects are ranked on the same criteria. Here, we used this method to rank the same set of PA sites being ranked on different criteria. In essence, we treated each type of information (i.e., SoK, forest loss, acceleration in forest cover loss/gain, PA size and relative species diversity) as a different ‘expert opinion’ and used the MC algorithm in order to identify a set of consensus ranks among them. We also implemented the PageRank algorithm from Wilkinson and Van Duc (Reference Wilkinson and Van Duc2017). We then used Kendall’s tau to examine the association between all pairwise combinations of priority aggregate ranks (unweighted-derived, PCA-derived, MC and PageRank). We performed all data analyses in R (R Development Core Team 2019).
Spatial distribution of individual priority rankings
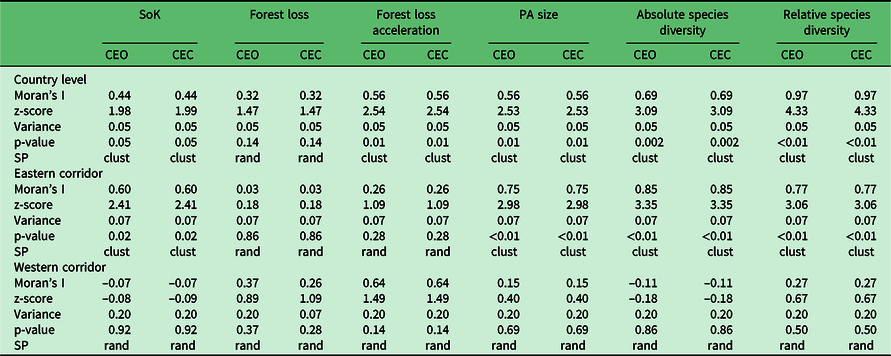
We used Moran’s I tool in ArcGIS (Mitchell Reference Mitchell2005) in order to test whether individual priority rankings were randomly distributed among the 98 PAs. We performed spatial analyses at the country level and at the regional level (east and west) by grouping PAs according to their geographical location or, where location was ambiguous (e.g., PAs in the Central Highlands), by their dominant vegetation (Appendix S1.7). We classified PA priority ranks as either clustered, random or dispersed (Appendix S1.7). In addition to Moran’s I index, we estimated z-scores and p-values in order to check for significance in the observed patterns.
Results
Individually ranked variables
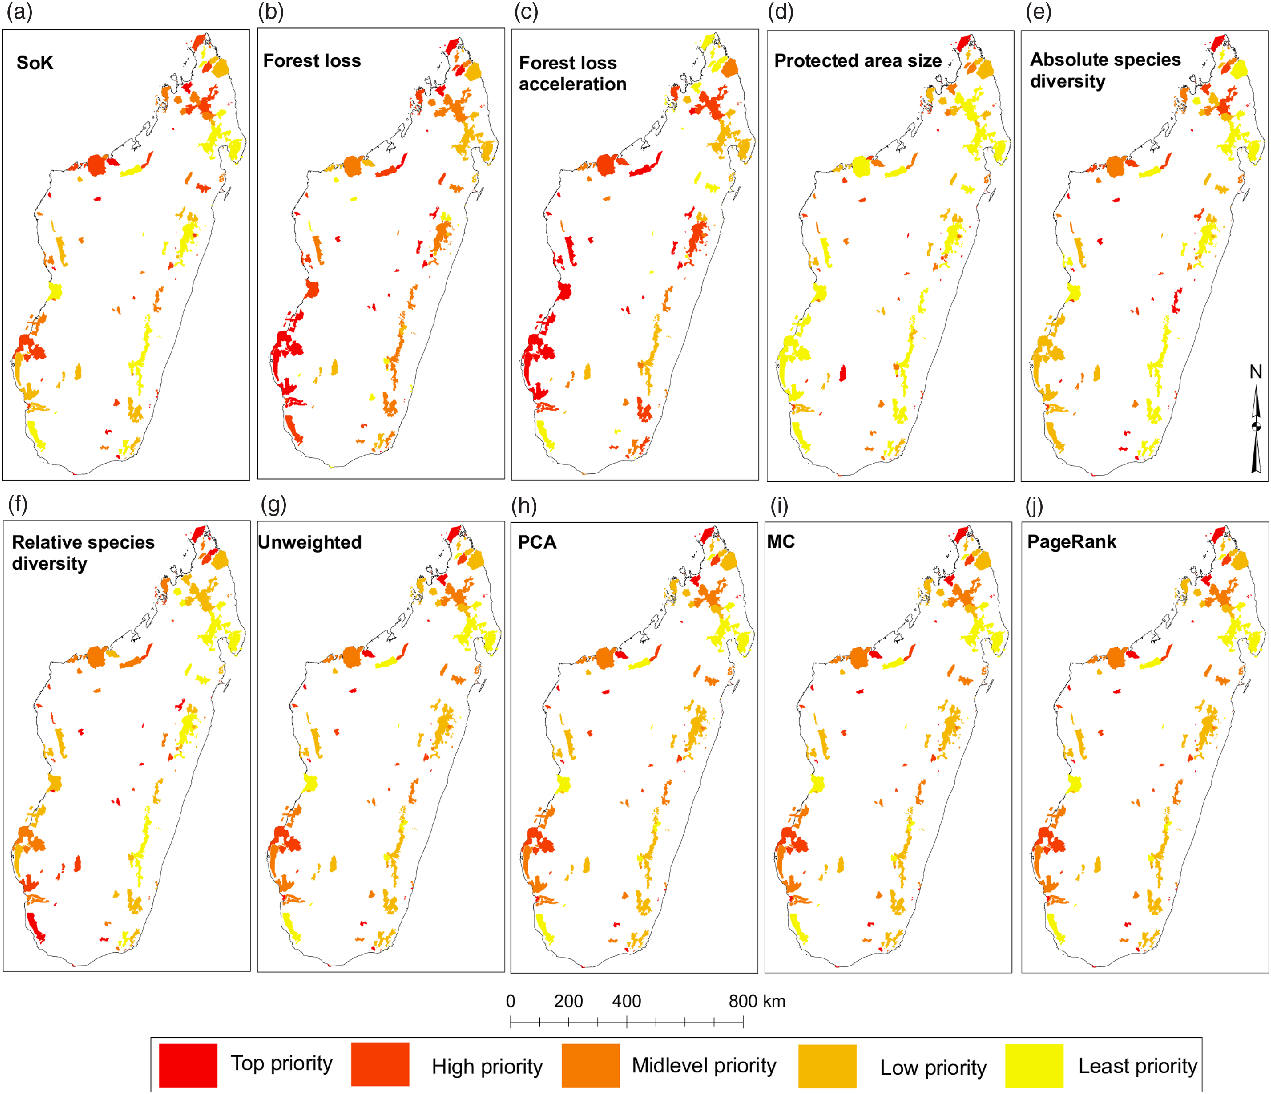
The spatial distribution of priority ranks based on individual variables showed some degree of regional bias, as most of the variables presented spatial clustering at the country level and along the eastern corridor (Fig. 2a–f, Table 3 & Appendix S2). Overall, PAs in the west seem to have been relatively little studied compared to those in the east, which may also have resulted in lower levels of relative species diversity, as evidenced by the spatial clustering of high-priority ranks for SoK (Fig. 2a) and absolute (Fig. 2e) and relative species diversity (Fig. 2f) in the west (Table 3). SoK (Fig. 2a) was relatively high along the eastern corridor dominated by lowland and medium-altitude evergreen moist forests that resulted in spatial clustering of low-priority ranks for that variable in the east (Table 3). In the western region, covered mostly by dry deciduous forests and dry spiny thickets, SoK (Fig. 2a) ranks were randomly distributed with no bias towards any particular type of vegetation (Table 3).
Protected areas (PAs) on Madagascar categorized by individual (a–f) and aggregate (g–j) priority rankings. Ranks were binned in intervals of 20 and classified into five categories (see legend). Categories may have more than 20 PAs due to tied rankings (see Appendix S2). Map projection: geographical coordinate system (GCS) using the WGS1984 datum. MC = Markov chain; PCA = principal component analysis; SoK = state of knowledge.
Results of spatial autocorrelation analyses using Moran’s I in order to assess the distribution of priority ranks between protected areas (PAs) using individual variables. Analyses were performed at the country level and for the eastern and western corridors separately. CEC = contiguity of edges and corners; CEO = contiguity of edges only; clust = clustered; rand = random; SoK = state of knowledge; SP = spatial pattern.
Rates of forest loss (Fig. 2b) and acceleration in forest cover loss (Fig. 2c) were randomly distributed along both corridors. However, ranks of acceleration in forest cover loss showed spatial clustering at the country level (Table 3), probably because of the high number of ‘top-priority’ PAs distributed across the two regions (Fig. 2c). The top ranks for PA size (circumscribed by forest area size) were inherently biased towards PAs with small areas of forest cover (Fig. 2d), since that was the ranking criterion for this variable, and they were spatially clustered along the eastern corridor (Table 3).
Absolute and relative species diversity showed distinct priority ranks and confirmed that accounting for SoK (i.e., research effort and subsequent taxonomic research) when generating ranks based on measures of species diversity made a significant difference (Appendix S3). For instance, the dry spiny thickets in the southwest were assigned mid-level ranks when considering absolute species diversity (Fig. 2e), but top ranks when accounting for the level of knowledge of the local biodiversity (Fig. 2f). The ranks of both species diversity measures were spatially clustered along the eastern corridor, but were random in the west (Table 3).
Aggregate priority ranks
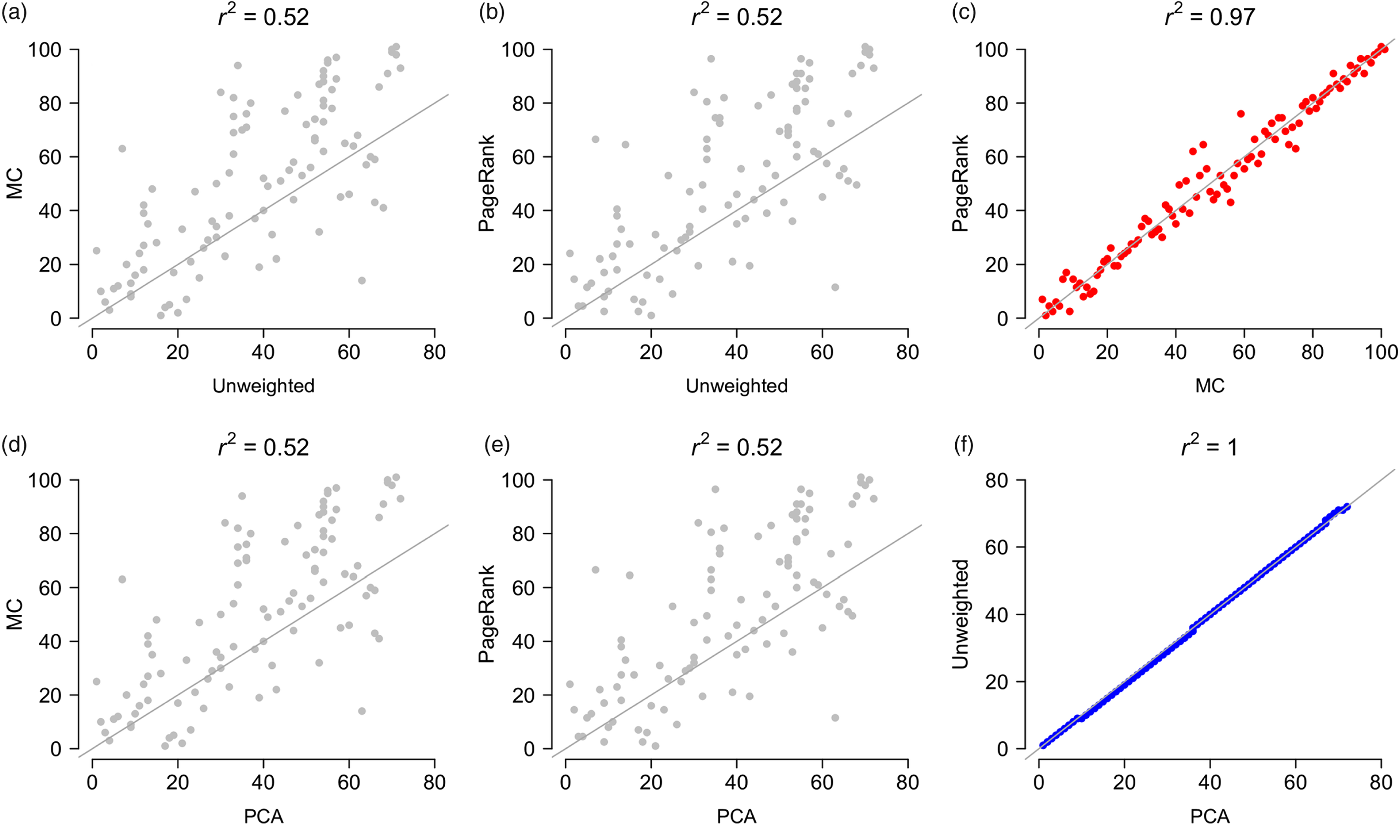
Most of the PAs in the top aggregate priority ranks were located along the western corridor (mostly dry deciduous vegetation) and in the northern region (mainly evergreen moist vegetation), regardless of the type of aggregator used to prioritize sites (Fig. 2g–j & Appendix S2). Most of the low-priority PAs were concentrated along the eastern evergreen moist corridor (Fig. 2g–j). The aggregate ranks were significantly correlated with each other (Appendix S3), but the strengths of the associations changed significantly depending on what pairwise combinations were compared. The unweighted- and PCA-derived ranks were statistically indistinguishable from perfectly correlated ranks, and the MC and PageRank ranks were very strongly correlated with each other (Fig. 3 & Appendix S3). However, the unweighted- and PCA-derived ranks were relatively weakly correlated with the MC and PageRank ranks (Fig. 3), suggesting that each provided a distinct measure of priority.
Pairwise comparisons between the four aggregate rankings (unweighted, PCA, MC and PageRank). Comparisons of the unweighted and PCA ranks with the MC and PageRank ranks (a, b, d & e) are in grey; comparisons between the MC and PageRank ranks (c) are in red and between the PCA and unweighted ranks (f) are in blue. Grey line is an identity (1:1) line (intercept = 0, slope = 1). MC = Markov chain; PCA = principal component analysis.
Discussion
The multivariate methods presented here contribute to conservation triage in biodiversity hotspots and integrate four essential components of data-based conservation efforts: (1) the use of indicators of pressure and/or threat to habitat conservation; (2) the use of expert knowledge derived from field surveys of local biodiversity and subsequent taxonomic research; (3) the flexibility of individually prioritizing pertinent variables for conservation planning; and (4) the aggregation of individual ranks in order to find the best possible consensus among different priorities.
The unweighted- and PCA-derived aggregate ranks gave higher priority to sites with low SoK since this was selected in advance as being the most important individual criterion for ranking sites. Their resulting ranks were thus heavily influenced by the choice of variables deemed to be most important. Little-studied sites such as Ambohidray, Ampanangandehibe-Behasina and Ambondrobe were highly prioritized, even though they did not have particularly high rates of forest loss. This method emphasized areas where field inventory and subsequent taxonomic research efforts should be focused in the near future, regardless of forest loss, PA size or level of biodiversity.
On the other hand, the MC and PageRank aggregators attempted to ‘find consensus’ among the different variables and assigned similar weights to each of them. Sites with relatively high forest loss (e.g., Pointe à Larrée, Bongolava) and accelerated forest cover loss (e.g., Mangabe-Ranomena-Sahasarotra) were generally assigned high priority, emphasizing areas where efforts to halt deforestation should be focused while still considering other factors such as PA size and level of biodiversity. The MC and PageRank aggregators offered the advantage of not being primarily driven by one single variable. However, by treating all sets of ranks as equally important, they may run counter to specific conservation or research priorities. MC and PageRank aggregators can be useful when there is no clear rationale for ordering a preferred set of variables for ranking sites or to limit the influence of single variables that may be affected by data biases. The unweighted and PCA aggregators can be used when stakeholders have clear ideas (and reliable data) about the set of variables to prioritize. We suggest using these different aggregators in combination in order to assess the different outcomes resulting from different variable aggregation methods.
The unweighted approach for combining information from the eight taxonomic groups for a single variable seemed to offer the advantage of not making relatively arbitrary distinctions between sites, such as in the PCA approach. There were major differences between the two approaches for forest loss and acceleration in forest cover loss/gain, with PCA values once again yielding apparently arbitrary distinctions between sites. For those reasons, the unweighted approach seemed the most appropriate when generating individual rankings of SoK, forest loss and acceleration in forest cover loss/gain. Although there were also noticeable differences between the PCA and the unweighted values for both the absolute and relative (residuals) species diversity variables, there was no obvious indication of which was the most appropriate for generating individual rankings. Since there was virtually no difference between them when calculating overall priority rankings, it was more consistent to use the unweighted individual ranks of the species diversity variables.
The use of expert knowledge made a significant difference when estimating levels of biodiversity within PAs. Sites assigned the highest priorities in terms of relative species diversity were generally assigned mid-rank positions in absolute species diversity (e.g., Lac Alaotra, Mandena and Petriky). Littoral forests and dry spiny thickets were the dominant forms of vegetation among the top ten ranked sites in terms of relative species diversity, and they were generally well studied. On the other hand, PAs dominated by evergreen moist forests and dry deciduous forests comprised most of the top ten ranked sites in terms of absolute species diversity, and they were relatively little studied. It would thus appear that the latter two forest types can potentially support a relatively high number of species compared to other forest types, but more data would be needed before using forest types as a proxy for species diversity, considering the differing levels of SoK between them. As highlighted here and elsewhere (Orsi et al. Reference Orsi, Geneletti and Newton2011, Hochkirch et al. Reference Hochkirch, Schmitt, Beninde, Hiery, Kinitz and Kirschey2013), expert-based knowledge of local biodiversity can provide a scoring method for prioritizing conservation units within a network that can facilitate the protection of species-rich sites. It can also provide crucial information when spatial data for conservation planning are limited (Keppel Reference Keppel2014) and be a cost-effective way of generating site-based indicators to be used by decision-makers (Oliver Reference Oliver2002). Expert assessments of biodiversity can be particularly useful in countries where data on the socioeconomic costs of conservation are limited (Klein et al. Reference Klein, Jupiter, Watts and Possingham2014), and they should play a key role in understanding the spatial distribution of high-priority PAs in developing countries (Keppel Reference Keppel2014). Moreover, regularly updating site-level SoK could aid in evaluating how well PAs achieve conservation objectives regarding particular species and habitats.
The estimation of two distinct measures of deforestation (forest cover loss and acceleration in forest cover loss) also proved useful. It helped to identify sites that have lost a high proportion of their forest cover and to highlight instances where deforestation has worsened in recent years (Vieilledent et al. Reference Vieilledent, Grinand, Rakotomalala, Ranaivosoa, Rakotoarijaona, Allnutt and Achard2018). For these reasons, prioritization schemes should apply measures of pressure and/or threat to habitat conservation alongside measures of biodiversity and knowledge-based variables (Campagnaro et al. Reference Campagnaro, Trentanovi and Sitzia2018). If priority ranks were solely based on expert knowledge or species diversity, the final result could erroneously identify areas of top priority that were not under particular risk of degradation.
Individual ranks of carefully selected priority variables can be used in parallel and help decision-makers address multiple conservation goals of existing PA networks. For instance, if prioritizing PAs in order to fulfil the original objectives of Madagascar’s PA network of promoting biodiversity conservation and scientific research, stakeholders could rank PAs by relative species diversity and SoK in order to identify sites of highest biodiversity value and in need of more research. In addition, given the current approach on Madagascar of promoting multiple-use PAs for the sustainable extraction of natural resources, variables such as forest loss and acceleration in forest cover loss/gain could be useful in identifying areas where natural resource exploitation has surpassed sustainable levels. Given that some of these sites may now be particularly vulnerable due to recent rapid degradation, our individual ranks could be useful tools for helping decision-makers on Madagascar to identify sites that could be aligned to national initiatives in order to effectively manage natural resource extraction (Gardner et al. Reference Gardner, Nicoll, Mbohoahy, Oleson, Ratsifandrihamanana and Ratsirarson2013). For instance, of the ten sites identified by Gardner (Reference Gardner2011) as inappropriate for anthropogenic use due to negative effects on biodiversity, our individual ranking of acceleration in forest cover loss/gain listed six of them in the top 30 priority sites for conservation (Bombetoka Beloboka, Anjozorobe-Angavo, Menabe Antimena, Ranobe PK32, Amoron’i Onilahy and Ankodida).
Other efforts to define priorities for conservation resources on Madagascar and the surrounding region tended to focus on individual taxonomic groups (Herrera Reference Herrera2017) or vulnerable habitats (Watson et al. Reference Watson, Whittaker and Dawson2005). However, producing multi-taxonomic and multivariate prioritization ranks of entire PA networks may prove beneficial for developing wide-ranging conservation schemes, since PAs normally comprise an array of endangered endemic species (including micro-endemics) and habitats. Other prioritization methods used on Madagascar (Kremen et al. Reference Kremen, Cameron, Moilanen, Phillips, Thomas and Beentje2008) showed that single-taxon analysis may indeed fail to capture cross-taxon priorities that might be independent of forest cover and have variable spatial patterns and associated conservation values (Gardner et al. Reference Gardner, Raxworthy, Metcalfe, Raselimanana, Smith and Davies2015). Therefore, the use of multiple taxonomic groups and variables related to habitat degradation is required in order to produce robust prioritization of investment for conservation across existing PAs in the study region and beyond.
Conclusion
We have shown that prioritizing existing PAs using individual and aggregate ranks can provide flexibility in the selection of variables designed to address continued biodiversity and habitat loss by using standard data analysis techniques that are relatively simple to implement. The use of expert knowledge by active researchers made a significant contribution to our understanding of species diversity across PAs on Madagascar and highlighted areas most in need of additional research effort to assess local biodiversity patterns. Immediate attention is warranted to the most highly ranked PAs in our priority ranks, particularly those that are highly ranked across different priority variables. Moreover, the use of expert knowledge generated by on-site researchers can be an effective way to bridge the gap between PA managers and the scientific community (Gardner et al. Reference Gardner, Nicoll, Mbohoahy, Oleson, Ratsifandrihamanana and Ratsirarson2013) in order to help identify knowledge gaps and integrate the scientific process into PA management decision-making.
Our study was designed to provide a flexible prioritization scheme for decision-makers on Madagascar and elsewhere, but it was not intended to produce a definitive priority rank of PAs within the country, nor to realign the conservation goals of Madagascar’s PAs. Our methods contribute to conservation triage efforts in biodiversity hotspots around the world and can be developed to stakeholders’ preferences by weighting variables based on their priorities or by incorporating other variables that are locally pertinent to conservation goals. For instance, variables that reflect important ecosystem services for local communities (Verhagen et al. Reference Verhagen, Kukkala, Moilanen, van Teeffelen and Verburg2017) and key socioeconomic factors (Di Minin et al. Reference Di Minin, Soutullo, Bartesaghi, Rios, Szephegyi and Moilanen2017) could be used in conjunction with similar variables presented here in order to further develop our rankings. Their advantage is that they do not require considerable computational power or high-resolution spatial analyses, which are often inaccessible to developing countries, and they can be adapted to the quantity and quality of data available. The Supplementary Material made available online (Appendix S1) contains a summary flowchart of the methodology and can be used as a step-by-step tutorial for guiding those who are interested in applying these methods.
Supplementary material
To view supplementary material for this article, please visit https://doi.org/10.1017/S0376892920000090
Acknowledgements
We would like to thank the many Malagasy researchers and students who helped to collect the data on the various field inventories that contributed to this analysis.
Author contributions
SMG, MJR, APR and VS collected data and formulated the ideas for these analyses. ADG and KAB conceived the methods. ADG performed data analyses and produced the ranks. GUY performed the spatial analysis and produced the maps. FC led the writing of the manuscript. All authors contributed substantially through additions and revisions to the text and gave final approval for publication.
Financial support
This project was partially funded by the Critical Ecosystem Partnership Fund. The Critical Ecosystem Partnership Fund is a joint initiative of l’Agence Française de Développement, Conservation International, the European Union, the Global Environment Facility, the Government of Japan and the World Bank. A fundamental goal is to ensure civil society is engaged in biodiversity conservation.
Conflict of interest
None.
Ethical standards
None.


 Open access