


1 Setting the Stage
1.1 Background
Long-term economic development depends critically on productivity growth. A key mechanism behind this growth is the movement of workers from less productive to more productive activities. Historically, the manufacturing sector has played a central role in this process of structural transformation. Manufacturing offered abundant opportunities for capital deepening, economies of scale, and technological advancement. Many studies show that countries that successfully narrowed the income gap with richer nations did so through sustained industrialization. Typically, these successful economies began by exporting labor-intensive goods from light industries, such as textiles, and over time shifted toward exporting capital- and skill-intensive goods from heavy industries, such as machinery. In contrast, countries that failed to industrialize (or whose industrialization stalled) have struggled to achieve lasting income growth.Footnote 1 These patterns have fueled persistent policy debates about the weak pace of industrialization in many low- and middle-income countries, and have led to a renewed focus on industrial policy, trade integration, and the expansion of manufacturing as potential engines of economic growth.
However, it is increasingly recognized that industrialization and manufacturing exports are no longer the exclusive pathways to development. Gollin and Kaboski (Reference Gollin and Kaboski2023) argue that not all recent episodes of economic growth have been driven by industrialization, and that manufacturing booms do not automatically lead to sustained progress. Similarly, Newfarmer, Page, and Tarp (Reference Newfarmer, Page and Tarp2018) highlight the potential of “industries without smokestacks” – sectors like agro-processing, horticulture, tourism, and business services – that can create productive jobs, particularly in sub-Saharan Africa. Meanwhile, advances in digital technology have made many services more tradable across borders, creating new opportunities for export-led growth (Baldwin and Forslid, Reference Baldwin and Forslid2019). Gollin (Reference Gollin2018) further argues that modern service sectors increasingly exhibit characteristics once thought to be unique to manufacturing, including knowledge spillovers, economies of scale, and agglomeration effects. Baccini et al. (Reference Baccini, Fiorini, Hoekman and Sanfilippo2023) add that services play a growing and substantial role in employment, skills development, and broader economic progress in Africa. As Gollin (Reference Gollin2018) concludes, “Although manufacturing exports have been an important source of growth for the ‘miracle’ economies of the late 20th and early 21st centuries, there is little reason to believe that this is an exclusive pathway to growth and poverty reduction.”Footnote 2
At the same time, the traditional link between export success and structural transformation has weakened. Global trade opportunities have radically changed. Improved information and communication technologies allow lower-income countries to participate in global markets by specializing in discrete stages or “tasks” of production. Industrialization through exporting now appears easier than before, often requiring fewer domestic capabilities from firms and relying more on macroeconomic stability and access to international markets (Baldwin, Reference Baldwin2016; World Development Report, 2020).
Yet while entering export markets may have become easier, the developmental payoff of exports has diminished. Increasingly, exports rely heavily on imported intermediates, reducing the share of domestic value added. Lall (Reference Lall2000) noted this trend early on, pointing out that while “high-technology” products like semiconductors appear identical in trade statistics, the underlying domestic activities differ dramatically: sophisticated processes in the United States contrast with basic assembly work in Malaysia. Traditional trade data does not capture these differences because they record only the final product, not the complexity or value added at each stage of production. Since products do not map cleanly onto specific tasks, understanding the trade-structure-growth relationship now calls for a focus on tasks.
Investigating this task-based view of structural transformation and trade is the central goal of this Element.
1.2 Scope and Aims of This Element
The central premise of this Element is that structural change is best understood through the lens of tasks. This idea echoes the classical model of Lewis (Reference Lewis1954), which describes structural transformation as the movement of labor from traditional to more productive modern activities. Importantly, Lewis emphasized that modern, productive activities could be found outside of manufacturing, and also noted that significant pockets of low-productivity, often informal, work persisted even within the manufacturing sector itself (Lewis, Reference Lewis1979; Diao and McMillan, Reference Diao and McMillan2018). These insights suggest the need for a deeper understanding of the types of activities countries perform, and how specialization in different tasks evolves as economies develop.
We demonstrate the usefulness of a task-based perspective by presenting new empirical evidence on trade and development. To do this, we introduce new data and analysis that reveal the heterogeneity of tasks within exports across industries and countries. We show how trade in tasks can be measured using recently developed data from internationally harmonized statistics, which we have built over the past decade. Throughout this Element, we employ a consistent methodology and dataset to ensure the comparability and coherence of the empirical findings across sections. Where appropriate, we draw on our own previously published research, updating results and discussions to reflect new evidence and developments.
A task-oriented approach to trade and structural change is essential for improving our understanding of economic development and the role of policy. The distinction between an industry or product perspective and a task perspective becomes particularly salient in discussions about industrial policy. Industrial policy seeks to avoid the risk of economies becoming trapped in suboptimal equilibria, often due to externalities and production spillovers. This concern is central to the product space framework (Hausmann et al., Reference Hausmann, Hidalgo, Bustos, Coscia and Simoes2014), which has gained popularity in evaluating a country‘s growth potential and in shaping trade and industrial policies for lower-income countries (Hidalgo et al., Reference Hidalgo, Klinger, Barabási and Hausmann2007; Hausmann and Klinger, Reference Hausmann and Klinger2007; Hausmann et al., Reference Hausmann, Hidalgo, Bustos, Coscia and Simoes2014; Coniglio et al., Reference Coniglio, Vurchio, Cantore and Clara2021).
According to the product space paradigm, policymakers should pursue a gradualist strategy by promoting the introduction of new products that are “close” to the country’s existing capabilities, thus minimizing the risk of failure. Introducing radically new products would require capabilities that are scarce and difficult to build. However, industrial policies can also play a role in overcoming information spillovers associated with discovering new profitable activities, as Hausmann and Rodrik (2003) argue. Because the cost structures of new products are unknown, countries’ latent comparative advantages remain hidden and must be uncovered through costly experimentation – experimentation whose social benefits exceed private returns. In such contexts, policies that promote discovery and diversification can boost productivity and growth (Harrison and Rodríguez-Clare, Reference Harrison, Rodríguez-Clare, Rodrik and Rosenzweig2010).
Historically, mainstream economists viewed industrial policy with skepticism, largely because it was associated with inward-looking, protectionist trade strategies. However, recent research calls for a more nuanced and context-specific understanding of industrial policy’s practice and effects (Juhász, Lane, and Rodrik, 2023). Similarly, Sen (Reference Sen2023) argues for a rethinking of traditional views on structural transformation and calls for greater creativity in developing countries’ policy choices today.
In this Element, we argue that adopting a task perspective enhances our understanding of how trade, structural change, and economic growth are linked, and clarifies the role of policy in these processes.
Our main aim is to demonstrate the versatility of the task perspective in offering new insights into long-standing debates. Structural transformation and growth are broad subjects, touching multiple fields, including growth and development economics, international trade, labor economics, economic geography, and international business. Our task-based approach connects these fields and highlights their interrelationships. Nevertheless, given the rapid pace at which research in these areas is evolving, we cannot cover all relevant debates comprehensively. Throughout this Element, we aim to offer a focused and coherent discussion, while directing readers to related literatures for further exploration.
1.3 Structure of the Element
The remainder of this Element is organized into six sections.
Section 2 introduces our task perspective on trade and development. We define the concept of a task, provide an illustrative example, and explain how a task-based view relates to traditional product-based perspectives on trade and structural change. Task exports are estimated by measuring the value-added contribution of workers, cross-classified by occupational class and industry of employment. A detailed mathematical exposition of the measurement methodology, along with a description of the new task dataset we developed, is provided in the Appendix.
Sections 3 and 4 present the basic descriptive evidence.
Section 3 characterizes long-term shifts in the international division of tasks within the global production network for manufactured goods. It offers a stylized overview of how countries’ contributions have evolved over recent decades, distinguishing between low-skilled production tasks and high-skilled knowledge tasks. Put simply, it addresses the question of “who has been doing what” in the so-called “global factory.”
Section 4 zooms in on how the structure of exported tasks changes with economic development. Using detailed data that identifies 455 distinct tasks for each economy-year, cross-classified by occupation and industry, we describe how task specialization evolves both across industries (e.g., from textiles to electronics) and within industries (e.g., from craft workers to engineers). This approach provides a richer and more nuanced picture than traditional analyses focused solely on sectoral shifts.
The next two sections provide more formal empirical analysis.
Section 5 examines the path dependence of task specialization. We introduce a task specialization index that measures a country’s comparative advantage in specific tasks, and analyze how task specialization patterns evolve over time within countries. Using a probit model, we test for the degree of path dependence in countries’ specialization trajectories.
Section 6 explores the relationship between economic growth and the introduction of radically new tasks. We measure the appearance of new task specializations in countries’ export structures and incorporate this concept into growth regressions to assess whether diversifying into new types of tasks is associated with better economic performance.
Finally, Section 7 summarizes the main findings of this Element and discusses future research directions. We reflect on how the task perspective sheds new light on long-standing debates in development economics and trade policy.
2 A Task Perspective on International Trade, Structural Change, and Economic Development
A country’s specialization evolves over time, resulting in new products being added to the country’s export basket. Lack of export development is a long-standing concern as it appears to be linked with slower structural change and productivity growth. We argue that analyzing what a country does in trade (i.e., the tasks it performs) provides additional insights vis-à-vis analyzing the products that a country trades. This section presents key concepts of our task perspective and will be useful for proper interpretation of our findings in the remainder of the Element.
2.1 Development of Data on Trade in Value Added
The study of international trade specialization traditionally relies on analyzing countries’ gross export flows. A country’s specialization in a product is determined by comparing its share in the country’s overall exports to its share in global exports, known as the Revealed Comparative Advantage (RCA) index. RCA values above 1 reveal that the country is better at producing a product compared to other countries (Balassa, Reference Balassa1965). RCA indices are used to test various trade theories, in particular those relying on differences in factor endowments in the tradition of Heckscher-Ohlin.Footnote 3 To that end, products are often categorized based on their industries’ factor input intensities, for example, whether the production process of the product makes intensive use of natural resources, (un)skilled labor, or capital. Endowment differences used to help explain product specialization patterns between regions, particularly between rich and poor countries as the latter specialize in less skill and capital-intense products (Leamer, Reference Leamer1984; Hanson, Reference Hanson2012). Schott (Reference Schott2004) further refined this understanding by analyzing US import data, revealing specialization at an even more granular level. His work suggests that developed countries tend to specialize in higher-quality goods within narrow product categories, while developing countries focus on lower-quality alternatives.
Clearly, the rise of global production networks and the integration of emerging economies like China and India into the world economy pose a challenge to traditional trade analysis based on products. Lall (Reference Lall2000) pioneered the recognition that the international division of labor complicates the interpretation of trade statistics based solely on product descriptions. He laments that product export data “ … does not indicate the process involved in making the same product in different locations. Thus, a high technology product like semiconductors can involve genuinely high-tech processes in the United States and relatively simple assembly in Malaysia. In our data, both would appear equally technologically advanced. … we cannot deal with this in any consistent manner” (Lall, Reference Lall2000, p. 340).
Subsequent research has shown that this problem became more profound in the 2000s with further international slicing of production. Yet trade researchers also responded to Lall’s challenge on the ability of trade statistics to capture the new situation. His pessimism appeared to be overstated. Hummels et al. (Reference Hummels, Ishii and Yi2001) introduced the concept of “vertical specialization in trade,” which measures the extent of international production fragmentation by calculating the share of domestic value added (DVA) in gross exports. Domestic value can be added in production by the exporting industry as well as other so-called upstream domestic industries that provide inputs. The DVA concept builds on Leontief’s (Reference Leontief1953) work using information on input-output linkages between local industries. Essentially, DVA captures how much of a country’s export value is actually produced domestically versus how much value is imported and subsequently re-exported.
Johnson (Reference Johnson2014) highlighted the growing gap between a country’s gross exports and value-added contributions across different sectors. He emphasized the importance of considering upstream production stages, as these stages often involve substantial value addition that is not captured when looking solely at the industry that is exporting. Koopman, Wang, and Wei (Reference Koopman, Wang and Wei2012) provide a concrete example of this phenomenon by examining Chinese exports of complex goods, such as electronic devices. They find that these exports had a relatively low domestic value-added content because China relied heavily on imported components for their production in the early 2000s. This reliance on imported inputs meant that a substantial part of the value of these exports was actually created outside of China at the time. Koopman, Wang and Wei (2014) showed how domestic value added measures impacted traditional measures of revealed comparative advantage.
Johnson and Noguera (Reference Johnson and Noguera2012, Reference Johnson and Noguera2017) expanded on this idea by documenting the rise of vertical specialization across thirty-six out of thirty-seven countries they studied. Countries were increasingly participating in global value chains, where production processes are spread across multiple countries. They found that the global ratio of value added to gross exports declined by 10 percentage points from 1970 to 2008, with a notable acceleration in this trend after 1990. This phenomenon was dubbed the emergence of trade in value added. Further research in trade in value added has created a broader set of global value chain (GVC) measures, facilitated by multicountry input-output data initiatives that are grounded in national accounts,Footnote 4 like the World Input-Output Database (ggdc.net), the OECD-WTO Trade in Value Added (TiVA) project (oe.cd/tiva), and the ADB MRIOTs (kidb.adb.org/mrio), as reviewed in Johnson (Reference Johnson2018).
2.2 The Need for Data on Trade in Tasks
The new research findings on trade in value added implied that countries may specialize in different stages of production, with different factor intensities, even when they appear to be exporting similar products. A small value-added contribution in exports could signify either low-tech assembly or high-tech manufacturing of complex components. For instance, a developing country might engage in the assembly of electronic products, importing components like circuit boards, casings, and wiring, and focusing on assembling these parts into final products. In contrast, a high-income country might be involved in the production of semiconductors, which requires advanced skills and precision engineering, importing all other components. Although the share of domestic value added in exports might be small in both cases, the nature of the tasks performed is vastly different. Moreover, a country can specialize in tasks without altering its domestic value-added ratio. For example, consider the United States, which initially produced entire cars domestically. If the United States shifts its focus to exporting only car parts to Mexico, where these parts are assembled into complete vehicles and then re-exported, the domestic value-added share in US exports remains at 100%. This is because the value added by the United States in producing the car parts is fully captured in the export value, even though the final assembly occurs elsewhere. This scenario illustrates how a country can specialize in upstream production stages – such as manufacturing components – without changing the proportion of domestic value added in its exports. These examples show that trade in value added potentially severs the link between domestic factor endowments and the type of products exported, the hallmark of old-style empirical trade research (Baldwin and Robert-Nicoud, Reference Baldwin and Robert-Nicoud2014).
To gain a better understanding of a country’s position in global production networks and its development potential, information on the types of tasks carried out in exporting is needed. Therefore we developed new measures and data that gave empirical content to the task perspective on trade. To this end we had to bring in new information on the type of activities performed in the economy. Traditional distinctions along the industry dimension (e.g., agriculture, textile manufacturing, electronics manufacturing) no longer served the purpose as tasks tend to vary both across and within industries.Footnote 5 A prominent example is the trend known as the “servicification of manufacturing.” Administrative data typically classifies establishments by their primary activity, which contributes most to value added. However, establishments often perform multiple activities, both material and service-like. For instance, some manufacturing firms in rich countries were shifting toward service exports, such as machinery installation and maintenance, as noted by Kelle (Reference Kelle2013). These firms not only produce goods but also offer complementary services that enhance the value of their products and meet the evolving needs of their customers. This shift allows manufacturing firms to diversify their revenue streams and leverage their expertise in new ways. This trend highlights the increasing integration of services into traditional manufacturing processes and the blurring of industry classifications.
Additionally, the rise of so-called factory-less goods producers represents another important development. These firms, as described by Bernard and Fort (Reference Bernard and Fort2015), design products and manage production networks without engaging in the actual fabrication process. Instead, they outsource the manufacturing to third-party producers, often located in different countries. This allows factory-less goods producers to focus on tasks with high returns to factor inputs such as research and development, design, and supply chain management, while leveraging the manufacturing capabilities of specialized partners.
These examples illustrate the dynamic nature of modern industrial activities, where the boundaries between manufacturing and services are increasingly blurred. The servicification of manufacturing and the emergence of factory-less goods producers underscore the importance of understanding the diverse range of tasks that establishments perform, beyond their primary industry classification. A task perspective on trade needs information on the type of activities that takes place in the domestic economy in the production for exports. In this Element we show how various administrative statistical sources can be combined in order to measure trade in tasks, building upon the methodological approach of trade in value added.
2.3 Definition and Measurement of Trade in Tasks
How to measure the task content of trade? A useful starting point is to examine the occupations of the workers involved in exporting. Why? Because an individual’s occupation provides insight into the specific activities they perform, such as assembly, engineering, or sales, and, by extension, the nature of the country’s contribution to global value chains. As argued earlier, activities will vary across and also within industries. Therefore, in this Element we use data on workers that is cross-classified by occupational class as well as industry of work and call this industry-occupation pair a “task.” This in line with the terminology in the international trade literature (see, e.g., Grossman and Rossi-Hansberg, Reference Grossman and Rossi-Hansberg2008; Baldwin and Robert-Nicoud, Reference Baldwin and Robert-Nicoud2014). Information on tasks provide a natural way to bridge a country’s endowments in terms of skills and capital with the factor content of its export basket.
This subsection outlines the measurement of trade in tasks and provides an illustrative example. Box 1 provides a summary of the key terms used.
Product. A unique final good or service that is produced through a series of tasks. Tasks may be carried out in different countries due to international production fragmentation.
Industry. A person’s regular industry of work, classified using the International Standard Industrial Classification (ISIC).
Occupation. A person’s regular profession, classified using the International Standard Classification of Occupations (ISCO).
Task. The expression “task” is used to indicate the activity of a worker as identified by the industry of a person’s regular work (ISIC) cross-classified by the person’s profession (ISCO).
Trade specialization in tasks. A country is said to specialize in a particular task when the task income share in its overall income from exporting is higher than the corresponding share for other countries (Timmer et al. Reference Timmer, Miroudot and de Vries2019). This is a variant of the Revealed Comparative Advantage (RCA) index of Balassa (Reference Balassa1965).
To give empirical content to the trade in task concept, we built upon the earlier work on trade in value added. Hummels et al. (Reference Hummels, Ishii and Yi2001) introduced a novel metric for measuring “vertical specialization in trade.”Footnote 6 This metric is defined as the share of domestic value added in gross exports. A share of one indicates that all tasks required to produce exports are conducted within the exporting country. To accurately track this share, it is necessary to supplement product export statistics with information on value added. This value added encompasses contributions from both the exporting industry and other domestic industries involved in upstream stages of production. To achieve this, Hummels et al. (Reference Hummels, Ishii and Yi2001) utilize a methodology originally developed by Leontief (Reference Leontief1953).Footnote 7 Building on this framework, we follow Timmer et al. (Reference Timmer, Miroudot and de Vries2019) and Kruse et al. (Reference Kruse, Timmer, de Vries and Ye2024) by further distinguishing the value added by different types of workers, cross-classified by occupation and industry, enabling the analysis of trade in tasks. Basically, we break down domestic value added into domestic value added of various tasks; see Figure 1.
Decomposition of gross output value of exports into value added contributions
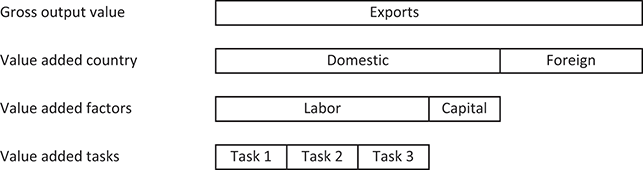
The measurement involves two major steps. In the first step, we track domestic value added in exports, encompassing contributions not only from the exporting industry but also from other domestic sectors indirectly involved through intermediate inputs. To accurately account for these indirect contributions, input-output tables are essential as these track intermediate input flows across industries. In the second step, we further develop this approach by identifying the types of workers, characterized by occupation and industry of work, involved in the production process. Thus we break down domestic value added in exports into value added in various tasks, using information on the income of workers involved. Appendix A provides the mathematical formulation of input-output analysis used to measure trade in tasks.
In total 455 tasks are identified for each country in each year, cross classifying workers not only by their occupational class but also by their industry of work (455 = 13 occupational classes x 35 industries; see Appendix B for a description of the data). Bringing in this granularity is important as the addition of an industry dimension enhances the ability of occupational statistics to capture different types of activities. Compare for example the activities performed by machine operators in textiles and in electronics. Detailed O*NET data indicates that “making decisions and solving problems” is a very important activity for machine operators in electronics, while it is much less important for machine operators in textiles manufacturing.Footnote 8
Table 1 provides an illustrative example from Kruse et al. (Reference Kruse, Timmer, de Vries and Ye2024) to aid intuition on the type of data that is used in this Element. The table shows the contribution of various domestic tasks in exports of textile for four countries at different levels of development. Note that tasks can be carried out by different occupational classes of workers in the textile industry, such as machine operators, managers or other professionals. In addition, tasks can also be carried out by workers in other industries producing material or service inputs for the textile industry, such as workers in agriculture or in wholesale and retail trade. The use of input-output linkage information ensures that these indirect contributions are taken into account as well. Referring to Figure 1, tasks can also be imported, which represents foreign value added in exports. Hence, the task contributions in Table 1 are expressed as shares of total domestic value added in a country’s exports.
| Pakistan | Share | Türkiye | Share | Vietnam | Share | Italy | Share |
|---|---|---|---|---|---|---|---|
| 1. Agricultural workers | 45.0% | 1. Machine operators in textile | 67.8% | 1. Machine operators in textile | 56.4% | 1. Machine operators in textile | 29.9% |
| 2. Machine operators in textile | 20.3% | 2. Managers in textile | 10.0% | 2. Sales workers in wholesale | 7.2% | 2. Other professionals in textile | 7.2% |
| 3. Sales workers in retail | 8.0% | 3. Agricultural workers | 5.9% | 3. Other professionals in wholesale | 2.9% | 3. Managers in textile | 6.7% |
| All other activities | 26.6% | All other activities | 16.3% | All other activities | 33.5% | All other activities | 56.2% |
| Sum | 100% | Sum | 100% | Sum | 100% | Sum | 100% |
Notes: Entries show for each country the contribution of the top-3 tasks in the exports of textiles in 2018 (in percentages of total export value). Tasks are classified by industry of work and occupational class of workers. The penultimate line reports the contribution of the other tasks outside the top-3. Contributions to the textiles exports are based on the labor income of domestic workers involved in each task. Numbers may not sum due to rounding.
Task specialization differs widely across the four selected countries. Tasks by machine operators in the textile industry make up more than two-thirds of domestic value-added exports in Türkiye. In Vietnam machine operators in textiles also contribute the most, but there is also a sizeable contribution from sales workers and other professionals in the wholesale trade industry. Textile workers accounts for less than one third in Italy. The value of Italian textile exports is mostly generated outside the textile industry by workers in services sectors such as distribution and marketing. Yet, different again, in Pakistan agricultural workers account for the largest share in textile exports as local cotton is a major input. Clearly, the task content of textile exports vary widely across countries and there is no unique mapping of exported products into exported tasks.Footnote 9
This is suggesting potential for new insights on trade, structural change and development when using a task perspective. The task trade statistics inform directly on the use of a country’s factor inputs and their returns. And more generally, they point at the potential for knowledge spillovers and the likelihood of productivity growth in trade activities. As such, our research is part of an emerging literature that examines macro issues of structural change and growth while taking account of heterogeneity of individuals, households, firms and locations within economies (Gollin and Kaboski, Reference Gollin and Kaboski2023). The next sections provide descriptive evidence and formal analysis of trade in tasks. The final section in this Element will discuss how a task perspective on trade and structural change may initiate several interesting lines of research, and inform current development debates.
2.4 Further Clarifications
A proper understanding of task trade measures is instrumental for prudent use and interpretation in research. This subsection provides a number of general remarks concerning the definition and measurement of trade in tasks. Other more technical remarks have been relegated to Appendix C.
First, our use of the term tasks is closely related to terms like “business functions,” a term used often, for example, in international business and economic geography literature to denote activities in global value chains, such as R&D, sales, or logistics activities; see for example Duranton and Puga (Reference Duranton and Puga2005), Defever (Reference Defever2012), Timmer et al. (Reference Timmer, Miroudot and de Vries2019), and Cirera et al. (Reference Cirera, Comin and Cruz2023). Multinational firms typically organize their activities around these functions due to internal economies of scale (Porter, Reference Porter1985); hence, it constitutes a relevant level of both firm- and country- analysis as we argue in Section 3. Leading economic models of production, such as Acemoglu and Autor (Reference Acemoglu, Autor, Ashenfelter and Card2011), tend to favor the term task to describe units of work within firms and we follow this practice.
Second, the trade in task approach offers opportunities to further characterize and assess the demand for particular workers given ongoing developments in automation and digitalization (Acemoglu and Restrepo, Reference Acemoglu and Restrepo2019). A common and useful approach is to classify the duties of workers according to the level of routineness. Routine tasks are typically repetitive, predictable, and codifiable, making them particularly vulnerable to automation and offshoring. In contrast, nonroutine tasks involve problem-solving, creativity, and adaptability, often requiring interpersonal interaction and autonomous decision-making. Accordingly, this strand of research emphasizes the degree of routineness in work of laborers in a particular occupational class (Autor et al. Reference Autor, Murnane and Levy2003). Labor demand models typically simplify this relationship by assuming a one-to-one mapping between occupations and tasks, whereby each task corresponds to a single occupation, and each occupation performs only that task (see, e.g., Goos et al. Reference Goos, Manning and Salomons2014). Under this assumption, occupations are treated as either entirely routine or entirely nonroutine. The task-based definition used in this Element, constructed at the occupation cross industry level, provides the opportunity to follow this logic in further research. In Section 5 we explore this idea.Footnote 10
Third, task trade measures are constructed on the basis of existing official administrative sources which were not specifically designed for that goal.Footnote 11 Value added includes compensation for workers and a gross operating surplus that accrues as income to the owners of capital assets, both tangible and intangible assets (see Timmer et al., Reference Timmer, Erumban, Los, Stehrer and de Vries2014; and section 3). Yet, capital assets cannot be straightforwardly allocated to functions, in contrast to workers. For example, a computer can be utilized in many tasks, and we have no information on its particular use. Therefore the task trade measures in this Element are based only on income data for labor. Another caveat is in the territorial interpretation of the task-trade measures. We track the value added by factor inputs in a specific geographical area, which does not necessarily coincide with the income earned by workers and entrepreneurs in that particular area. The rise of global production networks has led to large cross-border investment flows and tracking the ultimate recipients of this income is notoriously difficult (Lipsey, Reference Lipsey2010; Guvenen et al., Reference Guvenen, Mataloni, Rassier and Ruhl2017).Footnote 12 The trade in tasks measures is much less susceptible to this issue than the trade in value added measures as the former are based solely on labor income. Labor income is more likely to accrue to domestic workers than capital income is to local capital owners.
Fourth, task trade measures do not substitute for, but complement the traditional product trade statistics that are much more detailed. For example the official Harmonized System Nomenclature for imports and exports comprises about 5,000 commodity groups which are identified by a six-digit code. Task and product trade statistics can be used in conjunction to deepen our understanding. Thus, part of the differences in the task composition of textile exports as shown in Table 1 might be related to the detailed makeup of the textile product export basket, for example in the shares of low-end versus high-end market products. This granularity is currently not well represented in the task measures. More generally, industry categories in input-output tables are often too broad to capture the specific product-level dynamics critical to global value chains (Antràs and Chor, Reference Antrás and Chor2022). Greater product granularity is essential for policy analysis, for example, to assess chain vulnerability where input markets are highly concentrated and substitution is limited (Ossa, Reference Ossa2015). For instance, while automakers may source paint from various suppliers, these suppliers might all depend on a single pigment producer, creating a supply chain vulnerability (Wheatley and Ramsay, Reference Wheatley and Ramsay2011). Addressing these issues requires a combination of more data sources, an issue we return to in Section 7.
3 The Global Factory: Trends in the International Division of Tasks
3.1 Phases in the International Fragmentation of Production
Since the 1960s, the world economy has been characterized by a (then) “new” international division of labor where firms in advanced countries off-shore manual production activities to low-wage regions, while retaining more skilled headquarter activities at home. A theoretical underpinning of this unbundling process can be based on differences in factor endowments as provided in classic work on multinational production (e.g., Markusen, Reference Markusen2002). Baldwin (Reference Baldwin2016) emphasizes the acceleration and changing nature of the unbundling process from the mid-1980s onward. Geographically separating various production stages became more attractive as the North–South productivity-adjusted wage gap grew, and separation became less costly with declining communication, transport, and coordination costs. The interaction of lower trade and communication costs and the opening up of labor-abundant economies such as India and China played a decisive role in accelerating this process and the emergence of the “global factory” (Buckley, Reference Buckley2018).
In Timmer et al. (Reference Timmer, Los, Stehrer and de Vries2021) we introduced a novel measure of cross-border supply chain fragmentation (SCF) to trace the speed and scale of the fragmentation process. The SCF ratio is based on a summation of all imports along a particular supply chain divided by the output value of the end-product. It takes account of imports by the country in which the product is finalized as well as imports by other countries in upstream stages of production. The SCF ratio is different from, and complements, other measures that capture different aspects of global value chain production and trade, as surveyed in Johnson (Reference Johnson2018). In particular it extends the measure of offshoring introduced by Feenstra and Hanson (Reference Feenstra and Hanson1999) and of vertical specialization introduced by Hummels, Ishii, and Yi (Reference Hummels, Ishii and Yi2001). Both these measures are insensitive to fragmentation in upstream stages of production that takes place outside the country that produces the end-product. Importantly, the SCF ratio is based on changes in volumes while other measures of fragmentation are based on changes in nominal values, confounding price, and volume effects. This is particularly important in periods when price differentials between raw materials and fabricated products arise, such as in the natural resource booms in the early 1970s and 2000s.
Figure 2 shows the aggregate SCF ratio for all goods and services in the world economy from 1965 onward. Various phases in the global fragmentation process can be distinguished. This process accelerated first in the 1960s. The SCF ratio appears to be more or less constant from the mid-1970s onward, before strongly accelerating again at the end of the 1980s. Yet, Pahl and Timmer (Reference Pahl and Timmer2019) show that the global trend hides substantial variation in the timing and strength not only across individual countries but also across industries. They showed that the first wave of vertical specialization in the world economy (1970–1980) involved almost all rich countries and various countries in East and South Asia as well as sub-Saharan Africa in their data set. In East Asia, Japanese industry started to unbundle, profiting from vast wage differences in the region (Fukao, Ishito, and Ito, Reference Fukao, Ishido and Ito2003). The second wave (1986–1993) was more widespread also involving countries in South and Central America. In North America the Maquiladora program boomed, integrating the US and Mexican border regions at a fast pace (Feenstra, Reference Feenstra1998). The third wave (1993–2008) revealed a concentration of the vertical specialization process as there was a sharp drop for countries in East and South Asia as well as in South and Central America. On the other hand, countries in Eastern Europe and Central Asia became more involved through large scale cross-border investments from the European Union. Importantly, increasingly value is added outside the region to which the country-of-completion belongs, suggesting a transition from regional production systems to a truly “Factory World” during this period (Los et al., Reference Los, Timmer and de Vries2015). On the other hand, countries in the Middle East and North Africa experienced relatively few periods of vertical specialization at any time. All industries (except oil refining) participated in the unbundling process albeit at different speeds. The trend was particularly strong for production of durable goods like machinery and transport equipment as well as for chemical products. Exports of textiles became gradually more import intensive from the 1960s onward, whereas exports of machinery (including electronics) were below-average intensive in imports in 1970, but rapidly becoming more import-intensive over time in the 1980s.
Phases in the international unbundling of production
Note: Supply Chain Fragmentation (SCF) ratio at constant prices as defined in Timmer et al. (Reference Timmer, Los, Stehrer and de Vries2021). Annually chained Laspeyres volume index with 1995 as base. The ratio sums the volume of imports by all countries that participate in a particular supply chain, aggregated across all chains of goods and services in the world economy. Higher value signifies higher degree of international fragmentation of production.
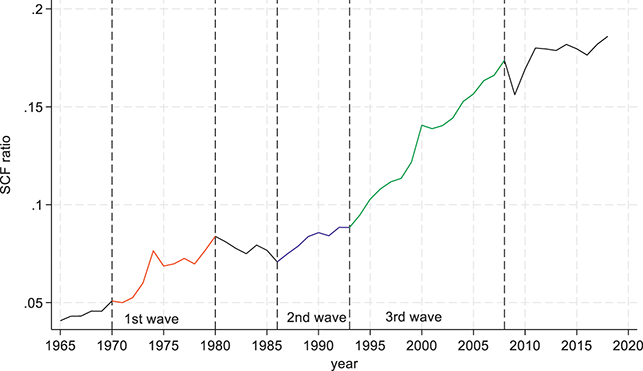
The unbundling trend was halted in 2009, coinciding with the great global trade slowdown in the aftermath of the global financial crisis in 2008 (see Figure 2). The drop in 2009 appeared to have been a short-run phenomenon. This is partly a reflection of sizeable inventory adjustments with unusually low purchases of intermediate inputs (Alessandria et al., Reference Alessandria, Kaboski and Midrigan2010; Bems et al., Reference Bems, Johnson and Yi2013). In 2010, the ratio was almost back at the 2008 level and leveled of afterward, resonating with a modest increase in import protection arising from temporary trade barriers as documented in Bown (Reference Bown2018). An important development is that the fragmentation process stalled for many goods production processes after 2010. This is strongly related to the increased ability of China, the major producer of these final goods, to substitute imports of sophisticated intermediates by domestically produced inputs. This substitution reflects the increasing ability of China to substitute its imports of intermediates by domestics production, with local firms spanning more and more stages of production (Kee and Tang Reference Kee and Tang2016; Chor et al., Reference Chor, Manova and Yu2021). Timmer et al. (Reference Timmer, Los, Stehrer and de Vries2021) find also that various final services “products” started to fragment in this period, albeit from a low level, such as construction services, logistics, and various professional services.
All in all, it can be concluded that the fragmentation process continued for three decades, but stalled in the Great Recession. The fallout of the financial and economic crises that engulfed the world in 2008 and 2009 hid the ending of the fragmentation process of goods production. With hindsight it can be concluded that the period from the end of the 1980s up to 2008 was a special period in global economic history.
Moving forward, digital infrastructure and automation technologies are likely to continue to reshape how firms structure what they do and where. Robotics and AI enable some tasks to be brought back in-house if machines outperform offshore labor, while cloud computing and digital platforms reduce coordination costs, allowing firms to outsource even complex business tasks. But these technological developments interact with other global trends, such as rising geopolitical tensions.
3.2 Specialization in the Global Factory
We delve deeper into the changing nature of the division of labor in the Global Factory since the mid-1990s. In particular, we are interested in what types of activities are carried out and in which countries. We aggregate the 455 tasks in this section to differentiate between knowledge-intensive (KI) and fabrication tasks. Fabrication tasks involve physical transformation processes, such as machine operation and assembly. KI tasks encompass a wide range of pre-fabrication (conceptualization, R&D, design, engineering) and post-fabrication tasks (marketing, branding, distribution). We measure Global Value Chain (GVC) income in these tasks by identifying the location and income of workers in the global factory of final manufacturing goods.Footnote 13 Note that workers in KI tasks are employed across manufacturing and services industries. The allocation of workers into KI and fabrication tasks is both exclusive (each worker belongs to one category) and exhaustive (all workers are categorized).Footnote 14 We focus on differences in specialization across countries and changes in GVC income, and also explore the importance of intangible income in the global factory.
For intuition, it is helpful to realize that this method is the macro-economic counterpart of the well-known micro case-study approach by Dedrick, Kraemer, and Linden (Reference Dedrick, Kraemer and Linden2010), who analyzed the income and job distribution in the production of the Apple iPod around 2006. The iPod’s production exemplified the unbundling of the production process, with components sourced globally and assembled in China. “Teardown” reports provided insights into the inputs and their market prices, allowing the authors to trace value captured by various participants like Broadcom, Toshiba, and Samsung. The iPod’s global production network involved over 41,000 jobs, with 98% of fabrication jobs in Asia and 65% of higher-paid engineering jobs in the United States. Consequently, nearly three-quarters of the labor income went to US workers, while Chinese workers earned less than 2.5% (Linden, Dedrick and Kraemer, Reference Linden, Dedrick and Kraemer2011). Similar studies were conducted for other electronics, such as mobile phones by Dedrick et al. (Reference Dedrick, Kraemer and Linden2010) and Ali-Yrkkö et al. (Reference Ali-Yrkkö, Rouvinen, Seppälä and Ylä-Anttila2011), with Kaplan and Kaplinsky (Reference Kaplan and Kaplinsky1999) contributing on the distribution of value in South African peaches. While product-level studies are insightful, they don’t capture the aggregate macro trends. This subsection offers therefore an overview of GVC income trends.
Table 2 highlights changes in real GVC incomes for major countries, ranked by growth. Overall earnings in the global factory increased rapidly driven by the rising global demand for manufacturing goods. This demand was fueled by the emergence of a new global middle-class boosting GVC incomes in emerging economies without significantly reducing incomes in advanced economies. China and India saw remarkable increases, quadrupling their incomes from 1995 to 2018. Brazil, Turkey, and smaller economies like the Czech Republic, Latvia, and Slovakia also more than doubled their incomes. Conversely, real GVC incomes hardly changed in major advanced economies such as Great Britain, Italy, the United States, and Japan. Germany and South Korea are interesting exceptions, as they saw increases of 80% and 92%, respectively.
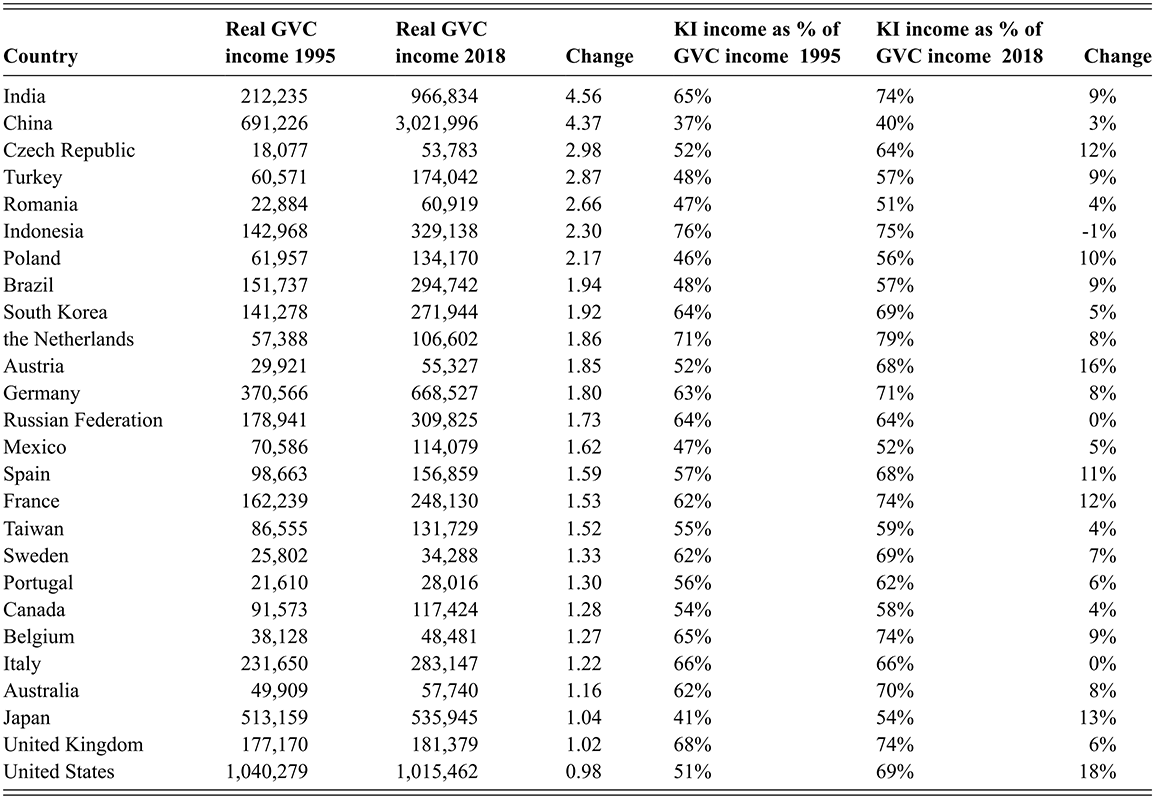
Table 2 Long description
The table has 6 columns: Country, Real GVC income 1995, Real GVC income 2018, Change, KI income as percentage of G V C income 1995, and K I income as percentage of GVC income 2018.
It reports the evolution of global value chain (G V C) income and the share of knowledge-intensive (K I) activities in total GVC income for 25 economies between 1995 and 2018. The Change in G V C income is measured as the 2018 value divided by the 1995 level, while the Change in K I specialization is measured as the difference in percentage points between 2018 and 1995. All income values are expressed in constant 2011 P P P U S dollars.
It reads as follows.
India: GVC income rose from 212,235 to 966,834 (a 4.56-fold increase); KI share rose from 65% to 74% (plus 9 percentage points).
China: from 691,226 to 3,021,996 (4.37×); KI share from 37% to 40% (plus 3).
Czech Republic: from 18,077 to 53,783 (2.98×); KI share from 52% to 64% (plus 12).
Turkey: from 60,571 to 174,042 (2.87×); KI share from 48% to 57% (plus 9).
Romania: from 22,884 to 60,919 (2.66×); KI share from 47% to 51% (plus 4).
Indonesia: from 142,968 to 329,138 (2.30×); KI share fell from 76% to 75% (minus 1).
Poland: from 61,957 to 134,170 (2.17×); KI share from 46% to 56% (plus 10).
Brazil: from 151,737 to 294,742 (1.94×); KI share from 48% to 57% (plus 9).
South Korea: from 141,278 to 271,944 (1.92×); KI share from 64% to 69% (plus 5).
The Netherlands: from 57,388 to 106,602 (1.86×); KI share from 71% to 79% (plus 8).
Austria: from 29,921 to 55,327 (1.85×); KI share from 52% to 68% (plus 16).
Germany: from 370,566 to 668,527 (1.80×); KI share from 63% to 71% (plus 8).
Russian Federation: from 178,941 to 309,825 (1.73×); KI share unchanged at 64%.
Mexico: from 70,586 to 114,079 (1.62×); KI share from 47% to 52% (plus 5).
Spain: from 98,663 to 156,859 (1.59×); KI share from 57% to 68% (plus 11).
France: from 162,239 to 248,130 (1.53×); KI share from 62% to 74% (plus 12).
Taiwan: from 86,555 to 131,729 (1.52×); KI share from 55% to 59% (plus 4).
Sweden: from 25,802 to 34,288 (1.33×); KI share from 62% to 69% (plus 7).
Portugal: from 21,610 to 28,016 (1.30×); KI share from 56% to 62% (plus 6).
Canada: from 91,573 to 117,424 (1.28×); KI share from 54% to 58% (plus 4).
Belgium: from 38,128 to 48,481 (1.27×); KI share from 65% to 74% (plus 9).
Italy: from 231,650 to 283,147 (1.22×); KI share steady at 66%.
Australia: from 49,909 to 57,740 (1.16×); KI share from 62% to 70% (plus 8).
Japan: from 513,159 to 535,945 (1.04×); KI share from 41% to 54% (plus 13).
United Kingdom: from 177,170 to 181,379 (1.02×); KI share from 68% to 74% (plus 6).
United States: from 1,040,279 to 1,015,462 (0.98×); KI share from 51% to 69% (plus 18).
Notes below the table read:
GVC and KI (knowledge-intensive) incomes are calculated as described in the main text. The Change in GVC income is measured as the ratio of 2018 to 1995 income. The Change in KI specialization is the difference between the KI shares in 2018 and 1995. All income values are expressed in 2011 PPP-adjusted US dollars. Source: Buckley et al. (2020), updated using estimates by Gentile and de Vries (2024).
Notes: GVC and KI (knowledge-intensive) incomes calculated as described in main text. Change in GVC income is measured as GVC income in 2018 divided by level in 1995. Change in KI specialization is measured as share in 2018 minus the share in 1995. All income values are expressed in US$ at constant 2011 PPPs.
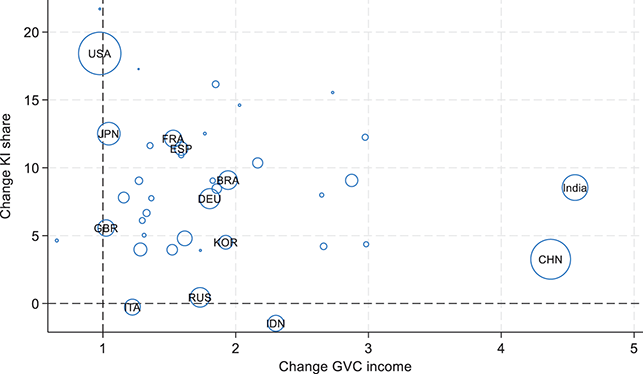
Countries varied not only in the growth of real GVC income but also in the type of tasks performed. The last columns of Table 2 show the share of knowledge-intensive tasks in overall GVC income, revealing a clear pattern of specialization from 1995 to 2018. Emerging economies are generally less specialized in KI tasks compared to advanced market economies. Figure 3 summarizes country-level data, plotting changes in GVC income on the horizontal axis (2018 GVC income divided by 1995 levels) and changes in specialization on the vertical axis (KI income share in 2018 minus the share in 1995). Countries on the south-east side of the graph experienced rapid GVC income growth, while those on the north-west side saw KI specialization in the Global Factory. While China’s KI tasks grew faster than fabrication, its overall share of fabrication remained high globally, creating substantial employment opportunities and lifting many out of poverty. India, already specialized in KI tasks in 1995, maintained this specialization, with 74% of GVC income from KI tasks compared to China’s 40%. Japan and the United States saw substantial increases in the share of KI tasks, with real income from KI tasks remaining stable while fabrication income declined. This contributed to labor market polarization and lower relative wages for less skilled workers in routine fabrication jobs (Autor and Handel, Reference Autor and Handel2013). France, Germany, and South Korea successfully capitalized on the expanding global consumer market, increasing tasks for both skilled workers in KI tasks and less skilled workers in fabrication. They were differently impacted by the “China shock” compared to Anglo-Saxon countries.
Change in GVC income and KI specialization, by country
Notes: Change in GVC income between 1995 and 2018 on horizontal axis. Change in KI share on vertical axis, multiplied by 100. Data taken from Table 2. Bubbles reflect country’s size of GDP (at PPP) in 2011.
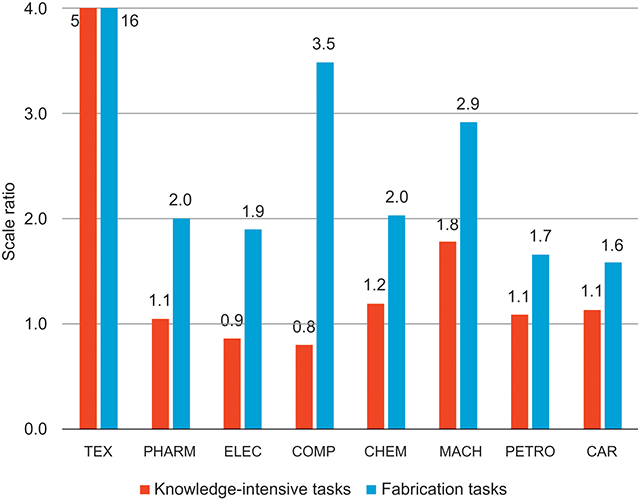
Specialization patterns in the global factory differ across products. For instance, KI tasks in apparel are easier to enter than in pharmaceuticals due in part to the strategic importance of patents in the latter. Generally, production processes reliant on intellectual property or advanced technology requiring tacit knowledge acquired through learning and experimenting show distinct specialization patterns. Figure 4 shows the scale of workers in fabrication and KI tasks in emerging economies (EE) relative to advanced economies (AE) for separate product groups in 2018.Footnote 15 Products are ranked by their relative scale ratio for workers performing fabrication tasks. The scale gap in KI tasks is much smaller than in fabrication tasks. Clearly, there is notable variation across products. For example, the scale of tasks in emerging economies for textiles is a major outlier, with the number of workers performing fabrication tasks per capita in EEs more than twelve times that in AEs. For KI tasks, it is almost four times the level in AEs, indicating there are also many workers in EEs involved in pre- and post-fabrication tasks. In pharmaceuticals, a substantial portion of fabrication tasks is in EEs (double the AE level), but this is much less so for KI tasks.
Scale of tasks in emerging economies relative to advanced economies, by product group, 2018
Notes: Scale (GVC workers per capita) of knowledge intensive and fabrication tasks in emerging economies relative to advanced economies. TEX: Textiles, wearing apparel and leather products; PHARM: pharmaceutical products; ELEC: electrical equipment; COMP: computer, electronic and optical products; CHEM: chemical products; MACH: Manufacture of machinery and equipment; PETRO: refined petroleum products; CAR: motor vehicles and trailer.
The offshoring of tasks to emerging economies contributed to a decline in the labor share in incomes and a rise in the capital share in both advanced and emerging economies (Timmer et al., Reference Timmer, Erumban, Los, Stehrer and de Vries2014; Karabarbounis and Neiman, Reference Karabarbounis and Neiman2014). Multinational firms developed firm-specific coordination systems, taking advantage of offshoring labor-intensive tasks to low-wage locations, leading to a decline in labor income in GVCs due to wage cost savings. The growth in global purchasing power, particularly in China, benefited multinational firms that leveraged existing intangibles like brand names and distribution systems at low marginal costs. This relates to how lead firms in GVCs have increasingly concentrated on developing and managing so-called “intangible assets.” These intangibles, which are highly appropriable, non-location bound, scalable at low marginal cost, and susceptible to opaque valuations, have become crucial for generating profits and temporary market power of multinational enterprises (Teece, Reference Teece2018; Durand and Milberg, Reference Durand and Milberg2020). Clearly, such intangible assets contribute to productivity by enhancing a firm’s ability to innovate, scale, and differentiate itself in the market. For example, patents can protect innovative ideas, allowing firms to recoup R&D investments, while trademarks and branding (including goodwill) help firms attract and retain customers more effectively. These intangible investments often exhibit spillover effects, where benefits extend beyond the firm, and scalability, meaning that once created, they can be used repeatedly at low marginal cost, both of which amplify their contribution to productivity (Haskel and Westlake, Reference Haskel and Westlake2017). Indeed, recent studies highlight the rise of “superstar firms” in the United States, which leverage scalable information technologies and significant investments in intangible assets to gain productivity advantages and increase market shares (Crouzet and Eberly, Reference Crouzet and Eberly2019; Autor et al., Reference Autor, Katz, Patterson and Van Reenen2020).
But just how important are intangibles in the division of gains in the Global Factory? Given their attributes, the returns to intangible assets are difficult to separate from returns to more conventional tangible assets such as plant, machinery, hardware, and buildings. When produced and used in-house, they are often not fully reported in firms’ balance sheets or national accounts statistics (Corrado et al., Reference Corrado, Hulten, Sichel, Corrado, Haltiwanger and Sichel2005). Chen et al. (Reference Chen, Los, Timmer, Corrado, Haskel, Miranda and Sichel2021) propose the “yeast approach” to measure intangible income indirectly based on residual income. This method aligns with the role of intangible assets in value creation and appropriation. Intangible capital acts as the “yeast” that generates value from labor and tangible assets. The returns to this intangible yeast are calculated residually by subtracting the costs of labor (L at wage w) and tangible assets (K at user cost rate r) from the value-added (Y), i.e., Y – rK – wL. Data on value-added, tangible asset stocks, and labor costs from national accounts statistics allow for estimates of intangible asset returns.Footnote 16 Results are given in Table 3, highlighting broad trends in returns within the global factory of manufactured goods. It confirms prior research that found a decline in the labor share of worldwide returns in GVCs. Most notably, it shows that returns from intangible assets (intellectual property, R&D, and firm-specific knowledge) far exceed those from tangible assets, by a factor of 1.7 in 2019, making up almost a third of the total market value of final manufactured goods. The results also show that the early 2000s was a unique period in the global economy where supranormal returns were temporarily captured, largely due to firm-specific intangible assets that went unrecorded in national statistics. The share of intangibles went up from 27% to 31% of total GVC income, gradually declining again to 30% in 2019, but not returning to the 2000 level.
In conclusion, the structure of the Global Factory has undergone a fundamental transformation, affecting both the distribution of tasks among countries and the allocation of returns to various factors of production. Recently, globalization has changed. Recent supply chain disruptions have been primarily driven by a shift in the nature of economic shocks, from isolated incidents to system-wide events, rather than by changes in the supply chains themselves (Baldwin et al., Reference Baldwin2023). Looking ahead, the future of globalization is likely to be shaped more by services, particularly intermediate services, than by goods. This shift is evident in the diverging growth patterns of services and goods trade. Digital technology has enabled increased trade in intermediate services, and high-income countries generally maintain few or no barriers to such exports, facilitating this trend (Baldwin, Reference Baldwin2022).
| Factor inputs | 2000 | 2007 | 2013 | 2019 |
|---|---|---|---|---|
| Labor returns | 57.2 | 52.7 | 52.1 | 52.7 |
| Tangible asset returns | 15.4 | 16.0 | 17.9 | 17.5 |
| Intangible asset returns | 27.4 | 31.4 | 30.0 | 29.8 |
| Total returns in GVCs | 100.0 | 100.0 | 100.0 | 100.0 |
Notes: The shares of each factor input are expressed as percentages of the total GVC returns. Labor returns include all costs of employing labor, including self-employed income. Tangible asset returns are calculated as gross returns to tangible assets based on a 4% real (net) rate of return and industry-specific depreciation rates. Intangible asset returns are calculated as a residual (gross value added minus labor and tangible asset returns). The total returns include returns earned in the upstream, production and downstream GVC stages of the production of all manufactured goods in the world economy.
4 Trade in Tasks Development: Stylized Facts
Whereas the previous section provides aggregated trends, this section provides greater detail by contributing to the long-standing tradition of analyzing patterns of structural transformation as incomes rise (Chenery et al., Reference Chenery, Robinson and Syrquin1986; Syrquin, Reference Syrquin, Chenery and Srinivasan1988; Herrendorf et al., Reference Herrendorf, Rogerson and Valentinyi2014). A traditional concern in this literature is the lack of export development, which appears to be linked with slower structural change and productivity growth. We study the domestic value-added content of exports and revisit the relationship between export development and income growth from a task perspective.
Section 4.1 describes the average patterns in task shares across different levels of economic development. We document that the export basket of countries changes not only across industries (e.g., from textiles to electronics) but also within them (e.g., from craft workers to engineers). We also provide evidence that participation in GVCs relates to enhanced productivity but limited employment expansion. Section 4.2 employs a shift-share method to examine how countries initially specialize along the extensive margin (shifting exports of value added across industries) and later along the intensive margin (shifting exports across occupations within industries).
4.1 Trade in Tasks and Levels of Economic Development
How do exports evolve in terms of tasks as countries grow richer? Figure 5 illustrates the development of export shares of various industry-occupation pairs as GDP per capita increases. These shares are estimated using a non-parametric smoother on data from fifty-two countries over a span of twenty years.Footnote 17
Task shares in exports over levels of economic development, selected industries
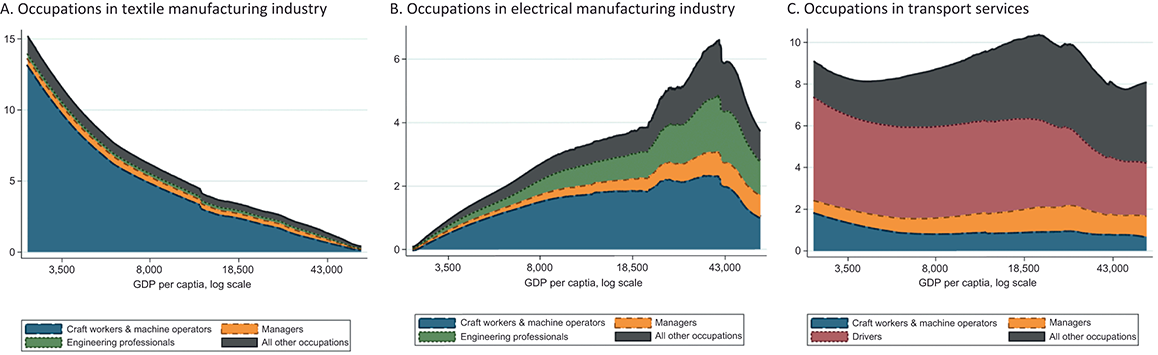
Traditionally, export patterns are described as progressing from agricultural to manufacturing products. Within manufacturing, exports shift from light industries that rely on unskilled labor to heavy industries that depend on physical and human capital (Syrquin, Reference Syrquin, Chenery and Srinivasan1988). Figure 5 confirms this progression. The share of the textile industry in total value-added exports is generally high during the early phases of development but steadily declines as countries grow richer (Panel A). Conversely, the export share of tasks in the electrical machinery industry steadily increases, peaking at a GDP per capita of around $40,000 before declining (Panel B).
However, a task perspective reveals that the export basket of countries changes not only across industries but also within them. For instance, in the early stages of development, exports from the electrical industry are dominated by craft workers and machine operators. As countries develop, engineers play a major role in these exports (Panel B). Additionally, the services industry makes substantial contributions to value-added exports, as noted by Johnson and Noguera (Reference Johnson and Noguera2017). For example, tasks in the transport services industry constitute between 8% and 10% of total export value at all development levels (Panel C). Initially, these tasks are mostly performed by drivers and mobile plant operators. Over time, the share of tasks performed by clerical support workers and sales workers increases. These results show that the composition of exports evolves not only across different industries but also within industries as countries develop.
Figure 6 illustrates the cross-country evolution of trade in tasks relative to GDP per capita. To simplify the analysis, panel A aggregates the 455 tasks into five broad groups: engineering, managerial, production, support, and other across all industries. A common distinction in global production is between fabrication and headquarter activities, generally aligned with unskilled (blue-collar) and skilled (white-collar) labor, which we discussed in the previous section. Building on this, we now classify occupations into five functional task categories: engineering, managerial, production, support, and other. These categories reflect how multinational firms typically structure their operations around core business functions to exploit internal economies of scale (Porter, Reference Porter1985).
Task shares in exports over levels of economic development, cross-country
Notes: Based on percentage shares of tasks in overall domestic value added exports for 59 countries and 20 years. Shares are plotted against GDP per capita (in 2017 US$, log scale) using a non-parametric LOWESS smoother with bandwidth 0.5. Broad groups are aggregated up and summed over all industries in panel A. Support services include: other professionals, clerical support workers, and sales workers; Production includes: craft workers and machine operators, agricultural workers, and drivers; Others include: legislators, health professionals, teachers, personal support workers; and other workers. Further breakdown of production in panel B by industry in which production task takes place: agriculture and mining refer to ISIC rev. 4 codes A and B, manufacturing industries to code C and services industries to codes D to U.
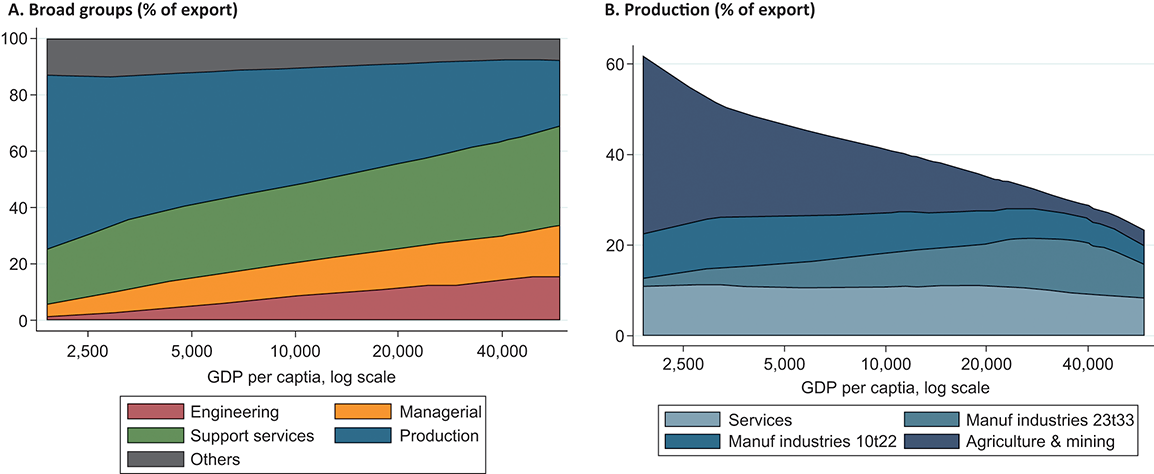
The data indicate that at lower levels of economic development, production constitutes a large portion of export income. Specifically, the production share decreases from over 50% of total exports at GDP per capita levels below $5,000 to approximately 30% at levels above $40,000. As countries become wealthier, engineering, managerial, and support increasingly dominate the labor income derived from exports.Footnote 18 Panel B offers a more detailed look at production across four broad industry groups. It reveals a shift in income from production within agriculture, mining, and “light” manufacturing industries (such as food and textiles) toward production in “heavy” manufacturing industries (including electrical and transport equipment).
Changes in task income shares likely relate to productivity growth. This is because tasks are likely to differ in their returns to factor inputs, for example, where the average wage of engineers is higher than assemblers. Tasks are also likely to differ in their potential for productivity growth and in the generation of knowledge and other spillovers. However, whether changes in task income shares also relate to employment growth is a different matter. As Rodrik (Reference Rodrik2018) argues, the specialized nature of GVC participation, typically focused on a narrow set of tasks within global production networks, limits the development of domestic linkages. This means that local firms are often excluded from upstream or downstream activities, reducing opportunities for job creation, technology transfer, and productivity spillovers. As a result, GVC integration may raise export volumes and foreign investment without delivering the widespread employment benefits or structural transformation that characterized industrialization in earlier periods of development. Compounding the issue, Rodrik (Reference Rodrik2018) contends that technological advancements within global value chains favor skilled labor, resulting in increased productivity but failing to adequately absorb unskilled workers.
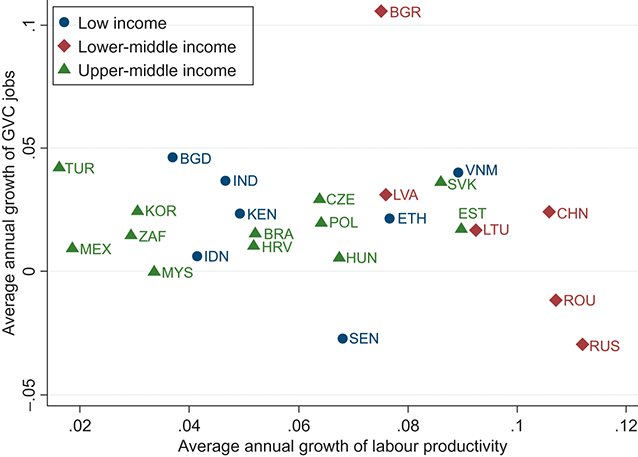
Suggestive evidence for this is provided in Figure 7. The figure shows the change in the number of workers involved in global value chains plotted against the change in labor productivity. Some countries, such as China and Vietnam, demonstrate a combination of job creation and rapid labor productivity growth. In contrast, other countries like Ethiopia, Romania, Russia, and Senegal experience high productivity growth but relatively modest job growth. Overall, there is no clear positive relation between job creation and productivity (value added per worker) in global value chains. This aligns with other recent studies. Country-level regressions indicate that participation in global value chains positively relates to labor productivity (Constantinescu et al., Reference Constantinescu, Mattoo and Ruta2019), but does not necessarily lead to employment growth (Pahl and Timmer Reference Pahl and Timmer2020; Winkler et al., Reference Winkler, Kruse, Luna and Maliszewska2023). Firm-level data from Diao et al. (Reference Diao, Ellis, McMillan and Rodrik2021) reveal that larger firms in Tanzania and Ethiopia, which have recently started exporting, show enhanced productivity but limited employment expansion.
Productivity and employment growth within global value chains
Notes: Average annual growth rates of workers and labor productivity (measured as deflated value added per worker) in GVCs from 2000 to 2014 are presented. The results cover 7 low-income countries (Bangladesh, Ethiopia, Indonesia, India, Kenya, Senegal, and Vietnam), 6 lower-middle-income countries (Bulgaria, China, Lithuania, Latvia, Romania, and Russia), and 12 upper-middle-income countries (Brazil, Croatia, Czech Republic, Estonia, Hungary, South Korea, Malaysia, Mexico, Poland, Slovakia, South Africa, and Turkey).
The next section investigates the extent to which countries follow a common development path in export specialization. First, we further explore how the composition of exports evolves both across industries and within industries as countries develop.
4.2 Trade in Tasks: Distinguishing Changes along the Intensive and Extensive Margin
As discussed in the previous section, changes in the tasks composition of exports can be driven by shifts along the extensive margin – shifting exports of value added across industries – and shifts along the intensive margin – shifting export income across occupations within industries. To quantify the relative importance of these shifts, we conduct a standard shift-share decomposition. The overall change in
 , the share of occupation o in a country’s overall export income during a particular period, can be expressed as follows:
 (1)
(1)
where
 represents the share of workers with occupation o in exports of industry i, and
 denotes the share of industry i in the country’s overall export income. Δ indicates the change over the period and a bar over a variable denotes the period average of that variable.
A change in
 can result from two main factors. Firstly, shifts along the intensive margin occur when there are changes in the distribution of value-added exports across different occupations within industries. This is represented by the first term on the right-hand side of the equation. Secondly, changes along the extensive margin occur when there are shifts in the distribution of value-added exports between industries. This is captured by the second term in the equation.
Table 4 presents the decomposition for each of the five broad occupational groups between 2000 and 2018. The economies are categorized into advanced and developing groups based on their income levels in 2000 (see Appendix B for the countries in each group). The results are reported as simple averages across all economies within each group.
| Occupational group | Advanced economies: Within industry | Advanced economies: Between industry | Total | Developing economies: Within industry | Developing economies: Between industry | Total |
|---|---|---|---|---|---|---|
| Managerial | 104.4 | −4.4 | 100 | 138.2 | −38.2 | 100 |
| Support services | 84.0 | 16.0 | 100 | 47.3 | 52.7 | 100 |
| Production | 57.0 | 43.0 | 100 | 22.0 | 78.0 | 100 |
| Other occupations | 41.8 | 58.2 | 100 | −10.3 | 110.3 | 100 |
| Engineering | 32.6 | 67.4 | 100 | 39.4 | 60.6 | 100 |
Notes: The change in the share of a broad occupation group in export incomes is decomposed into between-industry and within-industry effects according to equation (1) for five broad aggregations of occupational groupings. Results are standardized by the total change within each broad aggregation and ordered by the within-industry component for advanced economies. Simple country averages are given for advanced and developing economies.
In developing economies, the decline in the export of production tasks is primarily attributed to shifts along the extensive margin, as workers transition toward less production-intensive industries. As countries progress economically, shifts along the intensive margin become increasingly dominant, aligning with the production outsourcing hypothesis, also referred to as the “servicification” of goods industries, as highlighted by Duernecker and Herrendorf (Reference Duernecker and Herrendorf2022). Engineering continues to expand its export share across all development levels, primarily driven by shifts along the extensive margin. Conversely, the increase in the export share of managerial tasks occurs exclusively through increasing shares within industries, observed in both developing and advanced economies.
Our exploratory findings illustrate how the task composition of exports evolves along both the industry (extensive) and occupation (intensive) dimensions as countries advance. Initially, countries specialize along the extensive margin, shifting exports of value-added across industries. As GDP per capita continues to rise, specialization intensifies along the intensive margin, with exports of value-added shifting across occupations within industries. While extensive diversification is captured in analyses using the traditional product or industry perspective, intensive diversification is not. This sheds light on the nuanced dynamics of export composition changes as countries progress in terms of GDP per capita.Footnote 19
5 The Dynamics of Task Specialization
The traditional approach to measure specialization in trade is based on the product composition of countries’ gross export flows. A central argument in this Element is that this product perspective needs to be enriched with information on what workers do, due to large-scale offshoring trends with workers across countries carrying out different tasks in global value chains.
This section provides new insights by analyzing the dynamics of trade specialization through the lens of tasks. Section 5.1 describes the methodology to identify what tasks countries are relatively best at doing. It also provides an illustration using the exports of electronics. Section 5.2 examines the cross-country relation between task specialization and levels of development. Section 5.3 studies the dynamics of task specialization within countries over time. Section 5.4 explores the determinants of task specialization. The final part of this section, Section 5.5, explores the role of automation in task specialization.
5.1 Comparative Advantage in Tasks: Method and Illustration
A common method to determine if a country is specialized in a particular product is to examine whether the product’s share in the country’s overall exports is higher than the corresponding share in the exports of other countries (Balassa, Reference Balassa1965). For example, when a specific product accounts for a larger share of a country’s exports compared to others, it suggests that the country has a comparative advantage in producing and exporting that good.
Yet, consider the measurement of
 , which is the income of task j in country c’s exports in a particular year t (see Appendix A for the mathematical approach to measure trade in tasks). We can adapt the Balassa method that compares product shares, and define a Task Specialization (TS) index based on task incomes in exports. The TS index is then measured as:
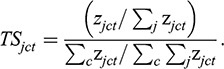 (2)
(2)
The numerator measures the share of task j in overall income in country c’s exports at time t. The denominator calculates the same share across all countries. If the index is above 1 for a particular task j, country c is said to be specialized in exporting that task.
The TS index is simple and intuitive. Yet, how should it be interpreted? First, the TS index is appealing as a measure of specialization but should be interpreted with care. According to Ricardian trade theory, differences in relative productivity determine trade patterns. Thus, observable trade patterns can infer unobservable productivity differences. French (Reference French2017) shows how the Balassa index maps into variables of common quantitative trade models, but these models focus on final goods. It awaits consideration of models that feature trade in tasks (Baldwin and Robert-Nicoud, Reference Baldwin and Robert-Nicoud2014; Antràs and de Gortari, Reference Gortari2017). Second, the TS index is related to concentration indices like the Herfindahl index, used in economic geography. However, the TS index differs as it compares shares, not distributions, and focuses on tasks related to exporting. This distinction helps separate traded from non-traded activities, which employment or industry statistics alone cannot do (Kemeny and Storper, Reference Kemeny and Storper2015). Third, labor incomes are nominal values in a common currency (US dollars), reflecting international competition. Task income depends on the number of workers, their productivity (value added per worker), and the labor income share in value added. Changes in these factors affect the TS index only if they impact specific functions differently. For example, a general productivity increase won’t affect TS indices, but an increase in productivity for engineering tasks might.
That said, Table 5, derived from Timmer et al. (Reference Timmer, Miroudot and de Vries2019), illustrates trade specialization in electronic goods for selected countries. Indices exceeding one, indicated in bold, denote specialization. Initially, gross export flows (column 1) suggest that China, Hungary, Mexico, and Japan specialize in electronics exports. However, value-added export data (column 2) reveals a different picture: Hungary and Mexico lack specialization in electronics production for exports, while the United States emerges as being specialized in it. This discrepancy arises from Hungary and Mexico’s greater reliance on imported intermediates for export production compared to the United States.
| Exporting country | Based on gross export value | Based on value added | Based on task income: Fabrication | Based on task income: R&D | Based on task income: Management | Based on task income: Marketing |
|---|---|---|---|---|---|---|
| China | 2.56 | 2.57 | 4.02 | 0.85 | 0.80 | 2.19 |
| Hungary | 1.60 | 0.97 | 1.20 | 0.83 | 0.70 | 0.97 |
| Mexico | 1.54 | 0.86 | 1.83 | 0.90 | 0.78 | 1.12 |
| Japan | 1.38 | 1.57 | 2.06 | 1.49 | 0.35 | 1.91 |
| United States | 0.90 | 1.05 | 0.59 | 1.50 | 2.36 | 1.23 |
| Austria | 0.66 | 0.72 | 0.50 | 1.03 | 0.82 | 0.68 |
Notes: Balassa indices based on comparing shares of electronics exports of a particular country to similar share for all countries in the world. Exports of value added include value added by any industry in the export of goods from the electronics industry (ISIC rev. 3 industries 30 to 33). Indices greater than 1 are in bold.
The task specialization perspective offers novel insights. Columns 3–6 demonstrate that Mexico and Hungary do indeed specialize in electronics, but specifically in fabrication tasks. China’s comparative advantage lies in both fabrication and marketing. The United States and Japan, however, specialize in R&D and marketing, crucial for orchestrating and governing global production networks. This example underscores the conceptual appeal and empirical utility of analyzing specialization in traded tasks. By employing this approach, nuanced patterns of specialization that traditional measures might overlook can be revealed, thereby enhancing our understanding of global trade dynamics and comparative advantages.
The TS index is a relative measure that compares the value added of various tasks within a country. However, it does not indicate the overall level of activity in that country. For instance, in China, income from R&D and other tasks has rapidly increased, but if production tasks grow at the same pace (as they did during the period we analyzed), the TS index for R&D – being relative to other tasks – remains low. Additionally, because it is a relative measure, the index is sensitive to the set of countries included in the analysis. Moreover, the TS index is an aggregate measure, which means that differences in bilateral trade costs and trade distortions specific to destination markets might obscure the identification of a country’s specialization pattern in unilateral analysis (French, Reference French2017). The analysis of specialization presented in the subsequent sections provides a proof of concept and aim to illustrate key patterns both across and within countries.
5.2 Task Specialization and Levels of Economic Development
What tasks characterize a country’s role in the global economy? Interestingly, countries with similar levels of economic development often exhibit diverse specialization patterns. Figure 8 illustrates this phenomenon by plotting GDP per capita against the TS index for fifty-two countries in 2018. This figure expands upon the work of Timmer et al. (Reference Timmer, Miroudot and de Vries2019), who focused on high-income and rapidly growing emerging economies. The extended sample in this Element includes low- and middle-income countries, providing a more comprehensive view of the relationship between economic development and task specialization.
Task specialization in exports, 2018
Notes: Countries above the horizontal line indicate specialization in a task (TS≥1). Authors’ calculations.
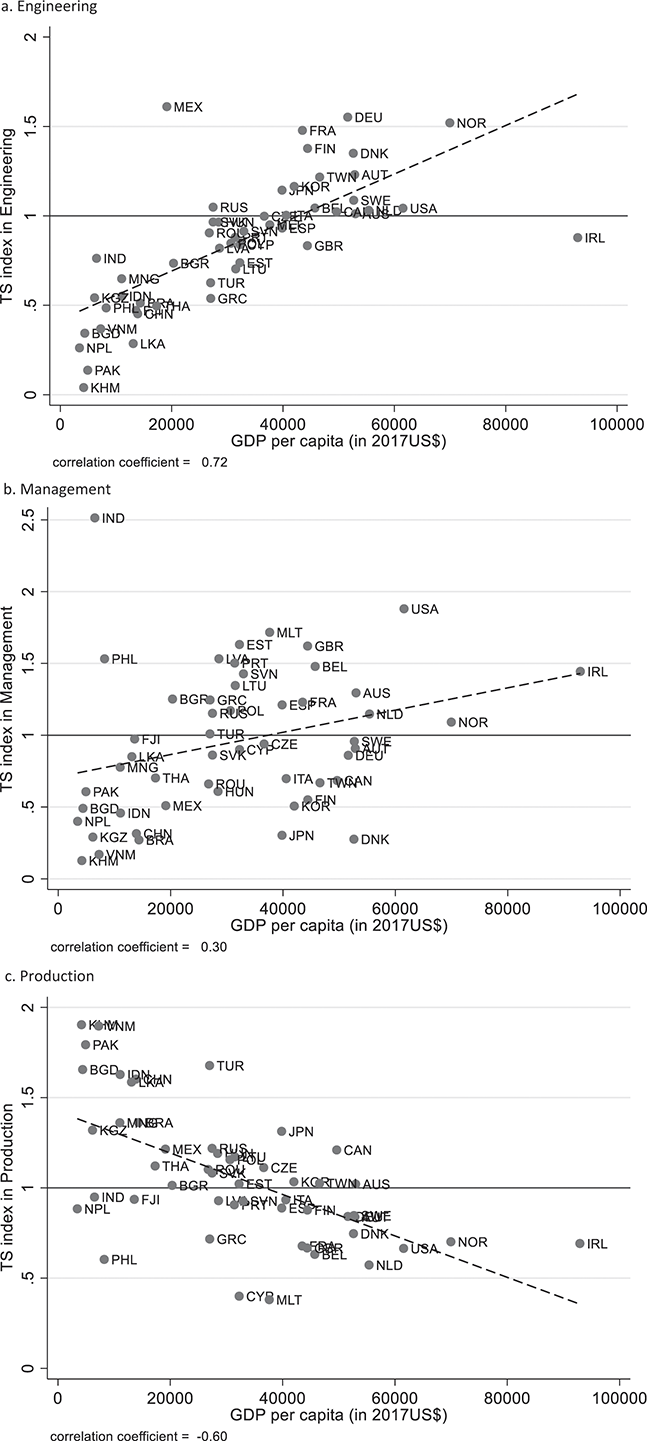
Figure 8 presents various panels. Horizontal lines at TS = 1 delineate specialization thresholds. The first panel reveals a strong positive correlation (Pearson coefficient: 0.72) between GDP per capita and engineering specialization. In 2018, most advanced economies demonstrated a clear comparative advantage in engineering, with France, Finland, Germany, and Norway being particularly notable. However, Spain and Great Britain exhibited TS indices below 1, indicating less specialization in this area. These findings suggest that engineering specialization is a common characteristic of advanced economies, though not universal.
The pattern of specialization is less pronounced for other headquarter activities, particularly management. The second panel in Figure 8 illustrates TS indices for management, revealing a weaker positive correlation with GDP per capita (Pearson coefficient: 0.30). This less distinct relationship can be partially attributed to the prevalence of small-sized firms in developing countries (Ahsan and Mitra, Reference Ahsan, Mitra, McMillan, Rodrik and Sepulveda2017; Gottlieb et al., Reference Gottlieb, Doss, Gollin and Poschke2024). In these economies, firm owners are often classified as managers, inflating the TS index for management. This phenomenon is especially evident in developing nations like India and the Philippines.
Specialization in production tasks exhibits a negative correlation with income per capita (Pearson coefficient: −0.60). However, panel c of Figure 8 reveals substantial heterogeneity in this relationship. For instance, Vietnam and the Philippines, despite having similar levels of economic development, display markedly different specialization patterns. Vietnam shows strong specialization in production tasks, while the Philippines does not.
While comprehensive case studies are needed to fully understand this variety, we can begin by examining the types of goods and services a country exports as explored in the shift-share analysis of Section 4. For instance, the United Kingdom’s strong comparative advantage in management correlates with its exceptionally high export share of financial services, an industry typically characterized by a high proportion of management workers. Similarly, Canada’s specialization in production aligns with its unusually large export share of natural resources, as mining and primary product manufacturing generally require above-average shares of production workers.
However, other factors can influence specialization patterns. Japan’s large share of local production, for example, may be driven by strong consumer preference for domestic brands and quality. This suggests potential avenues for further research into the structure of multinational production networks in East Asia and beyond.
5.3 The Dynamics of Task Specialization
The previous section highlighted that countries with similar levels of economic development can have very different areas of specialization. These differences are influenced by factors such as legal systems, infrastructure, and human capital. Additionally, the size of the country, its attractiveness for multinational headquarters, geographical features, and historical development of capabilities and networks also play a role (further discussed toward the end of this section). These characteristics tend to change slowly over time.
Table 6 presents a transition table for specialization, supporting this hypothesis. Each country is assigned to a group based on the task for which it had the highest TS index in a given year. Since a country can only have one highest TS index, these groups are mutually exclusive. For instance, Finland was specialized in engineering in 2000 because its highest TS index was in this field. This remained true in 2018, so Finland is placed in the top left cell of the transition table.
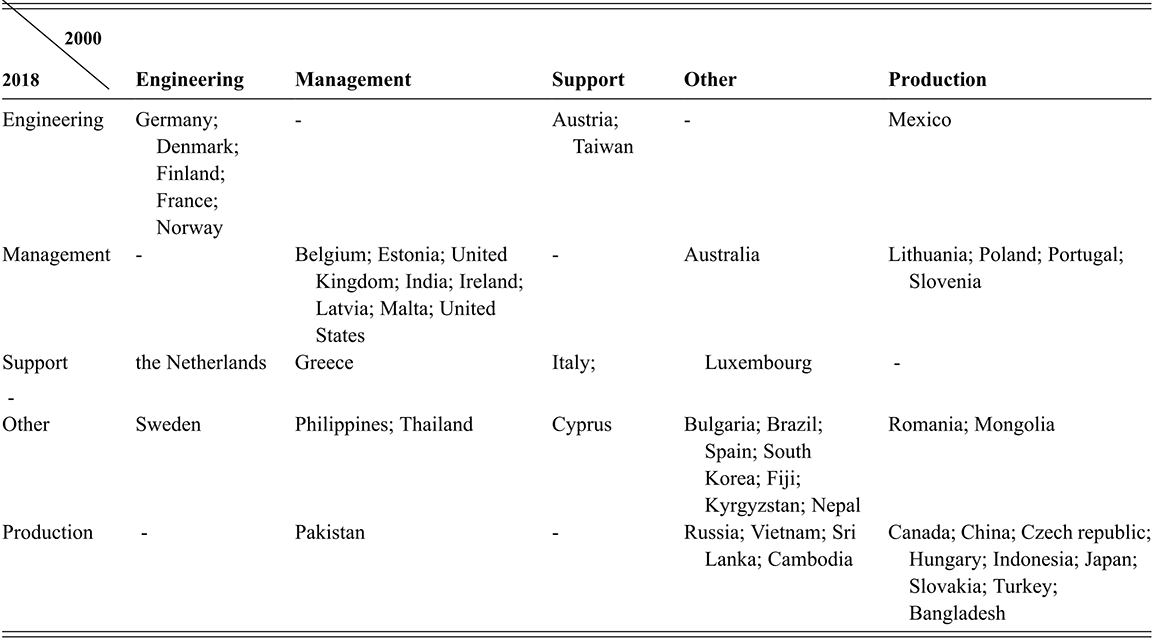
Table 6 Long description
A 5 by 5 transition matrix. Columns represent countries’ highest task-specialization category in 2000 (Engineering, Management, Support, Other, Production). Rows represent the same categories in 2018. Each cell contains lists of country names, showing how many countries remained in their original specialization category (diagonal cells) versus shifted to a new one (off-diagonals). The diagonal cells contain the most entries, indicating strong persistence. Off-diagonal cells contain smaller clusters of countries that shifted to new specialization types, such as several Central or Eastern European economies moving from Production to Management, or Austria and Taiwan moving from Support to Engineering.
Notes: Allocation of countries to a particular group is based on highest specialization index of the country in 2000 (columns) and 2018 (rows).
Interestingly, the diagonal cells in the matrix contain most of the countries: thirty-one out of fifty-two. This suggests that specialization patterns changed slowly between 2000 and 2018, which is especially so for countries at higher levels of economic development. Some countries have developed new specialization patterns within just two decades, as evidenced by the non-diagonal entries in the matrix. For instance, several Central and Eastern European countries, such as Lithuania and Slovenia, shifted away from specialization in production toward other tasks like management. Austria and Taiwan moved from specializing in support tasks to focusing on engineering, likely reflecting the reorganization of manufacturing value chains. Meanwhile, countries like Russia and Vietnam transitioned to specializing in production by 2018.
The TS indices are valuable for further exploring task specialization in a country over time. Figure 9 features heat maps illustrating changes in TS indices from 2000 to 2018 for four countries across different developmental stages. Cambodia experienced relatively minor changes compared to the other countries. For instance, TS indices increased in occupations related to hotels and restaurants (industry number 22) and inland transport (23), while they remained stable in many manufacturing sectors. In contrast, Vietnam saw frequent changes, with declines in TS indices for mining (2), food (3), and leather manufacturing (5), alongside increases in other manufacturing sectors and utilities (17) and water transport (24). Notably, machine operators (occupation class 10), clerical support workers (7), and personal service workers (8) saw increased TS indices.
Heat maps of changes in task specialization indices
Notes: Heat maps depicting the change in the task specialization (TS) index for a task over the period 2000–2018 for a particular country. Tasks are cross-classified by 13 occupational classes (vertical axis) and 35 industries (horizontal axis; industries 3–16 are in the manufacturing sector). Red cells indicate a positive change in the TS index, while blue cells indicate a decline. The TS index calculated according to equation (2).
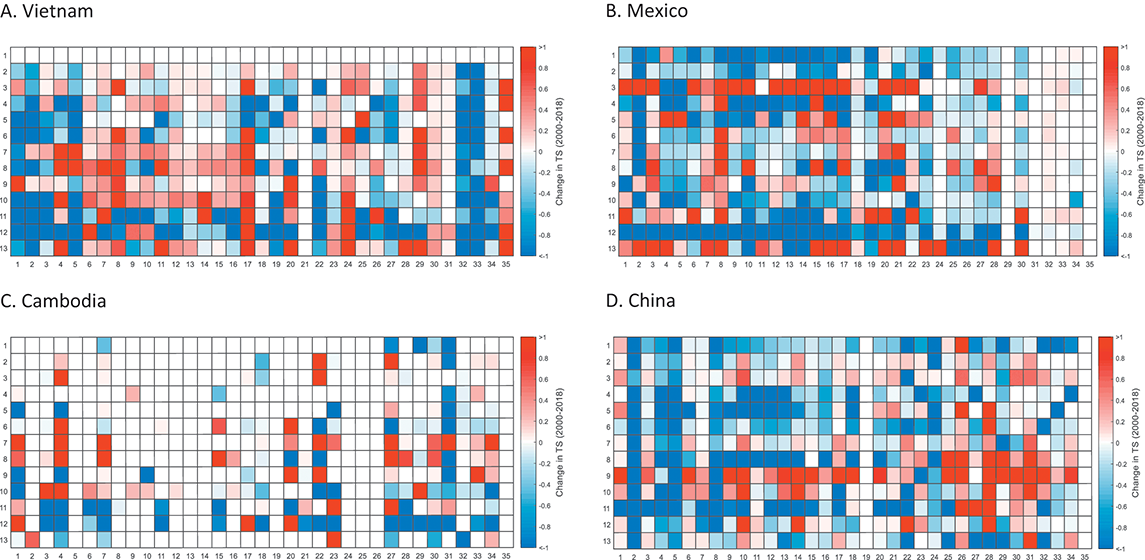
In Mexico, TS developments varied across occupations: increases were observed in food manufacturing (3), petroleum refining (8), and transport equipment (15), while declines were noted in legislators (1) and managers (2) within the same industries. China showed a distinct shift away from goods-producing industries (1–16) toward service production tasks (17–35), with a notable increase in TS indices for sales workers (9) across most goods-producing sectors. Overall, within the same industry, TS indices for different occupations did not consistently move in the same direction, confirming the shift-share analysis presented earlier that shifts along both extensive and intensive margins influence export task specialization.
5.4 Determinants of Task Specialization: Path Dependence
Existing production capabilities shape not only current patterns of task specialization but also influence the emergence of new ones. Consider the case of China. A key characteristic of the globalized economy is the rise of China as a prime location for assembly tasks, which was greatly boosted by its accession to the WTO in 2001. China relied heavily on processing trade as firms imported the major parts and components, typically with tariff exemptions and other tax preferences, and, after assembling, export the finished products. Koopman et al. (Reference Koopman, Wang and Wei2012) found that in 2002, the share of domestic value added in Chinese exports of electronic computers was only 19.3 percent. For all manufacturing exports, the share was 50%in 1997 and 2002, increasing to 60% in 2007. This suggested that China gradually gained the capabilities to substitute imported intermediates by domestic products, taking over more advanced production stages. Kee and Tang (Reference Kee and Tang2016) provide further firm-level evidence for this process of upgrading. For China, Kee and Tang (Reference Kee and Tang2016) document the substitution of imports of sophisticated parts and components by local goods whose production arguably requires more R&D and other headquarter activities. Chor et al. (Reference Chor, Manova and Yu2021) find that Chinese firms span more production stages as they grow more productive, bigger and more experienced over the period from 1992 to 2014.
We posit that current production capabilities not only determine existing task specializations but also likely influence the development of new ones. To investigate this hypothesis, we adapt an outcome-based measure of “proximity” introduced by Hidalgo et al. (Reference Hidalgo, Klinger, Barabási and Hausmann2007) and correlate it with the development of new task specializations in exports. The proximity between a pair of tasks is empirically inferred from the co-occurrence of specializations for these tasks in our cross-country panel dataset.Footnote 20 Specifically, we define the proximity between two tasks j₁ and j₂, denoted as
 , as the empirical probability that a country is specialized in task j₁, given that it is specialized in task j₂:
 (3)
(3)
where probabilities are derived from the cross-country data as

A high proximity value
 indicates that task j₁ is frequently a specialization in countries that also specialize in task j₂, and vice versa. For instance, the proximity between machine operators in basic metals manufacturing and those in transport equipment manufacturing is high (
 = 0.53), whereas the proximity between machine operators and sales personnel within basic metals manufacturing is low (
 = 0.14).Footnote 21 The co-occurrence of specialization in particular tasks might be driven by their common dependence on a country’s endowments such as human capital or the overall business environment. But complementarities between particular tasks might also arise out of the shared requirements of specific job skills, shared infrastructure or specialized inputs. This approach reflects the notion that factors of production are numerous and potentially highly specific, with varying and often unknown degrees of substitutability in performing various tasks (Cirera et al., Reference Cirera, Comin and Cruz2023).
Next, we define the average proximity of a particular new task n to the tasks in which country c is currently specialized at time t. This can be expressed as:
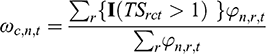 (5)
(5)
We define an indicator function
 that equals 1 when country c is specialized in task r at time t, and 0 otherwise. A higher value of
 for task n₁ compared to task n₂ indicates that country c is currently specialized in tasks that are, on average, more proximate to task n₁ than to n₂. To formally test whether n₁ is subsequently more likely to develop into a new specialization in the next period, we employ a baseline linear probability regression model:
 (6)
(6)
NewSpec(n,c,t+1) is a binary indicator (1 if country c develops a new specialization in task n at t+1, 0 otherwise).
 represents the average proximity of n to the initial export basket (from equation 5). Z is a vector of fixed effects.Footnote 22 We expect β₂ to be positive, as a higher initial Task Specialization (TS) level likely increases the chance of a task becoming a new specialization (i.e., surpassing the TS=1 threshold). The key coefficient is β₁. A positive β₁ indicates that tasks more proximate to a country’s current specializations have a higher probability of becoming new specializations.
Table 7 presents regression results where initial specialization and average proximity are lagged by five years. Year fixed effects are included in all regressions to account for time-varying factors affecting all new specializations. Column (1) presents the baseline regression. As anticipated, the coefficient on initial TS levels is positive and statistically significant. Similarly, the coefficient for average proximity is consistently positive and highly significant across all specifications. This supports the hypothesis of path-dependence, suggesting that a country’s existing strengths and expertise influence its future areas of specialization.
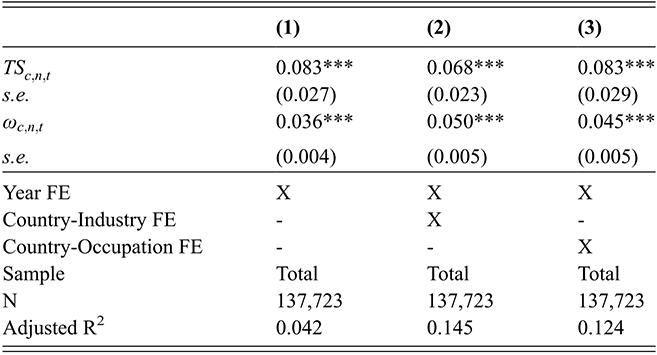
Table 7 Long description
The table has three columns labeled (1), (2), and (3), corresponding to different specifications with varying fixed effects. Each column reports coefficients for two key variables: First, current task specialization: positive and statistically significant in all columns. Second, average proximity to existing specializations: positive and highly significant in all columns. Standard errors appear in parentheses below each coefficient. Below the coefficients, the table indicates which fixed effects are included. All models include year fixed effects. Column (2) also includes country-industry fixed effects. Column (3) includes country–occupation fixed effects. All models use the same sample size (N = 137,723) but differ in adjusted R-squared values. A notes section explains that the dependent variable is an indicator for newly acquiring comparative advantage in a task, that proximity values are normalized, and that robust standard errors are clustered by country.
Notes: Results from linear probability regressions; see equation (6). Dependent variable is
 , a binary being 1 when a country specializes in a new task n (
 ) and 0 otherwise. The independent variables are current task specialization in n (
 ), average proximity of n to the current specialization of a country (
 ) and dummy variables to account for fixed effects (FE).
 ’s are normalized by subtracting the mean and dividing by the standard deviation. Robust standard errors (s.e., clustered by country) are reported in parentheses.
* p<0.1, ** p<0.05 and
*** p<0.01.
Column (2) examines the development of new task specializations along the intensive margin, controlling for country-industry fixed effects. Meanwhile, column (3) focuses on new specializations along the extensive margin, adjusting for country-occupation fixed effects. Average proximity is positively and significantly associated with the development of new task specializations, both at the intensive and extensive margins. A 1 standard deviation increase in the average proximity of a new task to the current basket increases the likelihood of specializing in this task along the intensive margin by 5.0 percentage points (column 2). Similarly, proximity is crucial for specialization along the extensive margin, with an impact of 4.5 percentage points (column 3).
5.5 Automation and Task Specialization
Advances in information technology have changed the way in which certain duties are performed. In particular, Autor et al. (Reference Autor, Murnane and Levy2003) argue that computers and robots tend to displace labor in the performance of routine and non-cognitive duties. This is nowadays typically referred to as routine-biased technological change. Lewandowski et al. (Reference Lewandowski, Park, Hardy, Du and Wu2022) and Caunedo et al. (Reference Caunedo, Keller and Shin2023) find that all countries experienced a shift away from routine to nonroutine jobs, but its pace was slower in developing countries than in developed countries. Reijnders and de Vries (Reference Reijnders and de Vries2018) show that relocation of routine task-intensive occupations from advanced countries accounted for a major part of this difference, moderating the effect of the technology bias for developing countries. At the same time, innovation generates new activities and allows for the development of new specializations (Acemoglu and Restrepo, Reference Acemoglu and Restrepo2019).
To investigate possible differences in the development of task specializations, we constructed for each of our 455 tasks a measure of routine task intensity. We closely follow the approach by Acemoglu and Autor (Reference Acemoglu, Autor, Ashenfelter and Card2011) and make a distinction between two types of routine tasks: manual and cognitive based on O*NET measures.Footnote 23 Routine manual activities are more prevalent in production and operative occupations, and routine cognitive activities are most intensively used in clerical and sales occupations. We split the task data accordingly into two samples and redo the baseline regressions for each sample; see Table 8. For tasks with a high routine manual intensity, we observe a major difference across advanced and developing economies (see columns 1–3). New specializations in routine manual intensive tasks strongly relate to proximity of the tasks to current specialization. For developing economies, a 1 standard deviation increase in average proximity relates to a 10.9 percentage point increase in the probability of specializing in new routine manual intensive tasks. In advanced economies the effect is only 2.9 percentage points. To aid intuition of this result, consider the example of routine assembly line work, which may involve attaching components in a fixed sequence (e.g., screwing bolts, inserting wires); packaging products in standardized ways; or operating machinery to perform a fixed set of actions (e.g., stamping, cutting). The findings suggest that a developing country worker in the textile industry that feeds material into machines that cut fabric in standardized shapes has a higher likelihood to shift to the automotive industry where she engages in component assembly by installing parts like dashboards, seats, or lights in a fixed sequence compared to a similar worker in an advanced economy.
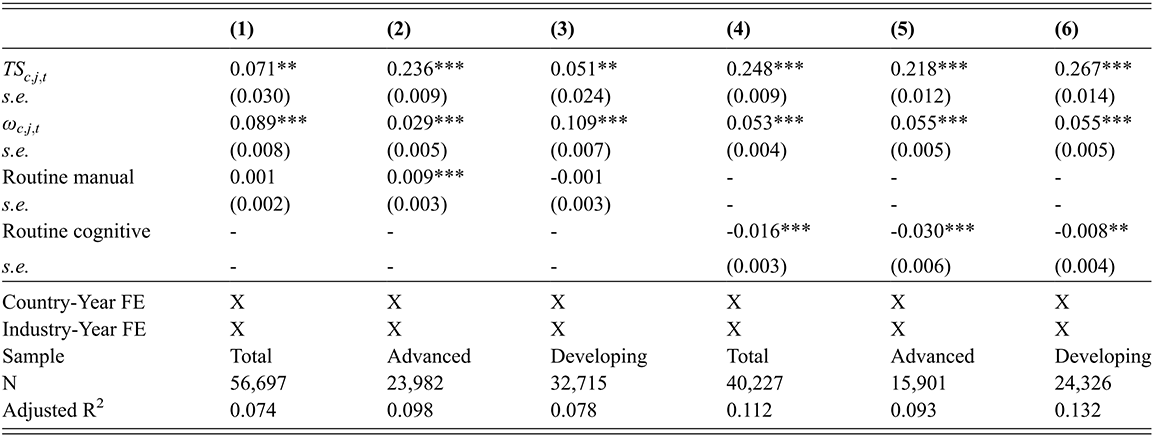
Table 8 Long description
The table is arranged in six columns, labeled (1)–(6). Columns (1)–(3) use the sample of routine-manual–intensive tasks, while columns (4)–(6) use routine-cognitive-intensive tasks. Each set of three columns corresponds to the Total sample, Advanced economies, and Developing economies. All six columns report coefficients for two core predictors, namely Task specialization: always positive and statistically significant; and Average proximity: also positive and highly significant throughout. For the manual routine task sample (columns 1–3), an additional variable, routine manual intensity, appears, with small or weak effects. For the cognitive routine task sample (columns 4–6), routine cognitive intensity appears, negative and significant. Standard errors are shown beneath each coefficient in parentheses. Across all models, country-year and industry-year fixed effects are included. Sample sizes differ by column, with roughly 24–33k observations for advanced vs. developing economies. Adjusted R² values range from about 0.07 to 0.13, somewhat higher in cognitive-task regressions. A notes section clarifies: The dependent variable is whether a country gains comparative advantage in task j five years later. Proximity variables are normalized. Manual vs. cognitive samples are split based on whether a task’s routine intensity lies above its mean. Standard errors are clustered by country. Significance is marked using *, **, ***.
Notes: Results from linear probability regression using equation (6). Dependent variable: whether country c has a comparative advantage in task j at time t+5 (
 = 1). The independent variables are task specialization
 and average proximity
 , defined in equations (2) and (5).
 is normalized by subtracting the mean and dividing by the standard deviation to ease interpretation. Results in columns 1–3 only include observations where the routine manual intensity of the task is above the mean, and results in columns 4–6 where the routine cognitive intensity is above the mean. Accordingly, the regressions control for manual (columns 1–3) and cognitive (columns 4–6) routine intensity of the task. Routine intensity constructed following Acemoglu and Autor (Reference Acemoglu, Autor, Ashenfelter and Card2011), see Kruse et al. (Reference Kruse, Timmer, de Vries and Ye2023b). Robust standard errors (s.e., clustered by country) are reported in parentheses.
* p<0.1,
** p<0.05 and
*** p<0.01.
The impact of proximity on specialization in routine cognitive intensive tasks, however, appears comparable to the impact for all tasks found in the baseline across advanced and developing economies (columns 4–6).
6 New Task Specializations and Economic Growth
This section explores the relation between task specialization and economic performance. New tasks may either closely relate to a country’s existing specializations (path following) or reflect newly acquired capabilities (path-defying). We present an approach to analyze path defiance (Section 6.1), describe new task specializations by countries (Section 6.2), and incorporate this concept into standard growth regressions to assess economic performance (Section 6.3). This method offers one way to evaluate how involvement in global value chains affects economic outcomes.
6.1 Charting New Territories: Measuring Path-Defying Task Specialization
The previous section demonstrated how countries’ task specializations change over time. Here, we are interested in how new specializations relate to existing ones. Specifically, we ask: To what extent are a country’s new specializations closely related to its existing ones, hence path following? Conversely, to what degree are they unrelated to existing specializations, and thus path-defying?
Figure 10 illustrates the evolution of a country’s task specializations over time using a Venn diagram. The rectangle represents the total set of possible tasks in which a country can specialize. As established in Section 5’s heatmaps, this set comprises 455 tasks (13 occupational groupings × 35 industries). The orange circle represents the initial task specialization (TSt), while the blue circle shows the task specialization at a later time (TSt+1). The overlapping area of the circles (TSt ∩ TSt+1) indicates tasks in which the country maintains specialization from time t to t+1. The nonoverlapping area of the blue circle represents new specializations acquired over time.
Venn diagram of task specialization over time
Notes: The orange circle represents the initial task specialization (TSt), while the blue circle shows the task specialization at a later time (TSt+1).
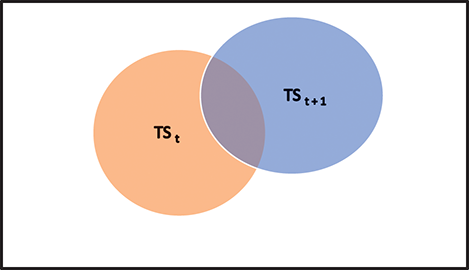
Central to our approach here are new task specializations.Footnote 24 We classify them as either path following (closely related to existing specializations) or path-defying (unrelated to existing specializations). To differentiate between the two, we employ the proximity measure defined in equation (3) of Section 5. Adapting Coniglio et al.’s (Reference Coniglio, Vurchio, Cantore and Clara2021) approach to our context, we define a new specialization as pathdefying if its maximum proximity to the country’s initial task specialization (TSt) is lower than the average proximity of tasks in which the country initially does not specialize (denoted by TSt’, the complement of TSt). In simpler terms, we consider a country’s new specializations “path-defying” when they are weakly related to its initial specializations.
Recall that proximity is measured based on the cross-country data (see Section 5.4). Subsequently, a country’s task specialization pattern is inferred from the estimates for proximity. Hence, path defiance is only observed if a countries new specializations deviate from the average pattern. For example, if countries that are initially specialized in oil shift to tourism over time, this is the average pattern and a country that follows this pattern of task specialization will be labeled as path dependent.
6.2 New Specializations by Country
To determine whether a country is path-defying, we compare two cumulative distribution functions (CDFs) of proximity. The first is the CDF of proximity for the country’s actual new task specializations. The second is a hypothetical random CDF of proximity for all possible new specializations (i.e., the set TSt’). We then test for stochastic dominance of the first distribution over the second. If the actual CDF stochastically dominates the random CDF, we classify the country as path-following. Vice versa, if the actual CDF is not statistically different from the random CDF, we classify the country as path-defying.Footnote 25
Figure 11 illustrates the comparison between actual and hypothetical CDFs for Bangladesh, China, Russia, and Vietnam. In China’s case, the two CDFs are very close, and we cannot reject the null hypothesis at the 1 percent significance level. This indicates that China’s specialization pattern from 2000 to 2018 was path-defying. Conversely, for the Russian Federation, we strongly reject the null hypothesis, suggesting that its export development path was heavily influenced by its initial specialization pattern. During this period, the share of path-defying entries in new specializations was 52.3% in China but only 19.9% in Russia. We also (marginally) reject the path defiance hypothesis for Bangladesh and Vietnam, although their shares of path-defying entries (45.8% and 40.9% respectively) are much larger than Russia’s. The result for Vietnam may seem surprising. However, it indicates that Vietnam’s pattern of task specialization is broadly in line with the average pattern observed across countries. It is important to note that our analysis does not capture the speed at which this development occurs. Vietnam may still be progressing through task upgrading more rapidly than others do.
Density functions of proximity
Notes: Cumulative distribution function (CDF) of proximity for new task specializations is compared with a hypothetical random CDF of proximity for all possible new specializations.
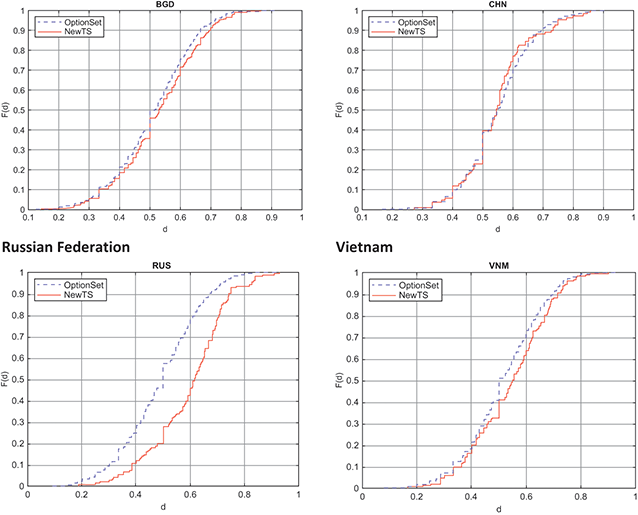
The approach presented here allows examining how countries develop new areas of economic specialization over time. We compared each country’s actual tasks to the hypothetical scenario. The results, available in Table E.1 of the online appendix, show that for forty-four out of fifty-two countries studied, the actual path of specialization is heavily influenced by its initial specialization pattern. This finding supports the idea of “path dependence” in economic development. In other words, a country’s economic future is influenced, but not completely determined, by its past. Our results using task-based data align with earlier product-based research by Coniglio et al. (Reference Coniglio, Vurchio, Cantore and Clara2021). This suggests a possible lock-in in sub-optimal equilibrium, making it difficult to reach high levels of economic development. According to the product space paradigm, policymakers should thus follow a gradualist approach and focus on introducing new products that are close to their current product mix to avoid failure, as introduction of radically new products purportedly requires capabilities that are currently scarce and difficult to create (Hidalgo et al. Reference Hidalgo, Klinger, Barabási and Hausmann2007; Hausmann and Klinger Reference Hausmann and Klinger2007; Hausmann et al., Reference Hausmann, Hidalgo, Bustos, Coscia and Simoes2014; and Coniglio et al., Reference Coniglio, Vurchio, Cantore and Clara2021).
An important dimension of global value chains (GVCs) is the role of export destination, particularly whether firms are producing for high-income or low- and middle-income end-markets. Verhoogen’s (2008) study of Mexican manufacturing provides valuable insights: Firms exporting to the United States tend to upgrade product quality, which in turn reshapes the nature of production tasks and raises the demand for higher-skilled labor. This quality upgrading reflects a move toward more complex, nonroutine tasks and may open avenues for new, higher-value specializations. In contrast, firms targeting developing country markets often focus on standardized, lower-quality outputs, which are typically associated with routine tasks and limited skill upgrading. Thus, the characteristics of the export destination can play a critical role in shaping the trajectory of task development and structural transformation within GVCs. This is left for future research.
However, as we explore next, economic growth appears weaker in developing countries with fewer radically new task introductions in their export baskets. Interestingly, for several advanced economies we cannot reject the null hypothesis that the actual CDF is different from the hypothetical CDF, suggesting their development paths are less predictable. Perhaps most interesting is the task specialization pattern of China. While Coniglio et al. (Reference Coniglio, Vurchio, Cantore and Clara2021) find China’s exports closely relate to its initial strengths, our task-based analysis suggests China has developed expertise in new, unrelated areas. This difference underscores the potential of conducting country case studies to gain new insights into the dynamics of trade specialization and economic development.
6.3 Cross-country Growth Regressions for Task Specialization
Is there a relationship between a country’s rate of introducing new task specializations and its overall economic growth performance? Figure 12 explores this question by plotting GDP per capita growth against the share of path-defying entries for the period 2000–2018, while controlling for initial GDP per capita levels. The regression line suggests a positive relationship, although the variance around it is high. We emphasize that these results are only indicative and should not be interpreted as causal evidence for a growth relationship. The primary purpose of this estimation is to examine how results from a task perspective might relate to economic development.
Economic growth and the degree of path-defying specialization
Notes: Figure plots the orthogonal component of average real GDP per capita growth rate against the average share of path-defying specializations for each country. The regression controls for initial (log) GDP per capita. Slope (standard error) of the linear fit is 3.73 (2.18). Size of circles represent country size measured as average real GDP in 2017 US$.
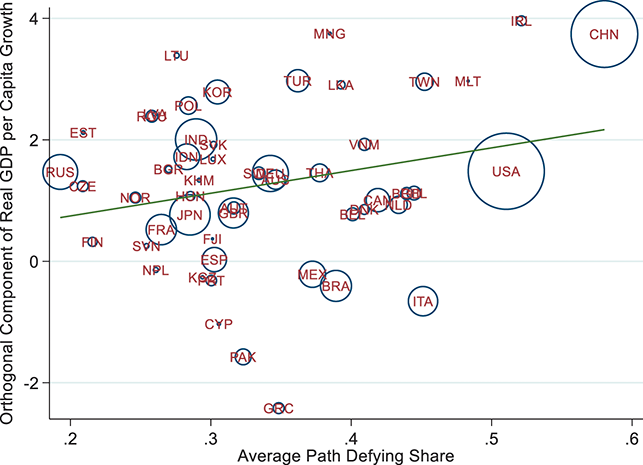
To further explore this relationship, we estimate a parsimonious growth model following the approach of Coniglio et al. (Reference Coniglio, Vurchio, Cantore and Clara2021). We regress GDP per capita growth on the share of path-defying entries plus a variety of economic growth controls. Appendix Table E.2 reports on cross-country growth regressions for the sample of 52 economies. The dependent variable is the average growth rate of GDP per capita in the period [t, t + 1]. The share of path-defying entries in the set of entries (PDShare) during [t, t+1] is given in equation (A4). We follow Coniglio et al. and use ln(PD_share*100) as the main explanatory variable. Results in column (1) suggest that a higher path defiance in a country’s specialization pattern is associated with higher GDP per capita growth. Results in column (2) are based on a regression which includes an interaction term with the level of GDP per capita. The average marginal effect of path defiance is comparable to the marginal effect in the regression without interaction. It suggests that countries with a higher degree of path-defying specialization have faster growth in GDP per capita, albeit the relationship is not significant at conventional significance levels for any level of economic development. Various standard growth covariates such as the level of trade openness and human capital are included. Also, we control for the total number of new task specializations, to account for changes in the denominator for the degree of path dependence. See Appendix Table E.3 for the data sources of the growth covariates. All covariates appear to be significant, except for human capital and political stability (column 2). Interestingly, the positive impact of path defiance remains even after controlling for factor endowments in terms of human capital levels and financial development. This finding suggests that the capabilities required for undertaking new path-defying tasks extend beyond merely expanding educational attainment or developing financial markets in a country.
Additionally, we observe that the impact of path defiance on growth is moderated by the initial level of GDP per capita. Average marginal effects (AME) of path defiance based on the results in column 2 are given in Figure 13. The average marginal effect (AME) of path-defying entries on growth is positive across all development levels, though it’s only statistically significant (at 95% confidence) for countries with GDP per capita between approximately 9,000 and 30,000 US$ (Figure 13). This finding both aligns with and diverges from Coniglio et al.’s (Reference Coniglio, Vurchio, Cantore and Clara2021) results based on product data. They found that economic growth is weaker in countries with higher path dependence in export specializations. Our results qualify their findings (Coniglio et al., Reference Coniglio, Vurchio, Cantore and Clara2021, figure 5) in interesting ways. While we both observe a positive marginal effect for the poorest countries that declines with higher incomes, our results differ for middle-income countries. Coniglio et al. found the effect becomes small and turns negative for this group, whereas our analysis suggests it remains positive.
Average marginal effects of path-defying entries on economic growth
Notes: Figure shows average marginal effects (AME) of path defiance on GDP per capita growth at various levels of economic development. Effects calculated based on regression estimates reported in Appendix Table E.2. Point estimates (blue line) and 95 confidence intervals (grey) are shown over levels of (log) GDP per capita.
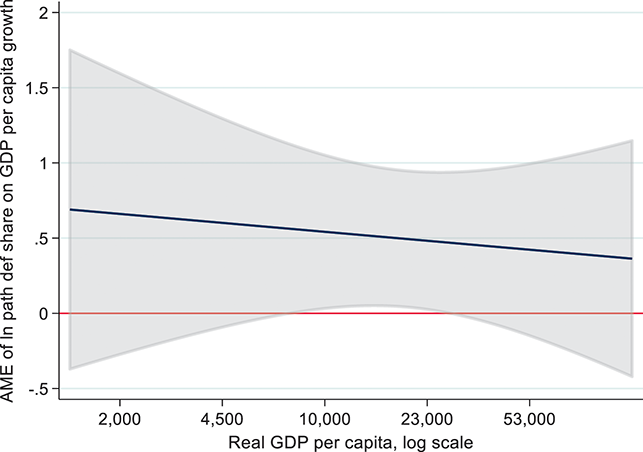
For robustness, two alternatives for the measurement of the path-defying entries are considered. Results in columns 3 and 4 are based on a less stringent definition of path defiance, using the mean proximity value plus one standard deviation as an alternative threshold. Alternatively, values of the percentile rank of the entry, denoted as
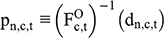 are used as explanatory variable (using the average of all new entries in each period). This third measure informs in which percentile of the hypothetical distribution of proximity (derived from the option set) each entry falls. Low percentiles are associated with entries that are poorly related to the country’s initial export basket and are therefore path-defying. Results using this alternative measure are given in columns 5 and 6. The average marginal effect at the mean is higher for both alternative measures than in the base line. Although the wide confidence intervals preclude definitive conclusions, these differing results highlight the potential for analyses based on the task perspective to generate new insights beyond those derived from the product perspective.
7 Findings and Ways Forward
7.1 Key Findings
Traditionally, structural transformation is studied from a sectoral perspective. However, this perspective has lost focus due to large-scale offshoring trends with countries carrying out different activities in global value chains. As a result countries are trading tasks rather than products. Development of a task perspective on structural change is therefore a much needed addition to the traditional product perspective. This Element showed that a task perspective can be fruitfully developed and that it deepens our understanding of trade, structural change, and development. The main findings can be summarized as follows.
Using the task perspective, we characterized in Section 3 the long term changes in the international division of labor in the production network of manufactured goods: who is doing what in the global factory? International production fragmentation continued for more than two decades unabated: the value added of advanced economies in the global factory declined from 63% in 1995 to 39% in 2018, mostly offshoring production tasks and maintaining knowledge-intensive tasks at home. Correspondingly, emerging economies (including China) increased their share, adding mostly production tasks but also various knowledge intensive activities, albeit the latter at a slower pace. The results also show that the period up to the Great Recession in 2008 was a unique period in the global economy where supranormal returns were temporarily captured, largely due to firm-specific intangible assets such as intellectual property, R&D, and firm-specific knowledge.
At the country level, we identified shifts in task exports both across industries and across occupations as countries develop, and found in Section 4 that both dimensions of structural change are important. More specifically, low-income countries initially specialize in trade along the extensive margin, shifting exports of value added across industries. As GDP per capita increases, countries specialize more along the intensive margin, shifting exports of value added across occupational classes within industries. This latter shift is not captured in analyses using the traditional industry perspective on structural change and trade. This is important as the results indicate that export from the same industry may entail widely different activities in the exporting country as countries specialize in different tasks within.Footnote 26 All in all, the findings suggest that what you do in exports matters more than what you export.Footnote 27 This is an important lesson for policies that aim to stimulate structural change through trade direction.
This Element also presented evidence for path dependence in the development of task export specializations. In the cross section, countries with similar levels of economic development roughly exhibit comparable specializations patterns. For example, engineering specialization is a common characteristic of high-income economies, and specialization in production tasks is typically found for low- and medium-income countries. Yet, a more detailed look reveals particular specializations across countries at similar levels of development. This is influenced by variation in country-specific factors such as legal systems, infrastructure, human capital availability as well as country size and geography. These characteristics tend to change slowly over time and this is reflected in our finding of path-dependence, suggesting that a country’s existing strengths influence its future areas of specialization. This path dependency was found to be particularly strong for routine manual intensive tasks in the early phase of development, but this correlation weakens afterward.
Lastly, Section 6 showed that economic growth in a particular country is positively correlated with the introduction of so called radically new tasks, which is a task that defies path-dependence. The average marginal effect of path-defying tasks on growth was found to be positive across all development levels, though it is only statistically significant for a range of middle-income countries. Interestingly, the regression results further suggest that the capabilities required for undertaking new path-defying tasks extend beyond expansion of educational attainment and developing financial markets. Importantly, this should not be interpreted as causal evidence for a growth – path-defying task nexus. This requires deeper country-specific analysis. For example, the task-based analysis suggests that fast growth in China went hand-in-hand with development of expertise in new, unrelated areas. Yet, fast growth in Vietnam was characterized by more gradual task trade development. This difference underscores the potential of conducting country case studies to gain new insights into the dynamics of trade specialization and economic development. More generally, the results are suggestive of a variety of successful development paths, rather than a single unified path of structural transformation.
7.2 Future Research Directions and Policy Implications
All in all, we conclude that a task perspective on trade and structural change can be a useful complement to the more traditional product or industry perspective. Looking forward, we foresee a number of interesting lines of research, leveraging the new insights to reconsider current development debates.Footnote 28
One interesting avenue for further research is into the determinants of new export specializations. In theory, there are many drivers of trade, and why specific patterns emerge remains an empirical question. For example, in standard models of an open economy, high productivity growth can lead to the expansion of the fast-growing sector as the economy shifts toward an emerging comparative advantage. However, changes in preferences, trade costs, and market access can all influence the structure of the domestic economy and the share of manufacturing within it (Matsuyama Reference Matsuyama2009; Uy et al., Reference Uy, Yi and Zhang2013). Alessandria, Johnson, and Yi (Reference Alessandria, Johnson and Yi2021) argue that to advance our understanding of international trade and structural change, it would be beneficial to model shifts across a more detailed set of sectors and to account for international production sharing in global value chains.Footnote 29 We offer a number of empirical regularities that might inform future modelling work along these lines. Importantly, our findings are suggestive of strong complementarities between various export tasks but we stay agnostic about their precise nature. Co-occurrence of specialization in particular tasks might be driven by common developments in countries’ endowments such as the buildup of general human capital or improvement of the business environment. But it also points to the possibility of spillovers and complementarities between activities due to for example the need for specific job skills, shared infrastructure or need for specialized inputs and services, including information and communication technologies.Footnote 30 Factors of production are numerous and may be highly specific, with varying and unknown degrees of substitutability in carrying out various tasks. Relating task specializations to countries’ endowments might provide a fruitful start to a deeper understanding of the determinants of trade. In addition, account should be taken of the importance of external and global factors, such as shifts in global demand or the rise of competitors, relative to domestic factors in shaping trade patterns.Footnote 31 Recent work has also begun to emphasize the importance of domestic market integration, alongside international market integration, in particular for large countries. This opens up a more general set of issues relating to market integration and trade (see Donaldson Reference Donaldson2018).Footnote 32
Another area of research is on technological change, employment, and productivity growth. As discussed in Section 1, lack of export development is a long-standing concern for policymakers as it appears to be linked with slower structural change and productivity growth. Global value chains appear to offer an easy entry for developing countries into international trade (Baldwin, Reference Baldwin2016). Yet, it is an open question to what extent this raises job demand as well as productivity growth at the same time. It has been argued that opportunities for sustained employment growth have weakened due to the nature of technological change. Rodrik (Reference Rodrik2022) contends that modern manufacturing technologies offer fewer opportunities for employing unskilled labor. Producing for global markets now demands higher levels of precision and adherence to quality standards, which may require more automation and less manual work. Circumstantial evidence for a labor-saving bias in manufacturing technology is mounting. Reijnders, Timmer, and Ye (Reference Reijnders, Timmer and Ye2021) estimate a significant and strongly negative bias in the demand for low-skilled workers within a system of translog GVC cost equations. This bias moderates the potential of GVC participation to increase demand for low-educated workers in low-income countries. Indeed, Pahl and Timmer (Reference Pahl and Timmer2019) show that higher participation in global value chain (GVC) production is associated with higher productivity growth in a country, but not necessarily with employment growth. Using detailed firm-level data, Diao et al. (Reference Diao, Ellis, McMillan and Rodrik2021) specifically show that recent productivity growth in Ethiopia and Tanzania has been high in large and capital-intensive manufacturing firms. While these firms generated output growth, employment growth was weak. Instead, workers moved into small and unproductive firms in both manufacturing and services. More generally, Kruse et al. (Reference Kruse, Mensah, Sen and de Vries2023a) do observe increasing manufacturing employment shares in various sub-Saharan African countries since the 2000s, but in line with the micro-evidence, this appears characterized by growth of small unregistered manufacturing firms. A further characterization of GVC occupations in terms of routine and manual task content would be valuable in investigating the impact of automation and robotization on productivity and employment growth (as in Section 5.5). Among the many possible applications, this may provide insights into how frictions and distortions in the labor market generate possible mismatches between supply of workers and changing demand of tasks.
Another debate is on the potential benefits of participation in global value production. In theory, participation in global value chains might deliver a productivity shock that induces firms to carry out new tasks in the chain as well as to operate each task on a bigger scale. With complementarities between tasks this could lead to a virtuous cycle of additional task introductions and growing output and employment as found for China (Chor et al., Reference Chor, Manova and Yu2021; see also Fieler et al., Reference Fieler, Eslava and Xu2018). At the same time, barriers to diversification in global value chains (GVCs) have been highlighted that possibly trap poor countries in segments of production with little scope for upgrading to new activities (World Bank, 2019).Footnote 33 Gereffi (Reference Gereffi, Humphrey and Sturgeon2005) highlights cases of so-called captive GVCs in which the organization and governance of the value chain as well as the nature of technology may trap suppliers from developing countries in low productive tasks instead of favoring the processes of learning and innovation. A possible source of lock-in for GVC relationships is that participants often make relationship-specific investments, such as purchasing specialized equipment or customizing products (Antrás, Reference Antràs2020). Given this, should low-income governments capitalize on latent comparative advantage for example by targeting new tasks that are currently not in their in export basket but are dependent on similar existing production capabilities? Or do they need to stimulate export of unrelated tasks in order to avoid lock in? We scratched the surface of this trade-growth nexus in Section 6 but further investigation into new specializations and their impact on growth and structural change is warranted.
Another promising field of research is on the role of national and international institutions in global trade. Prior studies investigated the political economy of the world trading system (e.g., Hoekman and Kostecki, Reference Hoekman and Kostecki2009), effects of free trade agreements on the direction and magnitude of bilateral trade flows (see, e.g., Johnson and Noguera, Reference Johnson and Noguera2017; Baier et al., Reference Baier and Regmi2023), or more specifically the role of services trade regulation on manufacturing production and exports (e.g., Francois and Hoekman, Reference Francois and Hoekman2010; Beverelli et al., Reference Beverelli, Keck, Larch and Yotov2024). Many rules and regulations (such as tariffs) as well as transport costs are related to the monetary value and physical characteristics of the products that are traded and apply often to gross export values. Yet in the case of local content requirements or tariffs on foreign value added, a breakdown of exports into contribution of various countries is needed. Clearly, the task perspective provides a complementary view alongside the product perspective in this field of research.
To benefit from the complementarities between a task and product perspective the development of an integrated product and task data set is warranted. A promising avenue is in combining the existing highly granular datasets on product level exports and imports (at detailed HS level) with information on occupations of workers in exporting industries. Diodato et al. (Reference Diodato, Hausmann and Schetter2022) provide a first attempt using occupation data for the United States, assuming that production technologies for a particular product are the same around the world. Under this assumption, cross-country differences in the occupational composition of the exporting industry (as documented in this study) are simply due to a different set of products being exported. Yet we have provided evidence that suggests that production technologies are not constant around the world such that detailed products will not uniquely map into one set of activities. In addition, Caunedo et al. (Reference Caunedo, Keller and Shin2023) document cross-country differences in the task content of occupations, suggesting that a description of production technologies in terms of occupational structures is only a first step toward better understanding of task specializations. Linking product data with occupational information for more countries than the United States is needed. Recent AI-based methods offer promising solutions: Fetzer et al. (Reference Fetzer, Lambert, Feld and Garg2024) introduce a two-step approach where generative AI first maps potential product interlinkages, then filters out spurious connections to recover relevant input–output relationships. Similarly, Karbevska and Hidalgo (Reference Karbevska and Hidalgo2025) use machine learning and trade theory to infer product-level GVC structures from regional trade patterns, identifying upstream and downstream specializations. These innovations harbor a growing capacity to integrate product-level granularity into input–output data to improve trade in tasks measures in the near future.
Lastly, further data development on task specialization both in geographical coverage as well as socioeconomic dimensions is desirable. First, by extending the coverage of low-income countries, notably in sub-Saharan Africa, to delve deeper into task specialization in early stages of development.Footnote 34 Second, by including additional socioeconomic dimensions, for example, distinguishing the role of gender and age groups in accounting for changes in task specialization (as in Bandiera et al. Reference Bandiera, Elsayed, Heil and Smurra2022). This will pave the way for broader investigations into development and structural transformations that are multidimensional, in the vein of Kuznets (Reference Kuznets1973). These transformations include shifts from rural to urban areas, from home-based to market-based activities, from informal to formal sectors, and from self-employment to wage work, as recently surveyed by Gollin and Kaboski (Reference Gollin and Kaboski2023).
Appendix
A. Methodology
Let e be a vector of exports with dimensions G × 1, where G is the number of goods and services in the economy.Footnote 1 Define AD as the G × G domestic coefficient matrix, where each element ast indicates the amount of domestic product s used to produce one unit of product t (in nominal terms). Using this, we can derive a vector y (G × 1), representing the total gross output required in each industry to produce the exports, as follows:
(A.1)
where I is a G × G identity matrix with ones on the diagonal and zeros elsewhere. The matrix (I – AD)-1 is the well-known Leontief inverse matrix, which accounts for all output related to exports. This includes not only the output of the exporting industry but also the contributions of other domestic industries that provide intermediate inputs. The Leontief inverse summarizes all prior production steps and can be expressed as a geometric series: (I – AD)-1 = I + AD + AD2 + … + AD∞. This series assumes that the production technology, as represented by AD, remains consistent across all stages of production.Footnote 2
To clarify, note that this type of analysis doesn’t rely on or assume linearity in the production process, although it’s frequently demonstrated using straightforward examples involving a sequential chain leading to a final product. However, the methodology remains applicable in more intricate scenarios, encompassing any network of production characterized by interconnected stages linked through trade.
To determine the domestic value added in the production of exports, industry output must be pre-multiplied by V. The matrix V is a G × G matrix with diagonal elements, vgg, representing the value added to gross output ratios for industry g, and zeros elsewhere:
(A.2)
Here, the vector d (G × 1) represents the amount of domestic value added required for a country’s exports. Note that d includes the value added generated by exporting industries as well as other domestic industries that contribute through the provision of intermediate inputs. Summing across all industries yields the total domestic value added in a country’s exports, known as VAX-D (Los and Timmer, Reference Los and Timmer2018).
Timmer et al. (Reference Timmer, Miroudot and de Vries2019) expanded on this method to incorporate tasks in the composition of exports.Footnote 3 Consider a matrix B with dimensions O × G, where O represents the number of distinct occupations. Each element bog of this matrix signifies the income of workers with occupation o within industry g, expressed as a proportion of the labor income in g. In addition, define the matrix E as a G × G matrix with diagonal elements egg, representing the exports for industry g, and zeros elsewhere (put simply, the matrix E has e on the main diagonal). Then:
(A.3)
The matrix Z, with dimensions O × G, contains elements denoted as zog. Each element zog represents the value added by an occupation-industry pair in a country’s exports.Footnote 4 That is, each element zog represents an task j (see also the Box in Section 2), and in what follows zog = zj. Note that the calculations are country- and time-specific. Put otherwise, B, V, AD, and E in (A.3) vary across countries as well as over time. Hence, for each country and year we estimate a matrix Z with the typical element zjct, the value added of a traded task.
B. Data
Analyzing trade through the lens of tasks instead of products or industries presents data challenges. In this subsection, we discuss how these challenges are addressed by integrating two primary data sets: trade in value added and worker data.
As discussed in the previous subsection, we estimate the variable zjct, representing the value added by task type j of country c’s exports at time t. This variable is tracked by the labor income of workers engaged in task j within the production chains of country c’s exports. The first data set provides information on workers’ labor income categorized by occupational group and industry. The second data set contains data on value-added exports by industry, encompassing value added in both the exporting industry and other domestic industries contributing upstream in the production chain through input delivery. The zjct values are calculated for each country and year by merging these two data sets at the country-industry level.
A critical aspect of data construction is ensuring that occupations and industries are consistently defined and measured across countries and over time. This data is compiled for fifty-two economies, ranging from low-income per capita to high-income per capita.Footnote 5
Dataset on Worker Tasks
We take a pragmatic approach that is inspired by studies of offshoring behavior of multinationals and allows for quantification across a large set of countries with available data sources. Worker tasks are delineated based on their occupational group and the industry they are employed in. A total of 455 distinct tasks are identified across 13 occupational groups within each of 35 industries. This data is sourced from the Occupations Database (OD), initially introduced in Reijnders and de Vries (Reference Reijnders and de Vries2018), and expanded to include a selection of lower-income Asian countries by Gentile and de Vries (Reference Gentile and de Vries2024) and sub-Saharan countries by Kruse et al. (Reference Kruse, Timmer, de Vries and Ye2024).
The database includes the workforce count per occupation-industry pairing, alongside their corresponding labor earnings. National data for each country has been standardized through the alignment of national occupation classifications with an international framework of thirteen occupational groups, delineated by two-digit codes in the ISCO88 (International Standard Classification of Occupations).Footnote 6 Though some countries utilize ISCO in their administrative records, others adhere to their own classification systems, necessitating the development of bridge tables for consistent coding.
Additionally, national industry classifications have been mapped to a standardized set of 35 industries encompassing the total economy. These industries primarily adhere to 2-digit classifications in the ISIC (International Standard Industrial Classification) revision 3.1. These include agriculture, mining, construction, utilities, fourteen manufacturing industries, telecom, finance, business services, personal services, eight trade and transport services industries and three public services industries. These industries are chosen so that they coincide with those distinguished in the input-output tables.
Input-Output Data
Determining the exported tasks requires information on the value added of a country’s exports. The composition of value added in export industries is determined following the methodologies outlined in Hummels et al. (Reference Hummels, Ishii and Yi2001) and Koopman et al. (Reference Koopman, Wang and Wei2012). This extends beyond the value added solely within the exporting industry, encompassing value added throughout the production chain from other domestic industries supplying intermediates.
The approach relies on input-output tables, which contain data on inter-industry transactions. For this Element, the tables are drawn from the Multiregional Input–Output table (MRIO) Database of the Asian Development Bank, accessible for the year 2000 and annually from 2007 onward. The industry classifications utilized in these tables have been harmonized and aligned with a standardized set of thirty-five industries, mirroring those defined in the tasks dataset.
C. Additional Remarks on Trade in Tasks
Section 2.4 in this Element provides clarifying remarks concerning the definition and measurement of trade in tasks. This appendix provides additional remarks organized by remarks on the data and methodology.
Remarks on the Data
It is difficult to define a set of tasks that are interconnected, and determine the boundaries between tasks that are distinct. This is a complex issue both conceptually and empirically, particularly since these boundaries can evolve over time due to technological advancements, as noted by Baldwin (Reference Baldwin2016). A common distinction made is between production and non-production (supporting) tasks. While it might seem straightforward to associate value added from manufacturing industries with production tasks and value added from services industries with supporting tasks, the relationship is not one-to-one as discussed in Section 2.
Our dataset stands out from other large-scale databases on structural change, which typically focus on a single dimension, either industry (such as agriculture, manufacturing, services) or, more recently, occupational class. The Jobs of the World Project is a notable example of the latter, compiling a comprehensive dataset based on internationally harmonized labor force statistics. Bandiera et al. (Reference Bandiera, Elsayed, Heil and Smurra2022) use this data to illustrate how the occupational structure of economies varies across countries and over time.
National occupation classifications are mapped to a unified system consisting of thirteen different occupations. The main challenge in creating a common occupational classification for many countries is that national classifications are not always based on the same principles. For instance, the International Standard Classification of Occupations (ISCO) categorizes workers first by skill level and then by area of specialization. In contrast, classifications like those in China and Brazil focus more on the area of expertise and less on skill level. As a result, it is often difficult to distinguish between professionals and associate professionals with similar expertise, craft workers and machine operators, and workers in elementary occupations and more skilled workers in the same field. For example, the Brazilian classification does not differentiate between informal salesmen and store salespersons. These constraints have influenced our choice of thirteen occupations, allowing us to include as much detail as possible while minimizing classification errors. Our classification aligns most closely with ISCO 88 at the two-digit (and occasionally three-digit) codes. For example, the occupation “Managers” corresponds to ISCO 88 codes 12 and 13, and “Clerical workers” to codes 41 and 42. Where possible, we have used crosswalks from national classifications to ISCO 88, as provided by statistical offices, to guide our mapping.
Although it does not receive much attention in this Element, the value added from downstream tasks includes the distributive trade sector (retailing and wholesaling) and is commonly referred to as a “margin.” This margin represents the value of goods sold minus their acquisition cost (Ahmad, Reference Ahmad2019). To quantify the value added in the downstream task, Buckley et al. (Reference Buckley, Strange, Timmer and de Vries2022) utilize the margin-to-sales ratio for each final manufacturing good. They calculate the domestic margin by subtracting the price received by the producer from the price paid by the consumer, under the assumption that most products finalized in a country are consumed domestically.
Another caveat is that the study of Koopman et al. (Reference Koopman, Wang and Wei2012) led to a general recognition of the importance to account for heterogeneity in import use across different types of firms, in particular those located in export processing zones that typically use more imported inputs. Using detailed data on imports and exports of Mexican firms, de Gortari (Reference Gortari2017) finds that import intensities of output can also vary across destination markets. A comprehensive analysis and ways forward are provided in the OECD’s handbook on extended supply and use tables and extended input-output tables (OECD forthcoming).
This Element analyzed the specialization of countries in trade based on the task incomes derived from their exports. With appropriate data, similar analyses could be extended to subnational regions, providing a more detailed understanding of economic specialization within countries. However, large-scale cross-country analysis remains challenging due to the limited availability of regional input-output tables and matching occupation statistics that are cross-classified by industry and region. To advance this field, there is a need for comprehensive data development efforts. This includes the creation of detailed regional input-output tables and the collection of occupation statistics that can be accurately cross-referenced with industry and regional data as in Hernández-Rodriguez et al. (Reference Hernández-Rodríguez, Boschma, Morrison and Ye2025). Such advancements would enable more granular analyses, shedding light on the economic dynamics at regional levels and facilitating better-informed policy decisions. As data availability improves, we can expect to gain deeper insights into the structural changes and specialization patterns within and across countries.
Can we expect task specialization measures to become a standard tool for economists in the near future? Ongoing efforts within the international statistical community aim to enhance the data sources underlying trade-in-value-added statistics and to institutionalize their production in regular statistical programs. In the short term, this involves integrating existing firm-level production data with firm characteristics such as size, ownership, and export status. In the longer term, it would require the development of common business registers across countries, improved data reconciliation, and new data collections on value chains beyond counterparty transactions (Landefeld, Reference Landefeld2015). A promising development in this area is the creation of firm-level surveys that track the offshoring of business tasks in Europe (Nielsen, Reference Nielsen2018). These initiatives are steps in the right direction, but it is important to note that this field is still in its early stages. Overall, we believe that combining insights from standard product-level trade statistics with those from composite measures of value added and task specialization in trade, as presented in this Element, can meaningfully enhance our understanding of trade, structural change and economic development.
Remarks on the Methodology
Our approach to measuring the task content of exports closely aligns with the method introduced by Hummels et al. (Reference Hummels, Ishii and Yi2001), which tracks the import content of exports. Koopman et al. (Reference Koopman, Wang and Wei2012) further refined this by defining domestic value added in exports, demonstrating that it equals gross exports minus the import content of exports. We adopt the value-added terminology for its clearer connection to other trade measures (Johnson, Reference Johnson2018; Los and Timmer, Reference Los and Timmer2018).
Production processes can be fragmented in various ways, often described as “snakes” and “spiders” (Baldwin and Venables, Reference Baldwin and Venables2013). “Snakes” represent a sequential process where intermediate goods move from country A to B, then from B to C, and so on, until the final product is completed. In contrast, “spiders” involve multiple parts converging from different locations to a single site for assembly into a new component or final product. Most production processes are complex hybrids of these two models. For simplicity, we refer to all fragmented production processes as “chains,” despite the term’s snake-like implication. The input-output approach adopted in this Element encompasses both snakes and spiders.
Despite our use of multiregional input-output tables, various measure of domestic value-added exports used in this Element require only national input-output tables (Los et al., Reference Los, Timmer and de Vries2016). In contrast, to analyze the composition of global value chains and to understand forward linkages, such as export destinations, the international input-output linkages are necessary. Johnson and Noguera (Reference Johnson and Noguera2012) introduced the concept of “value-added exports,” which refers to the value added in a country that is consumed abroad. This measure aligns with international trade models expressed in value-added terms (Johnson, Reference Johnson2014) and requires international input-output tables to track the origin and destination of trade flows. While this measure is similar to “domestic value added in exports” when analyzing a country’s overall exports, it differs for bilateral trade flows. For a detailed discussion, see Los and Timmer (Reference Los and Timmer2018).
Following Baldwin and Robert-Nicoud (Reference Baldwin and Robert-Nicoud2014), we assume throughout this Element that tasks within a production process are perfect complements. This means that producing a final product requires a fixed amount of each task, and it is not possible to compensate for a shortage in one task by increasing another. For instance, a car needs exactly four wheels to function; it cannot operate with three wheels and an extra hood.
The methodology we adopt in this Element is essentially an ex post accounting framework rather than a fully specified economic model. It traces the value added of tasks without explicitly modeling the interaction of prices and quantities, which are central to a comprehensive Computable General Equilibrium (CGE) model (see Levchenko and Zhang, Reference Levchenko and Zhang2012). While CGE models offer richer behavioral relationship modeling, they also require econometric estimation of various key parameters of production and demand functions.
Since our goal is not to disentangle price and quantity effects, we rely on a reduced form model where only input cost shares are known. We use annual input-output (IO) tables, allowing cost shares in production to change over time. This approach does not depend on fixed cost shares as in Leontief or Cobb-Douglas production functions. Instead, the changing shares align with a translog production function, which provides a second-order approximation to any functional form. In these production models, shifting cost shares summarize the combined effects of changes in relative input prices, cross-elasticities, and input-biased technical change (Christensen et al., Reference Christensen, Jorgenson and Lau1971). This feature makes the model particularly suitable for our ex post analysis.
D. Defining Path Defiance
For a particular country, the cumulative distribution function (CDF) of proximity for new task specializations is compared with a hypothetical random CDF of proximity for all possible new specializations (i.e., the set TSt’). Subsequently, stochastic dominance of the former over the latter distribution is tested to determine whether a country is path-defying.
To derive the distributions, we define
 as the set of tasks in which the country is initially specialized, more formally:
(D.1)
with M the total number of all tasks.Footnote 7 The so-called option set O is the complement of set I. It includes all tasks in which a country does not have a specialization yet, but might develop one:Footnote 8
(D.2)
Next, define new entries Nct as tasks in which a country actually acquires a new comparative advantage during [t, t + 1] :
(D.3)
such that Nct is a subset of Oct.
For each entry (n
 Nct), we define the set D containing the proximity of n with all tasks belonging to the initial specialization as
 with
with
 as defined in equation (5) and
 the number of elements in set
 . The highest proximity of the entry n with any task in the initial specialization is
 .
.
A key variable of interest is the share of so-called path-defying entries. We classify for each country-year the entry as path-defying if the proximity to the initial export basket is lower than the mean proximity of the tasks in the option set,
 . The share of path-defying entries in the set of entries (PDShare) during [t, t+1] is thus given by:
In addition, we can define a time-country specific empirical CDF of proximity for entries as:
(D.5)
The hypothetical distribution of proximity is based on all tasks that belong to the country’s option set (Oct) rather than only the actual entries:
(D.6)
When the CDF of proximity of the actual entries, FN(d), is equal or larger than the hypothetical CDF, FO(d), for all d ∈ [0,1] a country is denoted as path-defying. The null hypothesis of path defiance is tested in two-sample one-sided Kolmogorov–Smirnov tests for first order stochastic dominance of the distribution of (D.5) over the distribution of (D.6). The intuition of this test is based on the insight that at any point in time a country has a large number of tasks in its option set for which it has not (yet) developed a comparative advantage. These potential new entries differ in proximity to the initial specialization basket. Path defiance is rejected when new specializations are significantly more concentrated at higher levels of proximity.
E. Appendix Tables and Figures
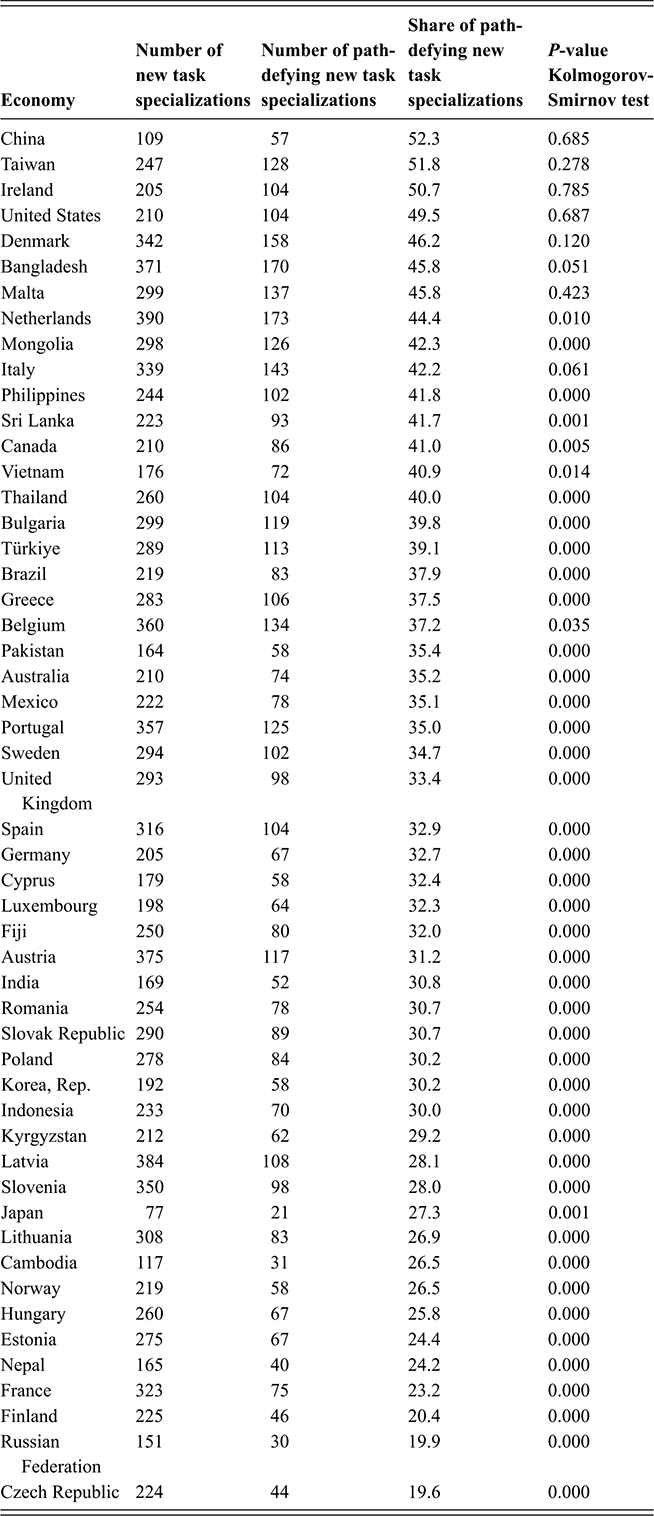
Appendix Table E.1 Long description
The table has 5 columns: Economy, Number of new task specializations, Number of path-defying new task specializations, Share of path-defying new task specializations, and P-value Kolmogorov-Smirnov test. It reads as follows. China: 109; 57; 52.3; 0.685. Taiwan: 247; 128; 51.8; 0.278. Ireland: 205; 104; 50.7; 0.785. United States: 210. 104. 49.5. 0.687. Denmark: 342. 158. 46.2. 0.120. Bangladesh: 371; 170; 45.8; 0.051. Malta: 299; 137; 45.8; 0.423. Netherlands: 390; 173; 44.4; 0.010. Mongolia: 298; 126; 42.3; 0.000. Italy: 339; 143; 42.2; 0.061. Philippines: 244; 102; 41.8; 0.000. Sri Lanka: 223; 93; 41.7; 0.001. Canada: 210; 86; 41.0; 0.005. Vietnam: 176; 72; 40.9; 0.014. Thailand: 260; 104; 40.0; 0.000. Bulgaria: 299; 119; 39.8; 0.000. Türkiye: 289; 113; 39.1; 0.000. Brazil: 219; 83; 37.9; 0.000. Greece: 283; 106; 37.5; 0.000. Belgium: 360; 134; 37.2; 0.035. Pakistan: 164; 58; 35.4; 0.000. Australia: 210; 74; 35.2; 0.000. Mexico: 222; 78; 35.1; 0.000. Portugal: 357; 125; 35.0; 0.000. Sweden: 294; 102; 34.7; 0.000. United Kingdom: 293; 98; 33.4; 0.000. Spain: 316; 104; 32.9; 0.000. Germany: 205; 67; 32.7; 0.000. Cyprus: 179; 58; 32.4; 0.000. Luxembourg; 198; 64; 32.3; 0.000. Fiji: 250; 80; 32.0; 0.000. Austria: 375. 117. 31.2. 0.000. India: 169; 52; 30.8; 0.000. Romania: 254; 78; 30.7; 0.000. Slovak Republic: 290; 89; 30.7; 0.000. Poland: 278; 84; 30.2; 0.000. Korea, Rep.: 192; 58; 30.2; 0.000. Indonesia: 233; 70; 30.0; 0.000. Kyrgyzstan: 212; 62; 29.2; 0.000. Latvia: 384; 108; 28.1; 0.000. Slovenia: 350; 98; 28.0; 0.000. Japan: 77; 21; 27.3; 0.001. Lithuania: 308; 83; 26.9; 0.000. Cambodia: 117; 31; 26.5; 0.000. Norway: 219; 58; 26.5; 0.000. Hungary: 260; 67; 25.8; 0.000. Estonia: 275; 67; 24.4; 0.000. Nepal: 165; 40; 24.2; 0.000. France: 323; 75; 23.2; 0.000. Finland: 225; 46; 20.4; 0.000. Russian Federation: 151; 30; 19.9; 0.000. Czech Republic: 224; 44; 19.6; 0.000.
Notes below the table read: First column shows the total number of new specializations across the eight overlapping periods in the data. Second column shows the total number of path defying new specialization across the periods, where we use the baseline definition for path-defying as those that have a proximity to the initial export basket which is lower than the mean proximity of the tasks in the option set. Third column is second column divided by first. Fourth column shows the p-value from a two-sample one-sided Kolmogorov-Smirnov test whether the cumulative distribution of the option set proximities stochastically dominates that of the actual data. Sorting by share of path-defying new task specializations from high to low. Reproduced from Kruse et al. (2023b), licensed under C C B Y 3.0 I G O.
Notes: First column shows the total number of new specializations across the eight overlapping periods in the data. Second column shows the total number of path-defying new specialization across the periods, where we use the baseline definition for path-defying as those that have a proximity to the initial export basket which is lower than the mean proximity of the tasks in the option set. Third column is second column divided by first. Fourth column shows the P-value from a two-sample one-sided Kolmogorov-Smirnov test whether the cumulative distribution of the option set proximities stochastically dominates that of the actual data. Sorting by share of path-defying new task specializations from high to low.
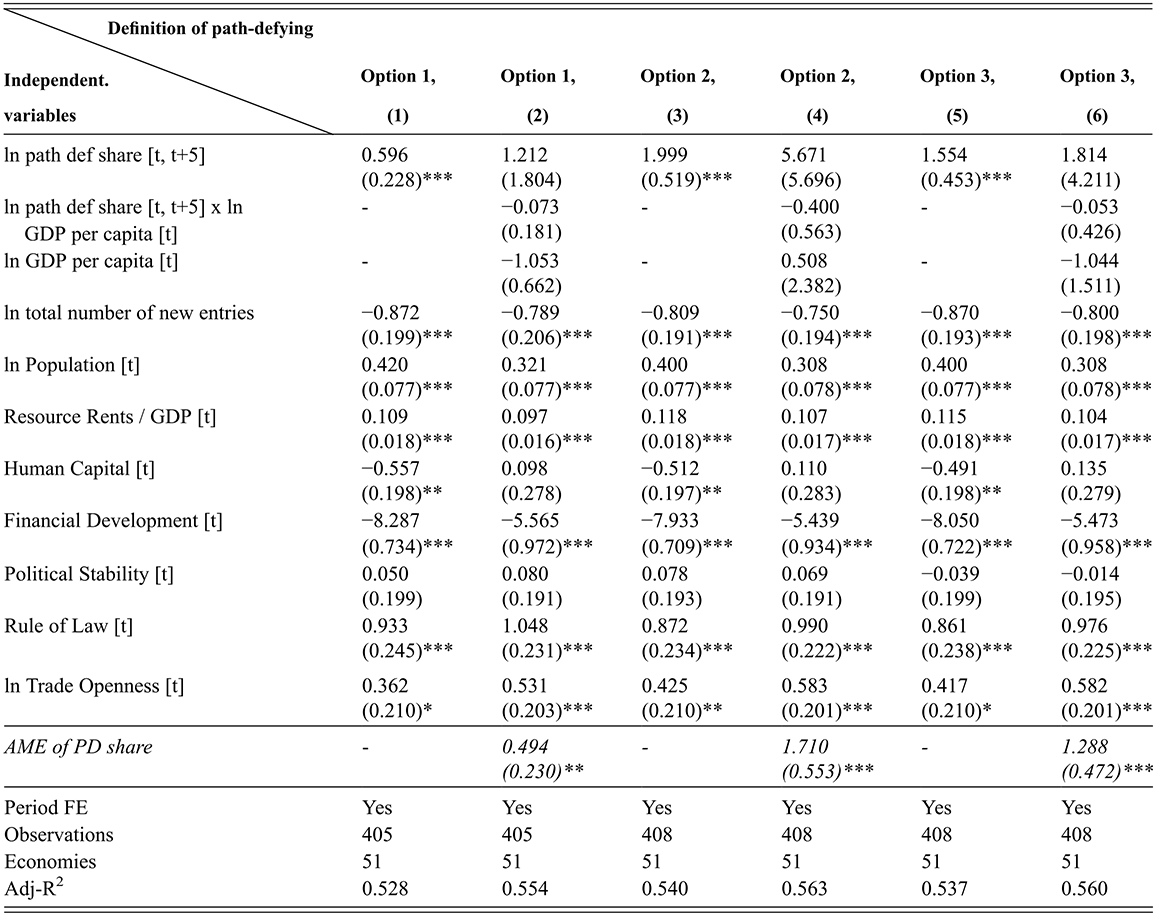
Appendix Table E.2 Long description
The table has 7 columns: Independent variables, and 6 definitions of path defying: Option 1 (1), Option 1 (2), Option 2 (3), Option 2 (4), Option 3 (5), and Option 3 (6). It reads as follows. ln path def share: [t, t plus 5]: 0.596 (0.228) three asterisks; 1.212 (1.804); 1.999 (0.519) three asterisks; 5.671 (5.696); 1.554 (0.453) three asterisks; 1.814 (4.211). ln path def share [t, t plus 5] times l n G D P per capita [t]: blank; minus 0.073 (0.181); blank; minus 0.400 (0.563); blank; minus 0.053 (0.426). l n G D P per capita [t]: blank; minus 1.053 (0.662); blank; 0.508 (2.382); blank; minus 1.044 (1.511). l n total number of new entries: minus 0.872 (0.199) three asterisks; minus 0.789 (0.206) three asterisks; minus 0.809 (0.191) three asterisks; minus 0.750 (0.194) three asterisks; minus 0.870 (0.193) three asterisks; minus 0.800 (0.198) three asterisks. l n Population [t]: 0.420 (0.077) three asterisks; 0.321 (0.077) three asterisks; 0.400 (0.077) three asterisks; 0.308 (0.078) three asterisks; 0.400 (0.077) three asterisks; 0.308 (0.078) three asterisks. Resource Rents or G D P [t]: 0.109 (0.018) three asterisks; 0.097 (0.016) three asterisks; 0.118 (0.018) three asterisks; 0.107 (0.017) three asterisks; 0.115 (0.018) three asterisks; 0.104 (0.017) three asterisks. Human Capital [t]: minus 0.557 (0.198) two asterisks; 0.098 (0.278); minus 0.512 (0.197) two asterisks; 0.110 (0.283); minus 0.491 (0.198) two asterisks; 0.135 (0.279). Financial Development [t]: minus 8.287 (0.734) three asterisks; minus 5.565 (0.972) three asterisks; minus 7.933 (0.709) three asterisks; minus 5.439 (0.934) three asterisks; minus 8.050 (0.722) three asterisks; minus 5.473 (0.958) three asterisks. Political Stability [t]: 0.050 (0.199); 0.080 (0.191); 0.078 (0.193); 0.069 (0.191); minus 0.039 (0.199); minus 0.014 (0.195). Rule of Law [t]: 0.933 (0.245) three asterisks; 1.048 (0.231) three asterisks; 0.872 (0.234) three asterisks; 0.990 (0.222) three asterisks; 0.861 (0.238) three asterisks; 0.976 (0.225) three asterisks. ln Trade Openness [t]: 0.362 (0.210) asterisk; 0.531 (0.203) three asterisks; 0.425 (0.210) two asterisks; 0.583 (0.201) three asterisks; 0.417 (0.210) asterisk; 0.582 (0.201) three asterisks. A M E of P D share: blank; 0.494 (0.230) two asterisks; blank; 1.710 (0.553) three asterisks; blank; 1.288 (0.472) three asterisks. Period F E: Yes; Yes; Yes; Yes; Yes; Yes. Observations: 405; 405; 408; 408; 408; 408. Economies: 51; 51; 51; 51; 51; 51. Adjusted R-squared: 0.528; 0.554; 0.540; 0.563; 0.537; 0.560.
Notes: Regressions on GDP per capita growth rate across the eight overlapping periods using period fixed effects. Dep variable: average GDP per capita growth rate [t, t+5]. Path-defying entries in columns (1) and (2) are defined as entries with a lower proximity to a country’s initial export basket than the average proximity in its option set (option 1). Path-defying entries in columns (3) and (4) have proximity lower than the average proximity value plus one standard deviation (option 2) and in columns (5) and (6) the average percentile of the random hypothetical distribution of proximity (derived from the option set) is used (option 3). AME of PD share is the average marginal effect of PD share on GDP per capita growth. Taiwan is not included in the analysis due to missing observations for several control variables. Robust standard errors are reported in parentheses.
* p<0.10,
** p<0.05,
*** p<0.01. Reproduced from Kruse et al. (Reference Kruse, Timmer, de Vries and Ye2023b), licensed under CC BY 3.0 IGO.
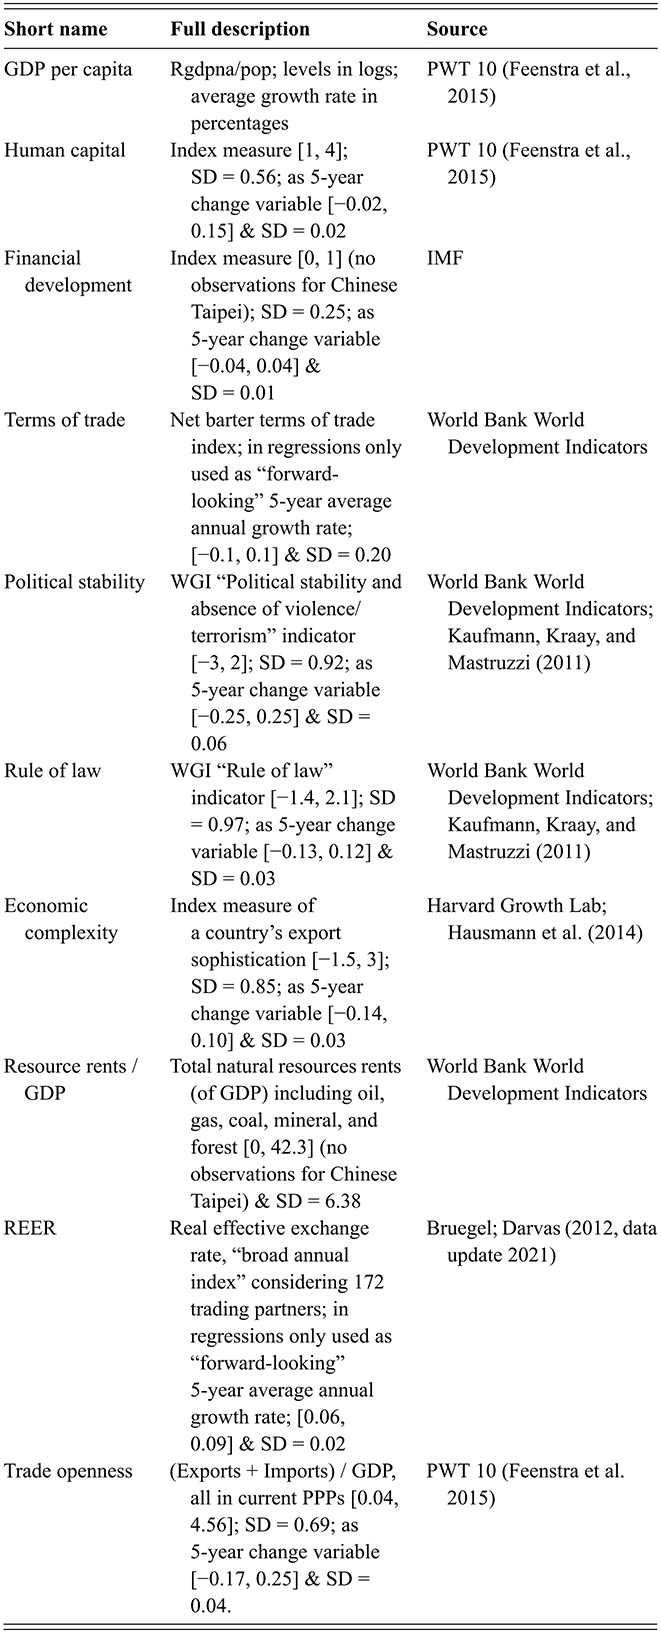
Appendix Table E.3 Long description
The table has 3 columns: Short name, Full description, and Source. It reads as follows. G D P per capita: R g d p n a divided by pop; levels in logs; average growth rate in percentages; P W T 10 (Feenstra et al. 2015). Human capital: Index measure [1, 4]; S D equals 0.56; as 5-year change variable [minus 0.02, 0.15] and SD equals 0.02; P W T 10 (Feenstra et al. 2015). Financial development: Index measure [0, 1] (no observations for Chinese Taipei); S D equals 0.25; as 5-year change variable [minus 0.04, 0.04] and S D equals 0.01; I M F. Terms of trade: Net barter terms of trade index; in regressions only used as forward-looking five-year average annual growth rate; [minus 0.1, 0.1] and S D equals 0.20; World Bank World Development Indicators. Political stability: W G I Political stability and absence of violence or terrorism indicator [minus 3, 2]; S D equals 0.92; as 5-year change variable [minus 0.25, 0.25] and S D equals 0.06; World Bank World Development Indicators; Kaufmann, Kraay, and Mastruzzi (2011). Rule of law: W G I Rule of law indicator [minus 1.4, 2.1]; S D equals 0.97; as 5-year change variable [minus 0.13, 0.12] and S D equals 0.03; World Bank World Development Indicators; Kaufmann, Kraay, and Mastruzzi (2011). Economic complexity: Index measure of a country’s export sophistication [minus 1.5, 3]; S D equals 0.85; as 5-year change variable [minus 0.14, 0.10] and S D equals 0.03; Harvard Growth Lab; Hausmann et al. (2014). Resource rents or G D P: Total natural resources rents (of G D P) including oil, gas, coal, mineral, and forest [0, 42.3] (no observations for Chinese Taipei) and S D equals 6.38; World Bank World Development Indicators. R E E R: Real effective exchange rate, broad annual index considering 172 trading partners; in regressions only used as forward-looking five year average annual growth rate; [0.06, 0.09] and S D equals 0.02; Bruegel; Darvas (2012, data update 2021). Trade openness: (Exports plus Imports) divided by G D P, all in current P P Ps [0.04, 4.56]; S D equals 0.69; as 5-year change variable [minus 0.17, 0.25] and S D equals 0.04; P W T 10 (Feenstra et al. 2015)
Acknowledgments
This Element synthesizes a decade of our research on who is doing what and where in global value chains. It unifies and updates previously published research and is deeply rooted in joint work, discussions, and critical feedback we have received along the way. We are indebted to our collaborators, including Donald Bertulfo, Peter Buckley, Wen Chen, Quanrun Chen, Erik Dietzenbacher, Abdul Erumban, Robert Feenstra, Yuning Gao, Neil Foster-McGregor, Elisabetta Gentile, Reitze Gouma, Calumn Hamilton, Robert Inklaar, Aobo Jiang, Hagen Kruse, Oscar Lemmers, Bart Los, Emmanuel Mensah, Sébastien Miroudot, Stefan Pahl, Jiansuo Pei, Laurie Reijnders, Kunal Sen, Robert Stehrer, Roger Strange, Klaas de Vries, Konstantin Wacker, Shang-Jin Wei, Deborah Winkler, Kei-Mu Yi, Xianjia Ye, Yabo Vidogbena, and Jop Woltjer. We also thank the institutions and research networks that provided financial and nonfinancial support, as well as the many colleagues, seminar participants and peer reviewers for challenging our thinking. This Element is an attempt to distill and disseminate a large body of research in a way that aims to be accessible without sacrificing rigor. Any remaining errors or omissions are, of course, our own.
Series Editor-in-Chief
Kunal Sen
UNU-WIDER and University of Manchester
Kunal Sen, UNU-WIDER Director, is Editor-in-Chief of the Cambridge Elements in Development Economics series. Professor Sen has over three decades of experience in academic and applied development economics research, and has carried out extensive work on international finance, the political economy of inclusive growth, the dynamics of poverty, social exclusion, female labor force participation, and the informal sector in developing economies. His research has focused on India, East Asia, and sub-Saharan Africa.
In addition to his work as Professor of Development Economics at the University of Manchester, Kunal has been the Joint Research Director of the Effective States and Inclusive Development (ESID) Research Centre, and a Research Fellow at the Institute for Labor Economics (IZA). He has also served in advisory roles with national governments and bilateral and multilateral development agencies, including the UK’s Department for International Development, Asian Development Bank, and the International Development Research Centre.
Thematic Editors
Tony Addison
University of Copenhagen and UNU-WIDER
Tony Addison is Professor of Economics in the University of Copenhagen’s Development Economics Research Group. He is also a Non-Resident Senior Research Fellow at UNU-WIDER, Helsinki, where he was previously the Chief Economist-Deputy Director. In addition, he is Professor of Development Studies at the University of Manchester. His research interests focus on the extractive industries, energy transition, and macroeconomic policy for development.
Chris Barrett
SC Johnson College of Business, Cornell University
Chris Barrett is an agricultural and development economist at Cornell University. He is the Stephen B. and Janice G. Ashley Professor of Applied Economics and Management; and International Professor of Agriculture at the Charles H. Dyson School of Applied Economics and Management. He is also an elected Fellow of the American Association for the Advancement of Science, the Agricultural and Applied Economics Association, and the African Association of Agricultural Economists.
Carlos Gradín
University of Vigo
Carlos Gradín is Professor of applied economics at the University of Vigo. His main research interest is the study of inequalities, with special attention to those that exist between population groups (e.g., by race or sex). His publications have contributed to improving the empirical evidence in developing and developed countries, as well as globally, and to improving the available data and methods used.
Rachel M. Gisselquist
UNU-WIDER
Rachel M. Gisselquist is Senior Research Fellow and member of the Senior Management Team of UNU-WIDER. She specializes in the comparative politics of developing countries, with particular attention to issues of inequality, ethnic and identity politics, foreign aid and state building, democracy and governance, and sub-Saharan African politics. Dr. Gisselquist has edited a dozen collections in these areas, and her articles are published in a range of leading journals.
Shareen Joshi
Georgetown University
Shareen Joshi is Associate Professor of International Development at Georgetown University’s School of Foreign Service in the United States. Her research focuses on issues of inequality, human capital investment, and grassroots collective action in South Asia. Her work has been published in the fields of development economics, population studies, environmental studies, and gender studies.
Patricia Justino
UNU-WIDER and IDS – UK
Patricia Justino is Senior Research Fellow at UNU-WIDER and Professorial Fellow at the Institute of Development Studies (IDS) (on leave). Her research focuses on the relationship between political violence, governance, and development outcomes. She has published widely in the fields of development economics and political economy and is the co-founder and co-director of the Households in Conflict Network (HiCN).
Marinella Leone
University of Pavia
Marinella Leone is Assistant Professor at the Department of Economics and Management, University of Pavia, Italy. She is an applied development economist. Her more recent research focuses on the study of early child development parenting programs, on education, and gender-based violence. In previous research she investigated the short-, long-term and intergenerational impact of conflicts on health, education, and domestic violence. She has published in top journals in economics and development economics.
Jukka Pirttilä
University of Helsinki and UNU-WIDER
Jukka Pirttilä is Professor of Public Economics at the University of Helsinki and VATT Institute for Economic Research. He is also a Non-Resident Senior Research Fellow at UNU-WIDER. His research focuses on tax policy, especially for developing countries. He is a co-principal investigator at the Finnish Centre of Excellence in Tax Systems Research.
Andy Sumner
King’s College London and UNU-WIDER
Andy Sumner is Professor of International Development at King’s College London; a Non-Resident Senior Fellow at UNU-WIDER and a Fellow of the Academy of Social Sciences. He has published extensively in the areas of poverty, inequality, and economic development.
About the Series
Cambridge Elements in Development Economics is led by UNU-WIDER in partnership with Cambridge University Press. The series publishes authoritative studies on important topics in the field covering both micro and macro aspects of development economics.
United Nations University World Institute for Development Economics Research
United Nations University World Institute for Development Economics Research (UNU-WIDER) provides economic analysis and policy advice aiming to promote sustainable and equitable development for all. The institute began operations in 1985 in Helsinki, Finland, as the first research centre of the United Nations University. Today, it is one of the world’s leading development economics think tanks, working closely with a vast network of academic researchers and policy makers, mostly based in the Global South.


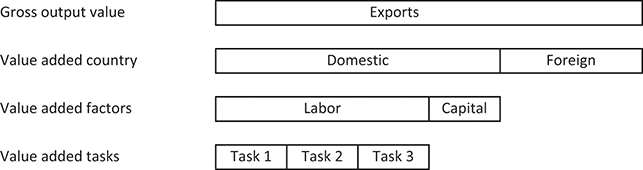
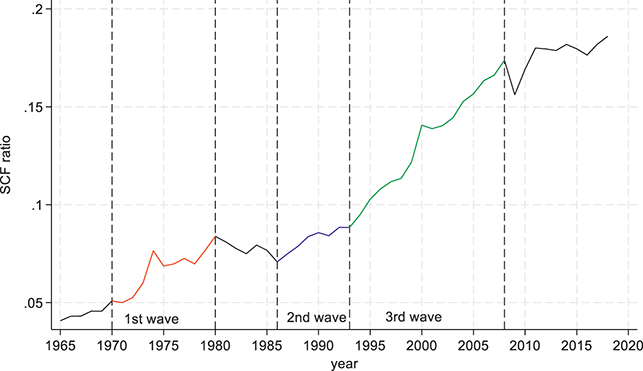
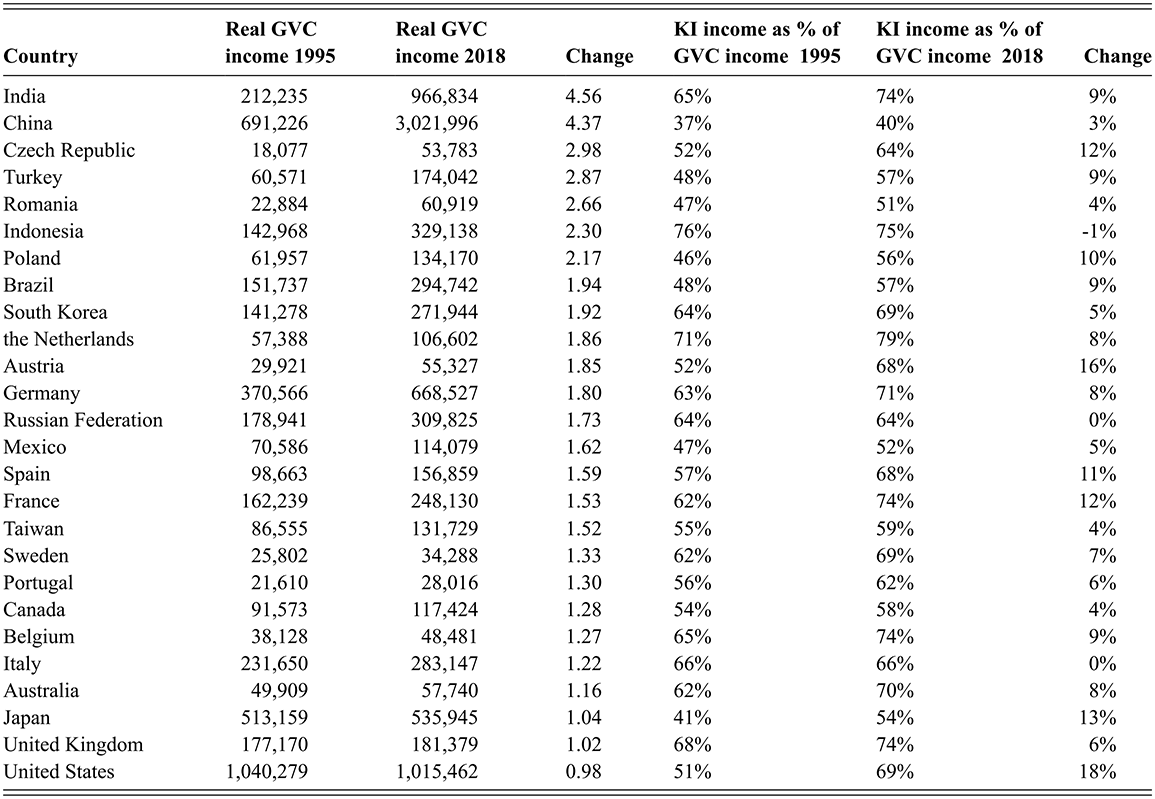
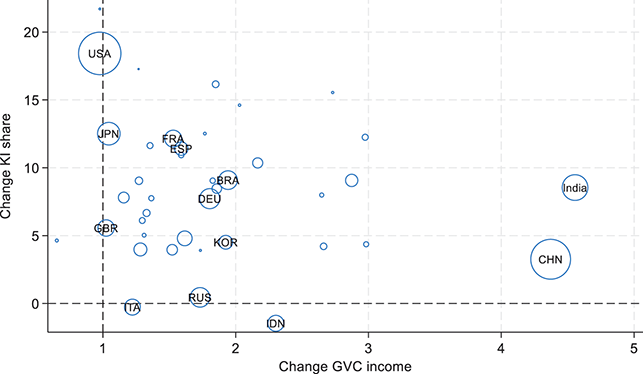
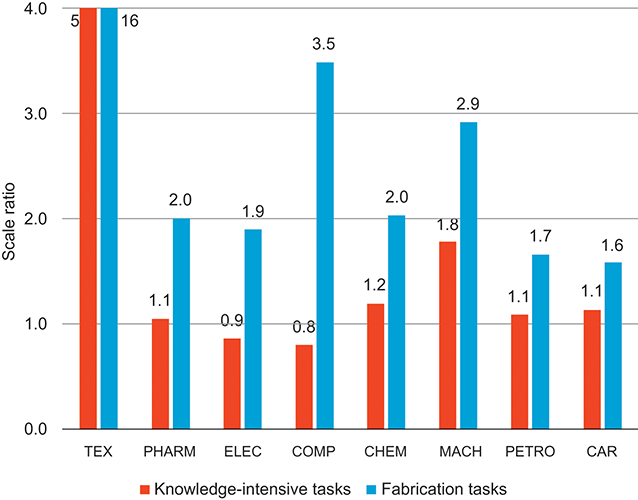
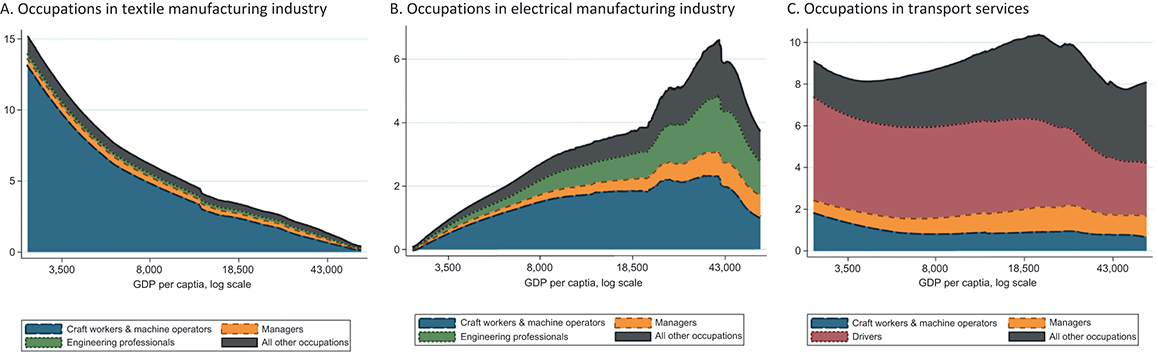
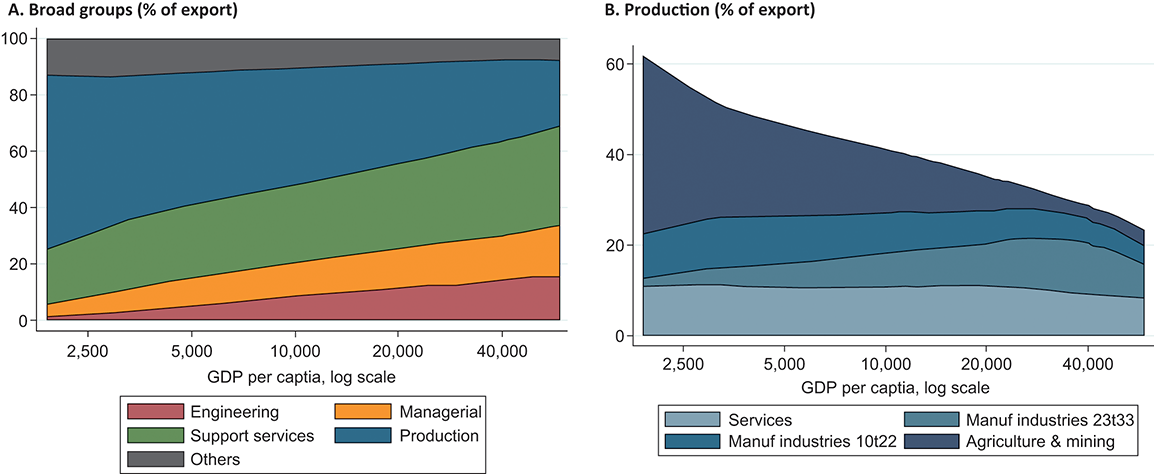
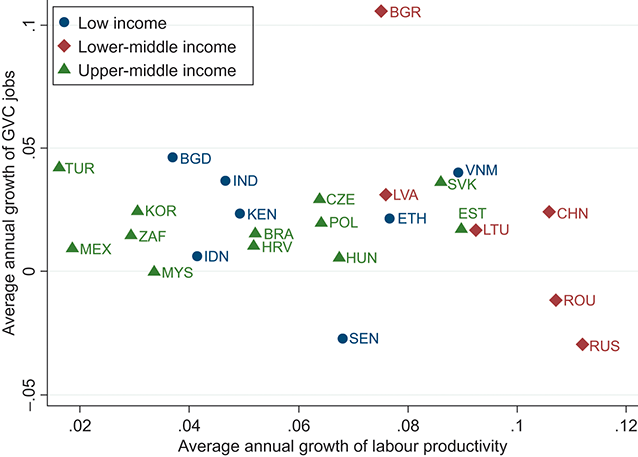
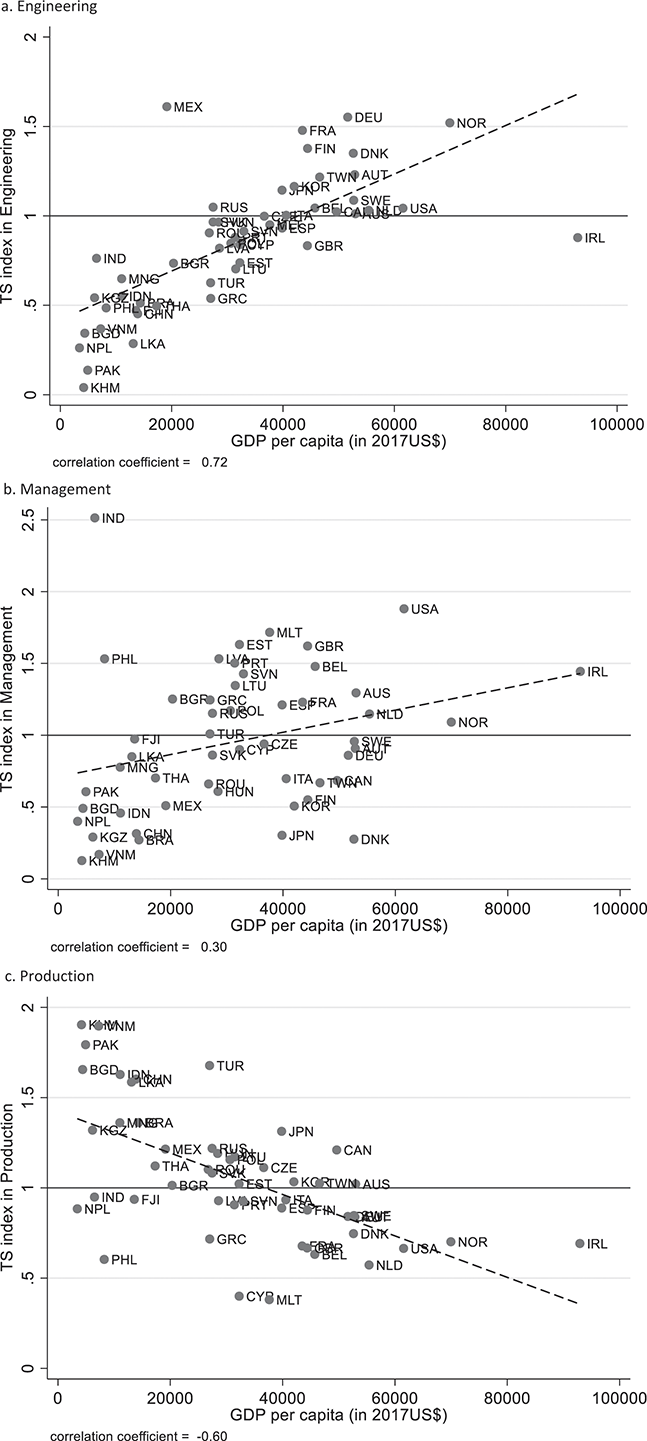
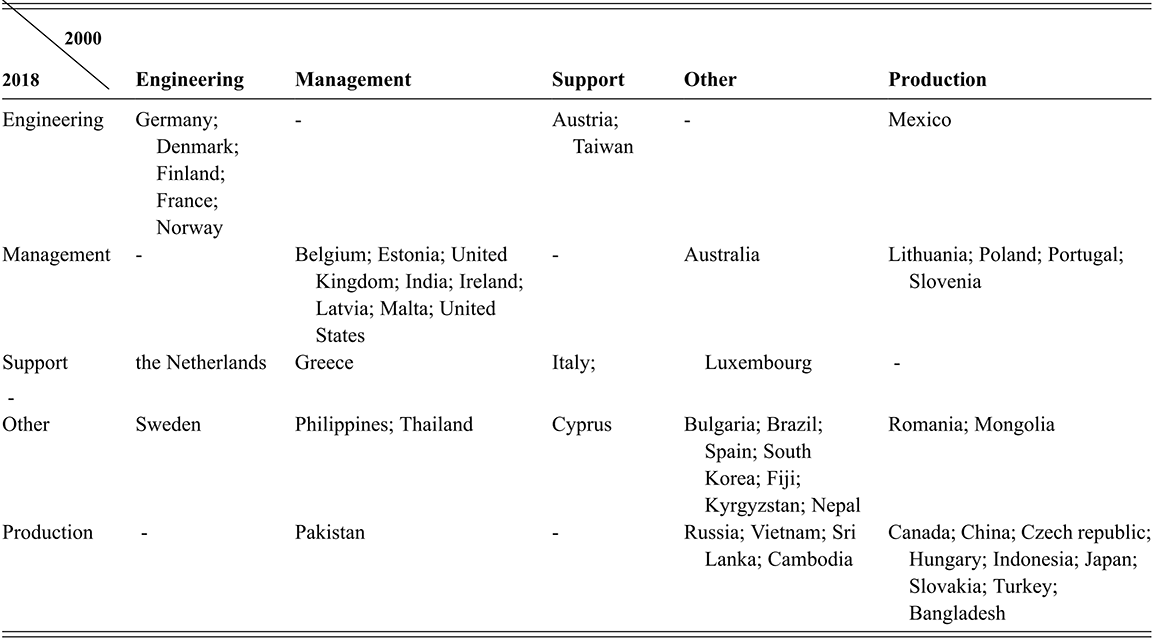
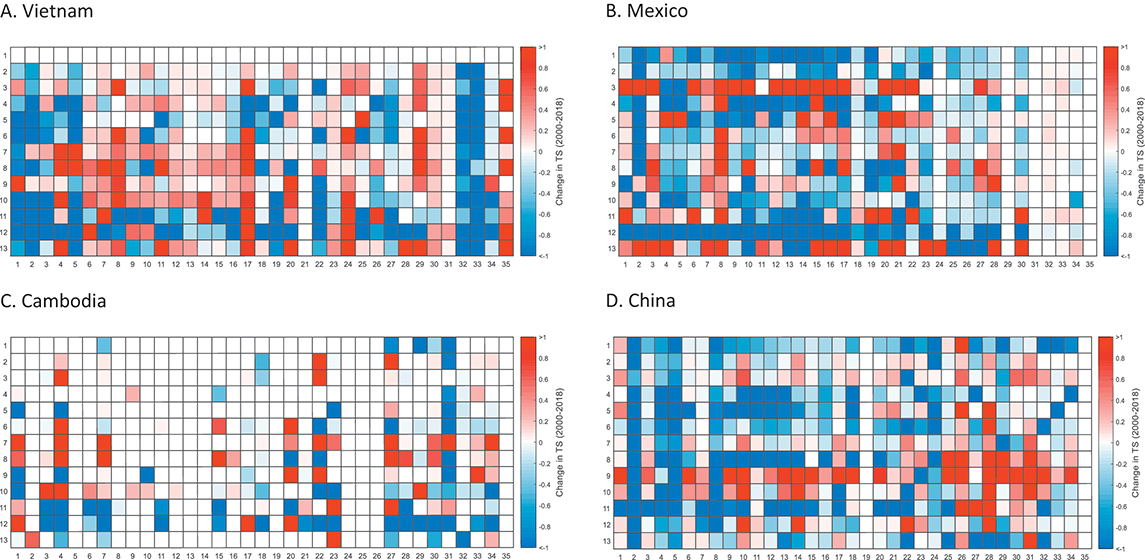
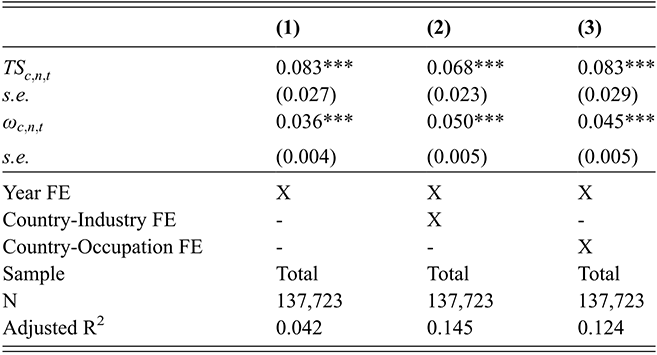
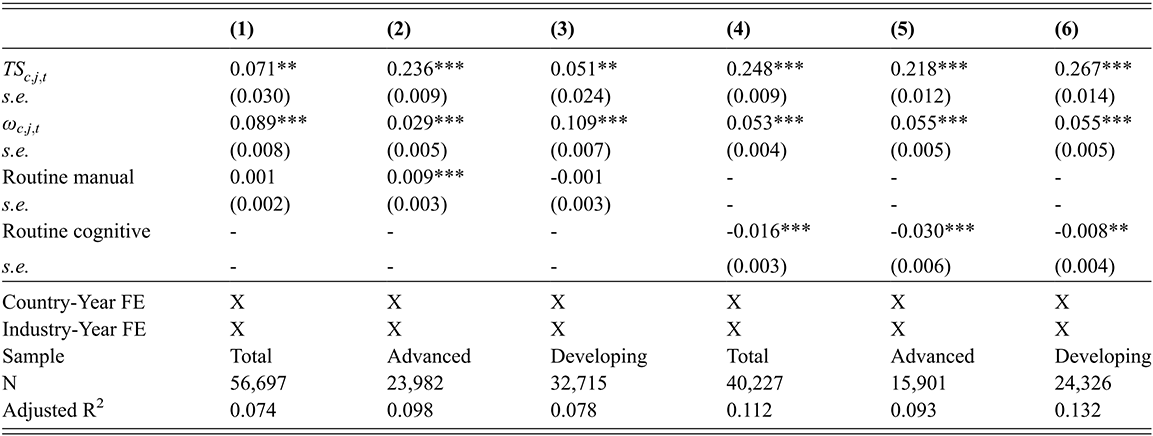
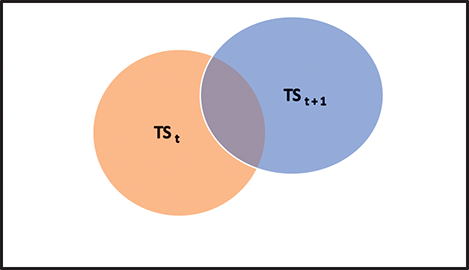
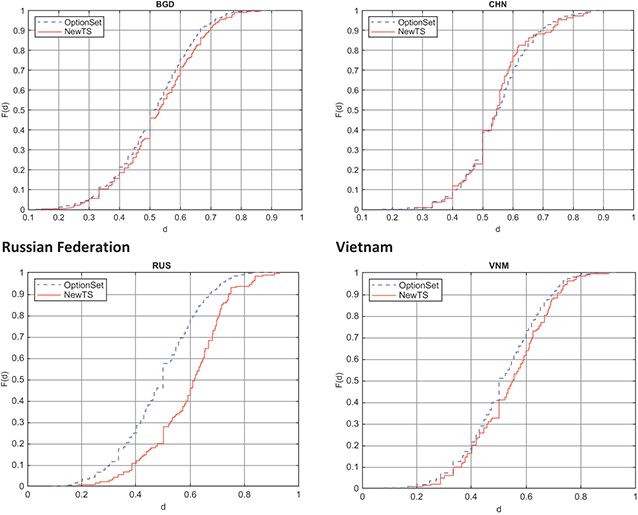
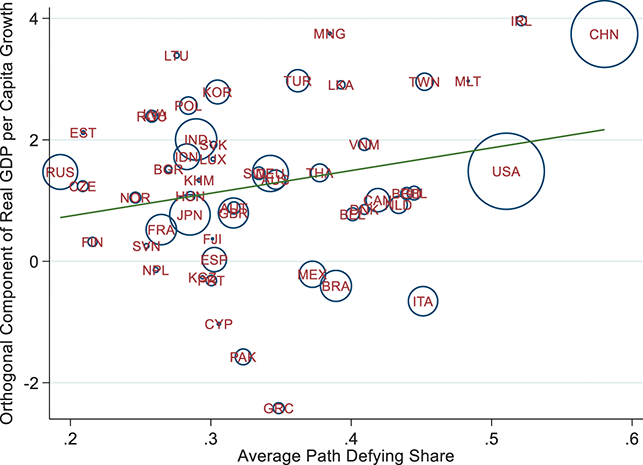
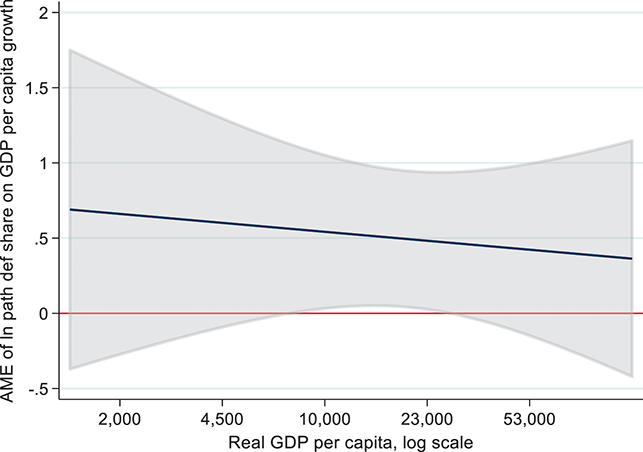
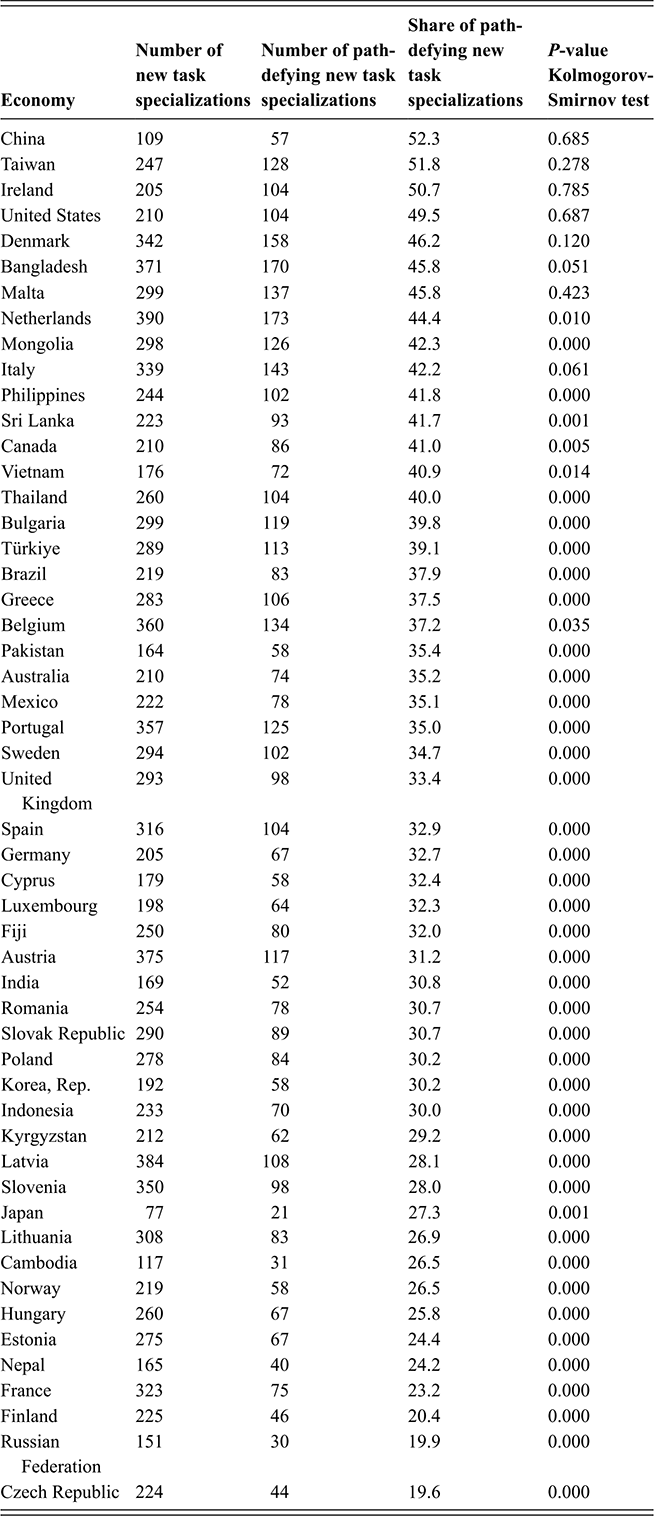
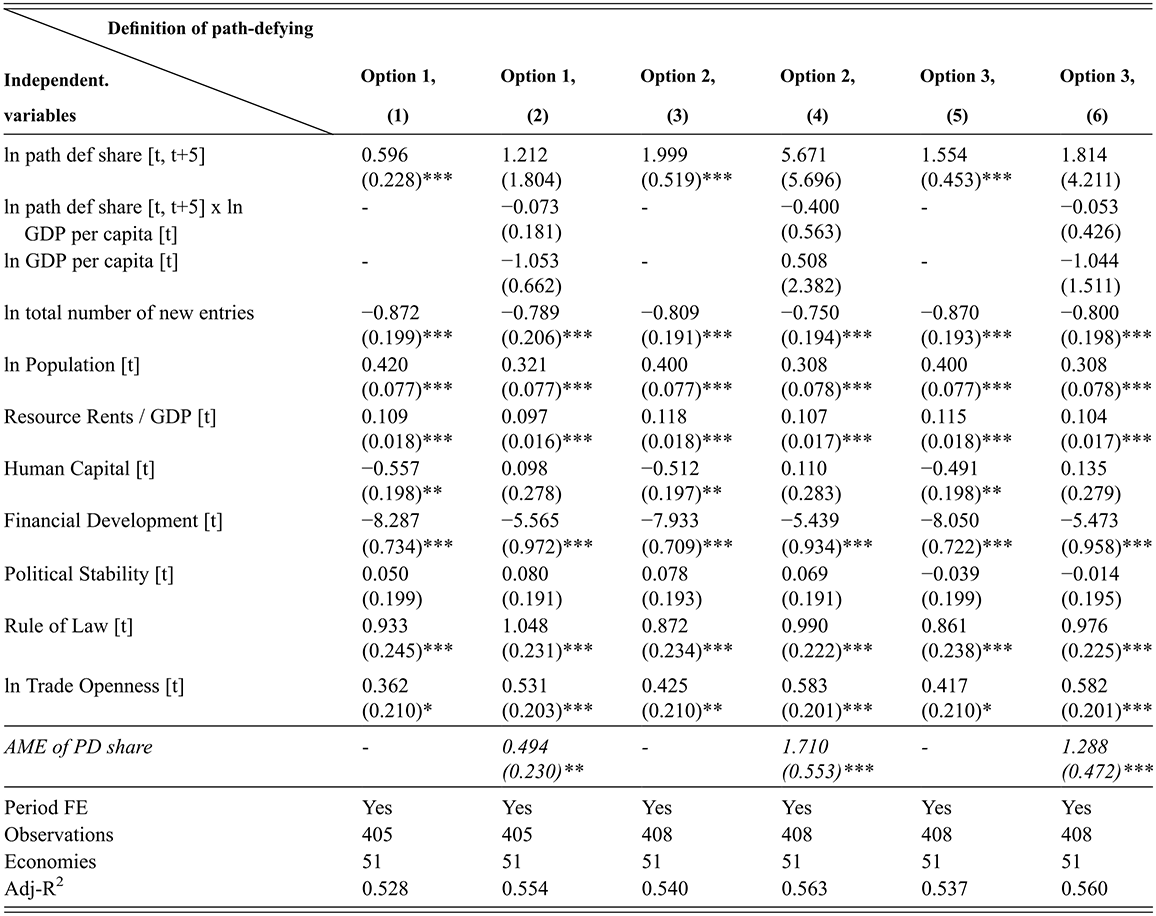
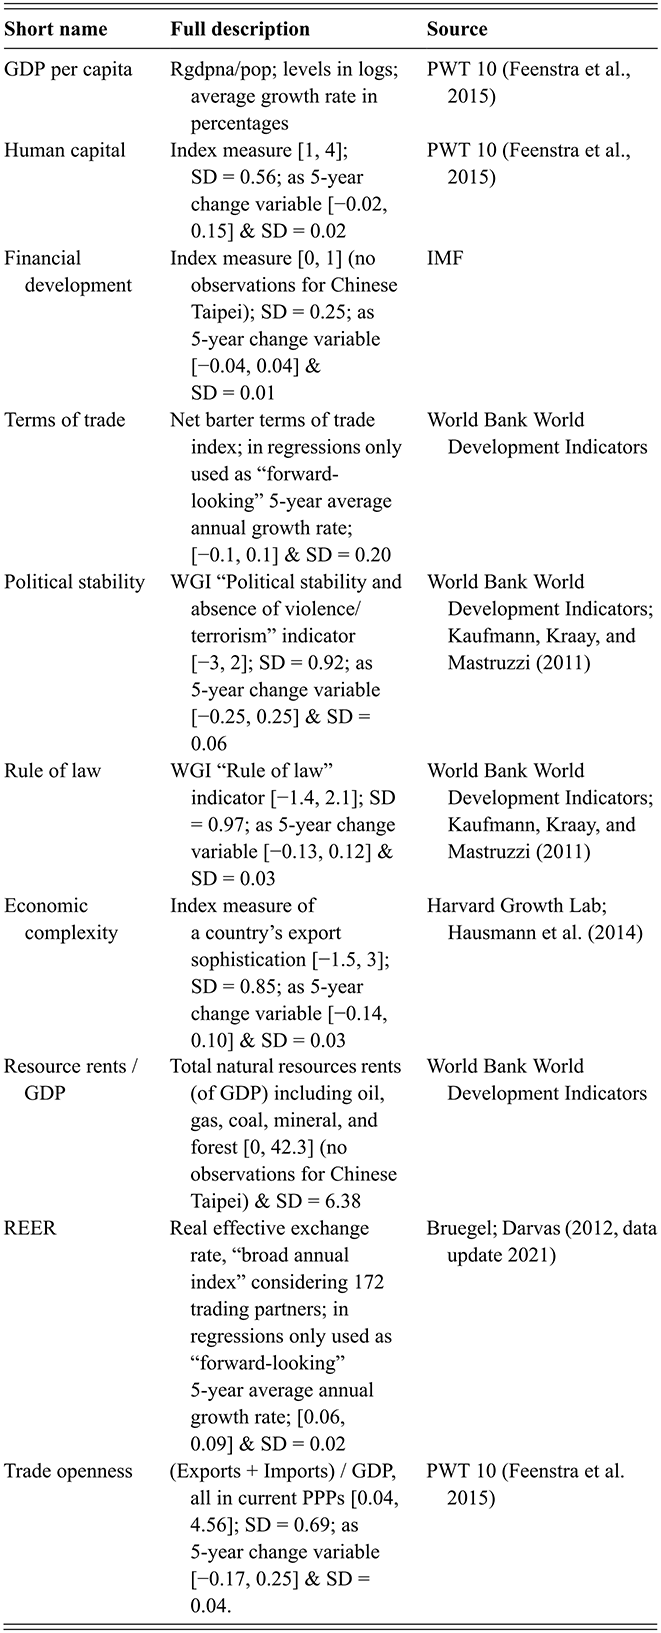

 Open access