


Impact statement
The energy consumption of a building and the thermal comfort of its occupants are closely related to the interior environment. The effects of indoor thermal long-wave radiation are significant but are all too often overlooked. This paper develops an analytical approach to predict the radiative and convective heat transfers, enabling the thermal stratification in a room to be better represented for any specified ventilation airflow. Such predictions are necessary for improved design and control of comfortable high-performance indoor environments.
1. Introduction
Indoor environments are continuously subject to the effects of thermal radiation which acts to redistribute heat, potentially over relatively large distances, and influences the energy consumption of buildings and the thermal comfort of occupants. Thermal radiation in buildings is broadly categorised into short-wave and long-wave radiation. Short-wave radiation refers to the radiant energy emitted by the sun that enters through windows and glazing, often referred to as ‘solar gain’. Solar gain can present a significant heat source in buildings as the short-wave radiation falls on and warms room surfaces, which re-radiate heat via long-wave radiation. Other sources, or sinks, of long-wave radiation indoors include heating and cooling systems (e.g. radiators, underfloor heating, cooled ceilings, chilled beams, space heaters and air conditioners), electrical appliances, occupants, etc. In addition, and as we go on to show, the passive surfaces in rooms (e.g. ceilings, floors and walls that are not deliberately heated or cooled) can also become important sources or sinks as long-wave radiation acts to redistribute heat between warmer and cooler surfaces within rooms. Herein, we provide an analytical model that is capable of quantifying the exchanges of heat within rooms, including the effects of long-wave radiation, via representation of a relevant number of thermal bodies (air masses and surfaces) within the room – we describe this as ‘mimicking radiation’ and show that even highly simplified ventilation flow models, which include this mimicked radiation, can predict the thermal stratifications realised in rooms with suitable accuracy.
The significant impacts on indoor environments from long-wave radiation arising from deliberate heating and cooling sources, and the re-radiation of solar gains, have been evidenced (e.g. Catalina et al. Reference Catalina, Virgone and Kuznik2009; Imanari et al. Reference Imanari, Omori and Bogaki1999; Marino et al. Reference Marino, Nucara and Pietrafesa2015, Reference Marino, Nucara and Pietrafesa2017; Sun et al. Reference Sun, Yang, Lin, Shi, Zhu and Zhao2020). However, the impact of the radiative redistribution from lower-temperature heat sources (e.g. occupants, electrical appliances, etc.) and the role of uneven temperature distributions on passive surfaces within rooms are not well documented. This gap is due in part to the experimental challenges associated with measuring long-wave radiation, despite a limited number of numerical studies that have highlighted such effects through comparisons of indoor environments simulated with and without radiation models (e.g. Menchaca-Brandan & Glicksman Reference Menchaca-Brandan and Glicksman2011; Menchaca-Brandan et al. Reference Menchaca-Brandan and Glicksman2017). Consequently, the impact of radiative redistribution from these, potentially important, thermal sources is frequently neglected, and studies often focus only on the effects of convective and ventilation flows (e.g. Lee & Lam Reference Lee and Lam2007; Lei et al. Reference Lei, Liu, Wang and Li2017; Park & Chang Reference Park and Chang2020; Tian et al. Reference Tian, Li, Ma, Liu, Li and Cheng2019). This is despite the accepted knowledge that, during office work for example, an occupant typically emits a heat flux of about 120 W (ASHRAE 2013; Du Bois & Du Bois Reference Du Bois and Du Bois1989) to the surrounding environment by radiation, convection and evaporation (the latter being a combination of respiration and sweating), with an approximately equal one-third weighting between the three mechanisms. With the hygrometric conditions typical in many indoor spaces, the evaporated water vapour tends not to recondense and is instead advected out with the exiting ventilation flow. Hence it is often the case that only the heat lost by radiation and convection is considered within the thermal budget of indoor spaces.
The remaining equal partition between convection and radiation from occupants is known to be a crude approximation; for example, studies have shown that the radiation-to-convection ratio can vary from 50:50 to 70:30 (CIBSE 2016; Deevy et al. Reference Deevy, Sinai, Everitt, Voigt and Gobeau2008; Srebric et al. Reference Srebric, Vukovic, He and Yang2008). Models, which approximate some impacts of long-wave radiation, have been proposed by Li et al. (Reference Li, Sandberg and Fuchs1992), da Graça and Linden (Reference da Graça and Linden2004) and Mateus and da Graça (Reference Mateus and da Graça2015), for example. However, these models do not allow for natural coupling between radiative and convective transfers from the heat sources – requiring that the radiation-to-convection ratio is prescribed. Moreover, these models assume that the prescribed radiative flux from the heat source(s) is uniformly distributed across the room surfaces. Given the propensity for warmer air to rise and for air within rooms to stratify, this assumption might be deemed questionable. In fact, data from full-scale experiments (especially those employing displacement ventilation; e.g. Brohus and Nielsen Reference Brohus and Nielsen1994; Li et al. Reference Li, Sandberg and Fuchs1992; Nielsen et al. Reference Nielsen, Murakami, Kato, Topp and Yang2003; Yuan & Chen Reference Yuan and Chen1999) evidence meaningful temperature stratification throughout the room height. Herein, we seek to develop a model that accounts for the natural coupling between radiation and convection, and that reflects the impact of stratified air (resulting in warmer surfaces higher up in the room and cooler surfaces lower down) on the radiative and convective heat transfers in rooms.
The structure of this paper is as follows. In § 2, we develop a general description of steady-state heat transfers by radiation and convection, and apply a minimal representation of a room to derive the analytical model AR5B. Section 3 describes the input parameters in the model. Section 4 examines the results of the AR5B model in predicting the distribution of indoor thermal radiation, as well as the indoor thermal structure.
2. An analytical model of the heat transfers, including long-wave radiation, within a thermally stratified room
The general form of the model, presented herein, describes the transfer of heat by radiation and convection between a set of thermal ‘bodies’ within a room under steady conditions, including heat sources and a ventilation flow to and from ambient air beyond the room. The model connects the thermally active bodies – surfaces (or parts thereof) and subvolumes of air within the room, and one air mass beyond the room – each of which is characterised by a uniform (and, in general, different) temperature, within a thermal resistance network. Each ‘body’ of air is assumed to participate only in convective heat transfer, i.e. the radiation absorbed by the air in indoor environments is a negligible portion of the total heat flux (see e.g. Glicksman & Chen Reference Glicksman and Chen1998). All surfaces are treated as opaque radiative grey bodies so that their emissivity, $\epsilon$
, is independent of wavelength and their reflectivity is therefore
$\epsilon$
, is independent of wavelength and their reflectivity is therefore $1-\epsilon$
. The walls, ceiling and floor are taken to be adiabatic; i.e. well-insulated with negligible conductive heat transfer through the surface. All thermal bodies are assumed to have uniform temperatures over their respective surfaces or air masses. The Boussinesq approximation is applied so that the density of air is taken to be constant except where buoyancy forces induced by temperature variations affect the dynamics of the air flows. Given the steady state, the storage and release of heat from the building fabric and the air masses do not require consideration. The resulting thermal resistance network can be used to mimic the effects of long-wave radiation in models of the indoor airflows.
$1-\epsilon$
. The walls, ceiling and floor are taken to be adiabatic; i.e. well-insulated with negligible conductive heat transfer through the surface. All thermal bodies are assumed to have uniform temperatures over their respective surfaces or air masses. The Boussinesq approximation is applied so that the density of air is taken to be constant except where buoyancy forces induced by temperature variations affect the dynamics of the air flows. Given the steady state, the storage and release of heat from the building fabric and the air masses do not require consideration. The resulting thermal resistance network can be used to mimic the effects of long-wave radiation in models of the indoor airflows.
2.1. General form of the model
In formulating a general heat transfer network model for the steady-state room described above, we define a set $\mathcal{S} = \left \{1,\ldots ,N_s\right \}$
of opaque grey surfaces and a set
$\mathcal{S} = \left \{1,\ldots ,N_s\right \}$
of opaque grey surfaces and a set $\mathcal{A} = \left \{N_s + 1,\ldots ,N_s + N_a \right \}$
of air bodies within the room. We define
$\mathcal{A} = \left \{N_s + 1,\ldots ,N_s + N_a \right \}$
of air bodies within the room. We define $\mathcal{B} = \mathcal{S} \cup \mathcal{A}$
as the set of the
$\mathcal{B} = \mathcal{S} \cup \mathcal{A}$
as the set of the $N = N_{s} + N_{a}$
thermal bodies; an additional body (denoted by the index
$N = N_{s} + N_{a}$
thermal bodies; an additional body (denoted by the index $(N+1)$
) representing the ambient air beyond the room is introduced as necessary in the model. The steady energy balance for each body,
$(N+1)$
) representing the ambient air beyond the room is introduced as necessary in the model. The steady energy balance for each body, $i \in \mathcal{B}$
, sums to zero and can be expressed as the sum of all the net heat transfers
$i \in \mathcal{B}$
, sums to zero and can be expressed as the sum of all the net heat transfers $Q_{ij}$
between body
$Q_{ij}$
between body $i$
and all other bodies
$i$
and all other bodies $j$
(i.e. for
$j$
(i.e. for $j \in \mathcal{B},\ j \ne i$
), and any heat flux
$j \in \mathcal{B},\ j \ne i$
), and any heat flux $HS_{i}$
imposed at
$HS_{i}$
imposed at $i$
, giving
$i$
, giving
 \begin{equation} \sum \limits _{j=1,j \ne i}^{N}Q_{ij} + HS_{i} = 0. \end{equation}
Depending on the nature of the bodies $i$
and
$i$
and $j$
, the net heat transfer
$j$
, the net heat transfer $Q_{ij}$
might include convection in the form of heat advected by the flow, convection from a surface and/or surface–surface radiation; that is
$Q_{ij}$
might include convection in the form of heat advected by the flow, convection from a surface and/or surface–surface radiation; that is
 \begin{align} Q_{ij} = \begin{cases} \rho c_p \dot {V}_{ij}(T_{j}-T_{i}), & \text{for }{i,j\in \mathcal{A} \cup \{N+1\},\ i \ne j} ,\\[3pt] (T_{i} - T_{j})/R^{c}_{ij}, & \text{for }{i\in \mathcal{S},\ j\in \mathcal{A} \ \text{and}\ i\in \mathcal{A},\ j\in \mathcal{S}} \text{ and} \\[3pt] (J_{i}-J_{j})/R^{r}_{ij}, & \text{for }{i,j\in \mathcal{S},\ i \ne j}. \end{cases} \end{align}
Relevant for convection advected by airflows between bodies, $\rho$
and
$\rho$
and $c_{p}$
are the density and specific heat capacity of air, respectively, and
$c_{p}$
are the density and specific heat capacity of air, respectively, and $\dot {V}_{ij}$
is the volume flux of air associated with the advection of heat from air body
$\dot {V}_{ij}$
is the volume flux of air associated with the advection of heat from air body $i$
, at temperature
$i$
, at temperature $T_{i}$
, to body
$T_{i}$
, to body $j$
, at temperature
$j$
, at temperature $T_{j}$
. Note that
$T_{j}$
. Note that $\dot {V}_{ij}$
is zero if air bodies
$\dot {V}_{ij}$
is zero if air bodies $i$
and
$i$
and $j$
are not physically connected, and otherwise takes positive or negative values determined by the direction of flow. Each air body
$j$
are not physically connected, and otherwise takes positive or negative values determined by the direction of flow. Each air body $i \in \mathcal{A} \cup \{N+1\}$
is subject to the conservation of mass, i.e.
$i \in \mathcal{A} \cup \{N+1\}$
is subject to the conservation of mass, i.e. $\sum _{j} \dot {V}_{ij} {= 0}, j\in \mathcal{A} \cup \{N+1\},\ i \ne j$
. For convection from a surface, the resistance
$\sum _{j} \dot {V}_{ij} {= 0}, j\in \mathcal{A} \cup \{N+1\},\ i \ne j$
. For convection from a surface, the resistance $R^{c}_{ij} = 1/(A_{ij}h^{c}_{ij})$
characterises the heat transfer between the surface
$R^{c}_{ij} = 1/(A_{ij}h^{c}_{ij})$
characterises the heat transfer between the surface $i$
and the air body
$i$
and the air body $j$
(
$j$
( $i\in \mathcal{S}, j\in \mathcal{A}$
), with
$i\in \mathcal{S}, j\in \mathcal{A}$
), with $A_{ij}$
being the surface area of
$A_{ij}$
being the surface area of $i$
in contact with
$i$
in contact with $j$
and
$j$
and $h^{c}_{ij}$
being the convective heat transfer coefficient – the appropriate values for these coefficients are themselves dependent on the temperature difference between the surface and the air body and so their values are solved for within AR5B (see the Appendix). This resistance
$h^{c}_{ij}$
being the convective heat transfer coefficient – the appropriate values for these coefficients are themselves dependent on the temperature difference between the surface and the air body and so their values are solved for within AR5B (see the Appendix). This resistance $R^{c}_{ij}$
can be taken as infinite (such that
$R^{c}_{ij}$
can be taken as infinite (such that $Q_{ij}$
is zero) when the surface and air body are not physically connected.
$Q_{ij}$
is zero) when the surface and air body are not physically connected.
The surface–surface radiative heat transfer is characterised by the radiosities $J_{i}$
and
$J_{i}$
and $J_{j}$
at the surface bodies
$J_{j}$
at the surface bodies $i$
and
$i$
and $j$
(
$j$
( $i,j\in \mathcal{S}$
,
$i,j\in \mathcal{S}$
, $i \ne j$
), respectively, and the radiative resistance,
$i \ne j$
), respectively, and the radiative resistance, $R^{r}_{ij} =1/(A_{i}X_{ij})$
(where
$R^{r}_{ij} =1/(A_{i}X_{ij})$
(where $A_{i}$
is the surface area of
$A_{i}$
is the surface area of $i$
and
$i$
and $X_{ij}$
is the view factor from surface
$X_{ij}$
is the view factor from surface $i$
to
$i$
to $j$
). The radiosities
$j$
). The radiosities $J_i$
(
$J_i$
( $ i\in \mathcal{S}$
) can be related to the
$ i\in \mathcal{S}$
) can be related to the $N_s$
temperatures of the surfaces within the room (see e.g. Incropera et al. Reference Incropera, DeWitt, Bergman and Lavine2013) according to
$N_s$
temperatures of the surfaces within the room (see e.g. Incropera et al. Reference Incropera, DeWitt, Bergman and Lavine2013) according to
 \begin{equation} \mathbf{J} = \mathbf{A}^{-1} \mathbf{C} \, , \end{equation}
where
 \begin{align*} \mathbf{J} = \begin{bmatrix} J_{1} \\[3pt] J_{2} \\[3pt] J_{3} \\[3pt] \vdots \\[3pt] J_{N_{s}} \end{bmatrix},\quad \mathbf{A} = \begin{bmatrix} -Y_1 & -X_{12} & -X_{13} & \ldots & -X_{1{N_{s}}} \\[3pt] -X_{21} & -Y_2 & -X_{23} & \ldots & -X_{2{N_{s}}} \\[3pt] -X_{31} & -X_{32} & -Y_3 & \ldots & -X_{3{N_{s}}} \\[3pt] \vdots & \vdots & \vdots & & \vdots \\[3pt] -X_{N_{s}1} & -X_{N_{s}2} & -X_{N_{s}3} & \ldots & -Y_{N_{s}} \\[3pt] \end{bmatrix}, \quad \mathbf{C} = \begin{bmatrix} {\sigma }T_{1}^4 \, {\epsilon }_{1}(1-{\epsilon }_{1})^{-1} \\[3pt] {\sigma }T_{2}^4 \, {\epsilon }_{2}(1-{\epsilon }_{2})^{-1} \\[3pt] {\sigma }{T_{3}}^4 \, {\epsilon }_{3}(1-{\epsilon }_{3})^{-1} \\[3pt] \vdots \\[3pt] {\sigma }T_{{Ns}}^4 \, {\epsilon }_{N_{s}}(1-{\epsilon }_{N_{s}})^{-1} \end{bmatrix}, \end{align*}
and $Y_i = -X_{ii} + (1-{\epsilon }_{i})^{-1}$
, with
$Y_i = -X_{ii} + (1-{\epsilon }_{i})^{-1}$
, with $X_{ii} = 1 - \sum _{j} X_{ij}$
being the view factor from a surface
$X_{ii} = 1 - \sum _{j} X_{ij}$
being the view factor from a surface $i$
to itself,
$i$
to itself, ${\epsilon }_{i}$
the emissivity of surface
${\epsilon }_{i}$
the emissivity of surface $i$
and
$i$
and $\sigma$
the Stefan–Boltzmann constant.
$\sigma$
the Stefan–Boltzmann constant.
In summary, (2.1)–(2.3) provide a closed nonlinear system of $N$
equations for the
$N$
equations for the $N$
unknown temperatures of the thermal bodies. Specifically, to close the thermal energy balances of (2.1), (2.2) provides the solution for all heat fluxes within the indoor space in terms of the
$N$
unknown temperatures of the thermal bodies. Specifically, to close the thermal energy balances of (2.1), (2.2) provides the solution for all heat fluxes within the indoor space in terms of the $N$
unknown temperatures (requiring, in the case of surface–surface radiation, solution of (2.3) to link the radiosities at the
$N$
unknown temperatures (requiring, in the case of surface–surface radiation, solution of (2.3) to link the radiosities at the $N_s$
surfaces to their temperatures). The solution of the system requires knowledge or parameterisation of the airflows, surface geometries and ambient temperature beyond the room, i.e.
$N_s$
surfaces to their temperatures). The solution of the system requires knowledge or parameterisation of the airflows, surface geometries and ambient temperature beyond the room, i.e. $\dot {V}_{ij}$
,
$\dot {V}_{ij}$
, $A_{ij}$
,
$A_{ij}$
, $A_{i}$
,
$A_{i}$
, $\epsilon _i$
,
$\epsilon _i$
, $X_{ij}$
and
$X_{ij}$
and $T_{(N+1)}$
. The imposed heat loads
$T_{(N+1)}$
. The imposed heat loads $HS_i$
must also be prescribed, after which the nonlinear system can be solved using standard methods (in our case, the Levenberg–Marquardt algorithm provided by the ‘fsolve’ function in Matlab).
$HS_i$
must also be prescribed, after which the nonlinear system can be solved using standard methods (in our case, the Levenberg–Marquardt algorithm provided by the ‘fsolve’ function in Matlab).
In addition to the temperatures $T_i (i \in \mathcal{B})$
, the solution provides all the heat fluxes
$T_i (i \in \mathcal{B})$
, the solution provides all the heat fluxes $Q_{ij}$
(equation (2.2)). To aid characterisation of the heat transfers, we introduce two sets of dimensionless radiation factors:
$Q_{ij}$
(equation (2.2)). To aid characterisation of the heat transfers, we introduce two sets of dimensionless radiation factors:
 \begin{equation} {\psi }_{ij} = \frac {Q_{ij}}{HS_{sum}}, \quad \text{for }{i,j \in \mathcal{S};\ i \ne j} \end{equation}
and
 \begin{equation} {\psi }_{i} = \sum \limits _{j=1}^{N_{s}} {\psi }_{ji}, \quad\text{for }{i,j \in \mathcal{S};\ i \ne j,} \end{equation}
where the first set of radiation factors characterises the surface–surface transfers, such that by definition ${\psi }_{ij} = -{\psi }_{ji}$
, and the second set characterises the strength of the net radiation gain at the surface, i.e.
${\psi }_{ij} = -{\psi }_{ji}$
, and the second set characterises the strength of the net radiation gain at the surface, i.e. ${\psi }_{i}$
, with each normalised by the total heat input to the room
${\psi }_{i}$
, with each normalised by the total heat input to the room $HS_{sum} = \sum _{i=1}^{N} HS_{i} \,\,\, (i\in \mathcal{B})$
.
$HS_{sum} = \sum _{i=1}^{N} HS_{i} \,\,\, (i\in \mathcal{B})$
.
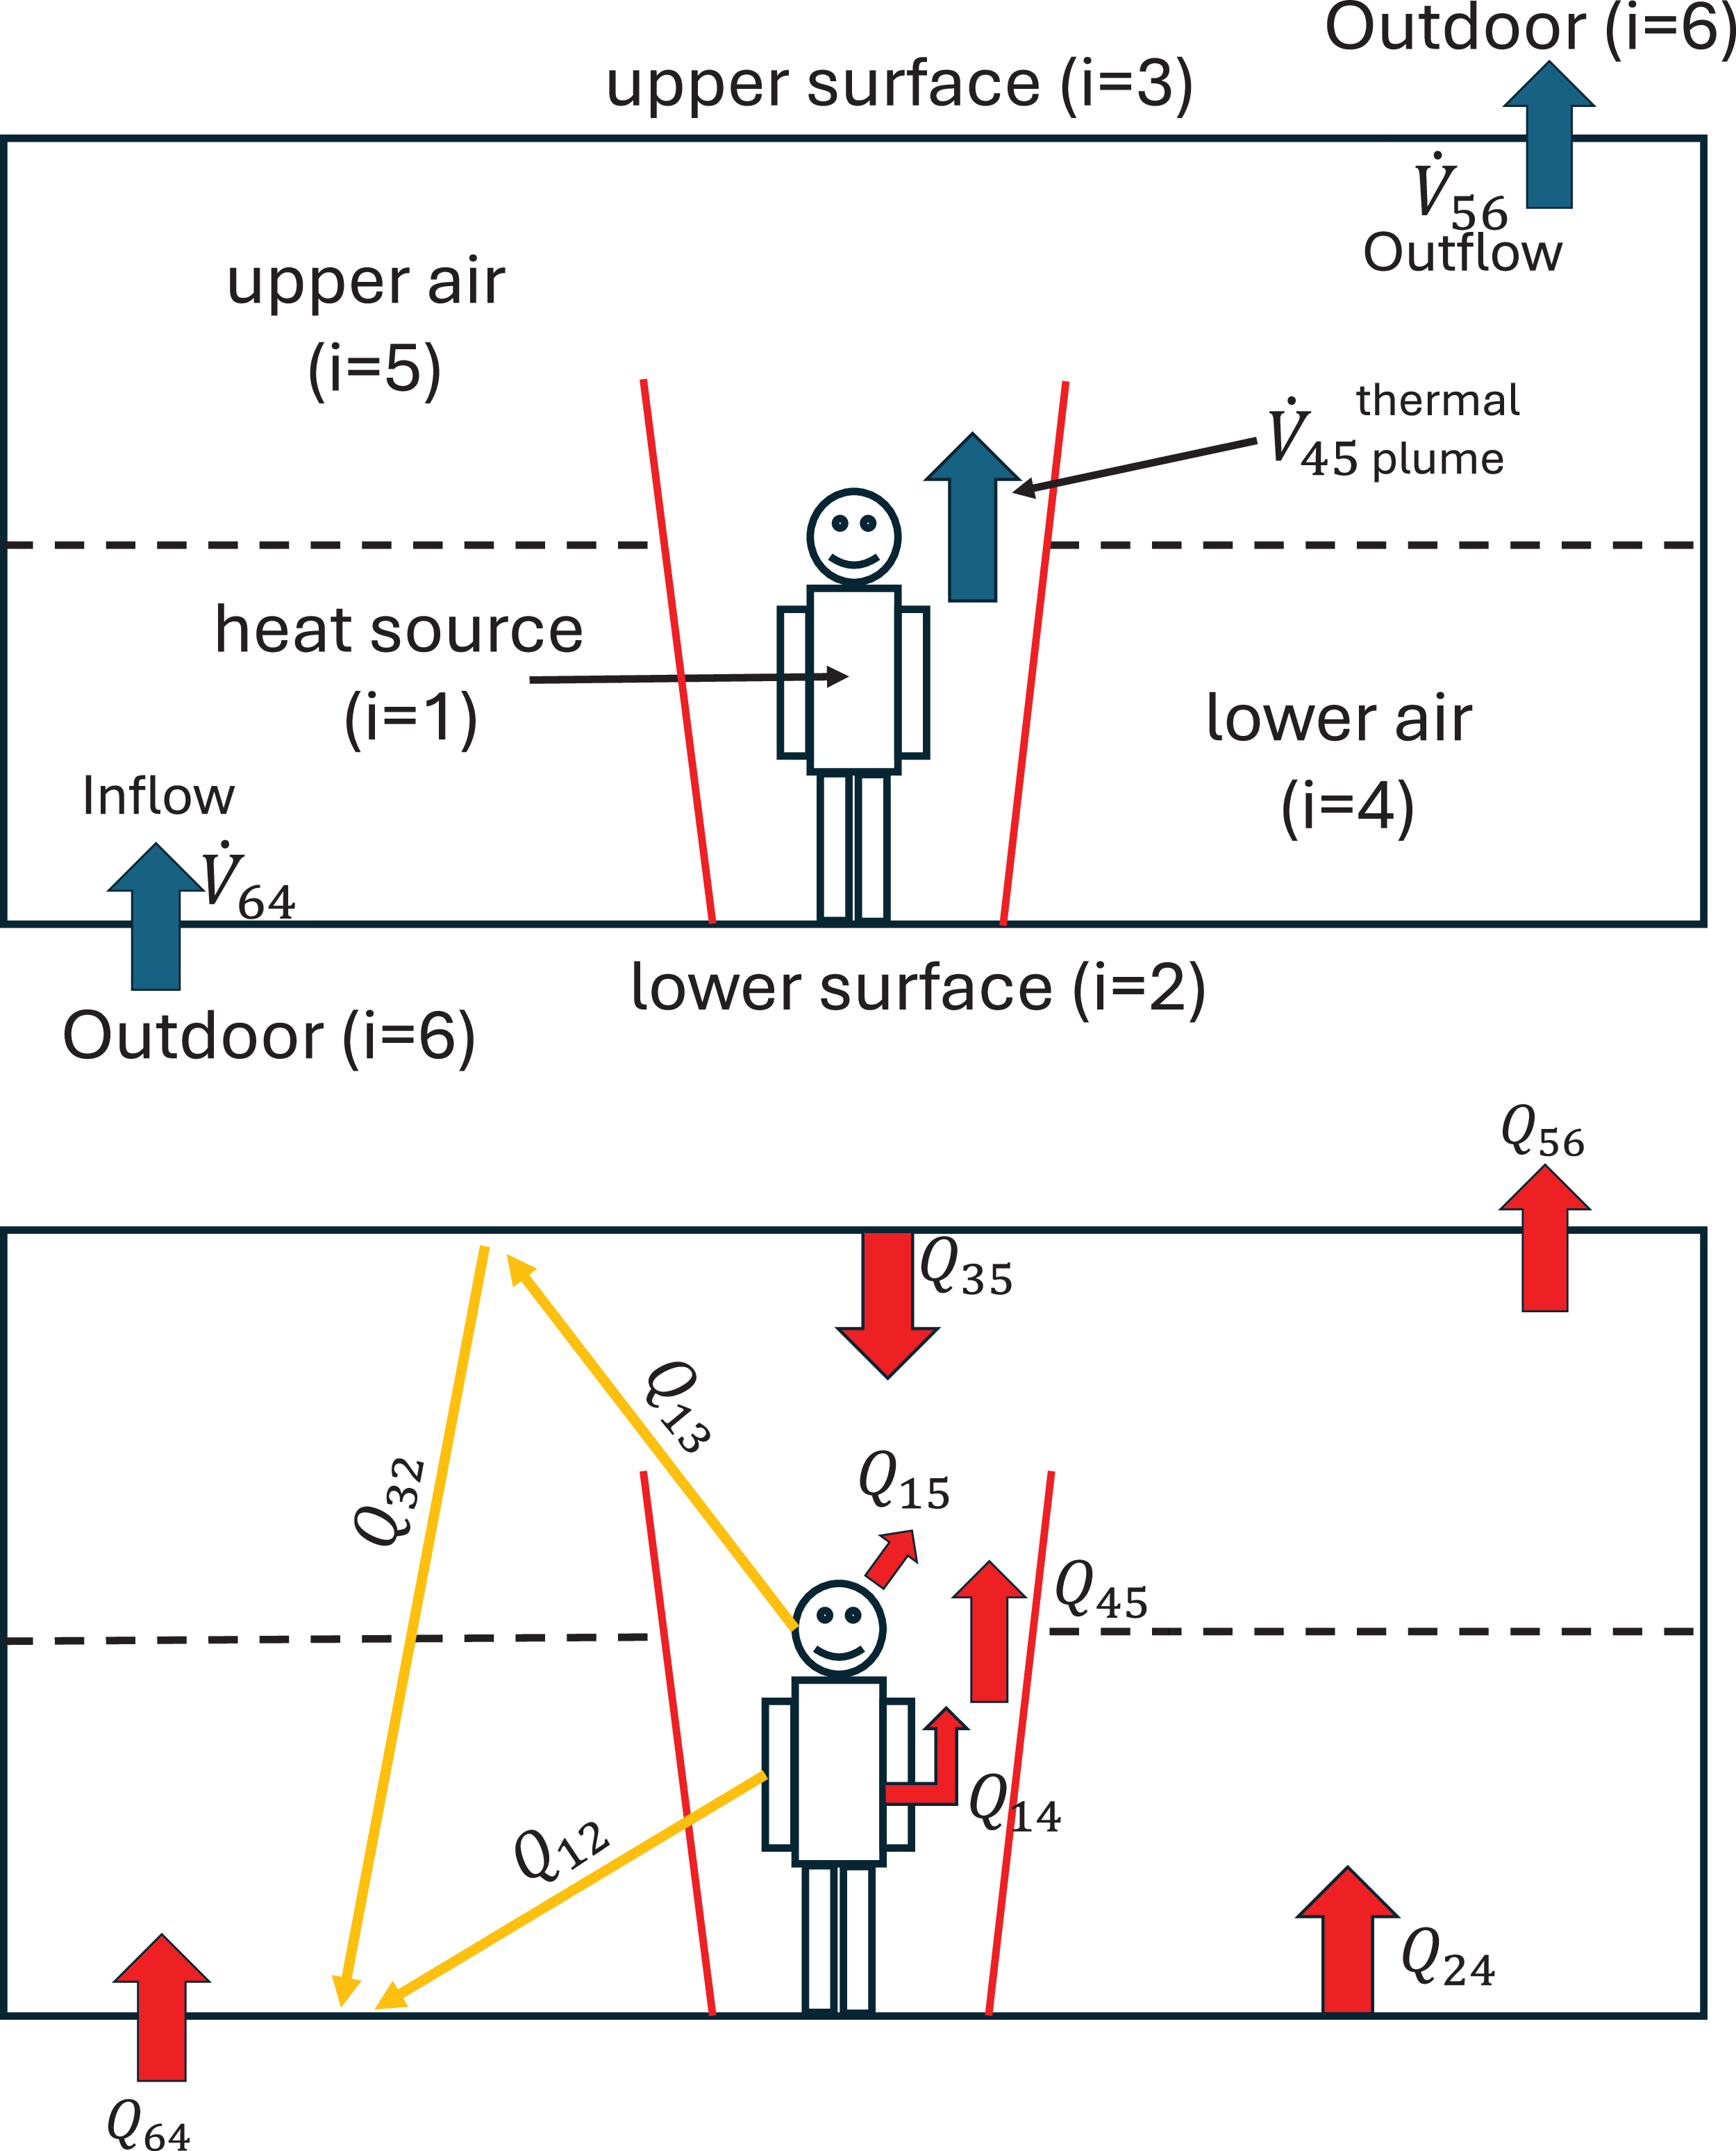
2.2. A minimal representation to describe the heat transfers within a stratified room: the AR5B model
We wish to compare our model predictions against data available from full-scale experimental studies subject to mechanical displacement ventilation flows, with the aim of validating our minimal representation of a stratified room. The experimental studies have typically used heated manikins as the heat sources, which we approximate here by simple vertically distributed planar sources.
Top panel: Illustration of the AR5B model, consisting of the minimal set of thermal bodies necessary to represent a temperature-stratified room with steady ventilation flow (an upward displacement flow chosen as an example here). The heat source is illustrated (as a person or heated manikin). The black dashed horizontal line represents the height at which both the air and the surfaces within the room are each divided into two, thereby defining the remaining four thermal bodies. Blue arrows illustrate the air flows into and out of the air layers. Bottom panel: Illustration of the heat transfers to/from each body in the coupled thermal resistance network. Radiative heat transfers are illustrated with yellow arrows and convective heat transfers by red arrows.

Firstly, consider the vertically distributed heat source (arbitrarily taken to be thermal body $i = 1$
) for which (2.1) and (2.2) allow the natural balance of convective and radiative heat transfers to evolve. Secondly, the temperature stratification associated with displacement ventilation flows is typically assumed to consist of, at least two, horizontal layers of air that become warmer with height (Linden Reference Linden, Lane-Serff and Smeed1999). Thus, the simplest thermal representation of a stratified room is to consider the interior air as two bodies (arbitrarily a lower layer,
$i = 1$
) for which (2.1) and (2.2) allow the natural balance of convective and radiative heat transfers to evolve. Secondly, the temperature stratification associated with displacement ventilation flows is typically assumed to consist of, at least two, horizontal layers of air that become warmer with height (Linden Reference Linden, Lane-Serff and Smeed1999). Thus, the simplest thermal representation of a stratified room is to consider the interior air as two bodies (arbitrarily a lower layer, $i=4$
, and an upper layer,
$i=4$
, and an upper layer, $i = 5$
) and the internal surfaces as another two thermal bodies (the lower surfaces,
$i = 5$
) and the internal surfaces as another two thermal bodies (the lower surfaces, $i=2$
, and upper surfaces,
$i=2$
, and upper surfaces, $i = 3$
). Thus we have
$i = 3$
). Thus we have $\mathcal{S}=\{1, 2, 3 \}$
and
$\mathcal{S}=\{1, 2, 3 \}$
and $\mathcal{A}=\{4, 5\}$
within a model that (unlike pre-existing models; e.g. Li et al. Reference Li, Sandberg and Fuchs1992; Mateus & da Graça Reference Mateus and da Graça2015; da Graça & Linden Reference da Graça and Linden2004) both allows the balance between convection and radiation to be solved for and permits vertical asymmetry in the radiation distribution – we refer to this representation as the asymmetric radiation five-body (AR5B) model.
$\mathcal{A}=\{4, 5\}$
within a model that (unlike pre-existing models; e.g. Li et al. Reference Li, Sandberg and Fuchs1992; Mateus & da Graça Reference Mateus and da Graça2015; da Graça & Linden Reference da Graça and Linden2004) both allows the balance between convection and radiation to be solved for and permits vertical asymmetry in the radiation distribution – we refer to this representation as the asymmetric radiation five-body (AR5B) model.
Figure 1 provides an illustration of the AR5B model, in which each air body is connected to two others, one of which is the ambient environment beyond the room (denoted by the index $i = N + 1 = 6$
). We further assume that the convective plume from the localised heat source remains coherent, i.e. the convective flux released into the lower layer remains within the localised plume and is transported into the upper layer (as evidenced by Gladstone & Woods (Reference Gladstone and Woods2014) and Linden et al. (Reference Linden, Lane-Serff and Smeed1990)). Conservation of volume (mass) prescribes that the transport between the two layers must be equal to the incoming and outgoing ventilation flows, i.e.
$i = N + 1 = 6$
). We further assume that the convective plume from the localised heat source remains coherent, i.e. the convective flux released into the lower layer remains within the localised plume and is transported into the upper layer (as evidenced by Gladstone & Woods (Reference Gladstone and Woods2014) and Linden et al. (Reference Linden, Lane-Serff and Smeed1990)). Conservation of volume (mass) prescribes that the transport between the two layers must be equal to the incoming and outgoing ventilation flows, i.e. $\dot {V}_{45}=\dot {V}_{64}=\dot {V}_{56}=\dot {V}$
. The dividing height between both the lower and upper air masses, and the lower and upper surfaces, was taken to be the half-height of the room.Footnote
1
Accordingly, the ceiling together with the upper half of the walls was grouped to form the upper surfaces, while the floor together with the lower half of the walls was grouped to form the lower surfaces. This leads to
$\dot {V}_{45}=\dot {V}_{64}=\dot {V}_{56}=\dot {V}$
. The dividing height between both the lower and upper air masses, and the lower and upper surfaces, was taken to be the half-height of the room.Footnote
1
Accordingly, the ceiling together with the upper half of the walls was grouped to form the upper surfaces, while the floor together with the lower half of the walls was grouped to form the lower surfaces. This leads to $A_{24} = A_{2}$
,
$A_{24} = A_{2}$
, $A_{35} = A_{3}$
and
$A_{35} = A_{3}$
and $A_{15} = A_{1} - A_{14}$
.
$A_{15} = A_{1} - A_{14}$
.
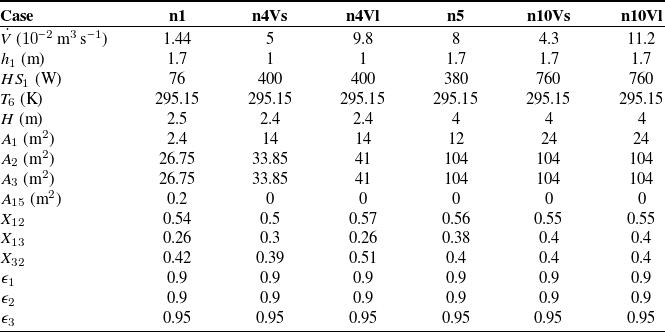
3. Model parameterisation
Describing coupled radiative and convective heat transfer within analytical models requires prescription of input parameters describing the various heat transfer properties of the thermal bodies. We validate our AR5B model by comparing predictions with full-scale experimental data for the stratified environments established within a thermal chamber (from Brohus and Nielsen (Reference Brohus and Nielsen1994) and Nielsen et al. (Reference Nielsen, Murakami, Kato, Topp and Yang2003), providing one and five cases, respectively). Our aim throughout is to reflect the parameters of these experiments as closely as possible – the domains for these cases are presented in figure 2 and the selected parameters and their values are shown in table 1. Rows 1–5 of the table present the ventilation rate $\dot {V}$
, the height of the heat source(s)
$\dot {V}$
, the height of the heat source(s) $h_{1}$
, the heat flux imposed at the heat source(s)
$h_{1}$
, the heat flux imposed at the heat source(s) $HS_{1}$
(with zero heat flux imposed at all other bodies, i.e.
$HS_{1}$
(with zero heat flux imposed at all other bodies, i.e. $HS_{sum} =HS_{1}$
), the temperature of the incoming (ambient) air
$HS_{sum} =HS_{1}$
), the temperature of the incoming (ambient) air $T_{6}$
and the height of the room
$T_{6}$
and the height of the room $H$
. Although
$H$
. Although $H$
is not a direct input parameter of the model, it affects other inputs, such as the areas of the surfaces and the view factors between surfaces. Rows 6–9 of the table include the surface areas of all surfaces
$H$
is not a direct input parameter of the model, it affects other inputs, such as the areas of the surfaces and the view factors between surfaces. Rows 6–9 of the table include the surface areas of all surfaces $A_{i}$
and those in contact with air masses
$A_{i}$
and those in contact with air masses $A_{ij}$
, which are determined based on the dimensions of the experimental room chamber and the heat source. The segregation into lower surfaces and upper surfaces is taken to be the half-height of the room as discussed in § 2.2. The view factors between all different surfaces,
$A_{ij}$
, which are determined based on the dimensions of the experimental room chamber and the heat source. The segregation into lower surfaces and upper surfaces is taken to be the half-height of the room as discussed in § 2.2. The view factors between all different surfaces, $X_{ij}$
, which are presented in rows 10–12 of the table, are determined using View3D software (Walton Reference Walton2009).Footnote
2
Regarding emissivities (shown in rows 13–15 of the table), we assign
$X_{ij}$
, which are presented in rows 10–12 of the table, are determined using View3D software (Walton Reference Walton2009).Footnote
2
Regarding emissivities (shown in rows 13–15 of the table), we assign $\epsilon _{1} = 0.9$
to characterise the surface of the heat source in all six cases, representative of the naked manikin used in the experimental set-up of Nielsen et al. (Reference Nielsen, Murakami, Kato, Topp and Yang2003). In the absence of material data for the chamber in all experiments, the emissivity values of the materials of the ceiling
$\epsilon _{1} = 0.9$
to characterise the surface of the heat source in all six cases, representative of the naked manikin used in the experimental set-up of Nielsen et al. (Reference Nielsen, Murakami, Kato, Topp and Yang2003). In the absence of material data for the chamber in all experiments, the emissivity values of the materials of the ceiling $\epsilon _{c}$
, walls
$\epsilon _{c}$
, walls $\epsilon _{wl}$
and floor
$\epsilon _{wl}$
and floor $\epsilon _{f}$
are assumed to be typical values for common materials: 0.95 (plaster), 0.95 (plaster) and 0.8 (concrete), respectively, according to ASHRAE (2017). Within the model, we take area-weighted emissivities, giving:
$\epsilon _{f}$
are assumed to be typical values for common materials: 0.95 (plaster), 0.95 (plaster) and 0.8 (concrete), respectively, according to ASHRAE (2017). Within the model, we take area-weighted emissivities, giving: ${\epsilon }_{3} = 0.95$
(based on ceiling and wall values) and
${\epsilon }_{3} = 0.95$
(based on ceiling and wall values) and ${\epsilon }_{2}=0.9$
(floor and wall).
${\epsilon }_{2}=0.9$
(floor and wall).
Details of the six cases for which full-scale experimental data are available, including key details of their configurations and the parameters used within the AR5B model.

Domains of the six cases for which full-scale experimental data are available: (a) case n1; (b) case n4Vs; (c) case n4Vl; (d) case n5; and (e) cases n10Vs and n10Vl.

3.1. Using AR5B to inform a simplified ventilation flow model to mimic the effects of radiation
As discussed in § 2.2, the outputs of the AR5B model are used to ‘mimic’ the effects of radiation within ventilation flow models. Herein, the outputs of the AR5B model are used to modify inputs to the well-established ventilation flow models built upon the classical work of Linden et al. (Reference Linden, Lane-Serff and Smeed1990) that do not consider the redistribution of heat by radiation. The model of Linden et al. (Reference Linden, Lane-Serff and Smeed1990) was developed and validated for a room in the presence of displacement ventilation with a localised buoyancy source, predicting a two-layer stratification and the height of the sharp interface between them. In extending this work to account for a heat source that injects heat over a range of heights above the floor (cf. the manikin), Gladstone & Woods (Reference Gladstone and Woods2014) identify that, depending on the magnitude of the ventilation flow rate imposed, an intermediate stratified layer is formed in which the temperature varies linearly between the bottom and top layers of the air. Given the vertically distributed nature of the heat input in the full-scale experiments, we therefore utilise the results of AR5B to mimic the radiation in a ventilation flow model following Gladstone & Woods (Reference Gladstone and Woods2014). We describe this as the AR5B-GW model, which forms the basis for the comparison reported in § 4.
In the AR5B-GW model, the height to which the bottom layer of air extends, $h_{{\rm bot}}$
, is determined by the location at which the volume flux in the plume rising above the heat source matches the volume flux of the (in our case, mechanically driven) ventilation flow (as per (Gladstone & Woods Reference Gladstone and Woods2014)). The AR5B model output provides the normalised net radiation gain at the lower surfaces of the room as
$h_{{\rm bot}}$
, is determined by the location at which the volume flux in the plume rising above the heat source matches the volume flux of the (in our case, mechanically driven) ventilation flow (as per (Gladstone & Woods Reference Gladstone and Woods2014)). The AR5B model output provides the normalised net radiation gain at the lower surfaces of the room as ${\psi }_{2} HS_{1}$
. This net gain generates an equal convective heat transfer from the lower surfaces to the bottom air layer (because the surface is assumed to be adiabatic), thereby (uniformly) raising the temperature of the air relative to the incoming ambient. The temperature of the bottom air layer is given by
${\psi }_{2} HS_{1}$
. This net gain generates an equal convective heat transfer from the lower surfaces to the bottom air layer (because the surface is assumed to be adiabatic), thereby (uniformly) raising the temperature of the air relative to the incoming ambient. The temperature of the bottom air layer is given by
 \begin{equation} \Delta T_{{\rm bot}} = \frac {{\psi }_{2} HS_{1}}{{\rho } c_{p} \, \dot {V}} \, . \end{equation}
The full-scale comparison experiments consisted of one or more identical heat sources, and we assume that aggregation of several distinct heat sources ( $N_{hs}\geq 1$
) into a single thermal body (
$N_{hs}\geq 1$
) into a single thermal body ( $i=1$
) is possible for the purposes of radiation modelling. More specifically, the net radiative heat transfers between sources of approximately equal surface temperature are negligible so that within AR5B the multiple heat sources can be simplified into a single source with the same total heat flux and total surface area. However, the ventilation flow modelling needs to account for the thermal plume from each source. The normalised convective heat flux input at each heat source per unit height is
$i=1$
) is possible for the purposes of radiation modelling. More specifically, the net radiative heat transfers between sources of approximately equal surface temperature are negligible so that within AR5B the multiple heat sources can be simplified into a single source with the same total heat flux and total surface area. However, the ventilation flow modelling needs to account for the thermal plume from each source. The normalised convective heat flux input at each heat source per unit height is $q_{1} = (1 + {\psi }_{1}) HS_{1}/(N_{hs}h_{1})$
. When the height to which the bottom layer of air extends is above the height of the source(s), i.e.
$q_{1} = (1 + {\psi }_{1}) HS_{1}/(N_{hs}h_{1})$
. When the height to which the bottom layer of air extends is above the height of the source(s), i.e. $h_{{\rm bot}} \gt h_{1}$
, a two-layer stratification forms (with the interface at
$h_{{\rm bot}} \gt h_{1}$
, a two-layer stratification forms (with the interface at $h_{{\rm bot}}$
). However, when
$h_{{\rm bot}}$
). However, when $h_{{\rm bot}} \lt h_{1}$
– as is the case for most of the full-scale experimental data that we compare with (§ 4) – an intermediate stratified layer forms up to the height of
$h_{{\rm bot}} \lt h_{1}$
– as is the case for most of the full-scale experimental data that we compare with (§ 4) – an intermediate stratified layer forms up to the height of $h_{1}$
. The excess temperature (relative to the temperature of the incoming air) in the intermediate layer
$h_{1}$
. The excess temperature (relative to the temperature of the incoming air) in the intermediate layer ${\Delta }T_{{\rm mid}}$
varies linearly as height increases, starting from a value greater than, or equal to,
${\Delta }T_{{\rm mid}}$
varies linearly as height increases, starting from a value greater than, or equal to, ${\Delta }T_{{\rm bot}}$
and ending at a value that is less than, or equal to, that of the top layer
${\Delta }T_{{\rm bot}}$
and ending at a value that is less than, or equal to, that of the top layer ${\Delta }T_{{\rm top}}$
. This linear variation with height arises due to the conservation of thermal energy and the constant heat input per unit height from the heat source (see e.g. Gladstone & Woods Reference Gladstone and Woods2014), and is given by
${\Delta }T_{{\rm top}}$
. This linear variation with height arises due to the conservation of thermal energy and the constant heat input per unit height from the heat source (see e.g. Gladstone & Woods Reference Gladstone and Woods2014), and is given by
 \begin{equation} {\Delta }T_{{\rm mid}} = {\Delta }T_{{\rm bot}} + q_{1} \, \frac {(z-h_{{\rm bot}})}{{\rho } c_{p} \, \dot {V}}- \left (\frac {g}{\rho c_{p} T_{6}}q_{1}\right )^{5/6} \left (\frac {\dot {V}}{N_{hs}}\right )^{-1/2}. \end{equation}
It is worth noting that, for simplicity, we maintain the requirement that within the radiation modelling of AR5B, the room surfaces and the air within are divided into lower and upper parts, with the division taken to occur at the half-height of the room (see § 2.2).
In all six cases, the normalised total heat flux carried by the plumes rising from the $N_{hs}$
heat sources into the top layer of air is
$N_{hs}$
heat sources into the top layer of air is $(1 + {\psi }_{1} + {\psi }_{2}) HS_{1}$
. This top layer is also subject to a normalised convective heat flux
$(1 + {\psi }_{1} + {\psi }_{2}) HS_{1}$
. This top layer is also subject to a normalised convective heat flux ${\psi }_{3} HS_{1}$
(i.e. balancing the net radiation exchange at the upper surface). As
${\psi }_{3} HS_{1}$
(i.e. balancing the net radiation exchange at the upper surface). As ${\psi }_{1} + {\psi }_{2} + {\psi }_{3} = 0$
, it is clear that all heat fluxes into the room must pass into, and out of, this top layer of air, thereby requiring that its (uniform) excess temperature matches that of the outflow:
${\psi }_{1} + {\psi }_{2} + {\psi }_{3} = 0$
, it is clear that all heat fluxes into the room must pass into, and out of, this top layer of air, thereby requiring that its (uniform) excess temperature matches that of the outflow:
 \begin{equation} \Delta T_{{\rm top}} = \Delta T_{{\rm out}} = \frac {HS_{1}}{{\rho } c_{p} \, \dot {V}} \, . \end{equation}
4. Results
Figure 3 compares the thermal stratifications, via excess air temperature ${\Delta }T = T - T_{6}$
, measured in the six selected experimental cases with the predictions from the AR5B-GW model and from the original model of Gladstone & Woods (Reference Gladstone and Woods2014) (i.e. in which radiation is neglected). The experiments spanned a wide range of conditions (including an order of magnitude variation in ventilation rate and total heat input; see parameters in table 1) and give rise to significant variations in the observed
${\Delta }T = T - T_{6}$
, measured in the six selected experimental cases with the predictions from the AR5B-GW model and from the original model of Gladstone & Woods (Reference Gladstone and Woods2014) (i.e. in which radiation is neglected). The experiments spanned a wide range of conditions (including an order of magnitude variation in ventilation rate and total heat input; see parameters in table 1) and give rise to significant variations in the observed $\Delta T_{{\rm out}}$
(the difference between the temperatures of the incoming and outgoing air) and thermal stratification. The predictions of AR5B-GW successfully capture much of this behaviour. For example, the dashed vertical lines in figure 3 mark the room-averaged excess air temperature,
$\Delta T_{{\rm out}}$
(the difference between the temperatures of the incoming and outgoing air) and thermal stratification. The predictions of AR5B-GW successfully capture much of this behaviour. For example, the dashed vertical lines in figure 3 mark the room-averaged excess air temperature, $\overline {\Delta T}$
, which is broadly linked to the thermal comfort of the occupants (see e.g. Melikov et al. Reference Melikov, Pitchurov, Naydenov and Langkilde2005; Wyon et al. Reference Wyon, Sandberg and Sandberg1993; Möhlenkamp et al. Reference Möhlenkamp, Schmidt, Wesseling, Wick, Gores and Müller2019) – the predictions of AR5B-GW agree relatively well with the experimental data, whilst those from the no-radiation model do not. The top-to-bottom temperature contrast is also well predicted using AR5B-GW. Before discussing the discrepancies in more detail, it is necessary to examine the radiation distribution predicted by AR5B-GW.
$\overline {\Delta T}$
, which is broadly linked to the thermal comfort of the occupants (see e.g. Melikov et al. Reference Melikov, Pitchurov, Naydenov and Langkilde2005; Wyon et al. Reference Wyon, Sandberg and Sandberg1993; Möhlenkamp et al. Reference Möhlenkamp, Schmidt, Wesseling, Wick, Gores and Müller2019) – the predictions of AR5B-GW agree relatively well with the experimental data, whilst those from the no-radiation model do not. The top-to-bottom temperature contrast is also well predicted using AR5B-GW. Before discussing the discrepancies in more detail, it is necessary to examine the radiation distribution predicted by AR5B-GW.
The vertical variation in excess temperatures, ${\Delta }T$
, obtained from the full-scale experimental data (red circles), predicted by the AR5B model (solid blue lines) and predicted by the no-radiation model (solid green lines). Appropriately coloured dashed lines represent the room-averaged excess air temperatures
${\Delta }T$
, obtained from the full-scale experimental data (red circles), predicted by the AR5B model (solid blue lines) and predicted by the no-radiation model (solid green lines). Appropriately coloured dashed lines represent the room-averaged excess air temperatures $\overline {{\Delta }T}$
from the experiments and models. Each panel shows data from one of the six different cases.
$\overline {{\Delta }T}$
from the experiments and models. Each panel shows data from one of the six different cases.

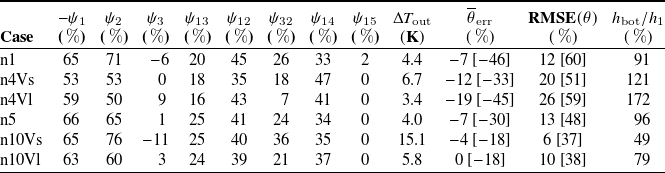
For all six cases, as shown in table 2, AR5B-GW predicts that a large portion of the flux from the heat source is emitted via radiation, $-\psi _{1} ={53}\,\%{-}{66}{\,\%}$
, which lies reassuringly within the range reported in the literature (e.g.
$-\psi _{1} ={53}\,\%{-}{66}{\,\%}$
, which lies reassuringly within the range reported in the literature (e.g. $50\,\%$
to
$50\,\%$
to $70\,\%$
from CIBSE (2016), Deevy et al. (Reference Deevy, Sinai, Everitt, Voigt and Gobeau2008) and Srebric et al. (Reference Srebric, Vukovic, He and Yang2008)). This result is significant because previous models incorporating radiation required this fraction to be specified as a fixed input. Moreover, the table also shows that the AR5B-GW model predicts a net radiation gain at the lower surfaces,
$70\,\%$
from CIBSE (2016), Deevy et al. (Reference Deevy, Sinai, Everitt, Voigt and Gobeau2008) and Srebric et al. (Reference Srebric, Vukovic, He and Yang2008)). This result is significant because previous models incorporating radiation required this fraction to be specified as a fixed input. Moreover, the table also shows that the AR5B-GW model predicts a net radiation gain at the lower surfaces, $\psi _{2} = {50}\,\%{-}{76}{\,\%}$
(consisting of contributions
$\psi _{2} = {50}\,\%{-}{76}{\,\%}$
(consisting of contributions ${\psi }_{12}$
and
${\psi }_{12}$
and ${\psi }_{32}$
), which can be greater than that emitted by the heat source, and indicates that the net radiation gain at the upper surfaces can be negative. The net radiation gain at the lower surfaces is balanced by an equal convective heat flux from the lower surfaces to the lower air layer; see (3.1). As such, the upper surfaces exhibit a small net radiation loss or gain
${\psi }_{32}$
), which can be greater than that emitted by the heat source, and indicates that the net radiation gain at the upper surfaces can be negative. The net radiation gain at the lower surfaces is balanced by an equal convective heat flux from the lower surfaces to the lower air layer; see (3.1). As such, the upper surfaces exhibit a small net radiation loss or gain $\psi _{3} = {-11\,\%}\,\text{to}\,{9}{\,\%}$
. This net radiation exchange leads to an equal and opposite convective heat exchange with the upper layer of air (i.e. the upper surfaces impart a relatively weak, heating or cooling flux to the upper air layer). Note that changes in the direction of radiative exchange (see, for example,
$\psi _{3} = {-11\,\%}\,\text{to}\,{9}{\,\%}$
. This net radiation exchange leads to an equal and opposite convective heat exchange with the upper layer of air (i.e. the upper surfaces impart a relatively weak, heating or cooling flux to the upper air layer). Note that changes in the direction of radiative exchange (see, for example, $\psi _3$
in table 2 for cases n1 and n4V1) therefore influence the convection coefficient, as described in the Appendix A. As discussed in § 3.1, the temperature of the outgoing ventilation flow in a steady state is determined only by the temperature of the incoming ventilation flow, the ventilation flow rate and the total heat input into the room; see (3.3). AR5B-GW also predicts that, in all six cases, the convective heat flux from the heat source to the upper layer,
$\psi _3$
in table 2 for cases n1 and n4V1) therefore influence the convection coefficient, as described in the Appendix A. As discussed in § 3.1, the temperature of the outgoing ventilation flow in a steady state is determined only by the temperature of the incoming ventilation flow, the ventilation flow rate and the total heat input into the room; see (3.3). AR5B-GW also predicts that, in all six cases, the convective heat flux from the heat source to the upper layer, $\psi _{15}$
, is negligible compared with that to the lower layer,
$\psi _{15}$
, is negligible compared with that to the lower layer, $\psi _{14}$
, since
$\psi _{14}$
, since $A_{15} \ll A_{14}$
.
$A_{15} \ll A_{14}$
.
Detailed predictions from the AR5B-GW model for each of the six experimental cases. The dimensionless net radiation gain or loss at each surface, and the transfers between them, are denoted by the corresponding $\psi$
column. The outlet temperature values
$\psi$
column. The outlet temperature values ${\Delta }{T}_{{\rm out}}$
for each case are used to compare model predictions and experimental data in terms of the normalised room-averaged air temperature error,
${\Delta }{T}_{{\rm out}}$
for each case are used to compare model predictions and experimental data in terms of the normalised room-averaged air temperature error, $\overline {{\theta }}_{{\rm err}}$
, and the root mean square error,
$\overline {{\theta }}_{{\rm err}}$
, and the root mean square error, $\textrm {RMSE}({\theta })$
, associated with the temperature profiles (the corresponding error comparisons for the no-radiation model and the experimental data are included in square brackets). Finally, the ratio of the height of the bottom layer and the heat source,
$\textrm {RMSE}({\theta })$
, associated with the temperature profiles (the corresponding error comparisons for the no-radiation model and the experimental data are included in square brackets). Finally, the ratio of the height of the bottom layer and the heat source, $h_{{\rm bot}}/h_{1}$
, is included to aid interpretation of the results (see text).
$h_{{\rm bot}}/h_{1}$
, is included to aid interpretation of the results (see text).

The vertical variation in normalised excess temperatures, $\theta$
, obtained from the full-scale experimental data (red circles), predicted by the AR5B-GW model (solid blue lines) and predicted by the no-radiation model (solid green lines). Appropriately coloured vertical dashed lines represent the normalised room-averaged excess air temperatures
$\theta$
, obtained from the full-scale experimental data (red circles), predicted by the AR5B-GW model (solid blue lines) and predicted by the no-radiation model (solid green lines). Appropriately coloured vertical dashed lines represent the normalised room-averaged excess air temperatures $\overline {{\theta }}$
and the black horizontal dashed lines represent the height of the heat sources.
$\overline {{\theta }}$
and the black horizontal dashed lines represent the height of the heat sources.

Whilst all the AR5B-GW predictions of radiative fluxes from the heat source are physically reasonable and consistent with previous literature, data to enable direct comparison of all the implicit radiative transfers during the experiments are not available. We must instead rely on comparison of temperatures measured in full-scale experiments and those predicted by modelling. Figure 4 shows the profiles of normalised excess air temperature, ${\theta } = (T-T_6)/{\Delta }T_{{\rm out}}$
, which allows for fair comparison of predictions and experiments across the six cases. The predictions of AR5B-GW show good agreement in some cases and more significant discrepancies in others. The results of the no-radiation model show greater discrepancies in all six cases. To further aid interpretation of these data and quantify discrepancies, table 2 presents the differences between normalised room-average excess air temperatures in the experiments (
${\theta } = (T-T_6)/{\Delta }T_{{\rm out}}$
, which allows for fair comparison of predictions and experiments across the six cases. The predictions of AR5B-GW show good agreement in some cases and more significant discrepancies in others. The results of the no-radiation model show greater discrepancies in all six cases. To further aid interpretation of these data and quantify discrepancies, table 2 presents the differences between normalised room-average excess air temperatures in the experiments ( $\overline {\theta }_{{\rm exp}}$
) and the AR5B-GW predictions (
$\overline {\theta }_{{\rm exp}}$
) and the AR5B-GW predictions ( $\overline {\theta }_{{\rm pre}}$
), i.e.
$\overline {\theta }_{{\rm pre}}$
), i.e. $\overline {{\theta }}_{{\rm err}} = \overline {{\theta }}_{{\rm pre}} - \overline {\theta }_{{\rm exp}}$
. The corresponding comparison between the experiments and the predictions of the no-radiation model is also included in square brackets. Discrepancies between the normalised excess air-temperature profiles are characterised in the table by the root mean square error
$\overline {{\theta }}_{{\rm err}} = \overline {{\theta }}_{{\rm pre}} - \overline {\theta }_{{\rm exp}}$
. The corresponding comparison between the experiments and the predictions of the no-radiation model is also included in square brackets. Discrepancies between the normalised excess air-temperature profiles are characterised in the table by the root mean square error $\textrm {RMSE}({\theta }) = \left [(1/H) \int _{z = 0}^{H} ({\theta }_{{\rm pre}} - {\theta }_{{\rm exp}})^{2} \,\text{d}z\, \right ]^{1/2}$
. Across the six cases, in which
$\textrm {RMSE}({\theta }) = \left [(1/H) \int _{z = 0}^{H} ({\theta }_{{\rm pre}} - {\theta }_{{\rm exp}})^{2} \,\text{d}z\, \right ]^{1/2}$
. Across the six cases, in which ${\Delta }T_{{\rm out}}$
varies from
${\Delta }T_{{\rm out}}$
varies from ${3.4} \ \textrm {to}\ {15.1}\,\textrm {K}$
, the average discrepancy for the AR5B-GW predictions is
${3.4} \ \textrm {to}\ {15.1}\,\textrm {K}$
, the average discrepancy for the AR5B-GW predictions is ${-8}{\,\%}$
for the normalised room-averaged excess air temperature,
${-8}{\,\%}$
for the normalised room-averaged excess air temperature, $\overline {{\theta }}_{{\rm err}}$
, and
$\overline {{\theta }}_{{\rm err}}$
, and ${14}{\,\%}$
for the root mean square error,
${14}{\,\%}$
for the root mean square error, $\textrm {RMSE}({\theta })$
. These discrepancies contrast with respective values of
$\textrm {RMSE}({\theta })$
. These discrepancies contrast with respective values of ${-32}{\,\%}$
and
${-32}{\,\%}$
and ${49}{\,\%}$
based on the no-radiation model predictions. There are no cases for which the no-radiation model performs well. As such, hereinafter we focus solely on the results based on predictions using AR5B-GW.
${49}{\,\%}$
based on the no-radiation model predictions. There are no cases for which the no-radiation model performs well. As such, hereinafter we focus solely on the results based on predictions using AR5B-GW.
The results (e.g. figure 4 and table 2) show that the discrepancies in the temperature profiles are greatest when the height of the bottom layer of air is similar to or extends above the height of the source, i.e. $h_{{bot}} \gtrsim h_{1}$
, as is most clear for cases n4Vs and n4Vl. Nevertheless, the top-to-bottom temperature contrast remains well-predicted under both cases. The best agreement is achieved for cases n10Vs and n10VI, for which
$h_{{bot}} \gtrsim h_{1}$
, as is most clear for cases n4Vs and n4Vl. Nevertheless, the top-to-bottom temperature contrast remains well-predicted under both cases. The best agreement is achieved for cases n10Vs and n10VI, for which $\overline {{\theta }}_{{\rm err}} = \{{-4}{\,\%},{0}{\,\%} \}$
and
$\overline {{\theta }}_{{\rm err}} = \{{-4}{\,\%},{0}{\,\%} \}$
and $\textrm {RMSE}({\theta }) = \{ {6}{\,\%}, {10}{\,\%} \}$
, respectively, and
$\textrm {RMSE}({\theta }) = \{ {6}{\,\%}, {10}{\,\%} \}$
, respectively, and $h_{{\rm bot}}/h_{1} \lt {80}{\,\%}$
.
$h_{{\rm bot}}/h_{1} \lt {80}{\,\%}$
.
5. Conclusion
We have developed an analytical approach to allow prediction of the coupled radiative and convective heat transfers within a room. Attention has been focused here on the simplest model representation (referred to as AR5B) required for a leading-order representation of a temperature-stratified room, which incorporates five thermal bodies (the upper and lower room surfaces, upper and lower air volumes and a thermal source). The AR5B model does not require the fraction of the radiative component of heat transfer from any surface or heat source to be prescribed in advance (cf. e.g. Mateus & da Graça Reference Mateus and da Graça2015; da Graça & Linden Reference da Graça and Linden2004), but instead determines these fractions as part of the solution. These heat transfers can then be used in conjunction with a ventilation flow model to mimic the effects of radiation (i.e. without a need for its explicit representation) and predict the thermal stratification within the room. Herein the ventilation flow model was also analytic (employing plume theory to solve for the convective transport; Gladstone & Woods Reference Gladstone and Woods2014), but we note that the AR5B results could be used with any ventilation flow model; for example, computational fluid dynamics solvers.
The predictions from our modelling approach were compared with observational data from six full-scale experiments that span a wide variety of conditions. In all six cases, the predictions of radiative flux from the heat source by the AR5B model are consistent with the range expected from previous literature. Importantly, and in contrast to assumptions of existing approaches, the model predicts that the radiation distribution is vertically asymmetric, i.e. the net radiation gain over the lower surfaces of the room is larger than that over the upper surfaces (where there can even be a net loss in some cases). Finally, the combination of the AR5B model predictions and the simplified ventilation flow model of Gladstone & Woods (Reference Gladstone and Woods2014) yields results that agree well with the observed vertical temperature profiles in the full-scale experiments.
Our findings support the suitability of a low-order representation of the coupled radiative and convective heat transfers in a room together with a simple ventilation flow model as a means of predicting the temperature stratifications in full-scale rooms. Conversely, the predictions from similarly simple ventilation flow models that take no account of radiation typically show significant errors, underscoring the vital need for thermal models of indoor environments to be improved in this respect. The computational cost of solving the AR5B model is insignificant, and hence there are no obvious barriers to this, or similar approaches, becoming more widely used.
The model could be extended to include conductive heat losses, motivated by the finding of Lane-Serff & Sandbach (Reference Lane-Serff and Sandbach2012) that the thermal stratification can be modified as a consequence. The model could also be further extended to account for localised effects within rooms, e.g. thermal plumes generated along the walls when wall temperatures differ significantly from the local air temperature. Future work will involve exploring the sensitivity of radiative heat transfer to indoor parameters (e.g. the surface emissivity of the heat source and room surfaces) using the analytical model.
Data availability statement
Raw data are available from the corresponding author (H.C.B.).
Author contributions
P.G.: conceptualisation, model formulation and writing. G.O.H.: conceptualisation, model formulation, writing and supervision. H.C.B.: conceptualisation, model formulation, writing and supervision.
Funding statement
G.O.H. acknowledges support from the Engineering and Physical Sciences Research Council (grant number EP/V033883/1) as part of the [D*] stratify project.
Competing interests
The authors declare no conflict of interest.
Ethical statement
The research meets all ethical guidelines, including adherence to the legal requirements of the study country.
Appendix A. Parameterisation of the convective heat transfer coefficient
As introduced in § 2.1, the general form of the model requires the convective heat transfer coefficients, $h^{c}_{ij}$
, to parameterise the convection from surfaces
$h^{c}_{ij}$
, to parameterise the convection from surfaces $i \in \mathcal{S}$
to air bodies
$i \in \mathcal{S}$
to air bodies $j \in \mathcal{A}$
. When the sign of characteristic temperature difference,
$j \in \mathcal{A}$
. When the sign of characteristic temperature difference, ${\delta }T_{ij} = T_i - T_j$
and the alignment of the surface and body of air are such that fluid close to the surface remains gravitationally stable, the convective heat transfer coefficient
${\delta }T_{ij} = T_i - T_j$
and the alignment of the surface and body of air are such that fluid close to the surface remains gravitationally stable, the convective heat transfer coefficient $h^{c}_{ij}$
is taken to be zero. In all other cases,
$h^{c}_{ij}$
is taken to be zero. In all other cases, $h^{c}_{ij}$
was evaluated via the associated Nusselt number,
$h^{c}_{ij}$
was evaluated via the associated Nusselt number, $Nu_{ij}$
, characteristic of heat transfer from
$Nu_{ij}$
, characteristic of heat transfer from $i$
to
$i$
to $j$
, according to the relationship:
$j$
, according to the relationship: $h^{c}_{ij} = ({\kappa } Nu_{ij})/L_{i}$
, where
$h^{c}_{ij} = ({\kappa } Nu_{ij})/L_{i}$
, where ${\kappa } = {0.026}\,\textrm {W}\,\textrm {m}^{-1}\,\textrm {K}^{-1}$
represents the thermal conductivity of air at
${\kappa } = {0.026}\,\textrm {W}\,\textrm {m}^{-1}\,\textrm {K}^{-1}$
represents the thermal conductivity of air at ${22}{^\circ {\textrm {C}}}$
and standard atmospheric pressure and
${22}{^\circ {\textrm {C}}}$
and standard atmospheric pressure and $L_{i}$
is a characteristic length scale.
$L_{i}$
is a characteristic length scale.
To assign appropriate correlations for the Nusselt number in terms of the Rayleigh number for surfaces $i = 1, 2$
and
$i = 1, 2$
and $3$
, these surfaces are idealised as the geometries of a cylinder, an upward-facing plate and a downward-facing plate, respectively. The values of relevant Rayleigh numbers were found to fall in the range
$3$
, these surfaces are idealised as the geometries of a cylinder, an upward-facing plate and a downward-facing plate, respectively. The values of relevant Rayleigh numbers were found to fall in the range ${1\times {10}^{7}} \lt Ra_{ij} \lt {1\times {10}^{10}}$
(verified from the simulations a posteriori) and so the relationships
${1\times {10}^{7}} \lt Ra_{ij} \lt {1\times {10}^{10}}$
(verified from the simulations a posteriori) and so the relationships $Nu_{ij} = 0.1 Ra_{ij}^{1/3}$
(for
$Nu_{ij} = 0.1 Ra_{ij}^{1/3}$
(for $i = 1$
based on data for convection from similarly shaped cylinders (Bejan & Kraus Reference Bejan and Kraus2003)) and
$i = 1$
based on data for convection from similarly shaped cylinders (Bejan & Kraus Reference Bejan and Kraus2003)) and $Nu_{ij} = 0.15 Ra_{ij}^{1/3}$
(for
$Nu_{ij} = 0.15 Ra_{ij}^{1/3}$
(for $i = 2 \ \text{and} \ 3$
as appropriate for natural convection from an upward-facing heated horizontal plate and cooled downward-facing plate (Bejan & Kraus Reference Bejan and Kraus2003)) were utilised.
$i = 2 \ \text{and} \ 3$
as appropriate for natural convection from an upward-facing heated horizontal plate and cooled downward-facing plate (Bejan & Kraus Reference Bejan and Kraus2003)) were utilised.
The Rayleigh number, which characterises the propensity for free convection to occur, was defined as $Ra_{ij} = (g {\beta }{\delta }T_{ij}L_{i}^{3})/({\nu }D)$
, where
$Ra_{ij} = (g {\beta }{\delta }T_{ij}L_{i}^{3})/({\nu }D)$
, where $\beta = {3.4\times {10}^{-3}}\,\textrm {K}^{-1}$
is the thermal expansion coefficient of air at
$\beta = {3.4\times {10}^{-3}}\,\textrm {K}^{-1}$
is the thermal expansion coefficient of air at ${22}\,{^\circ \textrm {C}}$
,
${22}\,{^\circ \textrm {C}}$
, ${\nu } = {1.5\times {10}^{-5}}\,\textrm {m}^{2}\,\textrm {s}^{-1}$
is the kinematic viscosity and
${\nu } = {1.5\times {10}^{-5}}\,\textrm {m}^{2}\,\textrm {s}^{-1}$
is the kinematic viscosity and $D = {2.2\times {10}^{-5}}\,\textrm {m}^{2}\,\textrm {s}^{-1}$
is the thermal diffusivity of air. The characteristic temperature differences
$D = {2.2\times {10}^{-5}}\,\textrm {m}^{2}\,\textrm {s}^{-1}$
is the thermal diffusivity of air. The characteristic temperature differences ${\delta }T_{ij}$
for all surfaces are unknown a priori and are solved for within the AR5B model.
${\delta }T_{ij}$
for all surfaces are unknown a priori and are solved for within the AR5B model.
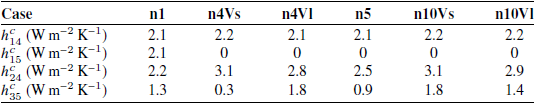
Based on the definitions of the Nusselt number and the Rayleigh number, the convective heat transfer coefficients are expressed as $h^{c}_{ij} = 0.1 {\kappa } (g {\beta }{\delta }T_{ij}/({\nu }D))^{1/3}$
for
$h^{c}_{ij} = 0.1 {\kappa } (g {\beta }{\delta }T_{ij}/({\nu }D))^{1/3}$
for $i = 1$
and
$i = 1$
and $h^{c}_{ij} = 0.15 {\kappa } (g {\beta }{\delta }T_{ij}/({\nu }D))^{1/3}$
for
$h^{c}_{ij} = 0.15 {\kappa } (g {\beta }{\delta }T_{ij}/({\nu }D))^{1/3}$
for $i = 2$
and
$i = 2$
and $3$
. It is worth noting that the results for the heat transfer coefficients are independent of the choice of the length scale
$3$
. It is worth noting that the results for the heat transfer coefficients are independent of the choice of the length scale $L_{i}$
– an assumption that is valid for sufficiently high Rayleigh number. The values taken herein for the convective heat transfer coefficients are detailed in table A1.
$L_{i}$
– an assumption that is valid for sufficiently high Rayleigh number. The values taken herein for the convective heat transfer coefficients are detailed in table A1.
Convective heat transfer coefficients of the six cases for which full-scale experimental data are available.


 Open access