


Introduction
Right‐wing populist (RWP) movements have been on the rise in many Western democracies over the last decade, resulting in electoral victories by right‐wing parties in numerous countries (Akkerman et al. Reference Akkerman, Lange and Rooduijn2016). Examples are the National Rally in France, the Alternative for Germany (AfD), the Sweden Democrats and the Party for Freedom in the Netherlands. However, the rise of RWP movements is not confined to the parliamentary arena. There has been extensive street mobilization by RWP movements voicing concerns on behalf of ‘the people’ and denouncing the political establishment. Movements like Pegida (short for Patriotic Europeans Against the Islamization of the Occident) in Germany, Reclaim Australia and the alt‐right movement in the United States have organized numerous demonstrations marked by anti‐immigrant and anti‐minority sentiments.Footnote 1
At the same time, other segments of civil society, including leftist groups and centre‐left political parties, have formed counter‐movements – movements mobilized against another movement (Lo Reference Lo1982: 118)Footnote 2 – and have taken to the streets to confront RWP supporters. The large demonstrations organized by the Sardines movement against right‐wing and extremist tendencies in Italy made the headlines in November 2019. As recent events in Portland illustrate, direct confrontations between RWP supporters and their opponents can end in clashes and violence.Footnote 3
Whereas individual support and voting for right‐wing populist parties (Van Hauwaert & Van Kessel Reference Van Hauwaert and Van Kessel2018; Gidron & Hall Reference Gidron and Hall2020) and their impact on party systems (Mudde Reference Mudde2013) are relatively well‐researched, we know less about RWP movements.Footnote 4 Scholars have only recently begun to study the emergence of contemporary RWP movements from a social movement perspective, following the rise of right‐wing protest rallies (Rucht Reference Rucht, Rosenberger, Stern and Merhaut2018; Caiani Reference Caiani2019; Gattinara & Pirro Reference Gattinara and Pirro2019).
We contribute to this growing line of research by analyzing the relationship between countermovement activities and the dynamics of RWP street mobilization. Understanding the interaction between RWP movements and their opponents is of theoretical and practical importance given diverging expectations among activists and scholars. On one side, some view RWP movements as a threat to liberal democracy and claim that joining anti‐populist rallies is important to challenge their claims to represent ‘the people’ (Boone et al. Reference Boone, Secci and Gallant2018). On the other, previous research on movement–countermovement dynamics has shown that activities by opposing movements can lead to a reinforcing mobilization dynamic (Inclán Reference Inclán2012; Banaszak & Ondercin Reference Banaszak and Ondercin2016).
Existing theories of political protest do not agree on how counter‐mobilization affects protest movements. In the literature, two lines of argument can be identified. According to the expected utility/cost (Opp Reference Opp1986; Muller et al. Reference Muller, Dietz and Finkel1991; Finkel & Muller Reference Finkel and Muller1998) or logic of ‘collective efficacy’ (Lee Reference Lee2010), countermovements should discourage RWP supporters. They reduce the likelihood that policymakers will back RWP demands as parts of the population visibly oppose them. RWP supporters recognize that continuous protests are not paying off; the movement loses its appeal to bystanders and support for the movement declines. The emotion/identity logic (Goodwin et al. Reference Goodwin, Jasper and Polletta2009; Alimi et al. Reference Alimi, Bosi and Demetriou2015; Snow Reference Snow, Stekelenburg, Roggeband and Klandermans2013), in contrast, stipulates that clashes and standoffs between opposing movements elicit emotional reactions that facilitate identity‐building and increase group solidarity, thus encouraging the mobilization of core supporters. Expanding on previous work, we describe how these opposing logics yield diverging observable implications during the three phases that are common to each protest cycle – onset, heightened contention and demobilization (Tarrow Reference Tarrow1993: 287).
To test which theoretical approach better explains the effect of counter‐mobilization on RWP movements, we conduct one of the first quantitative analyses of protest dynamics at the city level for one of the largest RWP movements in Western Europe: the Pegida movement in Germany. During its peak periods in January 2015 and autumn 2016, the movement attracted thousands of participants in numerous cities all across Germany. At the same time, broad civil society coalitions formed and opposed Pegida supporters in the streets (Marg et al. Reference Marg, Trittel, Schmitz, Kopp and Walter2016; Vorländer et al. Reference Vorländer, Herold and Schäller2018). We leverage a new event dataset, the Pegida Protest Action Database (PEGPAD), which is based on German regional newspapers and records key characteristics such as participant numbers and violence for protest events on both sides. The dataset covers 90 major cities between the first emergence of the movement in late 2014 and 2017. Our main findings are that anti‐Pegida protests are unrelated to the onset of Pegida protest, but that larger counter‐demonstrations are associated with larger subsequent Pegida protests, and that violent counter‐demonstrations reduce the likelihood of demobilization.
Our study adds a new perspective to the growing research field on right‐wing populism by studying the dynamics of populist street mobilization and countermovements using new data. Moving beyond explaining the emergence of RWP movements, we offer one of the rare systematic attempts to assess the effectiveness of strategies to counter them. While counter‐demonstrations might still affect public discourse about and politicians’ responses to RWP mobilization, we show that they are unlikely to contain the movement itself. Violence against RWP supporters is particularly counter‐productive in this regard. Our study emphasizes the relevance of emotions and group identity for our theoretical understanding of movement–countermovement interactions. Narrow expected utility and costs approaches do not appear to provide a sufficient explanation for the mobilization dynamics of RWP movements.
Research on RWP movements and counter‐mobilization
Within the broad field of social movement studies, scholars mainly focused on leftist and progressive movements, while only a subfield looked at conservative and right‐wing groups (see Lo [Reference Lo1982] and Blee & Creasap [Reference Blee and Creasap2010] for overviews). One reason was that rallies and demonstrations were more common activities among the left and less common among the right (Hutter & Kriesi Reference Hutter, Kriesi, Stekelenburg, Roggeband and Klandermans2013). Following the recent shift from left to right in protest politics (Hutter & Borbáth Reference Hutter and Borbáth2019), a new line of research focusing on RWP movements from the perspective of social movements has emerged (Caiani Reference Caiani2019; Gattinara & Pirro Reference Gattinara and Pirro2019). For example, Caiani et al. (Reference Caiani, Della Porta and Wagemann2012) compare action repertoires, discursive frames and organizational structures of the extreme right in Germany, Italy and the United States. They highlight the prevalence of anti‐modernism, racism, anti‐capitalism and authoritarianism in extreme‐right discourses and actions. Karpantschof and Mikkelsen (Reference Karpantschof and Mikkelsen2016) trace activities by the radical right in Denmark and Pirro et al. (Reference Pirro, Pavan, Fagan and Gazsi2019) investigate the social networks of collective actors in the Hungarian Jobbik movement. Despite this emerging new research on RWP mobilization, we know little about the interaction between RWP movements and their opponents.
This lack of scholarly attention can be explained by the fact that, historically, most countermovements were conservative movements opposing progressive social forces. Among other things, they sought to maintain the political exclusion of minorities (Mottl Reference Mottl1980; Andrews Reference Andrews2002), opposed more liberal abortion policies (Rohlinger Reference Rohlinger2002) or the introduction of same‐sex marriage (Dorf & Tarrow Reference Dorf and Tarrow2014). Existing scholarship holds that countermovements emerge in response to social movements that challenge the distribution of power in society. To prevent the loss of existing privileges, the challenged group forms a countermovement (Meyer & Staggenborg Reference Meyer and Staggenborg1996). This explains why, above all, well‐organized and affluent social groups such as business elites or religious organizations organize countermovements (Mottl Reference Mottl1980; Meyer & Staggenborg Reference Meyer and Staggenborg1996; Reynolds‐Stenson & Earl Reference Reynolds‐Stenson and Earl2018).
As Blee and Creasap (Reference Blee and Creasap2010: 271) put it, ‘rightist movements tend to be known for what they are against, not for what they support’. Today, the situation is somewhat reversed: the political (far) right is challenging established policies (e.g., the right of asylum, minority rights) and (centre‐)left civil society organizations are counteracting these claims. Well‐known examples include the women's marches in the United States since 2017 and the Sardines movement in Italy in 2019. These countermovements were motivated by populists’ repeated violations of democratic norms, their radical discourse and their attempts to exclude minority groups. Interestingly, countermovements are often not initiated by the RWP movements’ main targets, such as refugees and other minority groups. Instead, the broader civil society protests are in solidarity with those targeted by RWP movements (Passy Reference Passy, Giugni and Passy2001).
Opposing movements constantly influence each other on different levels. Movements adapt their strategy in response to demands and tactical choices from the other side (Mottl Reference Mottl1980; Meyer & Staggenborg Reference Meyer and Staggenborg1996; Fetner Reference Fetner2005). For instance, white supremacists copied slogans from the civil rights movement (Blee & Creasap Reference Blee and Creasap2010: 271). As shown by work on pro‐ and counter‐Zapatista protests in Mexico (Inclán Reference Inclán2012) and the women's movement in the United States (Banaszak & Ondercin Reference Banaszak and Ondercin2016), the mere protest activity of one side influences mobilization on the other side. However, we do not know how countermovements affect RWP mobilization. As we show below, the literature allows for diverging expectations. To shed light on the consequences of counter‐mobilization, we contribute a new dataset on RWP protest in Germany and offer a city‐level analysis of mobilization dynamics.
The consequences of counter‐mobilization
In recent years, RWP movements have been successful in mobilizing large numbers of citizens in Western countries by emphasizing the potential threats posed by immigrants and refugees and denouncing the political establishment (Caiani Reference Caiani2019). In response, other parts of civil society have mobilized against RWP movements to defend the political culture and democratic norms (Roth Reference Roth2018). A key characteristic of this recent protest wave in response to the ‘refugee crisis’ is the direct interaction between RWP supporters and their opponents in the streets. One main goal for the counter‐demonstrators today is ‘not to leave the street to the right’. In many U.S. cities, clashes between rival groups erupted, and in Germany, countermovements repeatedly blocked the protest routes of the right. Therefore, we focus our discussions on the premise that the two protest camps are demonstrating at the same time, a common feature of today's protest arena.
How do such counter‐mobilization efforts affect RWP movements? As we argue, there are plausible theoretical arguments for an effect in line with an expected utility/cost or efficacy logic and an identity/emotions logic. We discuss both approaches separately below before linking their implications to the different stages of the protest cycle.
Expected utilities and cost logic
A prominent strand in the social movement literature highlights citizens’ expected utilities to explain individual protest participation (Opp et al. Reference Opp, Hartmann and Hartmann1989; Finkel & Muller Reference Finkel and Muller1998). Given that taking part in protests incurs costs, for example, the time spent at the event, travel costs and the like, individuals need to find participation rewarding. Besides selective material or non‐material incentives such as entertainment (Olson Reference Olson1971; Muller & Opp Reference Muller and Opp1986), people are more likely to participate in protests if they see high chances for the movement to succeed and think that their participation makes a difference (Finkel & Muller Reference Finkel and Muller1998). According to this logic, factors that make protest participation more costly or reduce the likelihood of movement success should have a dampening effect on mobilization.
For the potential supporters of an RWP movement, counter‐mobilization can increase participation costs in RWP protests in two ways. First, large‐scale countermovements express societal disagreement with the demands put forward by RWP movements. Politicians observe that a significant number of citizens do not support the movement's cause and they update their beliefs about the salience of its issues. In addition, countermovements reveal that RWPs do not represent the ‘silent majority’, as they often claim. It serves as a signal that leads to the delegitimization of RWP supporters’ ideas and demands. This dynamic makes it less likely that RWP movements are successful in the political arena, which in turn makes it difficult to mobilize supporters beyond the core group as people do not want to spend their time on a lost cause (Lichbach Reference Lichbach1998).
Second, counter‐mobilization does not always remain peaceful. Violence increases participation costs, and risk‐averse RWP supporters will stay at home if they fear attacks by counter‐demonstrators. Similar to state repression, violent counter‐mobilization could lead to deterrence. For instance, only a few alt‐right activists joined a march intended to celebrate the first anniversary of the Charlottesville incidents in Washington on 11 August 2018. Jason Kessler, one of the leading figures in the extremist ‘alt‐right’ movement, justified the low turnout with the number of counter‐protesters and the related fear of being attacked when protesting.Footnote 5 In short, countermovements reduce individuals’ expected utility from participation in RWP rallies and should thus be associated with lower turnout and fewer mobilization events as potential supporters do not join the public protests.
It is important to note that the cost argument does not apply to the core group of RWP supporters. Their social network consists of like‐minded people so that participation in RWP activities is not punished by their peers (Blee & Creasap Reference Blee and Creasap2010). On the contrary, core supporters will be rewarded when they champion the group's goal in difficult times. This dynamic is well‐known from other non‐RWP activist groups, such as the LGBT community (McClendon Reference McClendon2014).
Identity and emotions logic
A second prominent line of research in the study of social movements focuses on the role of emotions and identities in protest behaviour (Jasper Reference Jasper2011; Pearlman Reference Pearlman2013; Snow Reference Snow, Stekelenburg, Roggeband and Klandermans2013; Van Stekelenburg & Klandermans Reference Van Stekelenburg and Klandermans2013; Alimi et al. Reference Alimi, Bosi and Demetriou2015). These approaches emphasize the interactions between actors and their socio‐psychological consequences. Participation at protest events triggers emotional reactions that affect the subsequent mobilization processes. In line with this work, we argue that countermovements may facilitate future RWP mobilization. Encounters between opposing movements lead to boundary formation (Alimi et al. Reference Alimi, Bosi and Demetriou2015) or boundary activation (Tilly & Tarrow Reference Tilly and Tarrow2015: 36), understood as the ‘creation of “us–them” distinctions between two political actors’ (Alimi et al. Reference Alimi, Bosi and Demetriou2015: 287). Interactions between protesters and counter‐protesters often involve heated debates with mutual insults and, in some cases, acts of violence. The shared experience of such interactions connects activists and produces collective identities, which are powerful tools for future mobilization (Snow Reference Snow, Stekelenburg, Roggeband and Klandermans2013: 267). Following this logic, counter‐protests deepen societal polarization and motivate RWP supporters (and the countermovement) to double their efforts.
Violence against activists may also strengthen solidarity among activists, leading to the reinforcement of RWP protests. The feeling of defending the movement when exposed to external attacks can draw a group closer together (De Dreu et al. Reference De Dreu, Gross, Méder, Giffin, Prochazkova, Krikeb and Columbus2016). RWP protesters may perceive violent attacks by counter‐protesters as proof of their feeling of being discriminated against by the establishment and being morally superior (Jasper Reference Jasper1998; Pearlman Reference Pearlman2013). Violence against their protests acts as a self‐fulfilling prophecy that further strengthens the identity and commitment of followers by creating the feeling of being the voice of the oppressed majority (Jasper Reference Jasper1998). As a result of these interactions with the countermovement, RWP protesters will remain active on the streets to defend their group's interests against external attacks. Existing empirical research on movement‐countermovements interaction finds support for this mutual reinforcing mobilization dynamic between movements (Inclán Reference Inclán2012; Banaszak & Ondercin Reference Banaszak and Ondercin2016).
However, these effects will be limited to those who have participated in an RWP protest and for whom interaction with the countermovement leads to “emotional energy” (Jasper Reference Jasper2011: 287). In contrast, potential supporters are more likely to be deterred by violent clashes with counter‐demonstrators. This works, of course, only under the assumption that they are rather risk‐averse and do not consciously seek a violent confrontation. In summary, direct interactions with countermovements will increase the motivation of RWP activists already mobilized, while violent confrontations with counter‐protesters will deter potential supporters of the RWP movement.
Effects of countermovements during the protest cycle
Every protest cycle goes through different phases: protest onset, protest intensity and protest disruption (Tarrow Reference Tarrow1993: 287). Following the theoretical considerations above, we assume that counter‐mobilization affects the course of RWP protest during these different phases in a probabilistic, not deterministic way. Table 1 gives an overview of our empirically testable expectations.
Theoretical expectations how counter‐mobilization affects RWP mobilization during the three protest stages
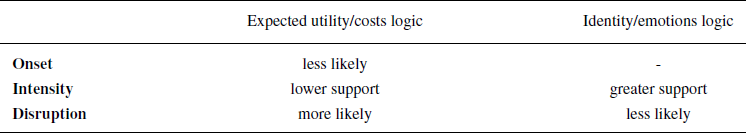
A protest cycle starts with protest onset, defined as the first RWP protest in a given location. How does counter‐mobilization affect the onset of RWP protest? According to the expected utility/cost logic, a mass‐based countermovement credibly demonstrates that civil society is able and willing to resist a potential RWP movement. Early counter‐mobilization indicates high costs for RWP supporters to organize rallies and low chances of being successful. Moderates might shy away from supporting the RWP movement and mobilization fails overall. Preventive counter‐mobilization should thus reduce the likelihood of RWP protest onset in a given city. The identity/emotions logic does not suggest such an effect as both sides have not, so far, interacted during simultaneous demonstrations. Therefore, counter‐protests are unlikely to influence any RWP in‐group dynamics at this early stage. The identity/emotions logic thus predicts a null effect at this stage of the protest cycle.
Following initial mobilization, protest cycles can develop in different ways: While in some cases a growing number of activists are mobilized over a sustained period of time, the number of protest participants decreases rapidly in other cases (Tarrow Reference Tarrow1993; Tilly & Tarrow Reference Tilly and Tarrow2015). Therefore, protest intensity, understood as the size of RWP mobilization events in terms of participant numbers over time, can vary as a result of counter‐mobilization. According to the expected utility/costs logic, a large‐scale countermovement increases participation costs for moderate supporters and bystanders, particularly if the countermovement is larger than the original one. We should therefore observe a gradual decline in support for RWP protests following large counter‐demonstrations. Less engaged RWP supporters realize that the likelihood of achieving policy change is low and stop dedicating their time to participation in RWP activities. What remains are the movement's core supporters, usually a small group. The identity/emotions logic suggests that the interaction between movement and countermovement leads to boundary formation and collective identity building, facilitating future RWP mobilization. Counter‐mobilization thus triggers protest competition in the streets. Violent attacks on RWP supporters and the related moral outrage and anger in the RWP movement will even increase the commitment and public support of their followers (Hirsch Reference Hirsch1990; De Dreu et al. Reference De Dreu, Gross, Méder, Giffin, Prochazkova, Krikeb and Columbus2016). Consequently, we should see a strong commitment of the RWP movement's core supporters.
Each protest movement eventually ceases its activities. Disruption or demobilization describes the moment when RWP movements do not carry out protest actions for a certain time period. In line with the expected utility/costs logic, strong counter‐demonstrations reduce the likelihood of movement success and demobilization should be more likely. According to the identity/emotions logic, counter‐protests should prolong RWP protests due to strengthened identities and emotions that emerge from street encounters between both movements. While we expect support to decrease in numbers over time, the core RWP supporters gain their motivation and energy for future protests from these encounters.
Pegida in Germany, 2014–2017
To test our theoretical expectations, we focus on Pegida in Germany, one of the biggest RWP movements in Europe. The movement started as a private Facebook group, which was founded on 11 October 2014 to discuss the growing perception that Germany has become the centre of religious conflict. As later justified by the founder and spokesperson of Pegida, Lutz Bachmann, one trigger event was a demonstration by Kurds in Dresden and a growing number of reports of ethnically and religiously motivated violence by foreigners in German cities (Vorländer et al. Reference Vorländer, Herold and Schäller2018). Soon afterwards, on 20 October 2014, the group organized its first event under the ‘Pegida’ label (short for Patriotic Europeans Against the Islamization of the Occident) in Dresden. This demonstration was the first of numerous protests in Dresden and the movement rapidly spread beyond Eastern Germany. Pegida offshoots sprang up in numerous cities in Germany (e.g., Düsseldorf, Leipzig), but also abroad (e.g., Netherlands, Austria, Norway) (Vorländer et al. Reference Vorländer, Herold and Schäller2018; Berntzen & Weisskircher Reference Berntzen and Weisskircher2016). While many local branches stopped their activities after a short time, Pegida remained active in Dresden over the following years.
Pegida protests followed a particular sequencing of actions. This ritualized way of protesting started with a first round of speeches to assemble the crowd and to stir up emotions; followed by an ‘evening stroll’ through the city to demonstrate mass support for their cause; and finally, a last round of speeches at a predefined location to imbue participants with a feeling of belonging. In addition to this blueprint for Pegida protests, the movement made reference to established and well‐known protest rituals in (Eastern) Germany. The protests took place on Mondays, and thus followed the tradition of the 1989 Monday demonstrations against the SED (Socialist Unity Party of Germany) regime and the Hartz IV protests in 2002, which were directed against a broad social and economic reform package (Patton Reference Patton2017). Pegida's main slogan, ‘We are the people’ (Wir sind das Volk!), was also a reference to former protest against the socialist regime in Eastern Germany, which lasted until 1989. The Pegida offshoots aimed to follow the same routine – speeches, evening stroll, speeches. However, in many cities, counter‐demonstrators were able to prevent the evening stroll and thus deprived the movement of one of its peculiarities (Marg et al. Reference Marg, Trittel, Schmitz, Kopp and Walter2016).
Most of Pegida's claims centered around a change in asylum and security policies (e.g., decentralized housing for refugees, an increase in the police budget) (Vorländer et al. Reference Vorländer, Herold and Schäller2018: 12–18). However, many participants joined the protests for other reasons. Participant surveys in Dresden showed that around 71 per cent of respondents said that dissatisfaction with politics had been their motive to participate in the demonstration, and 34 per cent of respondents expressed ‘criticism of the media and public discourse’. Only 31 per cent named fundamental reservations about immigrants and asylum seekers, and 10 per cent the rejection of religious or ideological violence as motives for joining the Pegida protests (Vorländer et al. Reference Vorländer, Herold and Schäller2018: 88). Most participants were driven by a general dissatisfaction with the political system and published opinion, while only a minority was motivated by fear of immigrants and refugees or religiously motivated violence.
A look at the background characteristics of Pegida demonstrators shows that Pegida was able to mobilize support from the middle classes. A typical Pegida protester is a middle‐class man in his late 40s, employed, with an income slightly above average, well‐educated, and neither a church member nor a party member (Vorländer et al. Reference Vorländer, Herold and Schäller2018).Footnote 6 Nevertheless, only a few non‐representative surveys were conducted among anti‐Pegida demonstrators in various German cities between April and August 2015. The available information shows similarities and differences between Pegida demonstrators and the anti‐Pegida demonstrators. Both are well‐educated and in full‐time employment. The average anti‐Pegida demonstrator, however, is in his early 30s, slightly younger than the Pegida demonstrator (Marg et al. Reference Marg, Trittel, Schmitz, Kopp and Walter2016: 16–18).
Empirical approach
In order to analyze the dynamics between Pegida and its opponents systematically, we compiled the Pegida Protest Action Database (PEGPAD). It contains precise information about the timing and location of protest activities organized by the Pegida movement and its opponents in all 90 major cities in Germany.Footnote 7 PEGPAD records all events between October 2014, when the first Pegida demonstrations emerged in Dresden, and ends in January 2018.
To obtain information about protest and counter‐protest activities, we relied on digitized articles from regional and local newspapers recorded in the online database GBI‐Genios wiso. The database provides access to articles from 88 German newspapers with a regional scope.Footnote 8 Regional newspapers are more suitable than national outlets, as the latter tend to under‐report events that occur outside major news cycles (Oliver & Myers Reference Oliver and Myers1999) or are not newsworthy enough to merit national coverage.
We retrieved a set of potentially relevant articles for each city using a keyword search, automatically deleted duplicate entries based on text similarity and assigned the final set of 20,463 news articles to research assistants.Footnote 9 The research assistants manually checked every article, identified protest events and recorded relevant information about protest events following a detailed codebook.Footnote 10 Each data entry in PEGPAD is an event report. For example, the anti‐Pegida demonstrations in Berlin on 19 January 2015, were mentioned in 17 different news reports, resulting in one entry for each report. We retain information at the report‐level to incorporate diverging information in news reports following Cook and Weidmann (Reference Cook and Weidmann2019). For our empirical analysis below, we aggregate the reports at the event‐level by summarizing all reports about activities on the same day in the same city.Footnote 11 In total, PEGPAD contains more than 2,500 event reports about 700 protest events. In many cases, we record multiple event reports for a single event. Out of all events, we identify 326 protest actions with a total of about 337,000 participants by Pegida and related organizations, and 387 events (521,000 participants) against Pegida.Footnote 12
Our event definition includes all observable collective activities that aim to support or oppose the Pegida movement itself or its goals within clearly identifiable spatial and temporal boundaries. This definition excludes protest announcements, individual statements or interviews, and private meetings. We also do not record events that have no explicit connection to the Pegida movement. However, we do include demonstrations by organizations that do not carry the movement's suffixFootnote 13 but sympathize with Pegida's goals, such as Wir sind Deutschland (We are Germany). We do not count marches by supporters of the radical right‐wing party AfD, which officially opposed all types of cooperation with Pegida until early 2018 (Grabow Reference Grabow2016). For each protest event in accordance with our definition, we record the timing, the affiliation (pro‐ or anti‐Pegida), participant numbers, participating organizations and levels of violence during the event.
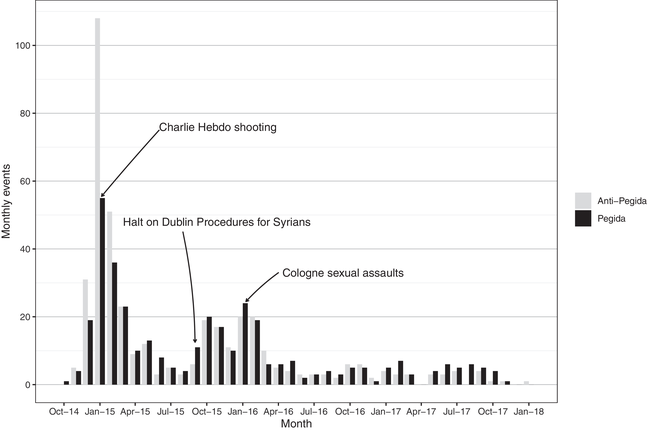
Figure 1 shows the development of protest events on both sides from the first Pegida demonstration in 2014 until the end of 2017. The chart indicates that there were three major waves of Pegida protests and counter‐demonstrations. The first wave took off after the founding of the movement in Eastern Germany at the end of 2014 and the Charlie Hebdo shooting in France in January 2015. The second protest wave started in late 2015 with the influx of large numbers of refugees into Germany and the third peaked after the sexual assaults in Cologne on New Year's Eve 2016, allegedly committed by immigrants. After mid‐2016, we observe only occasional mobilization.Footnote 14 Mobilization activities by opposing movements follow a very similar trajectory over time, with more than 100 events all over Germany, with January 2015 being the high point of counter‐mobilization.
Number of monthly protest events organized by the Pegida movement (black bars) and countermovements (grey bars) in Germany between October 2014 and January 2018.
Research design
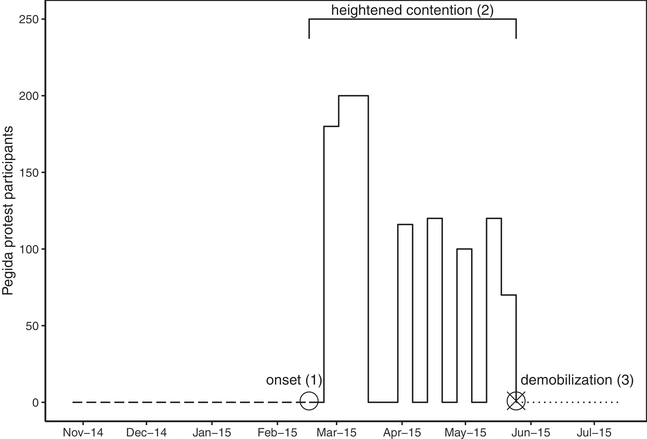
The PEGPAD allows for a fine‐grained analysis of the relationship between counter‐mobilization and Pegida mobilization at the local level and the three stages of the protest cycle: protest onset, protest intensity and demobilization (Tarrow Reference Tarrow1993: 287). Our approach is illustrated in Figure 2 for the city of Karlsruhe with real data from the PEGPAD. We focus on three main outcomes in our analysis. First, we look at the onset of Pegida protest in all 90 cities in our sample after the first demonstration in Dresden in October 2014. Similar demonstrations took place in some but not all cities during the period of investigation. Thus, we want to know how counter‐demonstrations are related to Pegida onset (1). Did they prevent Pegida protests from spreading to a particular city?
Research design. Outcomes of interest for the city of Karlsruhe; Pegida protest onset (1), intensity during episode of heightened contention (2), and disruption/demobilization (3).

Second, we analyze the interaction between Pegida and its opponents during the episode of heightened contention (2). Our focus is on two aspects of counter‐mobilization efforts: size (participant numbers) and intensity (incidents of violence). Are counter‐demonstrations of different kinds related to more or less participation at Pegida events? To this end, we examine variation in participant numbers at Pegida events within so‐called protest spells, understood as the period between protest onset (1) to demobilization (3).
Third, we investigate how counter‐demonstrations affect the temporal disruption or demobilization (3) of the Pegida movement. Put simply, we evaluate if counter‐demonstrations increase the likelihood that Pegida stops protesting. For each of the three outcomes of interest, Pegida onset, protest intensity and demobilization (see Figure 2), we set up the data in a different format and employ multiple statistical models to estimate the effect of counter‐mobilization.
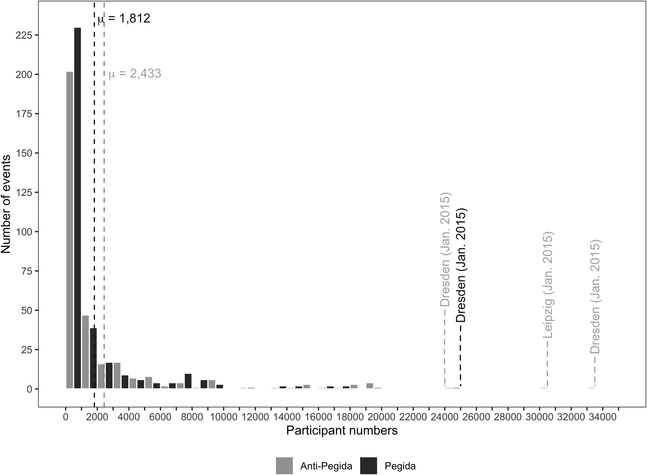
Our explanatory variables capture key features of counter‐mobilization in line with the theoretical expectations outlined above: occurrence, size and violence. In our analysis of Pegida onset, the explanatory variable is a count of counter‐demonstrations in the same city prior to Pegida's first appearance. For the analysis of intensity and disruption, we focus on the size of counter‐demonstrations and levels of violence by counter‐protesters. To illustrate the data used in the empirical analysis, Figure 3 shows the distribution of participant numbers on both sides. According to our data, the majority of events were rather small, with less than 1,000 participants. However, we observed a small number of very large events, for instance, in Dresden and Leipzig in January 2015. While both groups mobilized a comparable number of supporters, the anti‐Pegida movement staged the largest rally (Dresden, 26 January 2015) and has slightly higher participant numbers on average (2,443 vs. 1,812). Our data also shows the high level of interactions between both movements. Out of 369 anti‐Pegida demonstrations, 290 took place in the same city and on the same day as pro‐Pegida demonstrations and can be understood as direct counter‐mobilization events.
Distribution of participant numbers at Pegida (black bars) and anti‐Pegida events (grey bars), and average participant numbers (dashed lines).

When it comes to violence by counter‐protesters, the majority of counter‐demonstrations were peaceful. PEGPAD records the levels of violence by actors on both sides as a categorical variable with values from nonviolence to the use of force against counter‐demonstrators and police officers. Our data shows that 83 per cent of counter‐demonstrations were nonviolent. However, in 17 per cent of the cases, counter‐demonstrators attacked Pegida supporters. For instance, in Frankfurt, Düsseldorf and Nuremberg, counter‐demonstrators hurled bottles and other objects at Pegida supporters. Pegida supporters were involved in violent incidents in about 12 per cent of the recorded events. Additional summary statistics at the event‐level are available in Table A.1 in the Online Appendix.
Methods and results
In the following, we analyze how counter‐mobilization is related to the Pegida protest cycle. This section is divided according to the three protest stages as each stage requires varying data structures, different measurements of the dependent variable and statistical models. We discuss each analysis, including robustness checks, in the subsequent subsections.
Protest onset
The onset of Pegida demonstrations in a given city is the main dependent variable in the first part of our analysis. We aggregate the protest events in PEGPAD at the city‐week levelFootnote 15 and identify those weeks in which one or more Pegida demonstrations occurred (320 city weeks). We then build a dataset, in which we keep all cities up to the point where the first incident of Pegida mobilization took place. Put differently, after the initial Pegida demonstrations in October 2014, all major cities in German enter what is termed the ‘risk’ set in event history analysis (Box‐Steffensmeier & Jones Reference Box‐Steffensmeier and Jones1997: 1422). Once we observe Pegida demonstrations in a certain city, the city is excluded for the rest of the observation period as we are interested in explaining the onset of mobilization and not protest recurrence.
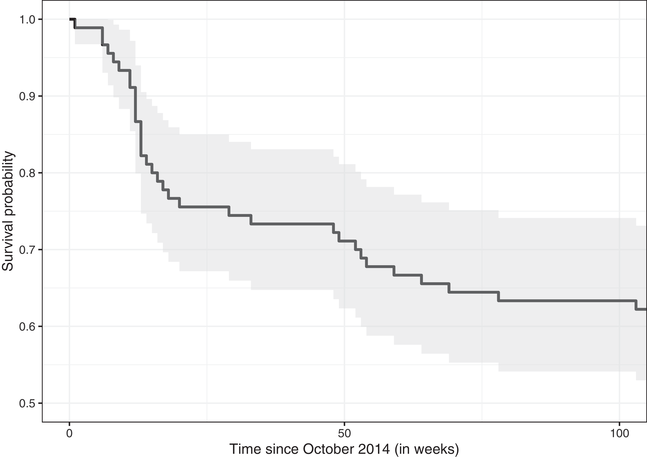
Figure 4 depicts the onset of Pegida demonstrations in major German cities over time. Survival probability in this context refers to the probability of not experiencing a Pegida demonstration. Throughout the full observation period, we observe Pegida demonstrations in slightly more than one‐third of all major cities. As already shown in Figure 1, the movement gained momentum in early 2015 after the Charlie Hebdo shootings and again in the wake of the ‘refugee crisis’ in September 2015. Based on this data structure, we conduct a survival or event history analysis (Therneau & Grambsch Reference Therneau and Grambsch2000) to investigate if counter‐mobilization reduced the likelihood of Pegida onset. We chose the widely used Cox regression model with time‐varying covariates as it does not require the parameterization of the baseline hazard (Box‐Steffensmeier & Zorn Reference Box‐Steffensmeier and Zorn2001: 974). Our explanatory variables are (1) the cumulative number of anti‐Pegida events, that is, the sum of all previous anti‐Pegida demonstrations in the same city, and (2) the occurrence of one or more anti‐Pegida demonstrations in the previous month. We use lagged independent variables to make sure that the simultaneous occurrence of the first Pegida demonstration and a counter‐demonstration does not affect the results. The dependent variable is the onset of Pegida demonstrations in a particular city‐week. Out of all 387 anti‐Pegida events, our dataset records a total of 47 demonstrations against Pegida that took place before the Pegida movement's first demonstration in a given city.
Kaplan–Meier survival curves for Pegida protest onset in major cities in Germany. Y‐axis cut off at 0.5 to improve readability.

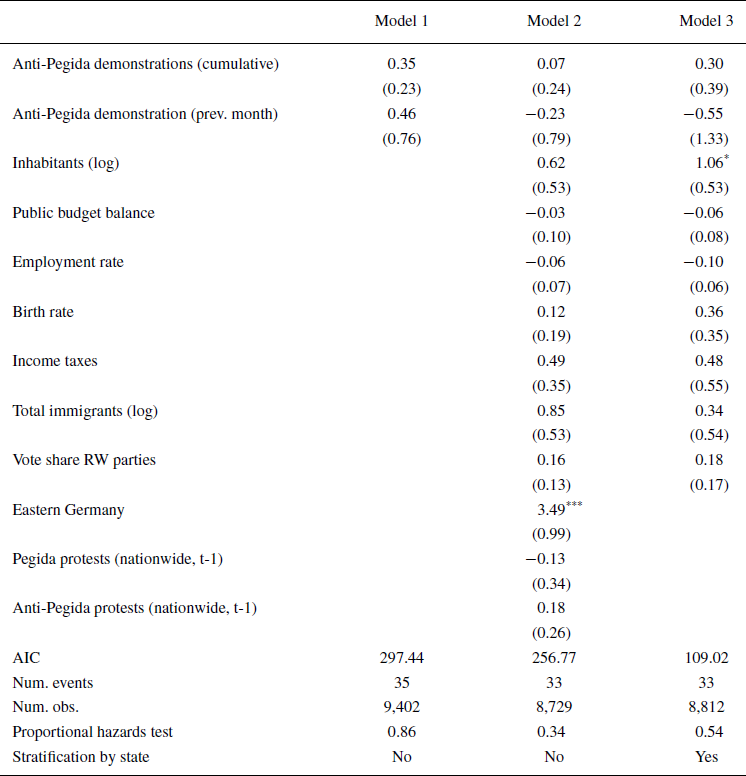
The results from the Cox regression models are summarized in Table 2. A positive coefficient indicates an increase in the probability of Pegida onset. Model 1 includes only our main variables of interest and the coefficients indicate a positive association between anti‐Pegida demonstrations and the occurrence of Pegida demonstrations. However, the relationship is not statistically significant.
Relationship between counter‐mobilization and RWP onset. Cox proportional hazard models with time‐varying covariates. Unit of analysis: city‐week
Significance levels: ***p < 0.001; **p < 0.01; *p < 0.05; †p < 0.1.
Model 2 takes into account several potential confounding variables at the city level. Socio‐political context factors can affect both the occurrence of counter‐demonstrations and Pegida demonstrations. For instance, larger and poorer cities might be more likely to experience Pegida demonstrations, which, in turn, might encourage anti‐Pegida activists to mobilize early on. We control for demographic factors such as city size (number of inhabitants), the absolute number of immigrants and birth rate, as well as economic factors such as public budget balance, local employment rates and tax revenues from income tax. All data comes from the Bertelsmann Foundation (Wegweiser Kommune Footnote 16). We also include a dummy variable for cities that were part of the former German Democratic Republic (Eastern Germany) to control for historical political divides within Germany. In addition, we control for the vote share for right‐wing parties in a given city in the last national elections (2013) as a higher vote share for right‐wing parties indicates a broader acceptance of right‐wing ideology in the population.Footnote 17 Finally, we include the number of anti‐ and pro‐Pegida demonstrations in the entire country to account for potential diffusion effects. While the coefficients change noticeably in Model 2, there is no significant effect. In Model 3, we stratify by federal state to account for common regional historical developments and cluster the standard errors at the city‐level. The results remain unchanged. Models 2 and 3 show no statistically significant effect for counter‐demonstrations on the likelihood that Pegida protests begin in a given city.
We run a series of robustness checks to increase confidence in our results (Online Appendix Table A.4). Instead of a binary measure of anti‐Pegida demonstrations, we use their absolute number in the previous month. Moreover, we use binary logistic regression and rare events logistic regression with city fixed effects to show that the results are robust to alternative modelling choices. These models also include time trends and nationwide numbers of protest activity. None of the models suggests a statistically significant effect of ‘preventive’ counter‐mobilization. We are well aware of the difficulties of identifying null effects (Rainey Reference Rainey2014) and acknowledge that the absolute number of such ‘preventive’ counter‐demonstrations is small. Nevertheless, the size and significance of the estimated coefficients do not speak for an effect of counter‐mobilizations on the likelihood of RWP protest onset.
Protest intensity
Next, we investigate the relationship between counter‐demonstrations and the intensity of Pegida protests. Intensity is measured as the number of participants at Pegida events.Footnote 18 We aggregate protest characteristics at the weekly level and build a panel with city‐weeks as the unit of analysis. We then look at how multiple characteristics of counter‐demonstrations in the current week affect turnout at Pegida demonstrations in the subsequent week. Only city‐weeks in which Pegida protests occurred are included in the analysis.
We run two types of models: (1) pooled models in which all observations are treated as independent and (2) models with spell fixed effects.Footnote 19 More precisely, the latter model class leverages variation within protest spells, defined as the period from onset to the disruption of Pegida protests for an entire month.Footnote 20 Alternative thresholds to define the endpoint of a spell are discussed in the final part of the analysis. The spell fixed effects approach safeguards our results against confounding factors at the city‐level, such as the number of inhabitants or a city's socio‐economic composition. The reference group is the same city at a different time point of the protest cycle. A scatterplot illustrating the relationship between the two variables can be found in the Online Appendix (Figure A.1).
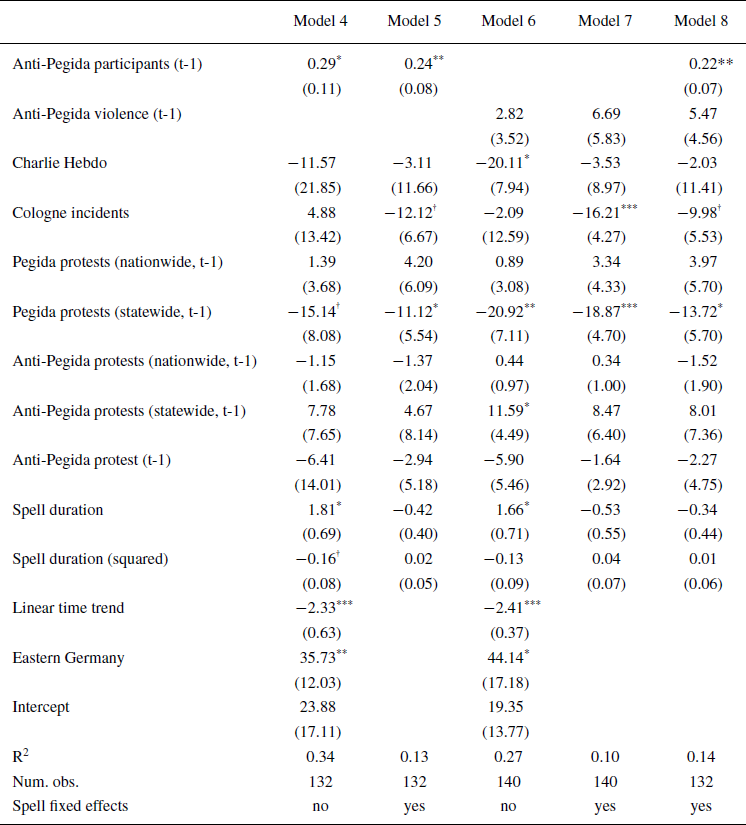
The main results from the linear panel models (Croissant & Millo Reference Croissant and Millo2008) with Pegida participant numbers as the dependent variable are displayed in Table 3. We look at two different characteristics of anti‐Pegida protest events: size in terms of participant numbers (Models 4 and 5), levels of violence (Models 6 and 7) and both combined (Model 8). As there might be other factors that determine participant numbers on both sides, we include a series of control variables. In the pooled model, we add a dummy variable to flag cities in Eastern Germany to account for important cultural and economic differences within Germany. We also add a linear time trend to control for the temporal distance to the first Pegida demonstration in October 2014, assuming that the natural course of a protest cycle is a decline over time. Moreover, we account for the different phases within a given protest spell by including the time since the beginning of each spell as well as its squared term. The current phase (increasing conflict, decline) could affect mobilization efforts on both sides.
Relationship between counter‐mobilization and RWP intensity. Linear panel models with Arellano‐type standard errors. Unit of analysis: city‐week
Significance levels: ***p< 0.001; **p < 0.01; *p < 0.05; †p < 0.1.
A binary variable indicates the occurrence of anti‐Pegida protests as we want to avoid the participant number variable merely picking up the (non‐)occurrence of counter‐demonstrations. In addition, we flag the eight weeks after the Charlie Hebdo shooting in France (7 January 2015) and the sexual assaults in Cologne (31 December 2015) using a binary indicator. Although both events are exogenous factors, their salience could affect mobilization intensity in different ways on both sides. Finally, we add information on the overall number of mobilization events of both movements at the country‐level and the state‐level to account for mobilization trends and regional diffusion patterns.
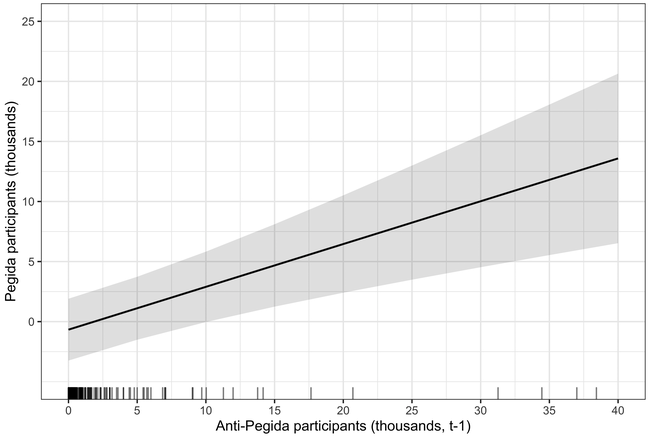
The first two models in Table 3 show the effect of the size of anti‐Pegida demonstrations in the previous week on the number of Pegida protesters (Models 4 and 5): larger counter‐demonstrations are associated with significantly larger subsequent Pegida demonstrations. The models point to moderate effect sizes. One hundred more participants at an anti‐Pegida demonstration in a given city are associated with an increase of around 25 to 30 participants at the next Pegida demonstration. In contrast to expectations raised by the utility/costs approach, large counter‐demonstrations are associated with a higher turnout by Pegida sympathizers (see Figure 5 for a visualization of the model results).
Marginal effect of anti‐Pegida protest size on intensity (based on Model 5). Shaded areas represent 95% confidence intervals, and rugs show the distribution of the independent variable.

Models 6 and 7 are about the levels of violence at previous anti‐Pegida events measured as the maximum level of violence ranging from the absence of violence to physical attacks against Pegida supporters and the police. Events without any information on violence in media reports are treated as nonviolent since violence has high news value, particularly for local and regional newspapers. We thus assume that violence would have been reported had it occurred. Yet the use of violence in anti‐Pegida protests shows no statistically significant effect on the size of future RWP mobilization. Including both variables in the model (Model 8) yields the same results.Footnote 21
We complement this part of the analysis with robustness checks (Online Appendix Table A.5) to account for uncertainty around participant numbers and violence in news reports. We use the minimum and maximum participant numbers mentioned in the news reports about the same events and get comparable results. We also take the logarithm of participants on both sides to control for potential outliers and find similar results. Instead of the maximum values of anti‐Pegida violence, we use the median of violence. Finally, we control for violence committed by Pegida supporters to reduce concerns that we pick up radicalization tendencies within the movement. The main results, however, are in line with the findings discussed.
Protest disruption
In the final part of the analysis, we investigate the relationship between counter‐mobilization and the demobilization or disruption of Pegida's protest activities. To identify the endpoints of protest spells, we flag all city‐weeks that were not followed by another Pegida protest for an entire month. We use the threshold of one month to make sure that we do not interpret short breaks in Pegida mobilization as disruption. The results from additional analyses using a two‐week and an eight‐week threshold are reported in Online Appendix Table A.6 (Models A14 and A15). As Figure 2 shows for the case of Karlsruhe, after the end of May 2015, there were no further events for more than a month, which leads us to set the endpoint to the last week where a Pegida march was observed. These endpoints represent instances of demobilization defined as the process in which ‘[…] people who are making claims stop doing so’ (Tilly & Tarrow Reference Tilly and Tarrow2015: 38). In other words, we ask if counter‐mobilization makes it more likely that Pegida supporters stop organizing protest events.
For this final series of models, we use conditional logistic regressions in which the disruption of Pegida protest (yes or no) is the dependent variable. Several key characteristics of counter‐mobilization are used as predictors. As in the previous part of the analysis, we control for highly salient events, national trends and regional diffusion patterns. The conditional logistic regressions take into account time‐invariant city‐specific confounding variables such as population size and prosperity. The results are summarized in Table 4. Again, we focus on the size of anti‐Pegida protests and the use of violence against Pegida supporters as main independent variables.
Relationship between counter‐mobilization and RWP demobilization. Conditional logistic regression models with clustered standard errors
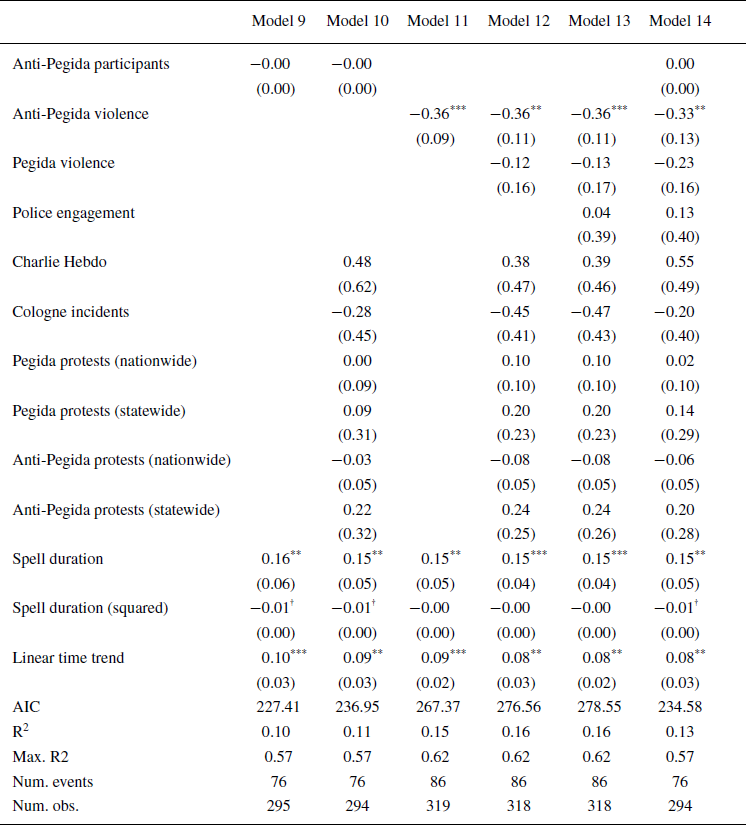
Significance levels: ***p < 0.001; **p < 0.01; *p < 0.05; †p < 0.1.
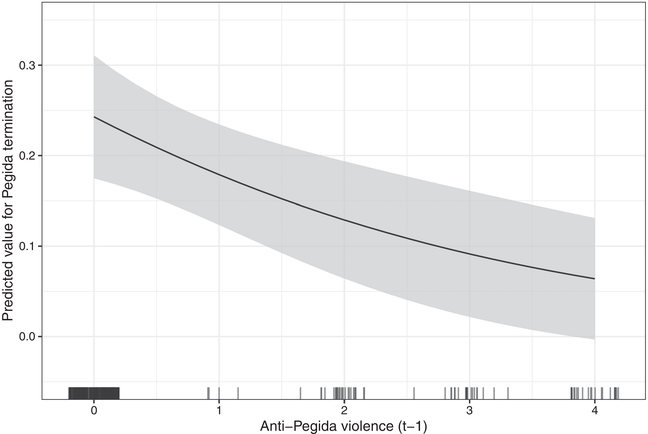
In contrast to the analysis of protest intensity, participant numbers do not affect Pegida's disruption (Models 9 and 10). Yet the results show that violence against Pegida supporters significantly reduces the probability that Pegida stops protesting (Models 11–13). This finding can be seen as support for the identity/emotions logic: Violence triggers emotions and strengthens group identities that are instrumental for individuals’ motivation to organize collective action. This result holds when we control for violence by Pegida supporters (Model 12) and police engagement against Pegida supporters (Model 13), and when we include both independent variables in the same model (Model 14).Footnote 22 As Figure 6 shows, violence against Pegida supporters cuts the likelihood of demobilization by more than half. In cases without violence by counter‐demonstrators, there is a 24 per cent chance that Pegida stops protesting. When Pegida supporters were attacked, this number is as low as 5 per cent.
Marginal effect of violence at counter‐demonstrations on the disruption of RWP protest (logistic regression based on Model 13). Shaded areas represent 95% confidence intervals, and rugs show the distribution of the independent variable.

In our robustness checks (Online Appendix Table A.6), we use different operationalizations of participant numbers and violence as reported in the media and find similar results. We also include information on the identity of counter‐protesters as it might matter which groups mobilize against Pegida. We check for the presence of civil society actors, representatives from political institutions, churches, left‐wing associations and political parties. We find no differences except that the presence of faith representatives (including mostly Christian but also Muslim and Jewish groups) seems to reduce the probability of protest disruption.
Discussion & conclusion
In this study, we provided one of the first systematic analyses on the effectiveness of counter‐protests in containing RWP movements during different phases of the protest cycle. Drawing on previous work, we identified two different ways in which counter‐protests can influence RWP protests: negatively by increasing participation costs for RWP protests, and positively through collective identity building, polarization (boundary formation) and ‘emotional energy’. Using novel event data on street protests around the German Pegida movement (2014–2017), we found no evidence for a preventive effect of counter‐demonstrations; larger counter‐protests are associated with more turnout at subsequent Pegida protests, and violence against Pegida supporters reduces the likelihood that the movement stops mobilizing.
Our observational study found robust correlations for these relationships when controlling for city‐level and event‐level confounders. However, we are cautious about claiming that our results are sufficient evidence for a causal relationship. The dynamics of movement‐countermovement interactions are complex and push the boundaries of existing statistical approaches to isolate the effect of a single element during episodes of contention.Footnote 23 In addition to the challenge of unobserved confounding, it is almost impossible to find exogenous sources of variation in counter‐demonstrations that do not affect the RWP movement at the same time. However, we have ruled out many alternative explanations by including information about past mobilization, trigger events and several city‐level factors. We also used protest spell fixed effects at the city level to ensure that we do not pick up variation between cities going beyond existing protest event analyses. While our empirical material is limited to the German case, we are confident that similar dynamics are at work in other Western democracies, given that the basic setup of opposing movements mobilizing simultaneously is a common phenomenon.
Implications for activists
What do our results imply for those who treat right‐wing populist movements as a threat to democracy? At first sight, one can interpret our analysis as evidence for the impotence of counter‐protests against RWP movements. However, while we do show that counter‐demonstrations are unlikely to contain RWP mobilization, they might still be effective in other respects. First, counter‐demonstrations may undermine the cohesion of local RWP movements in the long run, as right‐wing communities often consist of several competing groups (Rucht Reference Rucht, Rosenberger, Stern and Merhaut2018; Caiani & Della Porta Reference Caiani, della Porta and Rydgren2018). Counter‐protests may lead to a split of these networks over the best response strategies or over the decision where to invest the movement's resources in conducting future protests despite counter‐protests.Footnote 24
Second, we have focused on protest events and neglected the broad range of potential nonviolent strategies to counter RWP movements. Yet movements like the ‘Grab Your Wallet campaign’ in the United States and in other countries use economic boycotts as a strategy to counter right‐wing populists (Sombatpoonsiri Reference Sombatpoonsiri2018). These strategies may be more effective than counter‐protests, but they do raise other ethical concerns. The use of alternative nonviolent strategies ultimately harbours a similar dilemma, which is that counteracting them could make the situation worse by igniting polarization between different groups in society.
Third, we know that politicians respond to the dynamics of street protest (Wouters & Walgrave Reference Wouters and Walgrave2017). Counter‐demonstrations call into question the legitimacy of RWP supporters’ political demands and thus limit their effectiveness in the political arena. Politicians who rely on support from social groups that participate in counter‐demonstrations might benefit from clearly rejecting RWP demands.
Finally, countermovements are a strong sign of solidarity and support for those who have been discriminated against or defamed by RWP movements. Countermovements thus fulfil an important function for society, since they show visible support for marginalized groups and therefore contribute to a better social climate. Testing these and other potential consequences of counter‐mobilization goes beyond the scope of this study and has to be left for future research.
Still, our findings indicate that counter‐protests might not be efficient in stopping RWP movements from mobilizing street support. We find that they increase the intensity of, and prolong, RWP mobilization. This applies in particular to violent counter‐protests. Therefore, one important lesson to learn from this study is that civil society should favour nonviolent over violent strategies.
Acknowledgements
We would like to thank Alexander De Juan, Roman Krtsch, Anna Lührmann and the participants at the MPSA 2019, the NEPS 2019, the research colloquia at the ISGA Leiden University, the University of Osnabrück and the University of Konstanz, the V‐Dem lunch seminar series and the GEPOP morning meeting at the University of Gothenburg. We are grateful to our research assistants Jakob Gilg, Janina Greiner, Jonas Schmid and Peter Windsheimer at the University of Konstanz for their help with the data collection. We thank the Bertelsmann Foundation for sharing their data. Hellmeier acknowledges support from the Vetenskapsradet [Grant 2018–016114, PI: Anna Lührmann] and the European Research Council [Grant 724191, PI: Staffan I. Lindberg].
Open access funding enabled and organized by Projekt DEAL.
WOA Institution: UNIVERSITAET DUISBURG‐ESSEN
Blended DEAL: Projekt DEAL
Online Appendix
Additional supporting information may be found in the Online Appendix section at the end of the article:
Figure A.1: Relationship between participant numbers at anti‐Pegida events and participant numbers at subsequent Pegida demonstration by region.
Figure A.2: Intensity.
Figure A.3: Demobilization.
Table A.1: Summary statistics for selected variables at the event‐level.
Table A.2: Full list of regional newspapers available at GBI‐Genios wiso (visit https://www.wiso‐net.de/ for more information.)
Table A.3: Full list of all major cities in Germany in PEPGAD.
Table A.4: Robustness checks.
Table A.5: Robustness checks.
Table A.6: Robustness checks.
Supporting Information


 Open access