

INTRODUCTION
Bluetongue (BT) is a disease of ruminants caused by bluetongue virus (BTV), an arthropod-borne virus which is spread between its hosts by the bites of Culicoides midges. Once regarded as a tropical and subtropical disease, the range of BT has increased considerably in recent years extending into northern Europe [Reference Purse1–Reference Wilson and Mellor3]. BTV serotype 8 (BTV-8) was first reported in The Netherlands in 2006 and throughout that year spread to Germany, Belgium, France and Luxembourg [Reference Saegerman, Berkvens and Mellor2, Reference Elbers4]. In 2007 BTV-8 re-emerged in the previously affected countries and spread into new areas including Great Britain (GB) [5]. Inactivated vaccines against BTV-8 became commercially available in early 2008 and vaccination programmes were initiated in most affected countries. The success of vaccination varied from country to country but where uptake was high, vaccination appears to have been largely effective in controlling transmission of BTV-8 [Reference Wilson and Mellor3]. In particular, GB, which began a voluntary vaccination programme in May 2008, has reported no new cases of BTV-8 infection since 2007. While the precise reason for the lack of subsequent BTV cases in GB is unclear, conditions for disease introduction (circulation of disease on the continent and winds suitable for the transport of infected midges to GB) and transmission (appropriate temperatures) were favourable during 2008 [Reference Burgin, Gloster and Mellor6]. It is therefore reasonable to assume that vaccination played a major role in preventing the re-occurrence of BTV-8 in GB.
Vaccination programmes against BTV-8 were all implemented reactively, i.e. once an outbreak had occurred. This was primarily a consequence of the unexpected nature of the original incursion [Reference Wilson and Mellor3, Reference Mintiens7] and the lack of a suitable vaccine [Reference Wilson and Mellor3]. It is, however, possible to conceive of using vaccine in a pre-emptive manner (i.e. prior to an outbreak), where there is the risk of an incursion of BTV (e.g. the presence of BTV in a neighbouring region) and a vaccine is available. Before implementing such a strategy it is important to assess the consequences of pre-emptive vaccination for an incursion of BTV and to compare this with alternative reactive strategies. In this paper we present such a comparison of pre-emptive and reactive vaccination against an incursion of BTV-1. This serotype had spread northwards in Europe through Spain and Portugal during 2007 and 2008, and by 2008 was circulating in northern France [Reference Wilson and Mellor3, Reference Vandenbussche8] and, hence, posed a risk to UK livestock via windborne dispersal of infected vectors [Reference Burgin, Gloster and Mellor6, Reference Gloster9, Reference Gloster10].
To assess different vaccination strategies against BTV and their ability to control the spread of disease we used a stochastic spatially explicit model of BTV transmission within and between farms [Reference Szmaragd11, Reference Szmaragd12] to evaluate different scenarios for the deployment of vaccine in the event of an introduction of BTV into GB. Specifically, we compared pre-emptive and reactive strategies in terms of their impact on: (i) the probability of an incursion resulting in an outbreak (i.e. secondary spread from the initial incursion); and (ii) outbreak size (both the number of holdings and spatial extent of spread). The impact of vaccination was assessed for different incursion dates and a range of levels of vaccine uptake by farmers. We also assessed the sensitivity of the conclusions to assumptions about the shape of the transmission kernel (i.e. the probability of transmission between farms) and vaccine efficacy.
METHODS
Modelling framework
Details of the model used to describe the transmission of BTV within and between farms can be found in Szmaragd et al. [Reference Szmaragd11]. A summary of the model is provided below.
(i) Within-farm transmission was described by a stochastic model which includes two host species (cattle and sheep) and a single vector species. Parameter estimates, applicable to GB where possible, were obtained from the literature. Temperature-dependent functions were used for the reciprocal of the time interval between blood meals (related to the biting rate), the vector mortality rate and the duration of the extrinsic incubation period (EIP). The duration of viraemia in hosts was described by a gamma distribution with point estimates for the parameters. Other parameters were sampled from appropriate ranges for each farm.
(ii) Spread between farms was described by a stochastic, spatially explicit farm-level model with a daily time step in which the probability of transmission depends on the distance between farms and the host species composition of the farms. The distance dependence was described by a generic transmission kernel which includes both host movements and vector dispersal. Parameters for the transmission probability were estimated using data from the 2006 outbreak in northern Europe. Unless otherwise stated, the best-fit Gaussian kernel was used [Reference Szmaragd11].
Incursion of BTV-1 into GB
The model was initialized by the introduction of infectious vectors to a single farm via the windborne dispersal of vectors from northern France. The risk of incursion was assessed using the UK Met Office's atmospheric dispersion model NAME (numerical atmospheric-dispersion modelling environment) [Reference Jones, Borrego and Norman13]. This model has been adapted to incorporate the effects of meteorology on the flight of Culicoides midges [Reference Burgin14] based on the results of field and laboratory studies carried out by the Institute for Animal Health (C. Sanders, personal communication). The model was used to calculate the number of occurrences of winds suitable for midge transport from four sites on the northern coast of France (Brittany, Lower Normandy, Upper Normandy, North Calais) to each county in southern England over the period May–October for the years 2006–2008. These sites were chosen as the most likely sources of windborne infected Culicoides due to their proximity to GB. While no data were available on the abundance of Culicoides at these sites, BT cases have been reported in the region indicating the presence of competent vectors. The results of the NAME analysis were used to quantify the relative frequency of potential introduction events to each county. The introduction site for the simulations was chosen by selecting a county at random based on these weightings and selecting a random farm within that county.
Vaccination
Vaccination was assumed to act by reducing the probability of transmission from vector to host (b), by lowering the probability that an animal acquires infection, and from host to vector (β) owing to reduced virus titres in infected, vaccinated animals. The probabilities decreased linearly over time from their baseline values (b, β) at the time of vaccination to their minimum values [b(1 − ε), β(1 − ε), where ε is the vaccine efficacy] at full protection [Reference Szmaragd12]. The vaccine was assumed to be 100% efficient unless stated otherwise. The time to full protection was assumed to be 14 days post-vaccination in sheep and 42 days in cattle based on information supplied by the vaccine manufacturers. The model assumes that there is no reduction in the duration of viraemia in infected vaccinated animals. The total number of vaccine doses used (one per sheep and two per bovine) is recorded but is assumed not to be limiting.
Data
The location and livestock populations (numbers of cattle and sheep) on each holding were obtained from the June agricultural survey data for 2006. Hourly temperature records for 2007 were extracted from the MIDAS database accessed from the British Atmospheric Data Centre (BADC) [15] for each of the 19 meteorological stations used in the model [Reference Szmaragd11].
Scenarios
Thirteen vaccination scenarios were considered in order to investigate the impact of different strategies on the spread of BTV in GB (see Table 1). Scenario 1 represented a baseline in which no vaccine was used. Scenarios 2–7 described reactive vaccination strategies. Reactive vaccination was simulated in response to the detection of infected premises. A farm was identified as infected if an animal died due to disease or if overt clinical signs were observed in at least one animal [Reference Szmaragd11]. Unvaccinated farms within a specified radius of an infected holding were vaccinated with probability given by the uptake level of reactive vaccine, and all cattle and sheep on the holding were assumed to be vaccinated. Farms were vaccinated in a random order, commencing 2 days after the detection of the infected farm, to account for the time taken to confirm the diagnosis of BT, and at a constant number of farms per day, such that all farms were vaccinated within 21 days [Reference Szmaragd12]. The number of farms vaccinated per day may vary depending on the number of farms in proximity to the infected farm. This is consistent with the fact that BT vaccination is carried out by farmers and, hence, the rate is not limited by the availability of specialist teams. Three radii (20, 50, 100 km) and two levels of uptake (80%, 95%) were considered.
Details of vaccination scenarios included in the analysis. Each scenario was simulated for incursions on 1 May, 1 July and 1 September
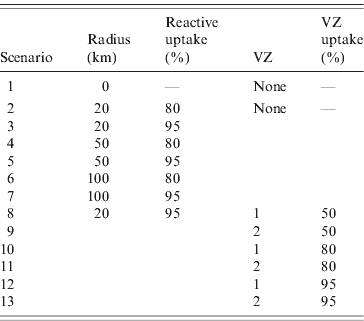
VZ, Vaccination zone.
Scenarios 8–13 described pre-emptive vaccination strategies in which vaccine was used prior to the introduction of BTV-1 into GB. Vaccination was based on the declaration of a vaccination zone (VZ). Farms within the zone were vaccinated with probability given by the level of vaccine uptake. Vaccination commenced on 1 April and occurred at a constant number of farms per day such that all farms to be vaccinated were vaccinated within 21 days. Three levels of uptake (50%, 80%, 95%) and two different zones (Fig. 1) were considered. The consideration of an additional lower level of uptake (50%) for the pre-emptive scenarios reflects the possibility that farmers may be less likely to vaccinate when the perceived risk of disease is low. The first zone (VZ 1) was made up of the eight counties on the south coast of England regarded as at risk of an introduction of BTV-1. The second zone (VZ 2) consisted of the 25 counties south of a line extending from the mouth of the Severn in the west to the Wash in the east. In each of these scenarios additional reactive vaccination was simulated (as described above) in a 20-km zone around clinically affected premises with 95% uptake.
Vaccination zones for bluetongue virus serotype 1 (BTV-1). Shaded areas indicate the counties (listed) within the zone. (a) Zone 1 based on the counties at risk of a windborne incursion of BTV-1. (b) Zone 2 which includes all counties south of a line extending from the mouth of the Severn in the west to the Wash in the east.

For each scenario, simulations were run for three introduction dates (1 May, 1 July, 1 September) until 31 December. For each scenario sufficient replicates of the model were run to generate 30 outbreaks (defined as any spread from the initially infected farm). Those replicates where secondary spread did not occur were discarded. This approach ensures that sufficient outbreaks were simulated to produce robust results. The number of replicates is not specified in advance; rather it follows a negative binomial distribution.
Sensitivity analysis
Sensitivity analysis was conducted to assess the impact of vaccine efficacy (ε) and the shape of the transmission kernel on the predicted impacts of vaccination. Vaccine efficacy was allowed to vary between 50% and 100% in 10% increments. Four kernels were used: Gaussian; exponential; fat-tailed (all with parameter estimates obtained using data on farms clinically affected by BTV-8 in northern Europe in 2006 [Reference Szmaragd11]); and, the kernel estimated from the 2001 outbreak of foot-and-mouth disease (FMD) in GB [Reference Chis Ster and Ferguson16, Reference Chis Ster, Singh and Ferguson17].
The following vaccination strategies were simulated for each kernel assuming 100% efficacy: (i) no vaccination; (ii) reactive vaccination uptake of 95% over a radius of 20, 50 or 100 km; (iii) 80% vaccine uptake in either VZ 1 or VZ 2 with reactive vaccination uptake of 95% over a radius of 20 km. The following strategies were simulated for each value of efficacy using the Gaussian kernel: (i) reactive vaccination uptake of 95% over a radius of 20, 50 or 100 km; (ii) 80% vaccination in VZ 1 with reactive vaccination uptake of 95% over a radius of 20 km. A total of 48 scenarios were considered, full details of which are provided in Table S1 of the Supplementary material. All scenarios were simulated for incursions on 1 May and 1 July.
Statistical analysis
The probability of an incursion resulting in an outbreak was analysed using generalized linear models (GLM) with quasi-binomial errors (to account for overdispersion) and a logit link function. Outbreak sizes (number of affected farms) were compared using GLM with negative binomial errors and a log link function. Model construction proceeded by stepwise deletion of non-significant (P < 0·05) terms starting from an initial model including date of incursion and choice of VZ as categorical predictors, and level of vaccine uptake in the VZ, radius for reactive vaccination and uptake of reactive vaccine as continuous predictors, together with pairwise interactions between all factors. The analysis was performed in the statistical programming language R [18].
RESULTS
Incursion of BTV-1 into GB
All counties on the south coast of England were found to be at risk, with the eastern-most counties (Kent and Sussex) at greatest risk and Cornwall at the lowest risk (Table 2). Based on these results the relative frequency of potential introduction events for each county was estimated (Table 3), and these were used when simulating incursions.
Occurrences of wind events suitable for the transport of Culicoides midges from northern France to each county on the south coast of England
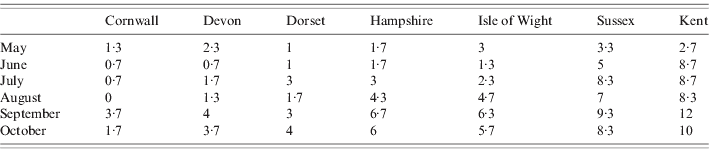
Counties are listed from west to east. Values represent the mean number of events per month from all sites in the years 2006–2008 .
Relative frequencies of winds that could carry infected midges from northern France to the counties on the south coast of England, estimated from the NAME analysis

NAME, Numerical atmospheric-dispersion modelling environment.
East Sussex and West Sussex are represented as separate counties in the epidemiological model and are assumed to be at equal risk of an introduction of bluetongue virus.
Probability of an outbreak
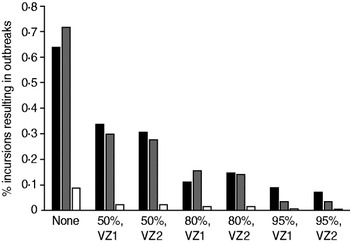
The proportion of incursions which resulted in an outbreak in the absence of vaccination and for each pre-emptive vaccination scenario is shown in Figure 2. The probability of an outbreak was reduced by increased vaccine uptake in the VZ [odds ratio (OR) 0·969, 95% CI 0·966–0·972, P < 0·001] but neither the size of the VZ nor the use of reactive vaccination had a significant effect on the likelihood of an outbreak (not shown). Incursions in September generated a significantly lower proportion of outbreaks than in May (OR 0·047, 95% CI 0·032–0·070, P < 0·001) and July (OR 0·055, 95% CI 0·036–0·081, P < 0·001).
Probability of an outbreak of bluetongue virus under different pre-emptive vaccination scenarios: ▪, May incursions; ![]() , July incursions; □, September incursions. Labels indicate the vaccine uptake (%) and choice of zone. Results are based on the number of replicates of the model required to generate 30 outbreaks (defined as any spread from the initially infected farm).
, July incursions; □, September incursions. Labels indicate the vaccine uptake (%) and choice of zone. Results are based on the number of replicates of the model required to generate 30 outbreaks (defined as any spread from the initially infected farm).
Spatial and temporal dynamics
The predicted spatial spread and time-course of BTV infection in the absence of vaccination is shown in Figure 3. Incursions on each date result in some spread of BTV with later incursions resulting in fewer affected farms across a smaller area of GB. All vaccination strategies result in smaller outbreaks and less spatial spread (Figs 4 and 5; cf. Fig. 3). The impact of reactive vaccination is particularly evident in early incursions with larger radii resulting in smaller outbreaks (Fig. 4). Incursions into a vaccinated population, supplemented by a reactive strategy, result in smaller outbreaks than with a reactive strategy alone (Fig. 5; cf. Fig. 4a, b) with higher levels of uptake producing greater reductions in both the number of affected farms and the spatial spread (Fig. 5).
[colour online]. Predicted spatial distribution and epidemic time-course of bluetongue virus serotype 1 (BTV-1) in Great Britain in the absence of vaccination for an incursion on 1 May (a, b), 1 July (c, d) or 1 September (e, f). The maps show the proportion of outbreaks (out of 30) for which at least one farm was affected by BTV-1 within each 5-km grid square. The time-courses show the number of affected farms on each day of the simulation: – – –, median; —, 25th and 75th percentiles; · · · · · ·, 2·5th and 97·5th percentiles of 30 outbreaks.

[colour online]. Predicted spatial distribution and epidemic time-course of bluetongue virus serotype 1 (BTV-1) with reactive vaccination. Results presented are for incursions on 1 May with 95% reactive vaccine uptake within 20 km (a, b), 50 km (c, d) or 100 km (e, f) of infected premises. The maps show the proportion of outbreaks (out of 30) for which at least one farm was affected by BTV-1 within each 5-km grid square. The time-courses show the number of affected farms on each day of the simulation: – – –, median, —, 25th and 75th percentiles; · · · · ·, 2·5th and 97·5th percentiles of 30 outbreaks.

[colour online]. Predicted spatial distribution and epidemic time-course of bluetongue virus serotype 1 (BTV-1) for incursions into a vaccinated population. Results presented are for incursions on 1 May with uptake of 50% (a, b), 80% (c, d) or 95% (e, f) in zone 2 and 95% reactive vaccine uptake within 20 km of infected premises. The maps show the proportion of outbreaks (out of 30) for which at least one farm was affected by BTV-1 within each 5-km grid square. The time-courses show the number of affected farms on each day of the simulation: – – –, median, —, 25th and 75th percentiles; · · · · · ·, 2·5th and 97·5th percentiles of 30 outbreaks.

Outbreak size
The size of an outbreak (defined as total number of affected farms) under each vaccination scenario is shown in Figure 6a for an incursion in May. Similar patterns were observed for simulated incursions in July (see Supplementary Fig. S1). Incursions in September (see Supplementary Fig. S2) produced significantly smaller outbreaks (P < 0·001).
Number of (a) affected farms, (b) infected animals, (c) dead animals, (d) vaccine doses used in different scenarios for incursions on 1 May. Labels indicate the vaccine uptake and (i) choice of zone or (ii) radius of reactive vaccination. Bars show the median, boxes show the lower and upper quartiles, whiskers show 1·5 times the interquartile range and open circles indicate outlying values. Results are based on 30 simulated outbreaks.

Increasing either the radius (coefficient in final GLM: b = 0·021, 95% CI −0·026 to −0·015, P < 0·001) or uptake (b = − 0·005, 95% CI −0·009 to −0·001, P < 0·001) for reactive vaccination reduced the size of an outbreak. There was also a significant interaction between the date of incursion and the radius for reactive vaccination; the later the incursion the smaller the reduction in outbreak size achieved by increasing the radius. Increased vaccine uptake in the VZ significantly reduced the size of an outbreak (b = − 0·009, 95% CI −0·013 to −0·005, P < 0·001) but the size of the zone was not significant (P > 0·1) in determining the outbreak size.
Morbidity, mortality and vaccine usage
Morbidity (defined as total number of cattle and sheep infected) and mortality (defined as the total number of cattle and sheep dead) for each scenario are shown in Fig. 6b, c for incursions in May (results for incursions in July and September can be found in Supplementary Figs S1 and S2). For early incursions (May or July) the lowest morbidity levels occur with widespread reactive vaccination (80% or 95% uptake within 100 km of infected premises). These scenarios require similar numbers of vaccine doses to other reactive plans and fewer than pre-emptive strategies, although there is considerable variation in the number of doses used (Fig. 6d). For later incursions (September) pre-emptive and reactive vaccination strategies result in comparable levels of morbidity. Disease-induced mortality is reduced by all forms of vaccination especially for early incursions, and for all vaccination scenarios the mean number of dead animals in an outbreak was <15.
Sensitivity analysis
Probability of an outbreak
The shape of the kernel did not significantly affect the probability of an outbreak, nor did it affect the predicted impact of vaccination on the probability of an outbreak (i.e. both the radius for reactive vaccination and the size of the VZ had no significant effect for all kernels). Increased vaccine efficacy significantly reduces the probability of an outbreak when the incursion occurs into a vaccinated population (80% uptake in VZ 1), but not when only reactive vaccination is used.
Outbreak size
Outbreaks simulated using the exponential kernel are larger than those using the Gaussian kernel but the difference is not significant. However, both the fat-tailed and FMD kernels produced significantly larger outbreaks than either the Gaussian or exponential kernel (fat-tailed vs. Gaussian: b = 2·74, 95% CI 2·13–3·34, P < 0·0001; fat-tailed vs. exponential: b = 2·52, 95% CI 1·91–3·12, P < 0·0001; FMD vs. Gaussian: b = 2·27, 95% CI 1·66–2·87, P < 0·0001; FMD vs. exponential: b = 2·52, 95% CI 1·44–2·65, P < 0·0001).
The predicted impact of reactive vaccination does not depend on the choice of kernel. As the radius is increased the size of an outbreak is significantly reduced for any kernel. Similarly, for any choice of kernel the declaration of a larger VZ produces smaller outbreaks but the effect is not significant.
The effect of reactive vaccination is sensitive to the level of vaccine efficacy. For low levels of vaccine efficacy (50%, 60%, 70%) increasing the radius of the reactive VZ does not reduce the size of an outbreak. However, for higher efficacy larger radii produce significantly smaller outbreaks (80%: b = − 0·011, 95% CI −0·018 to −0·0041, P < 0·05; 90%: b = − 0·012, 95% CI −0·019 to −0·0050, P < 0·05; 100%: b = − 0·019, 95% CI −0·026 to −0·011, P < 0·001). Increased vaccine efficacy does not significantly reduce the size of outbreaks for the pre-emptive vaccination strategy (80% uptake in VZ 1 with reactive vaccination uptake of 95% over a radius of 20 km). This may be because insufficient farms are vaccinated for the increase in efficacy to have an effect, due to the relatively small size of the zone and the limited radius for reactive vaccination.
The results presented here are based on simulated incursions on 1 May. Similar patterns were found for incursions on 1 July.
DISCUSSION
Without vaccination simulations indicate that there is a high chance of an outbreak spreading beyond the initial site of infection (Fig. 2). The greatest risk is from an incursion earlier in the year (May, July). The earlier an outbreak occurs the greater the extent of the outbreak in terms of both its spatial spread and the number of farms affected, which is a consequence of the additional time available for BTV to spread. Furthermore, the predicted outbreak size for incursions to the south coast of England in September (Fig. 3e, f) are larger than those predicted by Szmaragd and co-workers [Reference Szmaragd11] who simulated incursions to eastern England at the same time. This reflects the density of livestock, which is higher in the southern counties compared to East Anglia.
Reactive vaccination alone does not significantly affect the probability that an outbreak will take off because secondary spread will typically occur before disease is detected and vaccine can be deployed. When incursions occur into a vaccinated population the probability of an outbreak is significantly reduced compared to an unvaccinated population (Fig. 2). Higher levels of vaccine uptake in the VZ resulted in fewer outbreaks but changing the size of the zone (from VZ 1 to VZ 2) did not significantly impact the probability of the outbreak spreading, principally because incursions were assumed to occur only in VZ 1.
Both reactive and pre-emptive vaccination reduced the spatial extent and number of affected premises when secondary spread occurs. Increasing the target area for reactive vaccination or the level of uptake both result in greater reductions in the size of the outbreak. For pre-emptive vaccination higher uptake produced smaller outbreaks but no significant effect was observed for the size of the zone. This is a consequence of assuming that, whichever zone is used for vaccination, the incursion will only occur into the area covered by VZ 1. This suggests that provided the VZ covers the region at risk of an incursion there is little benefit in vaccinating over a wider area. Both forms of vaccination reduce the number of infected animals with the lowest levels of host morbidity achieved by large-scale reactive vaccination over a radius of 100 km.
The impact of reactive vaccination is dependent on the timing of the incursion. For incursions which occur later in the year reactively vaccinating in response to the outbreak has less affect on the outbreak size because there is insufficient time for vaccine to be delivered and for livestock to reach full protection before transmission stops due to lower temperatures. This suggests that if an incursion occurs late in the year it may not be worth initiating a reactive vaccination campaign. However, this study has only considered the short-term dynamics of the disease, from the date of incursion to the end of the year when transmission would be expected to have stopped. To assess the longer-term benefits of different vaccination strategies and, in particular, the ability to prevent the re-emergence of the disease in the following year, would require a greater understanding of the overwintering mechanisms of the virus [Reference Wilson, Darpel and Mellor19].
Few studies have compared the impact of pre-emptive and reactive vaccination strategies against the same incursion, whether for BTV or for other livestock diseases. An earlier study of the impact of vaccination against BTV-8 in Scotland did consider both reactive and pre-emptive strategies [Reference Szmaragd, Gunn and Gubbins20]. Although that study found some evidence that pre-emptive vaccination had a larger effect than reactive vaccination, the authors did not directly compare reactive and pre-emptive strategies against the same incursion. Similarly, pre-emptive (or prophylactic) vaccination against FMD was shown to be more effective at controlling outbreaks (with higher levels of coverage resulting in smaller outbreaks) than reactive vaccination [Reference Keeling21]. However, the reactive strategies assumed a long delay (>14 days) between identification of an infected premises and the start of vaccination [Reference Keeling21] and shortening this delay increases the effectiveness of a reactive strategy [Reference Tildesley22]. For reactive vaccination strategies the reduction in outbreak size with increasing radius has been demonstrated for a number of other livestock diseases including classical swine fever [Reference Backer23], highly pathogenic avian influenza [Reference Truscott24] and FMD [Reference Tildesley22]. Furthermore, Tildesley et al. [Reference Tildesley22] showed that logistical constraints result in an optimal radius. Here we have assumed that logistical constraints are not limiting, which largely reflects the longer timescales over which vaccination takes place for BTV compared to FMD and because, in the case of BTV, it is implemented by farmers themselves and not special vaccination teams.
In addition to their ability to control the spread of disease it is also important to consider the economic costs of different vaccination strategies. Pre-emptive strategies carry the largest cost in terms of the purchase of vaccine and would also involve the costs of establishing the VZ, including losses incurred through restrictions placed on the movement of livestock out of the zone and the increased surveillance required to demonstrate disease-free status. While a purely reactive strategy would require less vaccine to be used and avoid the need for movement restrictions in the absence of disease it would involve the implementation of a surveillance scheme to ensure that vaccine was deployed effectively in the event of an outbreak.
In a recent study of the 2006 outbreak of BTV-8 in Belgium, Germany and The Netherlands, de Koeijer and co-workers [Reference de Koeijer25] found that between-farm spread was best described by a kernel with more long-range transmission than the Gaussian kernel estimated by Szmaragd and co-workers [Reference Szmaragd11] which was used in the simulations presented here. The shape of the kernel significantly affects the simulated disease dynamics and, therefore, it is important that careful consideration is given to alternative kernels when using models to predict the spread of BTV. However, based on the results of our sensitivity analysis which included kernels with longer-range transmission (i.e. the fat-tailed and FMD kernels, [Reference Szmaragd11]), we anticipate that the relative benefits of different vaccination strategies are independent of the choice of kernel.
Vaccine efficacy influences the predicted effect of reactive vaccination on the spread of BTV. For low values of efficacy (⩽70%) increasing the spatial coverage of reactive vaccination does not significantly reduce the spread of disease, but at higher efficacies (⩾80%) increasing the spatial coverage of reactive vaccination does significantly reduce spread. A similar threshold efficacy (of between 70% and 80%) has been identified for BTV previously [Reference Szmaragd12], and reflects the basic reproduction number for this disease [Reference Gubbins26]. Moreover, the impact of efficacy on the success of a reactive vaccination campaign suggests that good estimates of vaccine efficacy are important in determining the best control strategy.
Previous analysis [Reference Szmaragd12] has shown that model predictions are also sensitive to the temperature data used in the model, with 2006 (a warmer year) producing larger outbreaks than 2007 (a cooler year). However, changing the temperature should have no effect on the relative impact of the different vaccination strategies.
In the model the effects of movement restrictions on transmission between farms were ignored and, hence, the predictions represent a worst-case scenario for spread. Previous analysis of the 2007 BTV-8 outbreak in GB suggested that simulating movement restrictions by restricting spread to the protection zone had little impact on the model predictions with a Gaussian or exponential kernel, but they substantially reduced predicted spread for a fat-tailed or FMD kernel [Reference Szmaragd11]. Consequently, including movement restrictions is unlikely to affect the predictions using either a Gaussian or exponential kernel and, indeed, we note that BTV is largely restricted to VZ 1 for these scenarios. For either the fat-tailed or FMD kernel, however, movement restrictions will reduce spread, although there will still be higher levels of spread compared to the Gaussian or exponential kernels. Moreover, there will be a greater risk of infection reaching the edges of the zone raising the possibility of spread (via vectors) to outside the zone. To fully assess the impacts of movement restrictions it is necessary to separate out the major routes of between-farm transmission (vector dispersal and livestock movements), and future development of BTV transmission models should focus on explicitly incorporating these different mechanisms (see e.g. [Reference Ducheyne27]).
CONCLUSIONS
Both pre-emptive and reactive vaccination limited the spread of BTV in the event of an outbreak. However, only pre-emptive vaccination was found to reduce the probability of an outbreak following the initial introduction of BTV. Consequently, if the risk of introduction is high there is a stronger case for the use of pre-emptive vaccination. The timing of the incursion had a significant impact on the disease dynamics and the potential benefits of vaccination. In particular if BTV was introduced late in the year reactive vaccination was found to have little impact on the spread of disease and any decision to vaccinate reactively should take into consideration the natural impact of seasonality on disease transmission. The direct and indirect costs should be considered when selecting the best control strategy. While no formal economic analysis has been performed, reactive strategies used the fewest vaccine doses. However, indirect costs, in particular the impact on the livestock trade of declaring a PZ or VZ for the purposes of pre-emptive vaccination, must also be quantified.
SUPPLEMENTARY MATERIAL
For supplementary material accompanying this paper, visit http://dx.doi.org/10.1017/S0950268812000532.
ACKNOWLEDGEMENTS
This work was funded by the Department for Environment, Food and Rural Affairs (grant codes: SE4209 and SE4204).
DECLARATION OF INTEREST
None.


