
To what extent do campaigns to increase voter turnout affect the likelihood of participation? This question has received considerable attention in the academic literature, especially since Gerber and Green’s seminal field experiments in New Haven, Connecticut.Footnote 1 Perhaps one of the most studied mobilization tools is door-to-door canvassing, which is widely used in US campaigns.Footnote 2 In a recent review of the literature, Green, McGrath and AronowFootnote 3 identified seventy-one canvassing experiments with a precision-weighted average complier average causal effect (CACE)Footnote 4 of 2.536 percentage points and a 95 per cent credible interval of (1.817, 3.255). The effect of door-to-door canvassing is one of the largest and most robust in the get-out-the-vote (GOTV) literature and almost rivals the effect from social pressure mailings.Footnote 5
A few published studies have focused on the effectiveness of door-to-door canvassing outside the United States. Guan and GreenFootnote 6 mobilized students in a 2003 Beijing election, John and BrannanFootnote 7 canvassed British voters in the 2005 election, and Giné and MansuriFootnote 8 targeted female voters in rural Pakistan. The three studies observed varying levels of effects, from modest to impressive. The relative efficiency of door-to-door canvassing, and to some extent inspiration from the 2008 Obama campaign,Footnote 9 has led to its increased popularity outside the United States. For example the Danish Social Democrats relied heavily on this strategy in the 2011 general election after campaign strategists had volunteered on the Obama campaign.Footnote 10 However, most studies concerning the effect of door-to-door canvassing are focused on the US context, which has prompted some skepticism regarding the generalizability of the results to Europe as European campaigns adopt US strategies. Following John and Brannan,Footnote 11 several (currently unpublished) studies from across Europe find mixed results.Footnote 12 This article compiles evidence related to door-to-door canvassing in Europe and presents findings from two new studies conducted in the context of a Danish election.
Studying the effects of door-to-door canvassing in Europe is interesting for at least three reasons. First, in several European countries turnout is much higher than in the United States, especially considering that many of the existing American studies target voters in low-salience elections. This means a ceiling effect might occur in Europe, as there is less scope for door-to-door campaign mobilization than in the United States.
Secondly, there could be cultural differences. Door-to-door canvassing is more frequently used in the United States than in most European countries, apart from perhaps the UK.Footnote 13 This means that voters in Europe are not as used to being exposed to political messages on their doorstep, and they might find it invasive to be confronted with political campaigns at their front door. European canvassers and canvassing organizations are also simply less experienced than many US canvassing organizations that have built up experience in a number of elections. This might lead to less influential door-to-door-campaigns in Europe.Footnote 14
Thirdly, institutional differences might vary the impact of door-to-door campaigns. Most US studies are conducted in first-past-the-post systems, which are considerably more candidate focused than mostFootnote 15 European proportional representation (PR) systems. It is possible that this makes doorstep conversations more relevant and effective in the United States compared to Europe (setting Britain aside for a moment) because it is possible to have more relevant and engaging discussions about the character of individual candidates, whereas in countries like Denmark discussions would have to be more abstract and focus on parties.Footnote 16 Furthermore, US studies are often conducted in competitive districts where the chance of being pivotal is especially high, which might also increase the effectiveness of campaigns even if an individual’s vote, on average, has greater leverage in a PR system. Another institutional difference is the need for registration in the United States, which, among other things, provides canvassers with information about individuals who are motivated to vote and their party affiliation. This might lead to more effective campaigns.
In total, the compiled theoretical arguments point in the direction of smaller effects in Europe. Yet ultimately it is an empirical question. In this article, we compile evidence from published and unpublished door-to-door canvassing experiments in Europe and present two new studies from Denmark. The main finding from a meta-analysis is that the average effect of European studies is well below the mean effect from the United States. In fact, though the point estimate is positive at 0.78 percentage points, based on the studies conducted so far it is still too early to say whether door-to-door canvassing is an effective strategy in Europe at all. The confidence interval (CI) of the estimate is (−0.16, 1.71), so it cannot be ruled out either that the effect is quite substantial. We emphasize that this conclusion is in part due to a limited number of studies – many of which have low power, including our own. This does not change the fact that at this point the best estimate is that door-to-door canvassing is not the same silver bullet in Europe as in the United States, but that more research is needed.
DOOR-TO-DOOR STUDIES IN EUROPE
Existing Literature
To our knowledge, the only published study that examines the effectiveness of door-to-door canvassing in Europe is John and Brannan’sFootnote 17 study of the 2005 British general election. The experiment included 2,510 individuals and found an intention-to-treat (ITT) effect of 3.6 percentage points for the non-partisan canvassing and a CACE of 6.7, with a standard error of 3.7.
In recent years, several additional high-quality (currently unpublished) studies have been conducted. Ramiro, Morales and Jiménez-BuedoFootnote 18 conducted a partisan campaign in the Spanish city of Murcia during the 2011 local elections. They found negative treatment effects, though the exact size of the CACE is unclear due to uncertainty about the compliance rate. Therefore, this study will not be included in the meta-analysis.
Pons and LiegeyFootnote 19 studied 23,773 citizens sampled at the building level in the 2010 French regional elections and reported an effect of 0.4 percentage points with a standard error of 0.8 on voting in the first round of the elections from living in a building treated by the partisan campaign.
Also in France, PonsFootnote 20 conducted a door-to-door canvassing experiment in co-operation with Hollande’s 2012 presidential campaign. The study encompassed 2,660 precincts. Due to imperfect compliance by the canvassers, PonsFootnote 21 suggests scaling the CACE with a factor of 2.2. This gives a CACE estimate of 0.5 percentage points with a standard error of 0.7.
A recent study of the 2014 European Parliament election in Sweden analyzes partisan canvassing among 10,897 individuals.Footnote 22 It demonstrates an ITT effect of 2.3 percentage points and a CACE of 3.6 percentage points with a standard error of 1.9.
Foos and JohnFootnote 23 present a study of partisan door-to-door canvassing in the British European Parliament elections in 2014. Voters who received a leaflet and an attempt was made to contact them were 3.7 percentage points less likely to vote than voters in the control group. They estimate a CACE of −8.5 percentage points and a standard error of 4.3.Footnote 24
Finally,Footnote 25 Cantoni and PonsFootnote 26 had volunteers and candidates canvass voters in one municipality in Italy’s European and municipality elections of 2014. They found that volunteers increased turnout, while candidates failed to produce an effect. The volunteer canvassers had an ITT of 1.8 percentage points, while the effect for the candidates was −0.2 percentage points. The contact rates were 35.9 and 45.5 per cent, respectively. When we convert the ITTs to the CACEsFootnote 27 and weigh them by their precision, we get a pooled CACE of 2.7 percentage points with a standard error of 1.7.
New Studies from Denmark
In addition to the existing studies, we present two experiments conducted in the 19 November 2013 Danish municipal elections. Danish municipal elections are held simultaneously every fourth year on the third Tuesday of November in ninety-eight municipalities. Each municipality is one multimember district, in which mandates are distributed proportionally by D’Hondt’s rule and candidates run on either semi-open or open lists. The national political parties dominate the municipal councils, though local lists have some influence in a minority of the municipalities. Even though municipal elections do not receive the same level of attention as national elections, and the elections may be considered as second order, it is fair to say that the municipalities are an important part of the public sector in Denmark. The public sector is very decentralized and municipalities have the authority to levy taxes under restrictions from the central government and administer about 30 per cent of the entire GDP. Turnout usually fluctuates around 70 per cent. In 2013, the national average was 71.9 per cent with considerable variation between the municipalities from 61.2 per cent turning out to vote in Copenhagen to 85.4 per cent on the small island municipality of Fanoe; 5.3 per cent of the votes cast were early votes.
Data on voter turnout stems from the voter lists. All eligible voters are automatically registered. When citizens vote, they are marked on the voter lists. Some municipalities use electronic voter lists, and voters are marked by scanning the barcode on the polling card. After the election, we collected the voter files from all ninety-eight municipalities. Where manual lists were used, the municipalities digitized them before submitting them for research. While a few lists were lost due to administrative errors at the polling places, we gained access to individual-level turnout information for about 99 per cent of all eligible citizens (4.36 million individuals). The voter lists were then matched with information on treatment status from the experiments, and finally were anonymously merged with detailed socio-demographic information from Statistics Denmark, the government statistics bureau.Footnote 28
Study 1: Non-partisan Mobilization in Copenhagen
‘We Vote Together’ (in Danish ‘Vi stemmer sammen’) was a non-partisan door-to-door canvassing campaign run by researchers from the University of Copenhagen (the authors). The campaign was carried out the weekend before election day. In the experiment, a randomly selected treatment group of households received visits from two canvassers recruited mainly among current and former students at the University of Copenhagen. The canvassers were volunteers, primarily students, and received a brief introduction to the project and the randomized design as well as a short script. The canvassers went over the script but did not rehearse it. They were told that they were free to do the canvassing as they pleased and that the script was for inspiration. They were required to encourage people to vote and hand out a flyer at the door. They were also instructed not to leave flyers with voters who did not open the door.
The selected group of interest was 3,402 households in the Østerbro neighborhood in the capital, Copenhagen. All voters in a household were assigned the same treatment status as the household. The area’s turnout was average for Copenhagen but below the national turnout level.Footnote 29 The target population was divided into eighteen routes. Each route consisted of 189 households; ninety were randomly selected to the treatment group and ninety-nine to the control group. In total, 1,620 households with 2,167 eligible citizens were selected to the treatment group, whereas 1,782 households with 2,345 citizens were in the control group; 36 per cent of the households in the treatment group were successfully contacted. The ITT was −0.8 percentage points. A consistent estimator for the CACE is to divide the ITT by the contact rate.Footnote 30 That gives a CACE of −2.1 percentage points with a standard error of 4.6. A more elaborate description of the results is available in the online appendix.
Study 2: Mobilization by Labor Market Union in Randers
A local youth branch of one of the largest labor market unions in Denmark (3F Ungdom, Randers) launched a door-to-door mobilization campaign before the election. The target group was the youth organization’s own members, who were all between eighteen and thirty years of age. Canvassers were trained to introduce themselves at the door, and to listen and establish a pleasant conversation. They were instructed to deliver an appeal in two parts: first, to encourage voting and tell the voter why it was important to the canvasser that some of the candidates elected would work to promote issues of interest to the youth labor market union and its members. Secondly, the voters were offered a list of forty-seven recommended candidates from a broad spectrum of the running parties. A total of 194 candidates ran in the municipality.
Randomization was carried out at the household level to overcome issues of within-household spillover. The randomization was based on the organization’s member list, which contained the same personal identifier that was in the general public records. This made it straightforward to merge the file with the above-described turnout data. As the treatment directly targeted individual citizens, only members of the organization are considered in the experiment. Other voters who resided at the same address are not considered as part of either the treatment or control group. A few households contained more than one member of the organization. We randomly selected 440 households (454 eligible citizens) to the treatment group, whereas the control group consisted of 439 households (451 eligible citizens). Canvassers were instructed to ask for the member in question, but if anyone in the household opened the door it was considered treated. In the few multimember households, only the person answering the door was generally involved in the conversation.
The contact rate, defined as anyone in the household answering the door, was 24 per cent. The ITT was −3.8 percentage points. Due to the low contact rate the CACE is estimated to be −15.4 percentage points, however the standard error is 13.9, which can be ascribed to a combination of the limited sample size and relatively low contact rate. Once again, we refer to the online appendix for a more elaborate description.
META-ANALYSIS
In Table 1, we compile evidence from the previous studies and the two new studies. In addition to the scarcity of European experiences, we notice that all the studies are from Western Europe. This limitation is worth keeping in mind as we evaluate the compiled evidence. We can combine the studies for which we have an estimate of the CACE in a fixed-effects meta-analysis.Footnote 31 The precision-weighted average of the CACE is 0.78 percentage points with a 95 per cent CI from −0.16 to 1.71 percentage points. The point estimate is well below the general point estimate from the American literature. If we exclude John and Brannan’sFootnote 32 (UK) study from the meta-analysis reported by Green, McGrath and Aronow,Footnote 33 the precision-weighted estimate for the American studies is 2.50 percentage points with a 95 per cent CI of (1.77, 3.22). A simulation-based test of the difference between the distributions gives a p-value of 0.002 when testing if the American estimate is greater than the European.Footnote 34 This difference between the European and American studies is even without Ramiro, Morales and Jiménez-Buedo,Footnote 35 who found a negative effect estimate but did not include a CACE estimate that can easily be implemented in the meta-analysis.
Overview of Previous European Door-to-Door Studies
a Percentage points.
b Standard errors not reported.
c Canvassers did not strictly adhere to the experimental protocol which is taken into account in the calculation of the CACE. For Pons and Liegey (Reference Pons and Liegey2016) we use the IV estimate accounting for this and for Pons (Reference Pons2016) we use the recommended imperfect compliance multiplier of 2.2. We do not adjust for non-complying households because non-compliers were provided with treatment material. However, if we do so anyway, the pooled effect increases to 1.56 (standard error 0.78).
d Cantoni and Pons (Reference Cantoni and Pons2016) randomly assign households to volunteer and candidate canvassers and only report separate effects. The CACE for volunteer canvassers is 5.0 with a standard error of 2.2. The effect for candidate canvassers is −0.4 with a standard error of 2.6. The table presents a precision-weighted average of the CACE and its standard error. The contact rates are split for candidates and volunteers, the latter in italics.
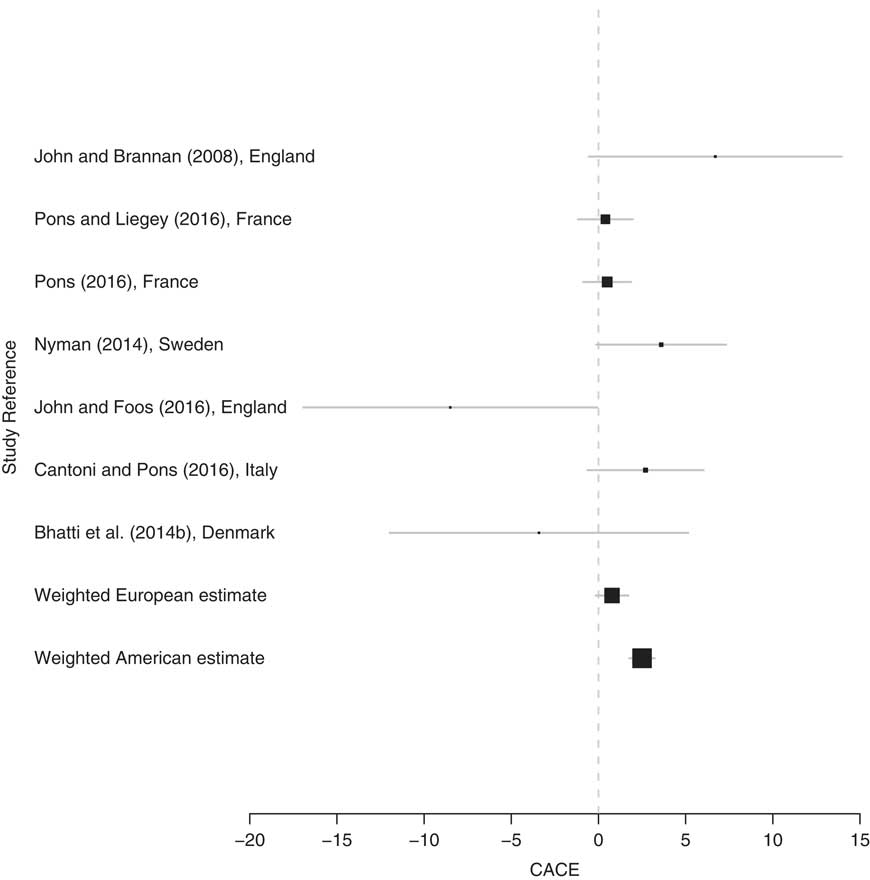
The European CI is considerably wider than that of the CI from the American literature, reflecting the small number of European studies to date. There is thus a need for further studies in a European context. In Figure 1, we have compiled all the studies included in the European meta-analysis along with the pooled European and American estimates. The figure confirms that we cannot infer with certainty that the effect in Europe is positive; nor can we be certain that the effect is indeed smaller than in the United States, especially because the European results depend on a few large-scale studies. Keeping these uncertainties in mind, the best estimate is still that there is a small and positive effect, though it is substantially smaller than what has been observed in the United States.
Estimates from European studies and pooled European and American estimates Note: the bars are the 95 per cent CIs. The box is centered at the best estimate and its area is scaled by its precision.
The meta-analysis ignores any heterogeneity between the effects. One might question the external validity, and whether we can even compare effects from relatively diverse countries as France, Sweden, Britain, Italy and Denmark. The p-value for a test of the heterogeneity of the effects is 0.062, suggesting that there might be some heterogeneity in effects that future studies can explore. Though Fieldhouse et al.Footnote 36 find that geographical context moderates effects in a population-based experiment using mailings and phone calls in Britain only to a limited extent, there could be heterogeneity across countries.
One source of heterogeneity could be salience or turnout levels. This could also help explain the smaller effects in Europe. Turnout in many of the elections in question is at least comparable to a high-turnout American election. Above we suggested that one of the reasons we might not expect effects similar to those in the United States is that the results could be subject to a ceiling effect. To examine this possibility, we plot the CACEs against the control groups’ turnout rates in Figure 2. The size of each point is proportional to the estimate’s precision. Furthermore, the fitted line is from a regression of CACE on control group turnout weighted by precision. Figure 2 reveals a practically flat relationship between turnout in the control group and the effect size. However, control group turnout rates are not randomly assigned. Thus we cannot be certain whether effects in contexts with low turnout rates would change if these places suddenly increased overall turnout.Footnote 37
Relationship between control group turnout and effect size Note: the points are scaled by their precision (one divided by the variance) and the regression lines are from weighted least squares regressions with precision of point estimates as regression weights.
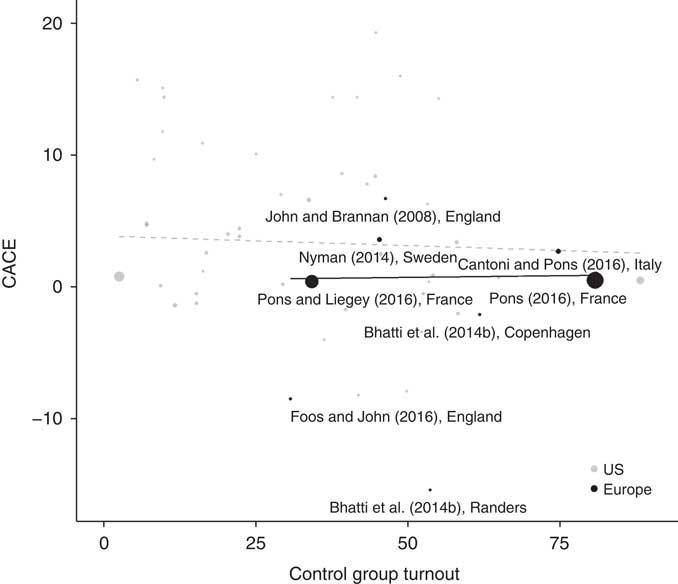
We have also gone back to the US door-to-door studies included in the Green, McGrath and Aronow meta-analysis and added control group turnout to their dataset where it was missing.Footnote 38 This allows us to analyze the relationship between CACE and turnout in the US setting. The gray markers in Figure 2 are the US studies. The analysis finds a very weak negative relationship in these US studies, suggesting that initial turnout level is weakly negative related to the effect of door-to-door campaigns. Though the evidence is weak, there is a negative correlation between control group turnout and effect size, at least in the United States. Thus we cannot rule out the possibility that differences in turnout levels are driving part of the differences in effect size. Yet the regression line for the United States is above the European line at all levels of turnout in the control group. It is interesting that the largest CACE is found in the only first-past-the-post election among the European studies, suggesting that election systems might correlate with the effects of door-to-door canvassing, but with only one election we cannot draw any definitive conclusions.
DISCUSSION
This article contributes to the literature by compiling evidence from seven previous European studies and two new studies. Including our two studies, we obtain a precision-weighted average CACE of 0.78 percentage point with a 95 per cent CI from −0.16 to 1.71 percentage points. In other words, the current best estimate based on experiences from Western Europe is below the general estimate, but is positive as in the United States. Although our findings are fragile, we think it is important to summarize both the published and non-published evidence at the current stage to help practitioners and scholars who are conducting GOTV research to plan campaigns based on all the available evidence.Footnote 39 A large amount of money and volunteers’ time are spent based on the existing research, and this important addition might make some European campaigns reconsider their tactics or at least think about how to measure the impact of their efforts.
However, while these results might suggest that canvassing is less effective in Europe than the United States, the findings cannot be taken as final proof that canvassing is ineffective in European elections. Instead, we need more experiments in order to more precisely estimate the effectiveness of door-to-door canvassing in Europe and to verify whether the US results can be applied to a European context. While the collective literature on European door-to-door canvassing effects has progressed in recent years, there are still substantial uncertainties. In addition, we have only estimated the effect on overall mobilization. Campaigns might still benefit from door-to-door canvassing by demobilizing out-party voters,Footnote 40 persuading voters to support their partyFootnote 41 or only mobilizing low-propensity voters.Footnote 42
There could be numerous potential explanations of the difference between the general positive effects of door-to-door canvassing in the United States and the smaller effects in Europe that we have presented here. The generally higher turnout in Europe might be part of the explanation (a so-called ceiling effect), combined with the fact that most European elections are conducted using PR systems. In the United States, we need stronger evidence of the effectiveness of door-to-door canvassing in battleground states vs. non-battleground states, on registered voters vs. non-registered voters, on partisan vs. non-partisan appeals, and on canvassing conducted by candidates vs. volunteers.
Common wisdom in the American context is that door-to-door canvassing, though resource intensive, has a sizable effect on turnout. If nothing else, our article demonstrates that researchers and practitioners should be cautious about assuming that lessons from a US-dominated field can be transferred to their own countries’ contexts. The compiled evidence we presented here demonstrates that more research is needed before we accept this to be the case in Europe. Finally, we discuss evidence from six Western European countries. The effect of door-to-door canvassing in the rest of Europe is a question for further investigation.


 Open access