


Impact statement
The WATERVERSE Data Quality Framework advances how data are managed and used in the water sector, where reliable information is essential for effective decision-making, regulatory compliance and operational efficiency. By addressing persistent challenges such as inconsistent records, fragmented systems and outdated monitoring practices, the framework offers a structured way to improve the quality of time-series data from smart meters, online water quality sensors and other operational sources. Through its iterative process, which combines automated assessment and data reconciliation, the framework enables water utilities to systematically detect and correct issues such as missing, duplicated or erroneous data. This supports more trustworthy indicators for leakage, consumption, water quality and asset performance, helping utilities prioritise interventions, optimise resource allocation and justify investments in infrastructure and digitalisation. The deployment of the framework in pilot projects in Spain and the Netherlands demonstrates that these benefits are attainable in real operational contexts, not just in theory. In both cases, data quality scores improved substantially, strengthening the basis for analytics, forecasting and digital-twin applications. Because the framework is generic at the architectural level and tool-supported, it can be adapted to other organisations and even other sectors that depend on high-quality time-series data. By offering a domain-specific yet transferable approach to data governance, assessment and continuous improvement, the framework contributes to more transparent, reliable and sustainable management of critical infrastructure systems, and can ultimately enhance trust among customers, regulators and other stakeholders.
Introduction
Data are a valuable asset for every organisation, serving as a crucial resource that underpins decision-making, operational efficiency and strategic planning (Sidi et al., Reference Sidi, Shariat Panahy, Affendey, Jabar, Ibrahim and Mustapha2012; Cichy and Rass, Reference Cichy and Rass2019). High-quality data provide essential insights that empower organisations to make informed and efficient decisions, facilitate process automation and improve workflow efficiency. Moreover, effectively harnessing technological advancements and emerging technologies depends on the analysis of large volumes of high-quality data (Sidi et al., Reference Sidi, Shariat Panahy, Affendey, Jabar, Ibrahim and Mustapha2012; Cichy and Rass, Reference Cichy and Rass2019; ).
Data quality is a multifaceted concept that can be defined from multiple perspectives depending on data usage, reflecting its inherent subjectivity and context dependence (Pipino et al., Reference Pipino, Lee and Wang2002; Fürber, Reference Fürber2016; Cichy and Rass, Reference Cichy and Rass2019; Ehrlinger and Wöß, Reference Ehrlinger and Wöß2022a). From a consumer point of view, data quality is defined as the data deemed to meet or exceed consumers’ expectations and to satisfy the requirements of its intended use (Fürber, Reference Fürber2016). From a business perspective, data quality is data that ‘are fit for their intended usage in operations, decision-making and planning’ and accurately represent the real-world constructs to which they relate (BDVA Task Force DataSpaces, 2024; Fleckenstein and Fellows, Reference Fleckenstein and Fellows2018; Heinrich et al., Reference Heinrich, Hristova, Klier, Schiller and Szubartowicz2018; Cichy and Rass, Reference Cichy and Rass2019; Pipino et al., Reference Pipino, Lee and Wang2002; Gabr et al., Reference Gabr, Helmy and Elzanfaly2021; Zhou et al., Reference Zhou, Tu, Sha, Ding and Chen2024). From a standards-based perspective, the quality of data is defined as the ‘degree to which a set of inherent characteristics (quality dimensions) of an object (data) meets requirements’ (International Organization for Standardization, 2015). The extensive collection of definitions can provide valuable insights into the nature of data processes.
Concerning the water sector, the need for high-quality data is critical to effective management and ensuring sustainability in the integral water cycle. Nevertheless, several challenges specifically hinder the quality of the data in this sector (Batini et al., Reference Batini, Barone, Cabitza and Grega2011; BDVA Task Force DataSpaces, 2024; Fleckenstein and Fellows, Reference Fleckenstein and Fellows2018; Stein and Bueb, Reference Stein and Bueb2022; Mohammed et al., Reference Mohammed, Ehrlinger, Harmouch, Naumann and Srivastava2024):
-
• Variability in data collection methods.
-
• Data are siloed between different departments or systems.
-
• Inappropriate or outdated monitoring equipment.
-
• Absence of standardised protocols for data collection and reporting.
-
• Poor communication among stakeholders.
To address these challenges due to poor data quality, different data quality assessment frameworks have been proposed in the literature (Pipino et al., Reference Pipino, Lee and Wang2002; Otto and Österle, Reference Otto and Österle2016). These frameworks allow organisations to systematically evaluate their data quality against established standards and best practices. Therefore, the goal of this article is twofold: first, to present the WATERVERSE Data Quality Framework as a domain-specific framework for the assessment and improvement of water-sector time-series data; and second, to provide a proof of concept of its operational applicability through two pilot implementations using real datasets from Spain and the Netherlands.
General structure of data quality frameworks
Data quality assessment frameworks are essential tools for systematically evaluating data quality practices in water utilities. These frameworks encompass principles, standards, processes and tools that address multiple data quality dimensions, such as accuracy, completeness, consistency, timeliness, uniqueness and validity (Wang and Strong, Reference Wang and Strong1996; Batini and Scannapieco, Reference Batini and Scannapieco2016). By establishing clear metrics and thresholds for each dimension and selecting the most relevant ones for the context, water utilities can effectively monitor and improve their data quality (Heinrich et al., Reference Heinrich, Kaiser and Marcus2007; Maydanchik, Reference Maydanchik2007; Heinrich et al., Reference Heinrich, Hristova, Klier, Schiller and Szubartowicz2018).
A comprehensive data quality framework typically includes the following interrelated components (Wang and Strong, Reference Wang and Strong1996; Batini and Scannapieco, Reference Batini and Scannapieco2016; Serra et al., Reference Serra, Peralta, Marotta, Marcel, Abelló, Vassiliadis, Romero, Wrembel, Bugiotti, Gamper, Vargas Solar and Zumpano2023; Bernardo et al., Reference Bernardo, Mamede, Barroso and Santos2024; Mohammed et al., Reference Mohammed, Ehrlinger, Harmouch, Naumann and Srivastava2024):
-
• Data governance: Defining the policies, standards, roles and responsibilities to ensure proper data management, including mechanisms for ownership, stewardship and compliance.
-
• Data quality assessment: Evaluating data against predefined quality criteria through different metrics.
-
• Data quality improvement: Corrective actions to enhance data quality based on assessments.
-
• Data quality reporting: Reporting data quality to stakeholders and assessing the framework’s effectiveness.
-
• Data quality monitoring: Tracking data quality metrics over time.
For example, frameworks like the IMF Data Quality Assessment Framework focus on statistical data, emphasising dimensions like accuracy, reliability, and accessibility (Fund, Reference Fund2003). Though applicable to the water sector, these frameworks are primarily designed for statistical practices. Also, the Total Data Quality Management takes a holistic approach, integrating data quality into organisational processes and encouraging proactive management throughout the data life cycle (English, Reference English1999). However, despite the maturity of existing frameworks, most remain sector-agnostic and operate at a high level of abstraction, focusing on general data management rather than the operational use of time-series data from sensors in critical infrastructures like water utilities (Teh et al., Reference Teh, Kempa-Liehr and Wang2020; Gleeson et al., Reference Gleeson, Husband, Gaffney and Boxall2023).
Moreover, water utilities can leverage tools such as data profiling and monitoring to automate assessments, identifying issues like missing values, duplicates and inconsistencies (Batini and Scannapieco, Reference Batini and Scannapieco2006). These tools help improve decision-making, foster stakeholder trust, and drive organisational success (Redman, Reference Redman1998; Ehrlinger and Wöß, Reference Ehrlinger and Wöß2022b).
To address these needs, the Horizon Europe-funded WATERVERSE project developed the WATERVERSE Data Quality Framework, which operates within the Water Data Management Ecosystem (WDME). The WDME is a flexible, scalable platform designed to streamline data processes in the water sector. By enhancing data usability and improving the interoperability of data-intensive processes, the WDME lowers the entry barrier to data spaces, strengthens the resilience of water utilities and unlocks the value of data for market opportunities.
Novelty
This article proposes a novel data quality framework, the WATERVERSE Data Quality Framework, specifically defined for the water sector with the final goal to improve data quality for its use in management, forecasting and predictions, under the umbrella of digital twins for inland waters (Vargiu et al., Reference Vargiu, Munaretto, Antzoulatos and Eliades2025) and the ocean (Berre et al., Reference Berre, Pearlman, Bye and Masó2024), as well as for the future Water Data Space (Otsu and Maso, Reference Otsu and Maso2024).
In practice, water utilities often rely on a fragmented combination of data export routines, ad hoc validation scripts (e.g., for missing values or threshold violations), SCADA or AMI platform checks, spreadsheet-based inspections and visual assessment procedures, all of them developed for specific projects or departments. Further, existing largely sector-agnostic frameworks (Miller et al., Reference Miller, Chan, Whelan and Gregório2025), they generally do not specify how such dimensions should be quantified for regularly sampled meter and sensor series, how rule-based validation should be adapted to water-domain variables or how assessment and correction should be linked in an iterative operational workflow. While these solutions can address particular issues, they typically do not provide a unified framework that links governance, assessment, correction, reporting and monitoring in a repeatable workflow.
In contrast, the proposed framework combines domain-specific quality dimensions and rules for water time series with an iterative assessment–reconciliation cycle implemented by concrete tools and validated in two real pilots. Indeed, it employs an iterative assessment process: data are first evaluated by a Data Quality Assessment (DQA) tool, subsequently processed by a Data Validation and Reconciliation (DVR) tool and finally reevaluated by the DQA-tool. This integrated structure can support faster and more systematic implementation of data-quality practices across heterogeneous datasets and organisational units.
Methods
This section presents the WATERVERSE Data Quality Framework, the study’s methodological contribution. We distinguish it from the broader WDME, which handles governance, metadata, orchestration, scheduling, and reporting. The framework specifically defines data-quality dimensions, metrics, rules and an iterative improvement cycle for operational datasets.
The WATERVERSE data quality framework
The WATERVERSE Data Quality Framework (WDQF) is a domain-oriented framework for the quality assessment and improvement of operational water-sector time-series data. Its purpose is to provide a repeatable and configurable procedure for determining whether a dataset is fit for downstream operational use, identifying quality deficiencies, applying corrective actions where appropriate and verifying whether those actions improve the measured quality. Key properties of the framework include:
-
• Focuses on high-frequency time series (e.g., smart meters and online water quality sensors).
-
• Instantiated through two concrete tools (the DQA-tool and the DVR-tool).
-
• Embeds data quality into a broader governance and monitoring layer, including semantic harmonisation, scheduling, reporting and visual dashboards.
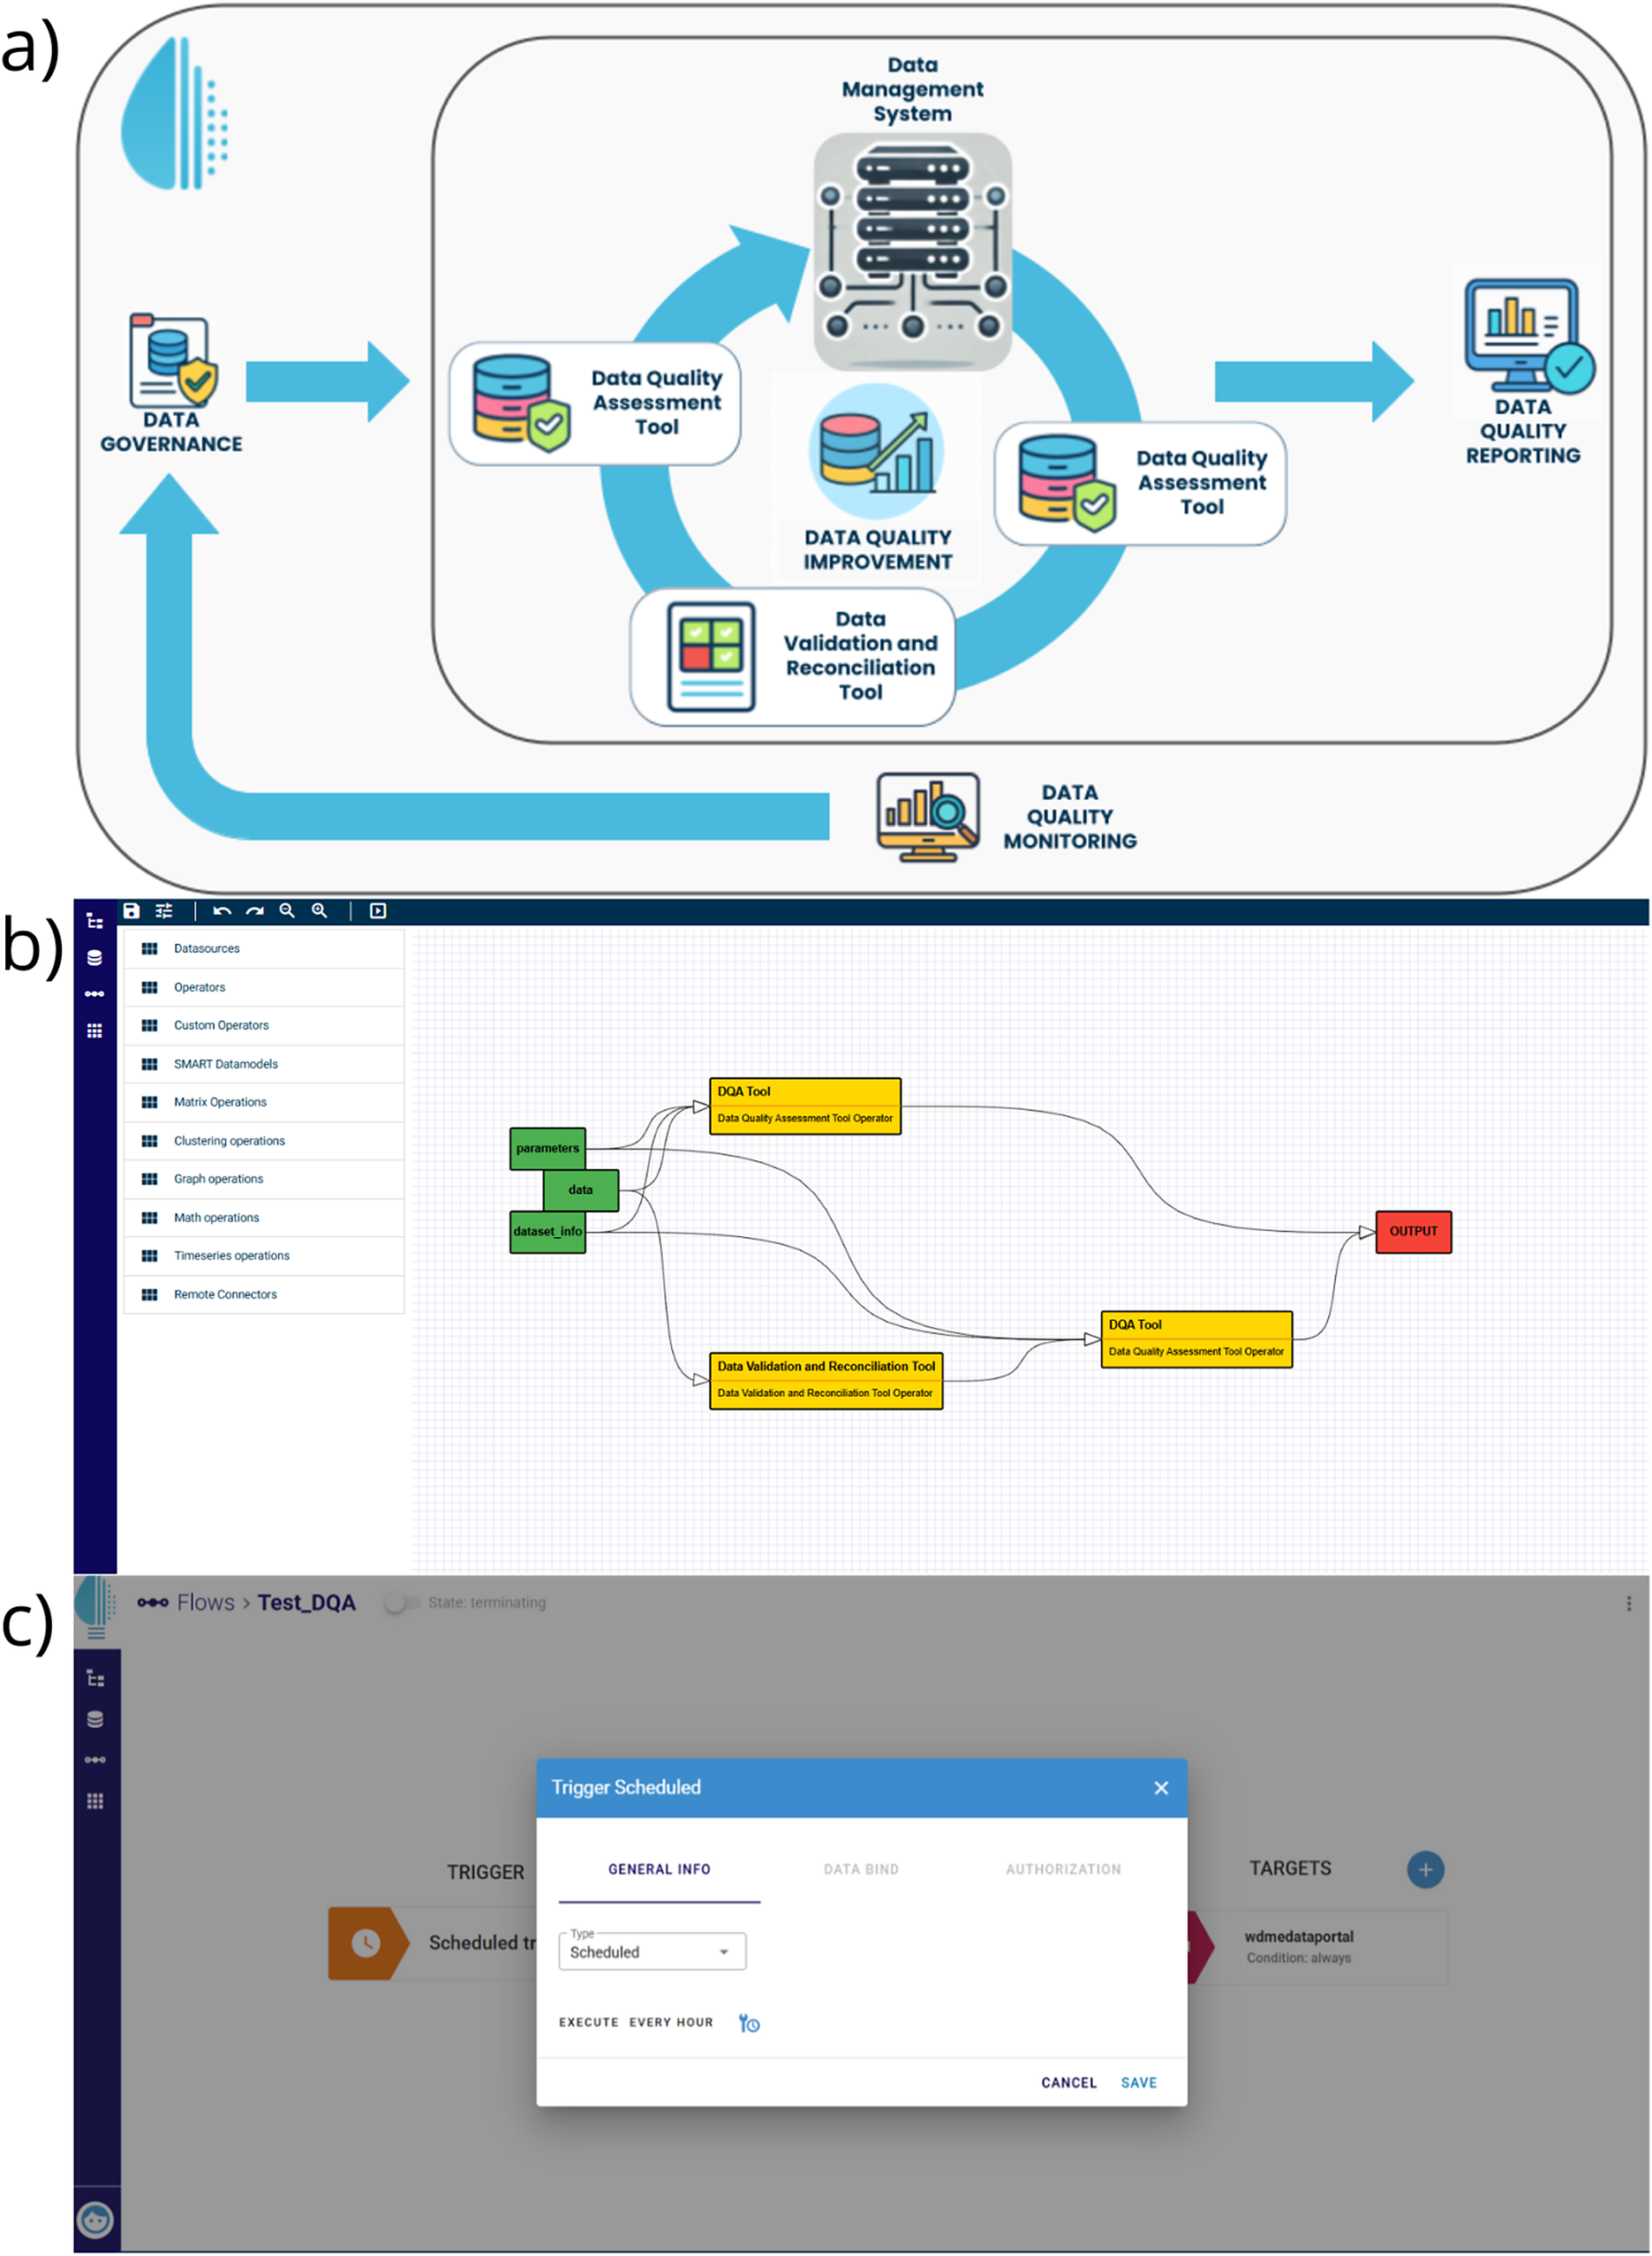
Central to the framework is a structured Data Improvement Cycle, which consists of three main stages (see Figure 1a):
-
1. Initial assessment: Harmonised datasets available through the Data Management System (in the WDME context, a Data Portal CKAN instance) are first evaluated using the DQA-tool.
-
2. Anomaly detection and correction: The DVR-tool identifies anomalies, such as missing values or formatting errors, and applies modelling techniques to impute or correct these discrepancies. In this study, data-driven (AI) models have been applied. In addition, the DVR-tool also provides the possibility to implement trained or calibrated statistical (such as autoregressive and ARIMA) and mechanistic models for data reconciliation, the former already implemented for previous case studies.
-
3. Reassessment: The cleansed dataset undergoes a second quality assessment to validate improvements and confirm compliance with predefined quality criteria, after which it is re-ingested into the Data Management System.
The WATERVERSE Data Quality Framework and its operationalisation within the WDME. (a) Conceptual view of the framework, highlighting the iterative assessment–improvement–reassessment cycle and its relationship with governance, reporting and monitoring. (b) Example of workflow implementation within the WDME mashup environment. (c) Scheduler interface supporting repeated execution of the cycle for continuous data-quality management.
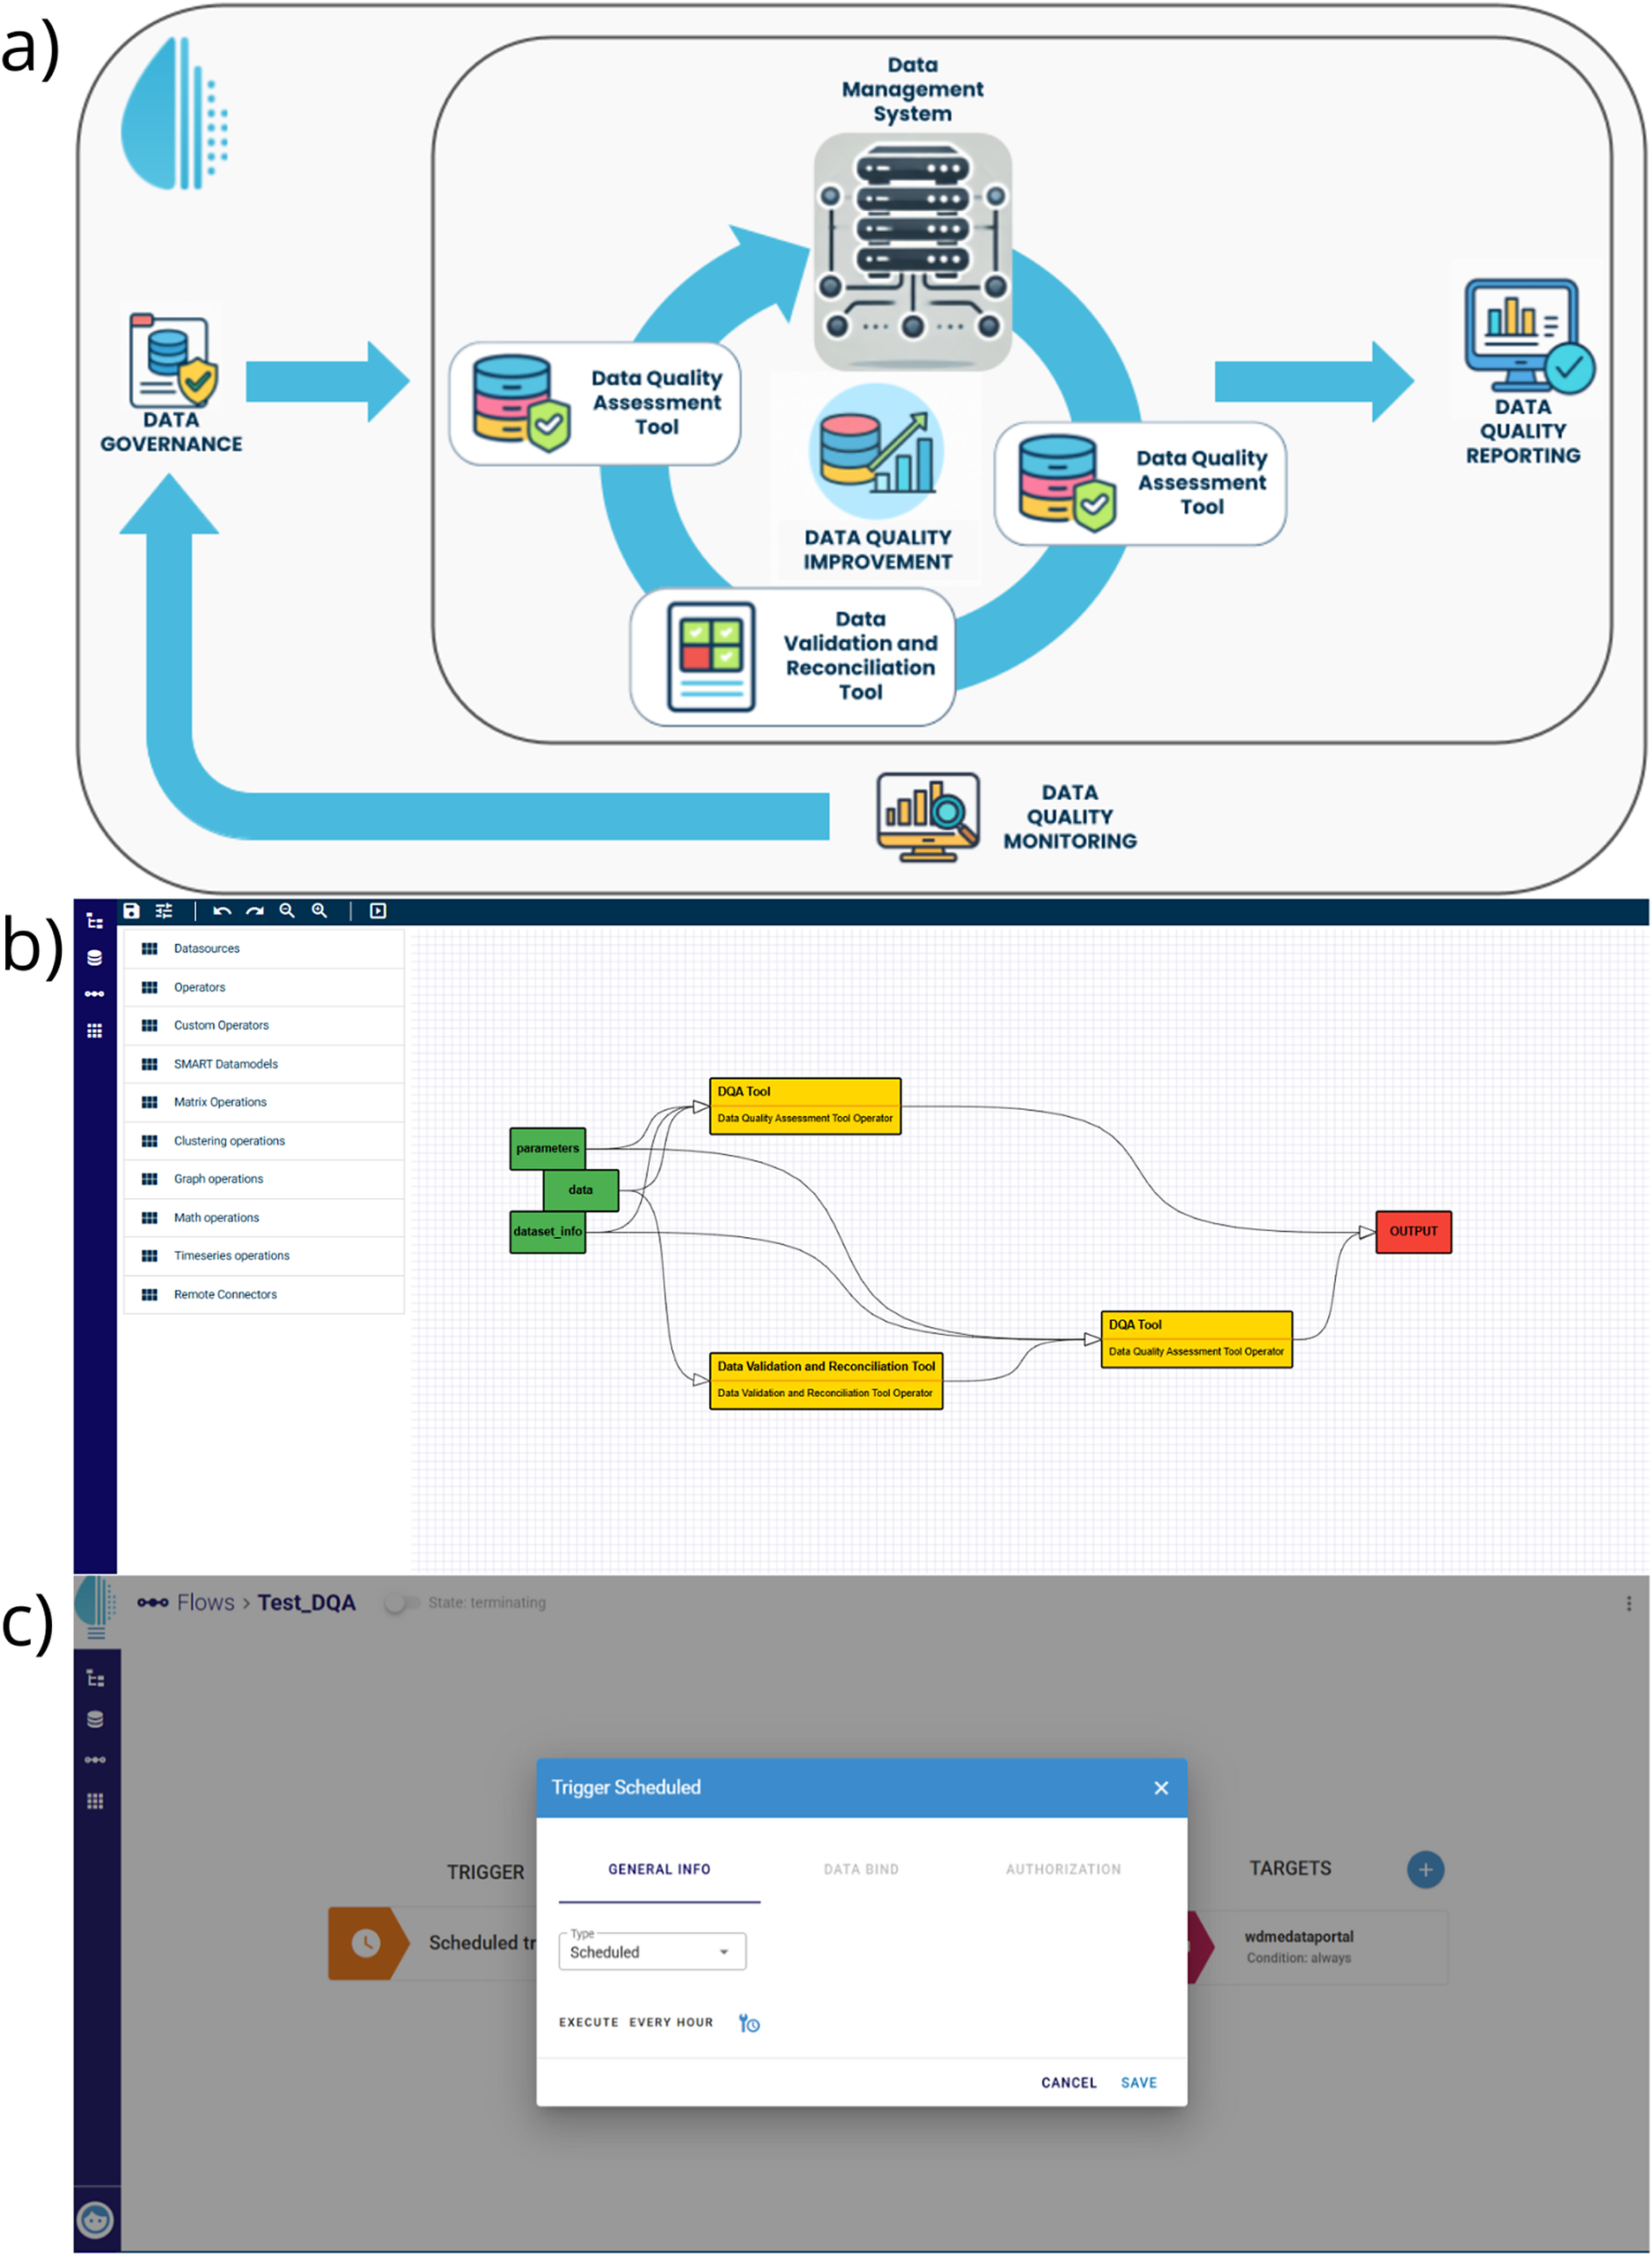
Figure 1. Long description
Panel a at the top presents a flowchart with a central Data Management System icon encircled by a clockwise arrow connecting three labeled blocks: Data Quality Assessment Tool, Data Quality Improvement, and Data Validation and Reconciliation Tool. Arrows extend left to Data Governance and right to Data Quality Reporting, with a lower arrow looping to Data Quality Monitoring and back to Data Governance, illustrating an iterative cycle. Panel b in the middle displays a workflow editor with a left sidebar listing operations and a main area showing green, yellow, and red rectangular nodes labeled parameters, dates, dataset_bind, D Q A Tool, Data Validation and Reconciliation Tool, and OUTPUT. Black lines connect these nodes, mapping the data flow from inputs to output. Panel c at the bottom shows a user interface with a blue pop-up titled Trigger Scheduled, containing fields for scheduling frequency and target selection, supporting repeated automated execution.
This iterative process is governed by the WDME’s data governance framework, ensuring traceable, accountable quality management aligned with organisational policies. The cycle is further enhanced by a configurable scheduler that automates recurring assessments and integrates results into visual dashboards and mashups, providing continuous, real-time insights into data quality.
To understand how this process is structured and managed, it is essential to explore all the components of the WDQF as outlined in Figure 1a.
The framework is implementation-independent at the conceptual level. In the WATERVERSE project, it is operationalised through the DQA-tool and DVR-tool within the WDME, but the framework can also be applied through other implementations, provided that the same dimensions, metrics and rule logic are used.
Input data requirements and preprocessing assumptions
The WDQF operates on harmonised tabular datasets that have already been ingested into the data management environment.
For time-series assessment, the minimum required inputs are one or more identifier columns, a timestamp column and one or more measured-variable columns. In addition, the DQA-tool requires metadata defining the assessment window and expected sampling frequency, while optional validation rules specify admissible formats and value constraints.
For reconciliation, the DVR-tool requires historical observations sufficient for the selected method; in the simplest case, deterministic approaches such as interpolation can be applied with minimal history, whereas data-driven models generally require more extensive past data. Source-specific preprocessing and schema harmonisation are assumed to be completed upstream before the DQA/DVR workflow begins.
For more details, see Supplementary Materials, p. 9.
Data governance
The WDME incorporates clear roles, responsibilities, and access controls to define data ownership and stewardship. The governance mechanisms define who can access, modify and validate data, supported by a rule-based configuration interface. Policies ensure adherence to ethical standards and traceability, enabling accountability in decision-making processes. The use of an open-source Data Management System (e.g., data portals like CKAN instances) enhances transparency and facilitates data discoverability, supporting collaboration across organisational and national boundaries.
Further, in the WDME metadata quality is addressed through a separate module aligned with FAIR principles and Meloda 5 metrics (Wilkinson et al., Reference Wilkinson, Dumontier, Aalbersberg, Appleton, Axton, Baak, Blomberg, Boiten, da Silva Santos, Bourne, Bouwman, Brookes, Clark, Crosas, Dillo, Dumon, Edmunds, Evelo, Finkers, Gonzalez-Beltran, Gray, Groth, Goble, Grethe, Heringa, Hoen, Hooft, Kuhn, Kok, Kok, Lusher, Martone, Mons, Packer, Persson, Rocca-Serra, Roos, van Schaik, Sansone, Schultes, Sengstag, Slater, Strawn, Swertz, Thompson, van der Lei, van Mulligen, Velterop, Waagmeester, Wittenburg, Wolstencroft, Zhao and Mons2016; Abella et al., Reference Abella, Ortiz-de-Urbina-Criado and De-Pablos-Heredero2019), which supports the evaluation and management of metadata-related aspects, such as findability, accessibility, interoperability and reusability. This component is outside the scope of the WDQF presented in this article, which focuses specifically on the assessment and improvement of operational time-series data quality.
Data quality assessment
The framework evaluates operational time-series datasets across five dimensions: completeness, consistency, timeliness, uniqueness and validity. These dimensions are well-established in the literature (Maydanchik, Reference Maydanchik2007; Sidi et al., Reference Sidi, Shariat Panahy, Affendey, Jabar, Ibrahim and Mustapha2012; Askham et al., Reference Askham, Cook, Doyle, Fereday, Gibson, Landbeck, Lee, Palmer and Schwarzenbach2013) and are particularly critical for water-related data, which frequently involves complex time series and heterogeneous sources. Their selection was guided by both their prominence in the literature and their relevance to the specific data quality needs identified through the WATERVERSE project’s pilot activities.
-
• Completeness: proportion of expected values that are present and non-null for the variable under assessment.

-
• Consistency: proportion of records complying with the required data format, type and structural representation defined for each field.

-
• Timeliness: proportion of expected timestamps present within the assessment window, given the declared start date, end date and sampling frequency.

-
• Uniqueness: proportion of unique identifiers within the dataset.

-
• Validity: proportion of records satisfying variable-specific admissibility rules.

Accordingly, the DQA-tool, through feedback from the pilot-site owners, systematically evaluates datasets by these five dimensions. In particular, the assessment supports the optional inclusion of two supplementary inputs:
-
• The Dataset Metadata, which defines the dataset ID and temporal structure. It includes a dataset name; one or more ID columns, a date column for time-series entries, optional columns to drop for simplification, the assessment time window via start and end dates and the data’s frequency, captured by a number and unit.
-
• The Validation Rules, which define expected formats and value constraints for each field. These rules may include numeric thresholds, positivity constraints, non-zero constraints, maximum decimal length, text-length bounds and flatline detection.
Data quality improvement
Once data quality issues are identified by the DQA-tool, the DVR-tool facilitates targeted corrective actions. The DVR-tool is a service that verifies data quality by systematically flagging anomalies and replacing the anomalous data with reconciled data (if desired). The tool contains different anomaly detection (AD) methods that can be selected by the user. Besides univariate AD methods like zero value detection, threshold detection, flatline detection and missing data detection, the DVR-tool can also perform multivariate AD – for example, AD based on the Mahalanobis Distance.
In this research, the DVR-tool is applied to flag anomalies based on flatlines, thresholds and missing data. The former two AD methods correspond to the DQA validity dimension. For these methods, the same criteria were used as defined during the quality assessment. The flatline AD method checks if the data contains segments of constant values with a specified minimum length. The spikedrop AD method detects sudden increases or decreases regarding a local baseline. The missing data AD method corresponds to the Timeliness dimensions of the DQA-tool. This AD method verifies if the consecutive time steps differ by the expected data frequency. If the difference is unequal to the expected frequency, the method determines the missing timestamps and adds these to the dataset, flagged as anomalous.
Typical anomalies in water-related data include out-of-range values, format mismatches, missing values, or flatline sequences that indicate sensor malfunctions or reporting errors. To address these issues, the DVR-tool can apply different reconciliation techniques, such as AI-driven time-series forecasting models and machine learning-based estimators, and statistical interpolation, to intelligently fill in missing or anomalous data points. These methods are designed to maintain the temporal coherence and contextual integrity of the original dataset, minimising the risk of introducing bias. A structured overview of the principal anomaly-detection and reconciliation methods supported by the DVR-tool, including their configurability and use in the pilots reported here, is provided in the Supplementary Materials, p. 18.
In the Dutch and Spanish pilots, Random Forest Regression models are utilised for data reconciliation, for which the DVR-tool requires a supervised training phase based on historical data. The detailed description of the training data, feature engineering, train/test split, hyperparameter tuning and source references is provided in the Supplementary Materials, p. 9.
Data quality reporting
The assessment outcomes are communicated through intuitive visualisations that help users quickly grasp the state of data quality. Polar plots offer a high-level snapshot of the dataset’s quality profile across key dimensions, while bar charts enable comparison of quality scores across individual variables. These visual tools facilitate efficient reporting and support data-driven prioritisation of corrective actions.
Each report includes dimension-specific quality scores, a summary of identified issues, the validation rules applied and any corrections or imputations carried out. This comprehensive documentation empowers stakeholders to evaluate the impact of quality interventions and track the effectiveness of the WDQF over time.
Data quality monitoring
The WDME integrates a configurable scheduler that enables automated periodic execution of the WDQF. This scheduler triggers the DQA and DVR-tools at predefined intervals, ensuring continuous oversight of data integrity with minimal manual effort. In Figure 1c, the WDME scheduler interface is shown, showcasing the configuration options for scheduling and automating the WDQF. These options enable users to seamlessly integrate quality checks into routine data workflows.
To support streamlined data handling, the WDME includes a dedicated tool called the Data Preparation Pipeline Editor. This intuitive interface enables the creation of Mashups, custom workflows that connect logical operators responsible for specific data transformations or validations, as illustrated in Figure 1b.
Description of the pilot implementations
Spanish pilot
This pilot aimed to define and visualise KPIs relevant to water management, such as hydraulic efficiency, registered water and network losses, by leveraging integrated datasets. We note here that by network losses it means water-balance losses, that is, the difference between system- or DMA-level input volume and billed consumption, plus authorised consumption where available. This definition is related to, but not equivalent to, IWA Non-Revenue Water (Alegre et al., Reference Alegre, Baptista, Cubillo, Duarte, Hirner, Merkel and Parena2000), which additionally accounts for authorised unbilled consumption and other components.
The dataset analysed in this study comprises readings from 500 smart water meters installed by Hidralia, collected over a 1-year period (from November 21, 2023, to November 22, 2024) with hourly updates. This dataset provides valuable insights into water consumption patterns and the operational performance of smart metering technologies and includes the following variables:
-
• METERSERIAL: A unique identifier for each meter device.
-
• SAMPLETIME: The timestamp of each reading recorded by the meter.
-
• DELTA: The water consumption for each specific hour. Expected to be ≥0.
The smart meters occasionally experience connectivity issues, which result in missing data points, as the meters fail to update their readings at the scheduled hourly intervals. Hence, a comprehensive data quality assessment has been conducted to ensure the dataset’s reliability and suitability for analysis of the meter devices. It is worth mentioning that the assessment did not ingest AMI alarm or event streams (e.g., communication failure, tamper or leak alarms) as separate contextual inputs. Consequently, missing intervals were identified as timeliness issues based on the absence of expected readings, but they were not automatically attributed to specific operational causes through alarm correlation.
Finally, for the reconciliation part, the smart metering time series have been complemented with external hourly temperature records for Malaga, aligned with the meter timestamps as a preprocessing step before being used by the DVR-tool (see Supplementary Materials, p. 9).
Dutch pilot
The Dutch pilot involves a relevant business-related use case, where the WDME is being utilised and its various functionalities are being tested. The pilot has an overarching title – Prediction of water quality and its impact in the treatment steps. The geographical location is the IJsselmeer water body, which is a crucial source of water treated and delivered to customers in the North-West region of the Netherlands, provided by the water utility company PWN.
The dataset analysed in the Dutch pilot comprises conductivity readings from sensors deployed by PWN, collected over a period of almost 2 and a half years (from June 28, 2022, to October 18, 2024) with hourly updates. This dataset provides valuable insights into the environmental conditions affecting water quality and operational efficiency in the region of Andijk. The dataset includes the following variables:
-
• ophaal tijdstip: The timestamp of each reading recorded by the sensor.
-
• conductivity_sensorX ( $ X=1\;\mathrm{or}\;2 $
 ): Conductivity measurement at inlet channel X. Expected to range between 30 and 100 millisiemens per meter and should not exhibit a flatline for more than five consecutive readings.

A comprehensive data quality assessment has been conducted to ensure the dataset’s reliability and suitability for analysis of the conductivity sensors. For validity, the values were verified to ensure they were within the correct range and were checked for flatline behaviour.
Results and discussion
In this section, we present the findings from the two pilots where the framework has been demonstrated in representative operational pilot settings.
The present work should be interpreted as a proof-of-concept demonstration rather than a comprehensive comparative validation study. While the framework was successfully instantiated in two pilots, the evaluation did not include benchmarking against alternative data-quality frameworks, systematic sensitivity analysis under controlled noise conditions or large-scale testing across highly heterogeneous multi-parameter datasets. These aspects represent important next steps for future research.
Compared with general data-quality frameworks discussed in the literature, the proposed framework contributes at three levels. First, it operationalises common dimensions through concrete metrics and rules suited to high-frequency water-sector time series. Second, it introduces an explicit assessment–reconciliation–reassessment cycle, allowing data quality management to function as a continuous operational process rather than as a one-off diagnostic exercise. Third, it is supported by a practical tool ecosystem consisting of the DQA-tool, the DVR-tool and their orchestration within the WDME, which facilitates repeatable deployment, reporting and automation.
Further, in many operational settings, data-quality improvement is slowed down because assessment, anomaly detection, correction and reporting are handled through separate tools or manual procedures. By combining the DQA-tool, the DVR-tool and the WDME orchestration layer, the WATERVERSE approach provides a more deployable workflow: datasets can be assessed with explicit rules, corrected using consistent reconciliation procedures and reevaluated within the same environment.
Quality assessment using DQA
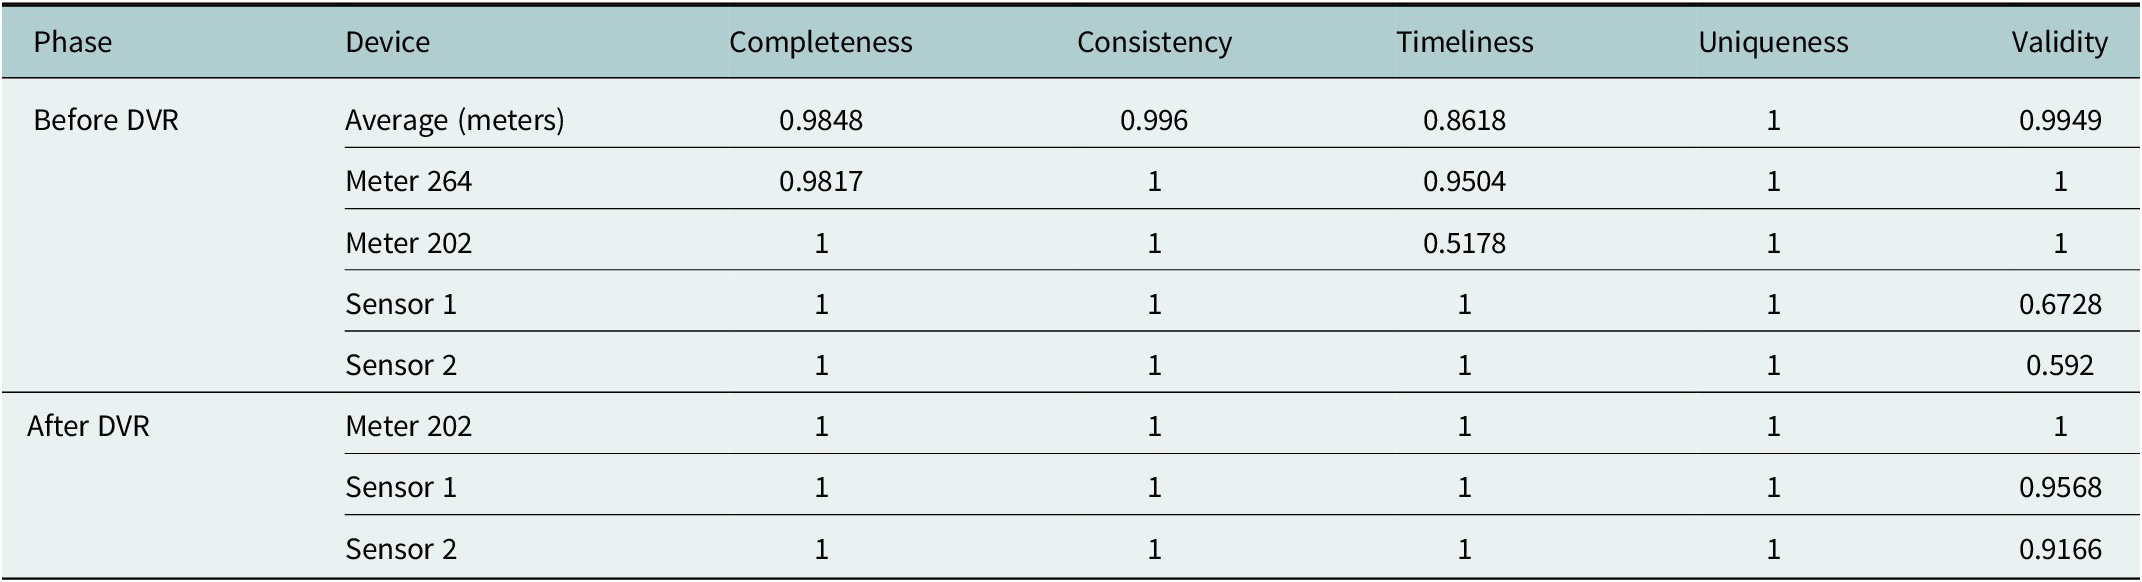
The summarised findings of the DQA-tool for the Spanish pilot, based on the averaged results within all devices, are shown in Table 1, where the ID used for the assessment was created by concatenating the METERSERIAL and SAMPLETIME columns, while the date variable was selected to be the SAMPLETIME column. Moreover, meters 202 and 264 of the Spanish pilot were specifically examined, as they each presented distinct scenarios that are inherently interesting.
Data quality assessment results for Spanish smart metering data (overall average and meters 264 and 202) and Dutch conductivity data (sensors 1 and 2), before and after DVR-tool application
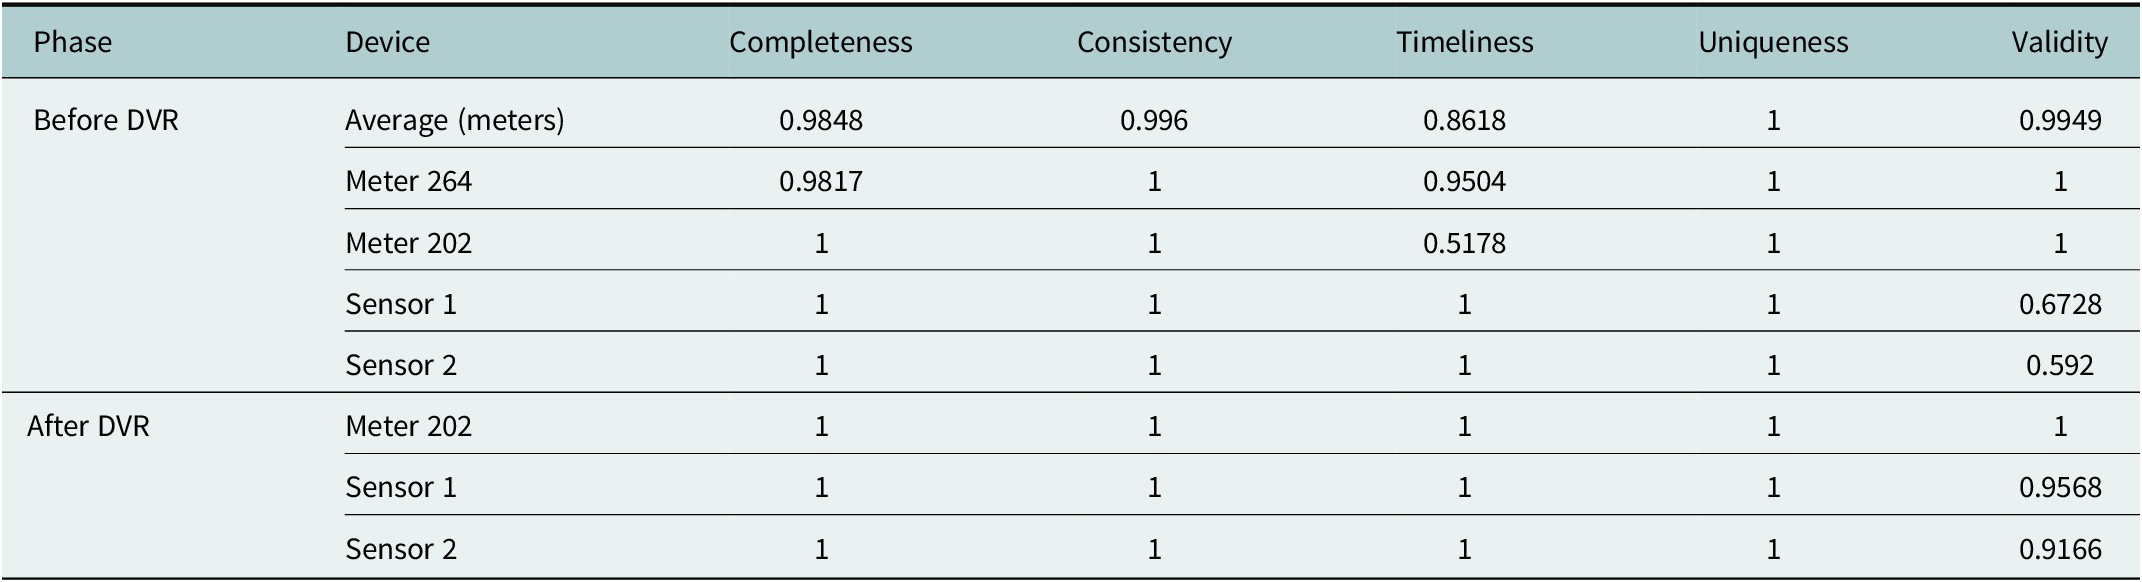
Table 1. Long description
From the top, the table is divided into two main phases: Before DVR and After DVR. Under Before DVR, the devices listed are Average (meters), Meter 264, Meter 202, Sensor 1, and Sensor 2. For Average (meters), completeness is 0.9848, consistency is 0.996, timeliness is 0.8618, uniqueness is 1, and validity is 0.9949. For Meter 264, completeness is 0.9817, consistency is 1, timeliness is 0.9504, uniqueness is 1, and validity is 1. For Meter 202, completeness is 1, consistency is 1, timeliness is 0.5178, uniqueness is 1, and validity is 1. For Sensor 1, completeness is 1, consistency is 1, timeliness is 1, uniqueness is 1, and validity is 0.6728. For Sensor 2, completeness is 1, consistency is 1, timeliness is 1, uniqueness is 1, and validity is 0.592. Under After DVR, Meter 202, Sensor 1, and Sensor 2 are listed. For Meter 202, all values are 1. For Sensor 1, completeness, consistency, timeliness, and uniqueness are 1, validity is 0.9568. For Sensor 2, completeness, consistency, timeliness, and uniqueness are 1, validity is 0.9166. The table shows that after DVR-tool application, validity scores for sensors and Meter 202 increase, with all other metrics reaching 1.
Meter 264 showed excellent results, achieving maximum scores across three out of five dimensions except for completeness and timeliness, which scored 98.17% and 95.04%, respectively (refer to Table 1). Therefore, the overall data quality remains high, demonstrating the smart meter’s strong performance and reliability in accurately capturing water consumption data, thus not requiring reconciliation to improve the data quality.
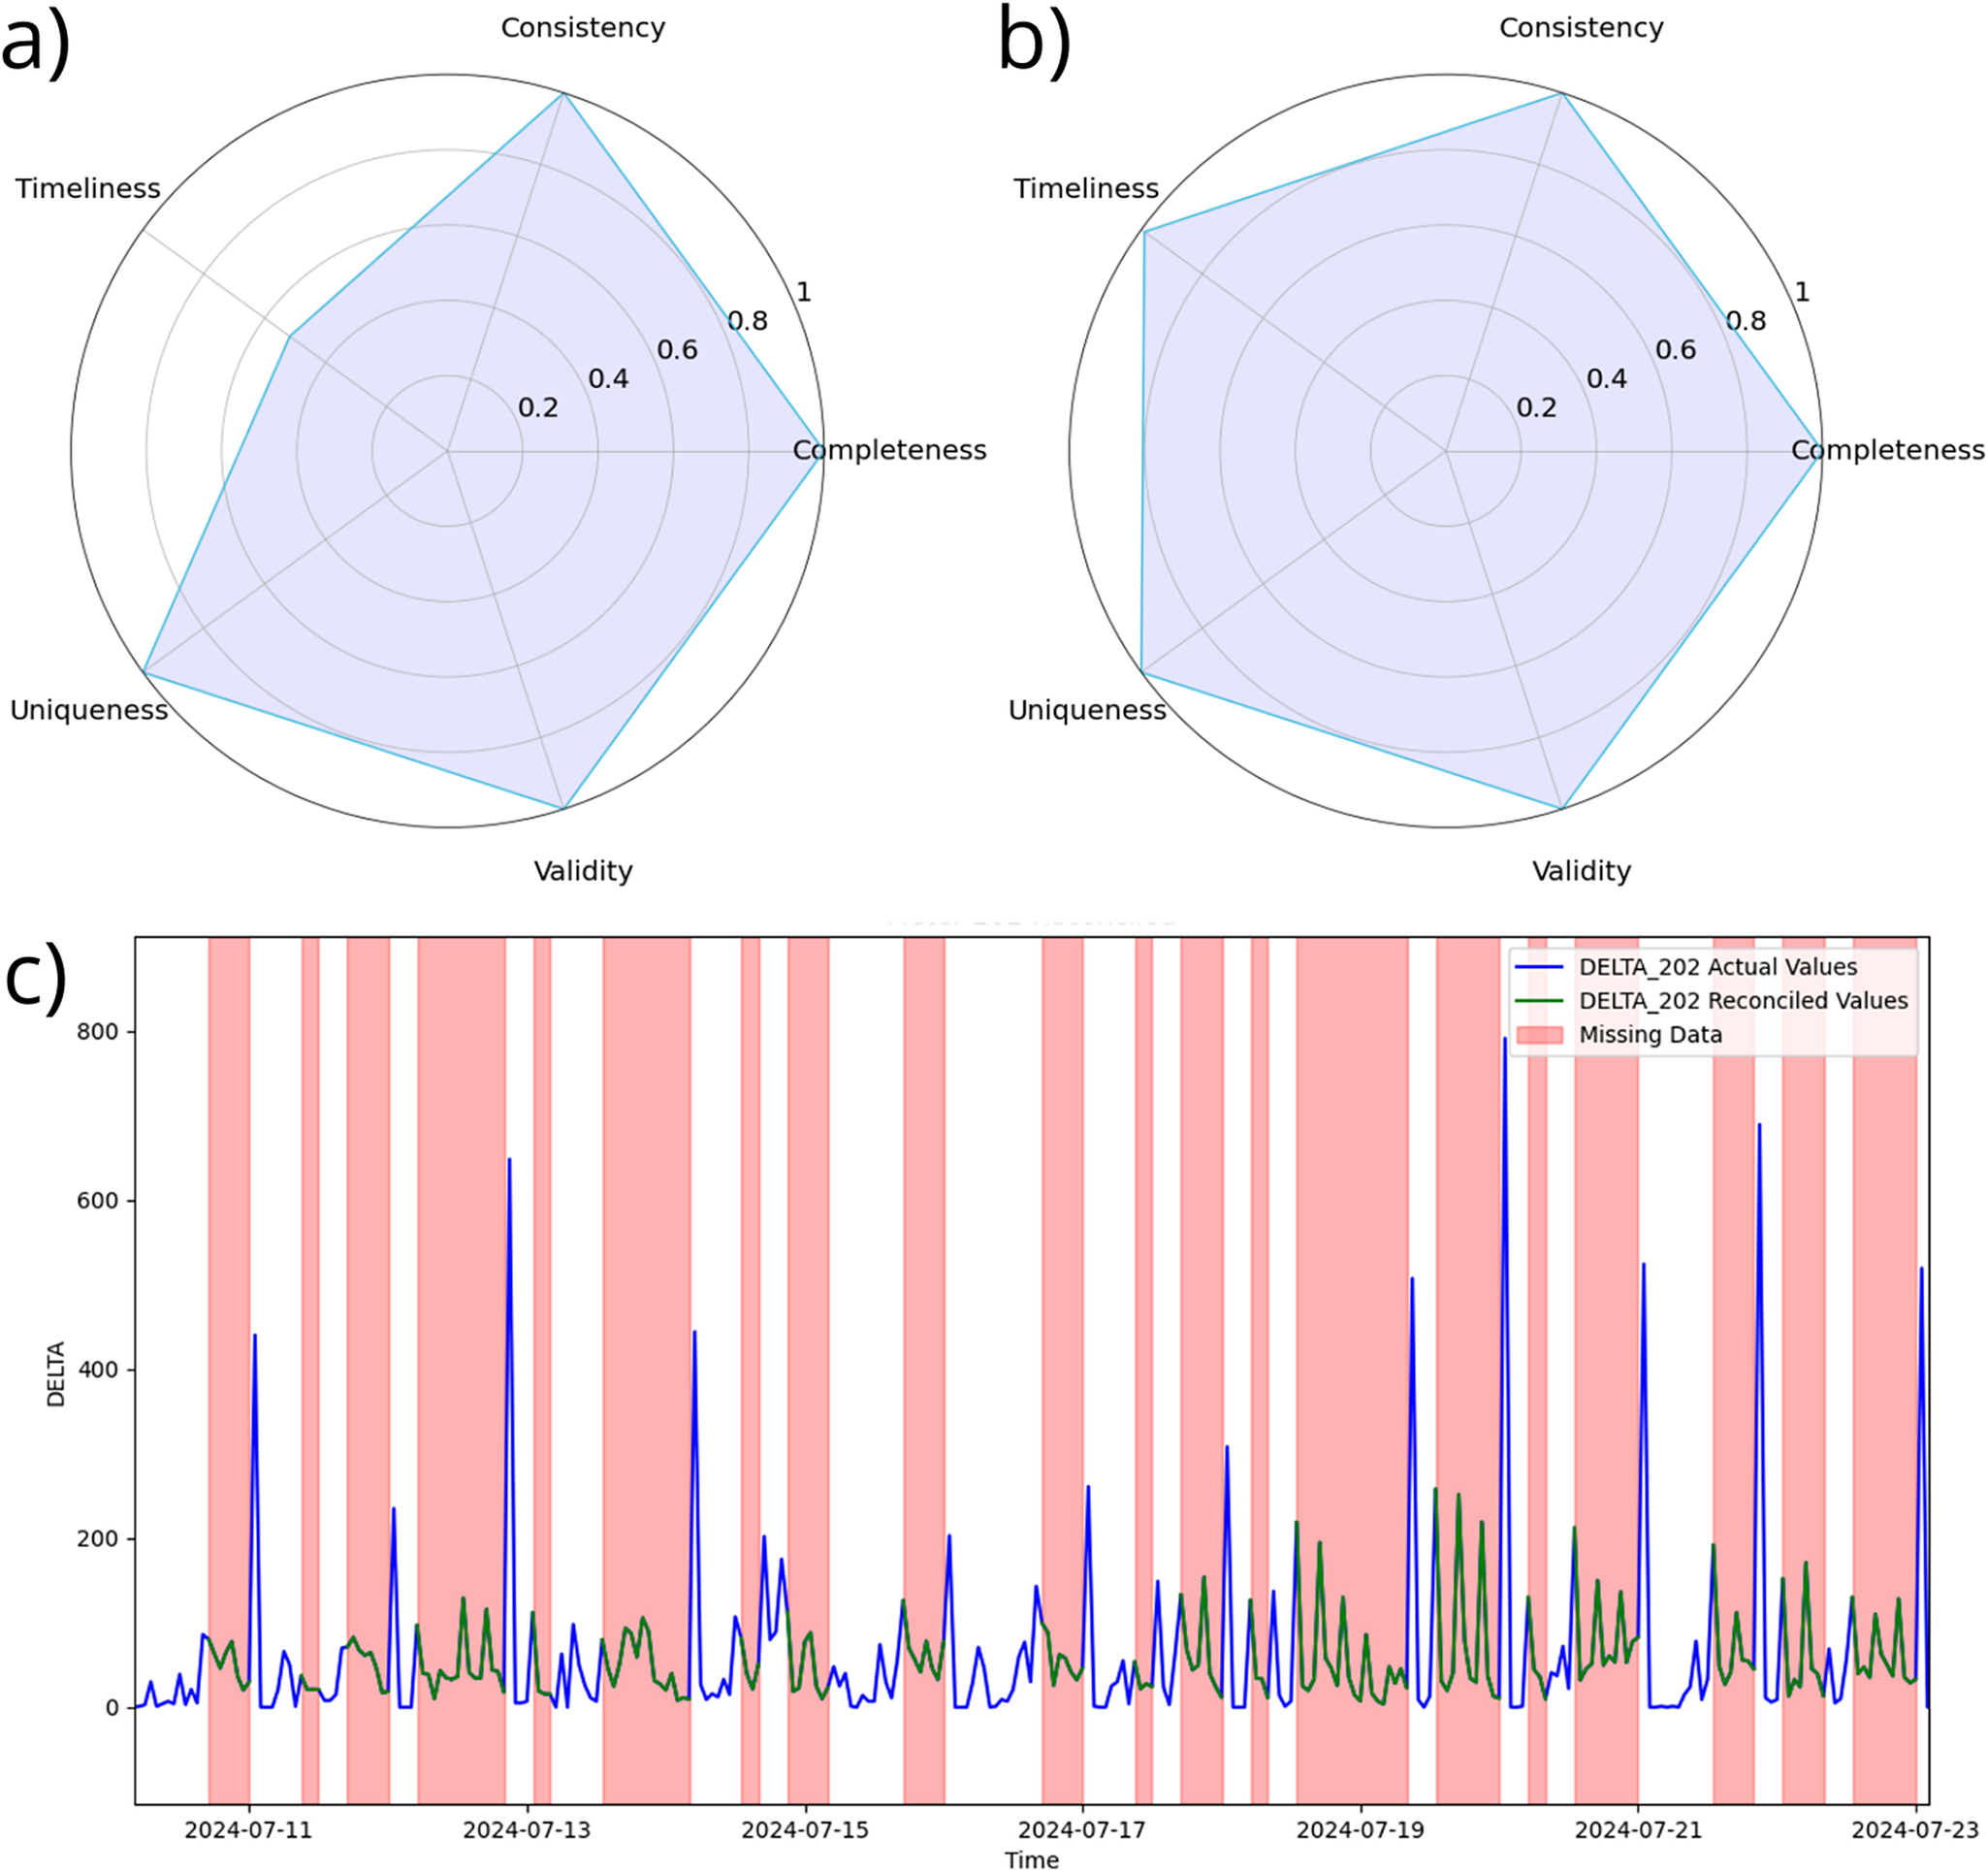
Meter 202 achieves high ratings across all dimensions, but timeliness, which scored by 51.78% (refer to Table 1 and Figure 2a). The significantly low timeliness score reveals that there are no data updates at certain timestamps, severely affecting the overall quality of the readings for diverse applications.
Results of the data quality assessment for meter 202 of the Spanish pilot across the five dimensions for the variable DELTA (Spanish smart metering data) (a) before conducting quality improvements using the DVR-tool and (b) after conducting quality improvements using the DVR-tool. (c) A time-series plot that illustrates an example of the data validation and reconciliation process performance, showcasing the detected anomalies and the reconciled values from a Random Forest Regression model.
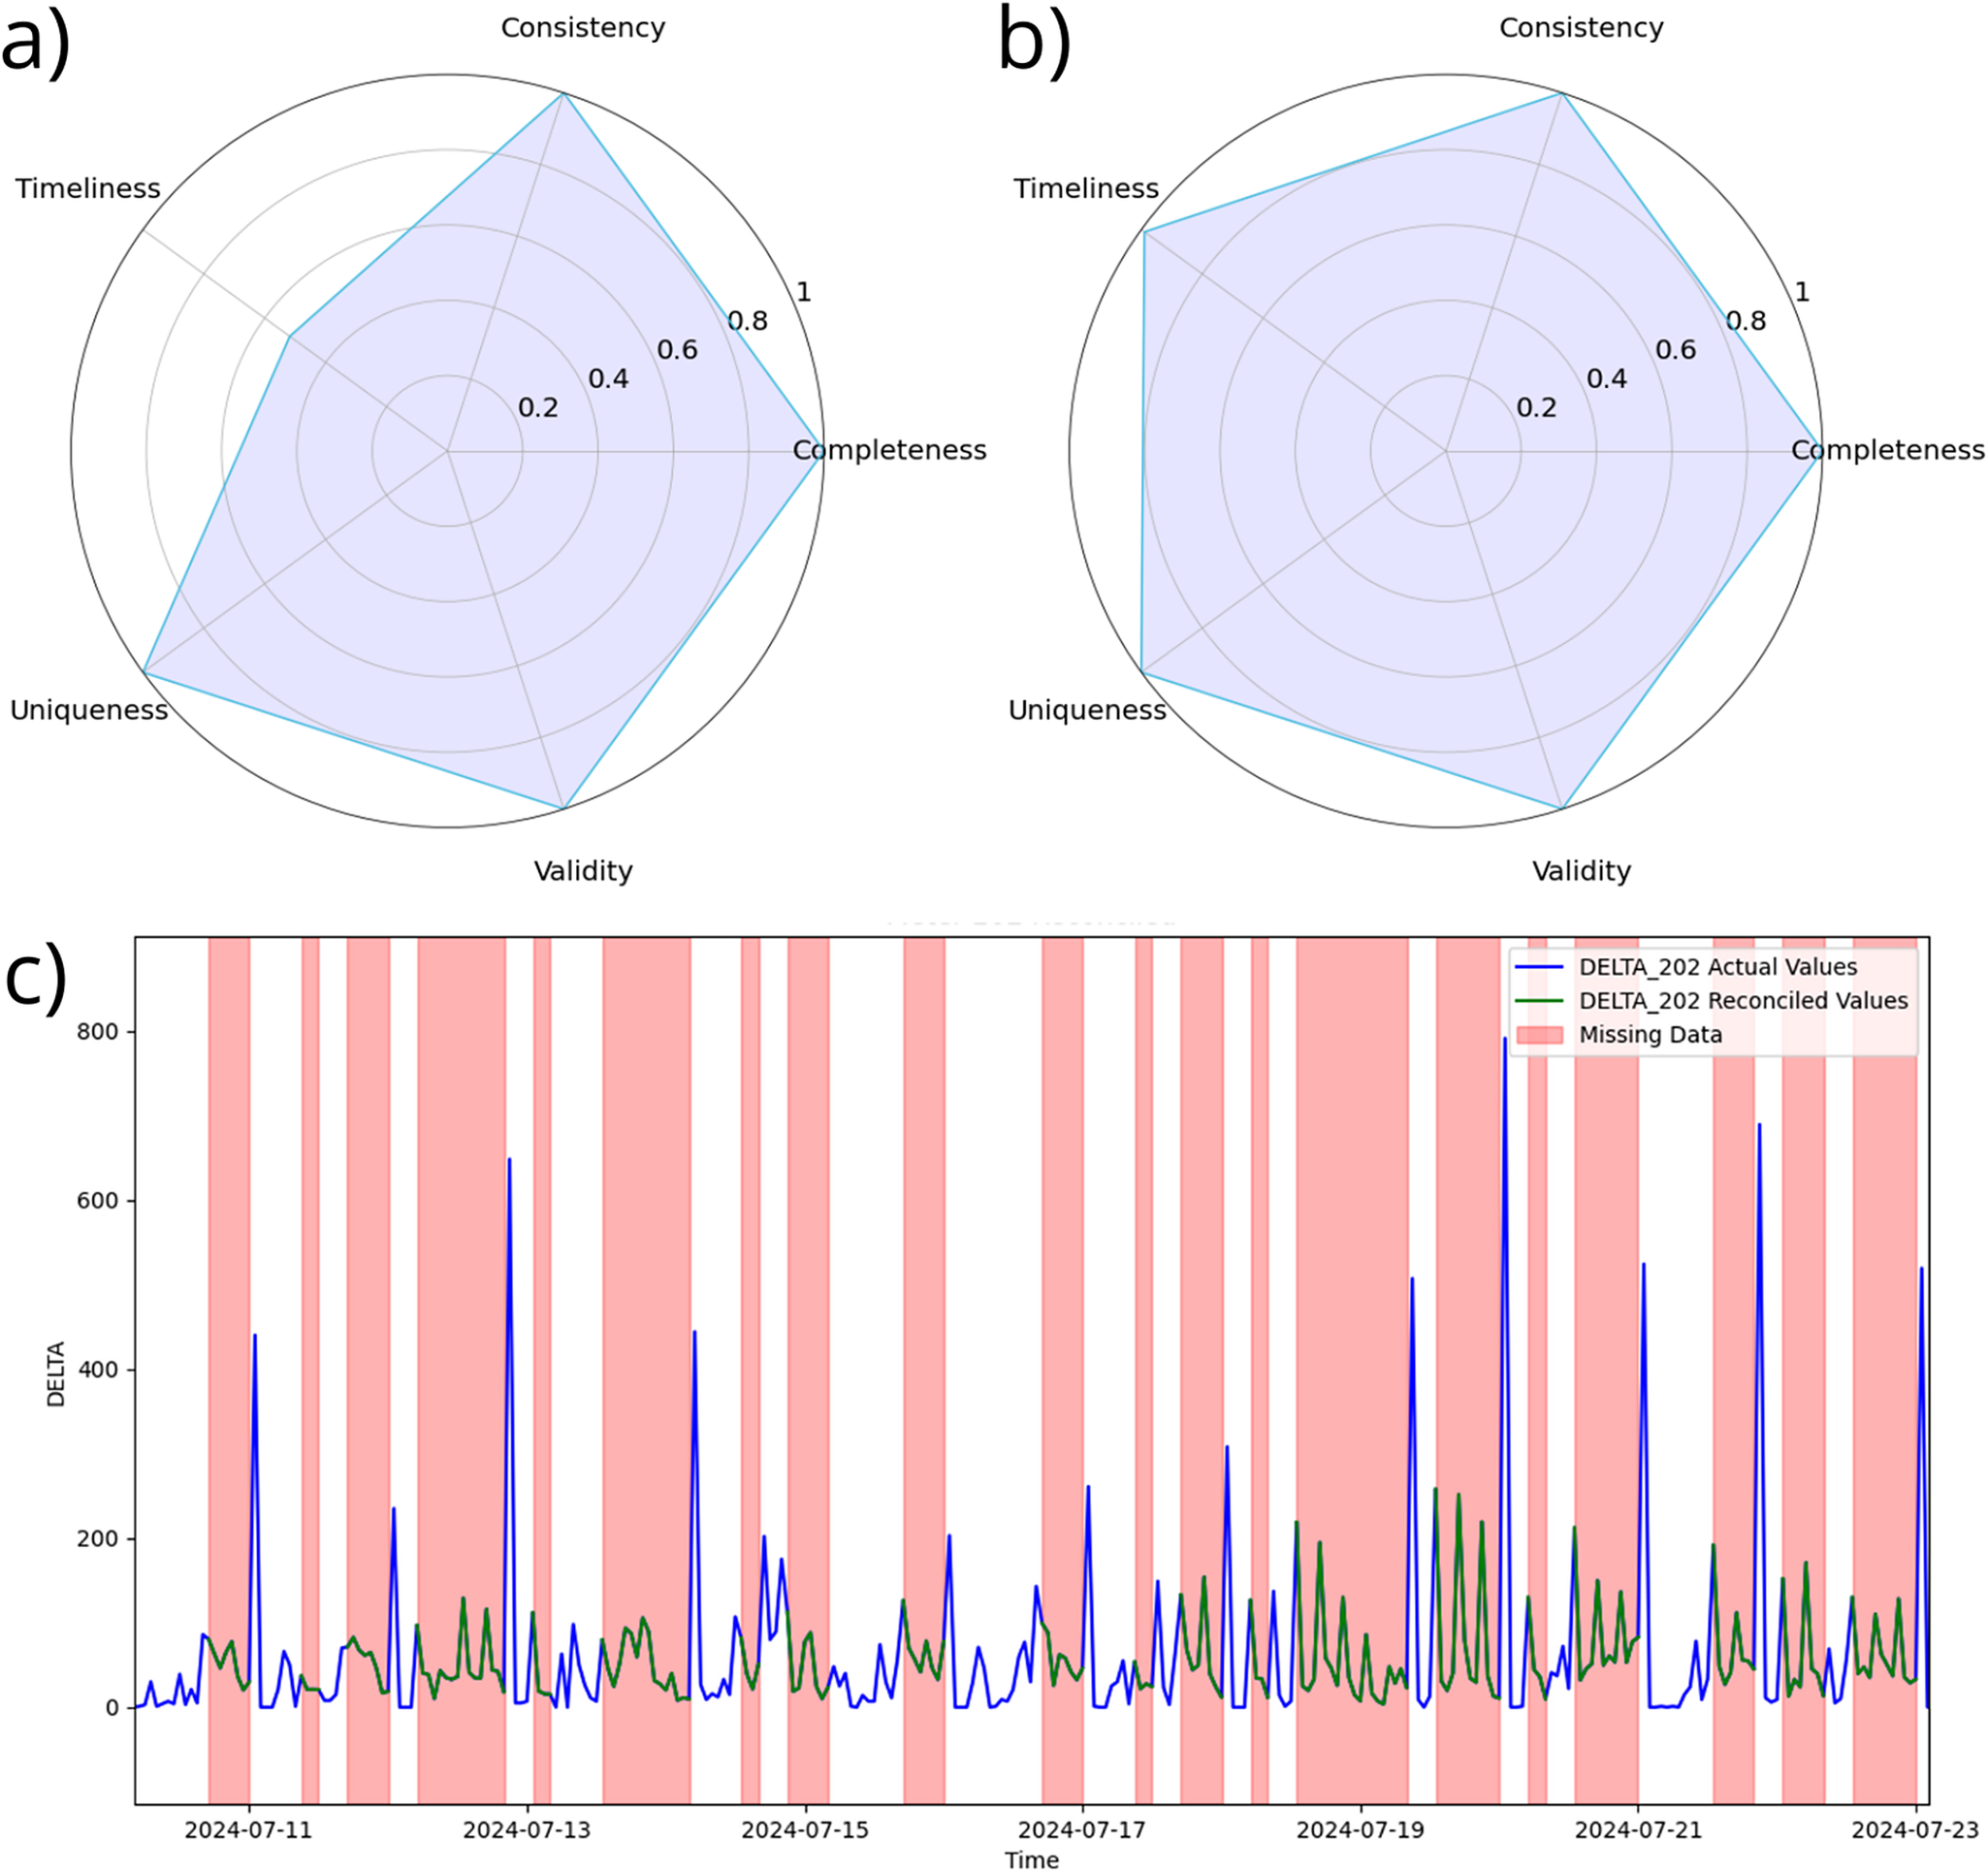
Figure 2. Long description
The top row contains two radar charts. Panel a, at top left, shows five axes labeled Consistency, Completeness, Validity, Uniqueness, and Timeliness. The shaded area is irregular, with lower values for Timeliness and Uniqueness, and higher for Consistency and Completeness. Panel b, at top right, repeats the same axes but the shaded area is larger and more regular, indicating improved scores across all dimensions after quality improvements. The bottom panel, labeled c, is a time-series plot with x-axis labeled Time, ranging from 2024-07-11 to 2024-07-23, and y-axis labeled DELTA. Three data series are shown: blue line for DELTA_202 Actual Values, green line for DELTA_202 Reconciled Values, and vertical pink bands for Missing Data. The blue line shows frequent spikes, the green line is smoother and lower, and pink bands indicate intervals of missing data. The legend in the top right of panel c identifies each series.
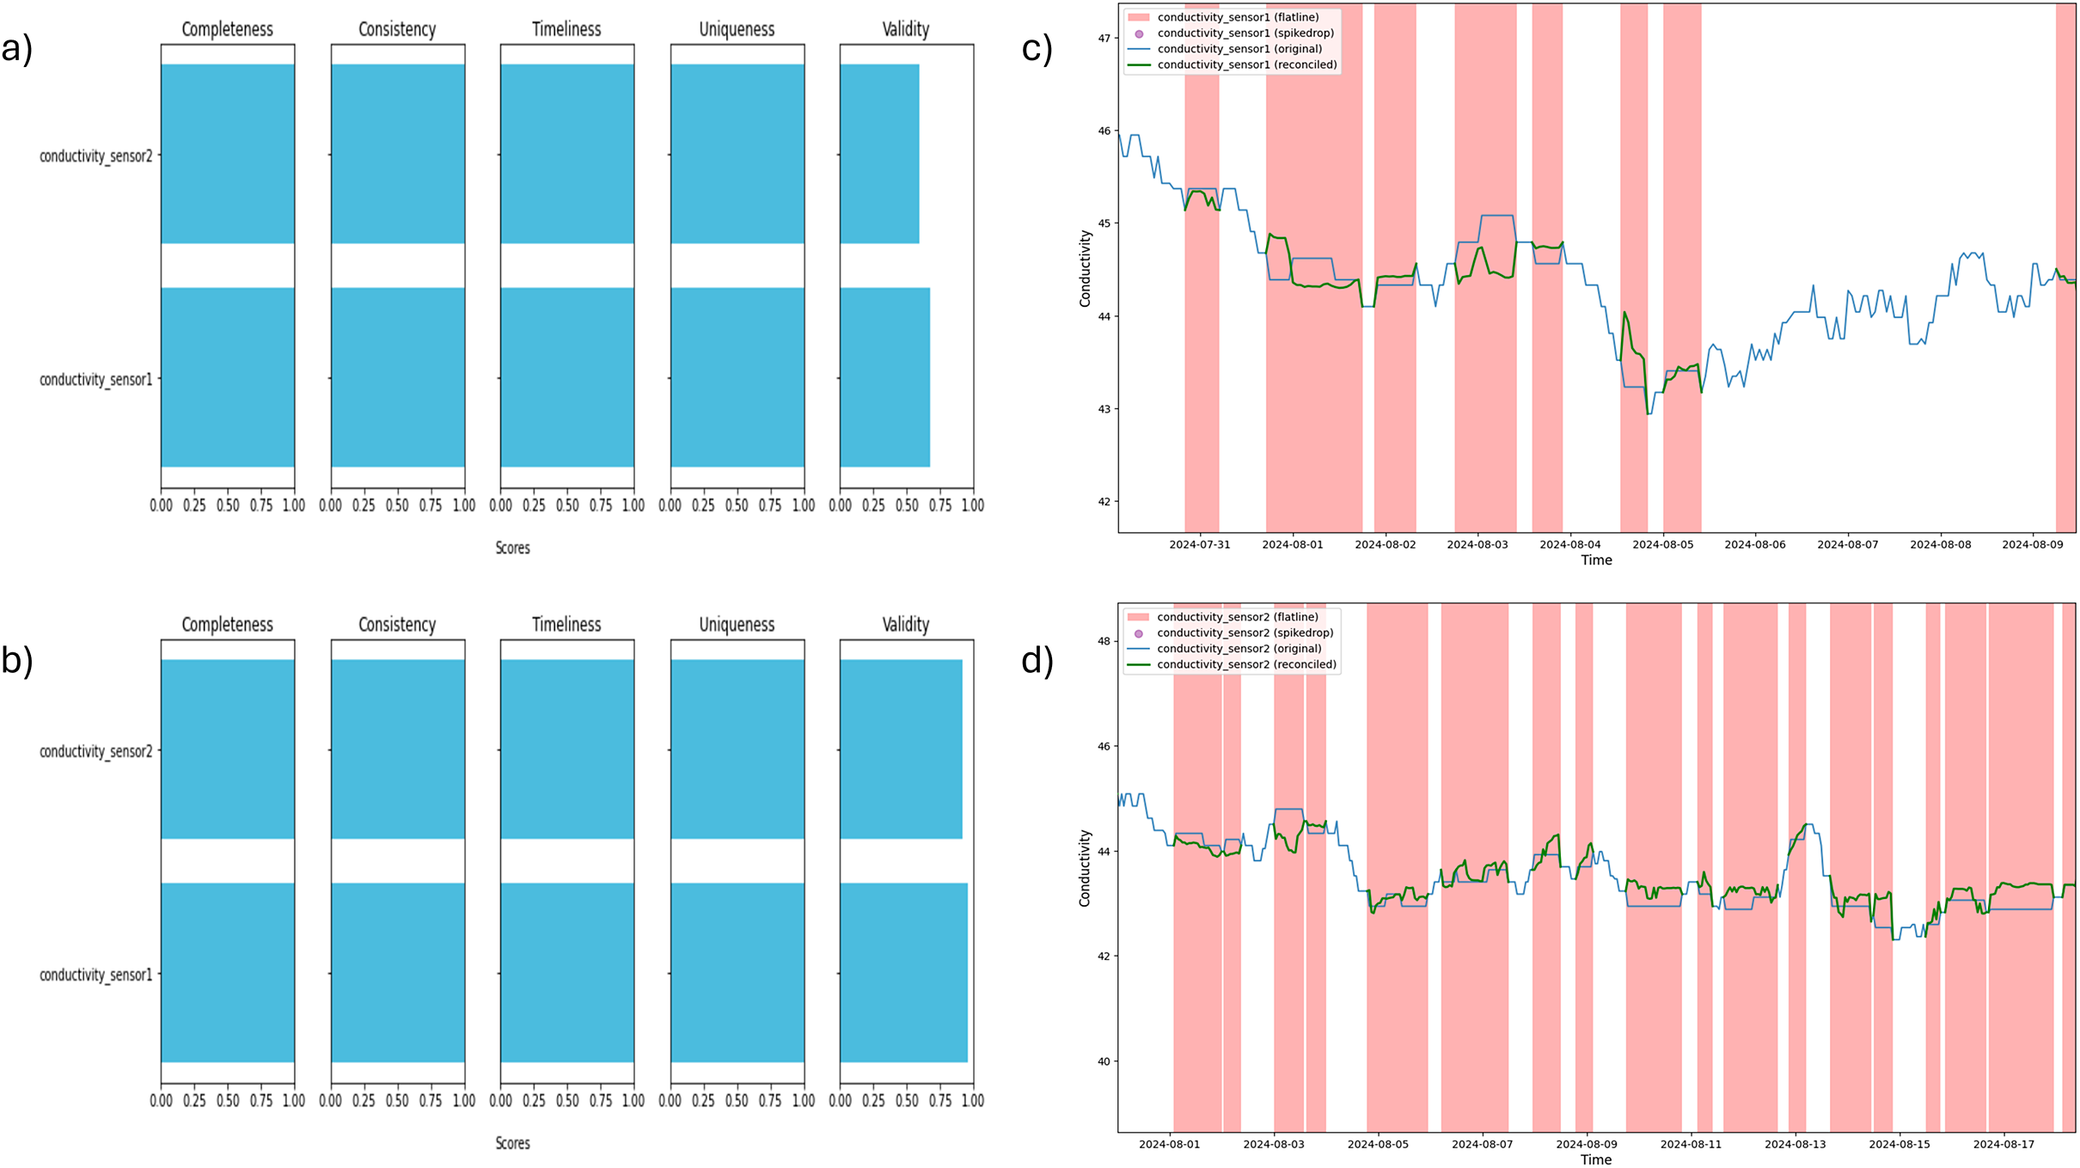
On the other side, the results of the DQA for the dataset of the Dutch pilot are summarised in Table 1 and Figure 3a. Both the ID and date variables were chosen to be the ophaal tijdstip variable. For the dimensions of completeness, consistency, timeliness and uniqueness, both the conductivity sensors scored the maximum score. Only the validity dimension scored lower, 67.28% and 59.20% for sensors 1 and 2, respectively. This indicates that the data for the Dutch pilot contains values that do not adhere to the applied threshold rules and/or are part of flatline segments.
Results of the data quality assessment for the two conductivity sensors of the Dutch pilot across the five dimensions (a) before conducting quality improvements using the DVR-tool and (b) after conducting quality improvements using the DVR-tool. A time-series plot that illustrates an example of the data validation and reconciliation process performance, showcasing the detected anomalies and the reconciled values from a Random Forest Regression model for (c) conductivity sensor 1 and (d) conductivity sensor 2.
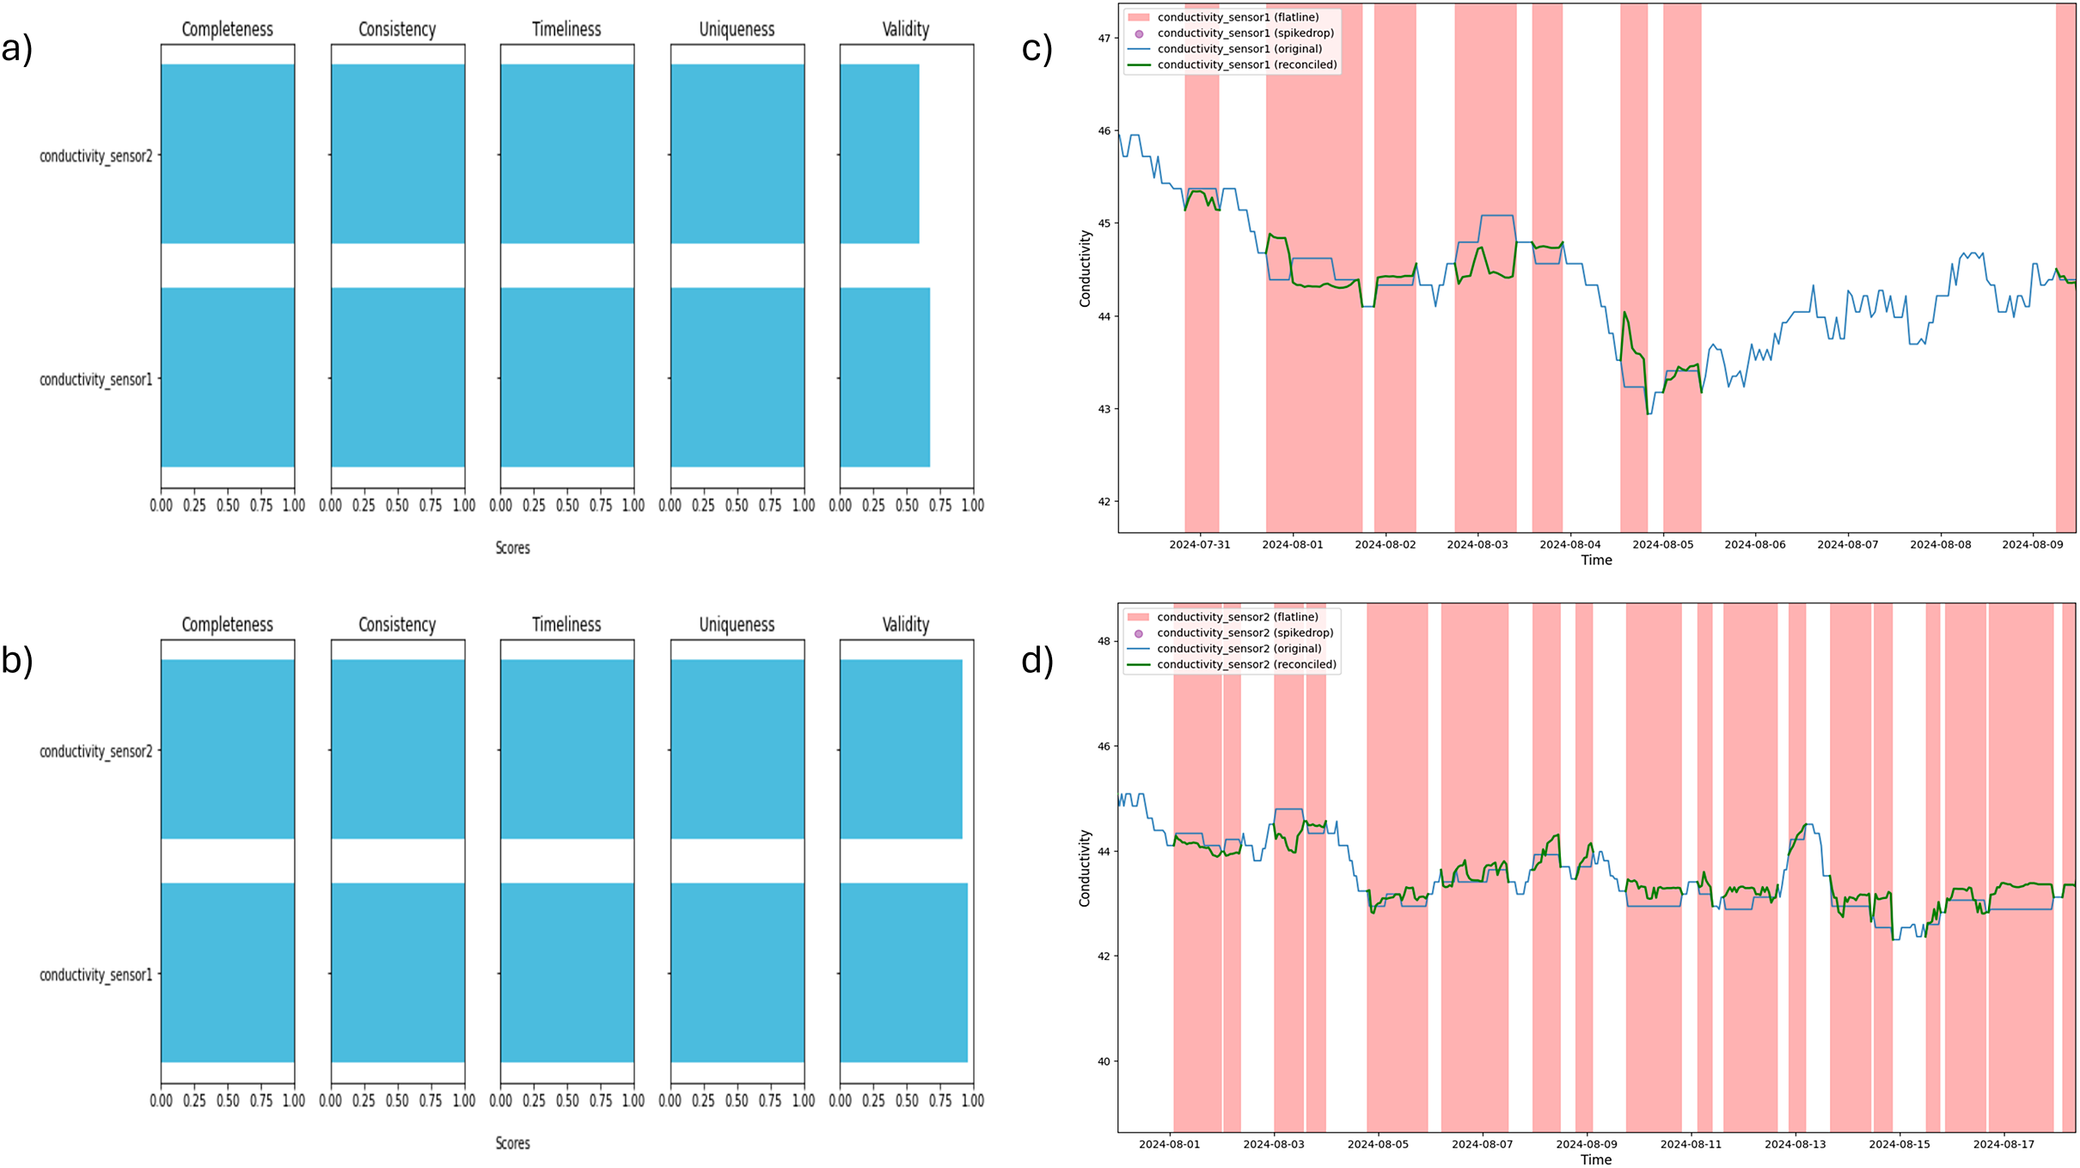
Figure 3. Long description
Panel a at top-left shows grouped horizontal bar charts for conductivity sensor 1 and conductivity sensor 2, with five metrics labeled Completeness, Consistency, Timeliness, Uniqueness, and Validity on the x-axis scored from 0 to 1. Both sensors score high on all metrics except Validity, where sensor 1 is lower. Panel b at bottom-left repeats the same structure after DVR-tool processing, with both sensors now scoring 1.00 on all metrics. Panel c at top-right is a time-series plot for sensor 1, with the x-axis labeled Time and the y-axis labeled Conductivity. Three lines are shown: baseline (blue), original (red), and reconciled (green), with vertical pink bands marking detected anomalies. The reconciled line closely follows the baseline except during anomalies. Panel d at bottom-right is the same format for sensor 2, showing improved alignment between reconciled and baseline values after DVR-tool processing, with anomalies similarly highlighted.
The DQA-tool provides flexible result visualisations to improve clarity and support different assessment scenarios. In the Spanish pilot, where only one variable for 1 m is evaluated, pie charts are used to clearly illustrate performance across the five data quality dimensions. In contrast, the Dutch pilot assesses two separate conductivity measurements, each across the same five dimensions. To better accommodate this added complexity and provide a consolidated view, bar plots are used instead.
Anomaly detection using DVR
Meter 202 data from the Spanish pilot was subjected to the DVR-tool to detect and reconcile anomalous data points. The anomalies were detected using the missing data AD method of the DVR-tool (refer to Figure 2c). For more details, see the Supplementary Materials, p. 18. As expected, based on the timeliness score of the DQA-tool, the data contained numerous missing data points. In total, 4,169 data points were detected by the missing data AD method of the DVR-tool.
For the Dutch pilot, both conductivity sensor 1 and conductivity sensor 2 were also subjected to the DVR-tool to detect and reconcile anomalous data points. The anomalies were detected using the flatline and spikedrop AD method of the DVR-tool (refer to the Supplementary Materials, p. 18, for more details). As expected based on the DQA results, the data for both sensors contained anomalous data, consisting of 6,591 flatline data points and 7 spikedrop data points for conductivity sensor 1, and 8,236 flatline and 8 spikedrop data points for conductivity sensor 2.
Data reconciliation using DVR
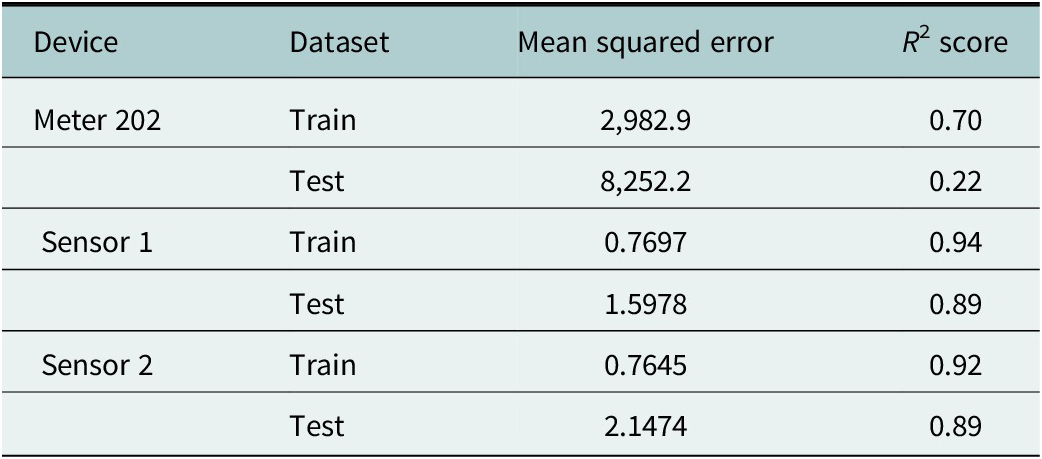
To enable data reconciliation through model-based predictions in the Spanish pilot, a Random Forest (RF) regression model (Segal, Reference Segal2004) was trained using historical water consumption data together with external hourly meteorological data, specifically air temperature records for Malaga obtained from AEMET (Agencia Estatal de Meteorología 2025). The temperature series was temporally aligned with the smart-meter data through the timestamp variable so that each hourly DELTA observation was matched to the corresponding hourly temperature value. In addition to the contemporaneous temperature, lagged temperature variables (1, 2 and 3 h) were included as predictors. Feature engineering was applied to these datasets by deriving additional statistical features. Model training and evaluation were performed using 1 year of available data. To allow the model to learn long-term dynamics and seasonality, the first 3 weeks of each month were used for training, while the final week was reserved for testing. Owing to the limited data volume, the model achieved an
$ {R}^2 $
 of 0.22 on the test set.
Similarly, for the Dutch pilot, an RF regression model was trained using data from both conductivity sensors. For each target sensor, the feature set consisted solely of lagged values (1–24 h) from the other sensor, capturing short-term dynamics and daily periodicity. A chronological split was applied, using the first 80% of observations for training and the remaining 20% for testing to preserve temporal ordering. The resulting models achieved an
$ {R}^2 $
 of 0.89 on the test set for the conductivity sensor 1 and an
$ {R}^2 $
of 0.89 on the test set for the conductivity sensor 1 and an
$ {R}^2 $
 of 0.89 for sensor 2.
The resulting model performance for each of the RF models is given in Table 2. Additional information on model parameters and performance of both reconciliations is provided in the Supplementary Materials (see p. 18).
Model performance of the random forest regression model for reconciliation of anomalous data for meter 202 in the Spanish pilot, and for conductivity sensors 1 and 2 in the Dutch pilot
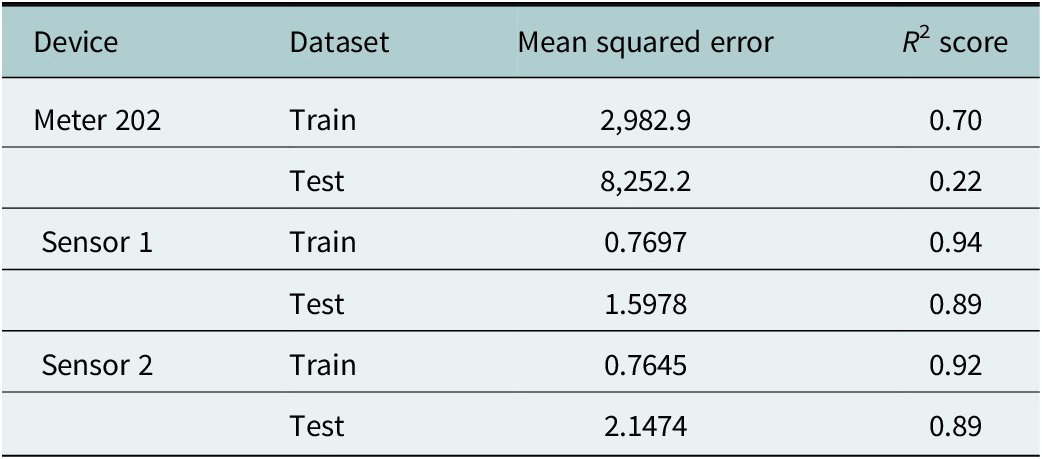
Table 2. Long description
The table has four columns: Device, Dataset, Mean squared error, and R squared score. For Meter 202, Train set shows mean squared error 2,982.9 and R squared 0.70; Test set has mean squared error 8,252.2 and R squared 0.22. For Sensor 1, Train set shows mean squared error 0.7697 and R squared 0.94; Test set has mean squared error 1.5978 and R squared 0.89. For Sensor 2, Train set shows mean squared error 0.7645 and R squared 0.92; Test set has mean squared error 2.1474 and R squared 0.89. The table demonstrates higher model performance for both sensors compared to Meter 202, with lower errors and higher R squared scores, especially on test data.
In this study, data-driven models were applied for reconciliation. This is only one of the possible modelling approaches supported by the architecture of the DVR-tool. When data are limited, as is the case in the Spanish pilot, a mechanistic or physics-based model grounded in water consumption trends, demographics patterns and mass-balance principles may generalise better than a data-driven RF model. With only a small dataset available for training, the RF model’s ability to learn patterns can be constrained. However, mechanistic models require specialised knowledge of the local conditions and system characteristics that are not always available, and they can also lead to over-parameterization if not carefully constrained. Alternatively, retraining the data-driven model over time, with more data collected and quality controlled, facilitated by the WDQF, could provide opportunities for model performance enhancement.
Data improvement cycle
For the Spanish pilot, the reconciled dataset was generated by iterating through the available observations, applying missing data AD to each data point, and replacing anomalous values with model-based predictions. As all detected anomalies corresponded to missing data, the pretrained model could be used directly for reconciliation. The reconciled dataset was subsequently evaluated using the DQA-tool. Hence, after applying the DVR-tool, the timeliness dimension improved to a perfect score, yielding near-maximum results across all data quality dimensions. This improvement highlights the effectiveness of the reconciliation process in addressing data gaps. The reconciled time series exhibits a more consistent and complete pattern, as shown in Figure 2b.
For the Dutch pilot, the validity dimension similarly improved to an almost perfect score after applying the DVR-tool, indicating that validity issues can also be addressed through the Data Improvement Cycle. The assessment results are summarised in Table 1 and Figure 3b.
It is important to note that the Data Improvement Cycle only verifies the dimensions assessed by the DQA-tool. Consequently, if anomalous values are replaced with entries that satisfy the validity rules but are nonetheless incorrect (e.g., setting all anomalous points to 1), the DQA score may still remain high after validation and reconciliation with the DVR-tool.
Conclusions
The WDQF represents a significant advancement in addressing data quality challenges within the water sector. By focusing on five key dimensions, the framework establishes a robust foundation for improving data reliability and supporting informed, data-driven decision-making.
Through its implementation and proof of concept in pilot settings in Spain and the Netherlands, the framework has shown its practical applicability for improving reported data-quality indicators and supporting more reliable downstream use of water-sector time-series data. Although these pilot results are encouraging, broader validation across larger-scale, multi-parameter datasets and comparative benchmarking against existing approaches remain necessary to fully quantify the framework’s generalisability and performance.
These pilots provide valuable insights into their practical application, illustrating their ability to tackle common data quality challenges such as outdated information and erroneous values. By leveraging this framework, water utilities can improve operational efficiency, optimise resource allocation and enhance service delivery to customers, ultimately contributing to better management of critical water resources.
However, the results also highlight a key limitation: the Data Improvement Cycle verifies improvements only in relation to the dimensions assessed by the DQA-tool. This means that reconciled values that meet rule-based constraints may still be physically or operationally incorrect. Future work should extend the framework by introducing complementary safeguards, such as physics-informed plausibility checks and uncertainty quantification for reconciled values. Further exploration of cross-sensor consistency constraints and broader quality dimensions, such as accuracy, will also be critical in enhancing the framework’s robustness. Expanding the evaluation of reconciliation strategies to encompass a wider range of utilities, sensors and operational conditions will increase the generalizability and adoption of the framework.
Overall, the WDQF not only offers a practical, tool-supported pathway for continuously assessing and improving water-sector time-series data but also advances the potential for data-driven decision-making and digital-twin applications. This approach lowers barriers to scalable data-space solutions, fostering collaboration across sectors and improving the resilience of water management systems globally.
Open peer review
To view the open peer review materials for this article, please visit http://doi.org/10.1017/wat.2026.10023.
Supplementary material
The supplementary material for this article can be found at http://doi.org/10.1017/wat.2026.10023.
Data availability statement
The data that support the findings of this study (Spanish smart metering time series and Dutch conductivity sensor time series) are subject to third-party and privacy restrictions and are therefore not publicly available. Access may be granted upon reasonable request to the corresponding author, subject to approval by the respective data owners and applicable legal and contractual requirements. The configuration of the data quality assessment rules and the reconciliation approach used in this study are described in the article and Supplementary Materials.
Acknowledgements
The authors would like to thank all the partners from the WATERVERSE and IDEATION consortia for their support during the definition, implementation and demonstration of the proposed framework. Further, the authors used ChatGPT (OpenAI) for minor English language editing, including spelling correction and wording suggestions. All scientific content, interpretation and final wording were reviewed and approved by the authors.
Author contribution
The authors contributed to this work as follows, in line with the CRediT taxonomy:
-
• Conceptualization: Sergi Baena-Miret; Tessa Vrijhoeven; Aron Aksan; Andrea Vedruccio; Siddharth Seshan; David Rosado Rodríguez; Matteo Basile; Eloisa Vargiu; Gerasimos Antzoulatos; Stefanos Vrochidis.
-
• Methodology: Sergi Baena-Miret; Tessa Vrijhoeven; Aron Aksan; Andrea Vedruccio; Siddharth Seshan; David Rosado Rodríguez; Matteo Basile; Eloisa Vargiu; Gerasimos Antzoulatos.
-
• Data curation: Sergi Baena-Miret; Tessa Vrijhoeven; Aron Aksan; Siddharth Seshan; David Rosado Rodríguez; Javier Haro Reyes; Suze van der Meulen.
-
• Data visualisation: Sergi Baena-Miret; Tessa Vrijhoeven; Aron Aksan; Andrea Vedruccio; Siddharth Seshan; David Rosado Rodríguez.
-
• Writing original draft: Sergi Baena-Miret; Tessa Vrijhoeven; Aron Aksan; Andrea Vedruccio; Siddharth Seshan; David Rosado Rodríguez; Javier Haro Reyes; Suze van der Meulen; Matteo Basile; Eloisa Vargiu; Gerasimos Antzoulatos;Stefanos Vrochidis.
All authors approved the final submitted draft.
Financial support
The study was partially funded by the European Commission under the call HORIZON-CL4–2021-DATA-01-03, project grant agreement number ID 101070262 (WATERVERSE) and the call HORIZON-MISS-2023-OCEAN-01-09, project grant agreement number ID 101157371 (IDEATION).
Competing interests
The authors declare none.
Inclusivity statement
Inclusivity considerations were not applicable to this study, as it did not involve human participants, communities or stakeholder engagement.
Ethics statements
The research meets all ethical guidelines, including adherence to the legal requirements of the study country.


 Open access


Comments
Dear Editors,
On behalf of all co-authors, I am pleased to submit our manuscript entitled “Ensuring Data Quality in the Water Sector: Challenges, Framework, and Best Practices” for consideration as a Research Article in Cambridge Prisms: Water, for the themed collection “Digital Innovation in Water Management: From Data Foundations to Autonomous Systems.”
Water utilities increasingly rely on high-frequency operational time-series data (e.g., smart metering and online water-quality sensing) to support analytics, forecasting, and digital-twin decision support. However, these ambitions are frequently constrained by inconsistent, siloed, and unreliable data. In this paper we introduce the WATERVERSE Data Quality Framework, a domain-specific, tool-supported framework designed to assess and improve water-sector time-series data through an iterative assessment–reconciliation–reassessment cycle. The framework operationalises five core data quality dimensions (completeness, consistency, timeliness, uniqueness, and validity) and is implemented through two integrated services within a Water Data Management Ecosystem: a Data Quality Assessment (DQA) tool and a Data Validation and Reconciliation (DVR) tool.
We demonstrate the framework in two real-world pilots: hourly Spanish smart-meter consumption data and hourly Dutch conductivity sensor data. The results show measurable improvements in quality scores after reconciliation (e.g., timeliness improvements for a problematic Spanish meter and validity improvements for Dutch conductivity sensors), illustrating how the framework can strengthen data foundations for digital transformation and digital-twin readiness. Beyond the pilot outcomes, we explicitly discuss limitations of rule-based verification and outline future safeguards (e.g., physics-informed plausibility checks, uncertainty quantification, and cross-sensor constraints).
We confirm that this manuscript is original, has not been published previously, and is not under consideration elsewhere. All authors have approved the submitted version and agree to be accountable for the work.
Data and materials availability: The operational datasets used in the pilots are subject to third-party, privacy, and contractual restrictions. Access may be granted upon reasonable request to the corresponding author, subject to approval by the respective data owners and applicable legal requirements. The configuration of the assessment rules and the reconciliation approach are described in the manuscript and supplementary material.
Conflicts of interest: The authors declare no conflicts of interest.
We believe the manuscript aligns strongly with the collection’s focus on data foundations, quality control, integration, and the pathway from early digital initiatives to more advanced, automated water systems. We appreciate your consideration and look forward to the opportunity to contribute to Cambridge Prisms: Water.
Sincerely,
Sergi Baena-Miret (Corresponding Author)
CETAQUA, Cornellà de Llobregat, Catalonia, Spain
Email: sergio.baena@cetaqua.com
On behalf of all co-authors