Introduction
The debate over whether the UK should remain a member of the European Union (EU) is now raging. The outcome of the referendum, on 23 June 2016, is far from certain. The consequent risk of a vote to leave appears already to be weighing on the domestic economy.Footnote 1 The UK economy faces a bi-modal future, one that will, on one level, be resolved in less than two months, at the time of writing; the outcome of the referendum will determine which future path the economy travels. Heightened uncertainty does not end with a vote to leave the EU. Rather there would then be considerable risks arising with respect to outcomes of negotiations to define the UK's relationships with the EU and the rest of the world.
The forecast presented in this chapter is based on the key conditioning assumption that the UK electorate votes to remain a member of the EU. In this chapter we do not discuss the economic implications were the UK to leave the EU. The interested reader should consult Baker et al. and Ebell and Warren, in this Review, for illustrations of the short and long-run impacts, respectively, of a vote to leave.
These two complementary notes use our global econometric model, NiGEM, to illustrate the effects of a vote to leave.Footnote 2 In the short term (Baker et al., in this Review), increased uncertainty leads to a sharp fall in the exchange rate and an increase in risk premia and hence firms’ and households’ borrowing costs, tightening the monetary and financial conditions of the domestic economy. The depreciation of the exchange rate, acting as a stabilisation mechanism, softens the negative economic impact.
To illustrate the long-run effect, Ebell and Warren (in this Review) model the impact of an exit from the EU through the reductions in goods and services trade, increased tariff barriers, reduction in foreign direct investment and a reduction in the UK's net fiscal contribution to the EU. The three sets of economic model considered are: a ‘Norway’ model where membership of the EEA is taken and free trade in goods and services with the EU is maintained, including access to EEA financial services markets via passporting;Footnote 3 a ‘Switzerland’ model where bilateral agreements with the EU on free trade in goods occur, but there is no free trade in services and no access to EEA financial services markets via passporting; and a World Trade Organisation model where there is no free trade in goods and services with the EU, and there is no passporting of financial services. In these scenarios, the permanent loss of output ranges from about 1.5 to as high as 3.7 per cent.
Concerns about the state of economic recovery accompany every estimate of a moderation in GDP growth. The preliminary estimate for the first quarter of 2016 is no exception; economic growth is estimated to have moderated to 0.4 per cent, from 0.6 per cent per quarter in the final quarter of 2015. These concerns can often overlook the volatility of the quarterly economic growth process.
However, with the risk of a structural shock to the UK economy on the near-term horizon it is reasonable to ask whether this has contributed to the recent softening in the rate of growth. A composite index of uncertainty based on the first principal component of a broad range of uncertainty and volatility measures does indeed suggest that uncertainty increased noticeably in the first quarter of this year (figure 1). One would expect this to weigh on some business investment decisions. The Monetary Policy Committee's (MPC) minutes from their April meeting point to recent signs of uncertainty weighing on investment decisions. We have assumed that uncertainty caused by the referendum weighs even further on investment decisions in the second quarter of this year, with economic growth slowing a little more to 0.3 per cent per quarter.
Uncertainty measure


Assuming a vote to remain a member of the EU, we expect an up-tick in economic growth in the second half of this year as delayed investment decisions are implemented. The economy is expected to expand by 2 per cent per annum this year, 0.3 percentage point lower than the figure expected just three months ago (figure 2), due to the more pronounced deceleration in GDP growth than previously expected.
GDP growth forecasts

Quarterly rates of growth are expected to remain reasonably robust throughout 2017. Given the weakness of growth in the first half of 2016, growth in 2017 is forecast to reach 2.7 per cent per annum, supported by a positive contribution from net trade. World trade, on a UK export market weighted basis, has gradually accelerated from 1.9 per cent in 2012 to around 4 per cent last year. Continued recovery in the Euro Area is expected to generate an acceleration to 5 per cent in 2016 and 5½ per cent in 2017. Sterling's trade weighted exchange rate is expected to average around 6 per cent below the third quarter of 2015. The pass-through to export prices provides further support to export volume growth over the next few years.
The future is by definition uncertain. We present this through a distribution of possible outcomes around our forecast for the path of the macroeconomy. Figure 3 provides the ‘fan chart’ for our GDP forecast. The probability distribution is derived from stochastic simulations using our global model, NiGEM. We see a 1 in 10 chance that GDP growth will be as low as 1 per cent per annum in 2017. On the other side of the distribution, there is a 10 per cent chance that the economy will expand by 4 per cent or greater. By 2019 there is a 1 in 10 chance of an outright contraction of the UK economy. Were the UK to leave the EU, the expected paths for GDP growth are consistent with the lower half of the distribution in figure 3. However, a vote to leave would migrate the UK economy onto an entirely different path from the one presented here, together with an entirely new probability distribution of potential outcomes.
GDP growth fan chart (per cent per annum)

The poor productivity performance of the UK economy continues. Output per hour worked declined by 1.1 per cent in the final quarter of last year, reversing many of the productivity gains during the year. We continue to assume that this drop is simply a ‘blip’. Productivity growth is expected to gradually accelerate over the course of our forecast horizon, averaging around 1½ per cent per annum. The poor productivity performance since the end of the Great Recession remains a puzzle. Not understanding the reasons behind the poor performance raises a significant risk to the future path of the economy.
This poor productivity performance is the corollary of a remarkably robust development in the labour market and relatively subdued demand. Since the start of 2010, 2.4 million net jobs have been created. Over the same time period, the unemployment rate dropped from 8 per cent to 5.1 per cent of the labour force. Job creation is expected broadly to match the expansion of the labour force over the forecast period, generating an additional net 1.2 million jobs. This keeps unemployment close to its equilibrium rate of 5–5½ per cent (figure 4). However, consistent with the UK's poor productivity performance has been the adjustment of real producer and consumer wages. Employees’ real consumer wages at the end of 2015 were only at the level they were in the second half of 2003. With a sustained period of growth and acceleration in productivity growth, as we assume in this forecast, it will still take approximately seven years for real consumer wages to return to the recent peak level of 2007.
Unemployment rate fan chart (per cent of labour force)

At the core of the government's fiscal framework is a target for an absolute surplus in 2019–20. In our February Review, we did not expect this target to be hit. Subsequently, the Office for Budget Responsibility's (OBR) latest Economic and Fiscal Outlook (EFO) revised their view in line with ours. Between the November 2015 and March 2016 forecasts, the OBR have revised up the magnitude of borrowing in their forecast for 2019–20 by £13 billion (the OBR's pre-Budget measures forecast presented in their March 2016 EFO). This forecasting change by the OBR stemmed from a lowering of the future path for productivity. The unsurprising response from the government was to announce further discretionary policy changes in Budget 2016 to ensure the OBR's forecast was for a surplus of around £10 billion.
Such fiscal interventions are a consequence of an inflexible fiscal rule, rather than policy decisions that are required to ensure the sustainability of the public finances. Indeed, even in the absence of the announced policy changes in Budget 2016, both our forecast and that of the OBR show the public sector becoming a net lender to the rest of the economy a year later. A welcome change at a future fiscal event will be the announcement of a flexible target, rather than the announcement of yet more discretionary policy changes designed to mitigate the loss of political capital from missing an inflexible target.
The current fiscal framework was passed into law last year. It contains two additional targets: one that public sector net debt, as a per cent of GDP, should be falling in each and every year from 2015–16. The other is a limit on the welfare budget. Both additional targets have already been missed.
Monetary conditions
The impending EU referendum has led us to push back the point at which we expect the tightening phase of the monetary cycle to begin by one quarter, to November of this year. The MPC has communicated that it will view economic data with particular caution given the heightened uncertainty associated with the referendum, and Governor Carney has explicitly mentioned it as a cause of the relatively lacklustre performance of the UK economy so far this year (MPC, 2016). However, the path implied by market measures of expectations still seems implausibly accommodative. If the OIS forward curve is to be believed then the first rate hike is now not priced in until the first quarter of 2020, around three years later than 3 months ago, and there is increasing probability being placed on a near-term cut in Bank Rate, figure 5.
Interest rate expectations

It is likely that the softening of market expectations is heavily influenced by concerns over the potential negative effects of the UK voting to leave the European Union. However, absenting this and other temporary factors such as exchange rate movements and commodities, it seems that underlying price pressures continue to build. Conditioned on our view that the UK votes to remain in the EU, we expect the narrative in the second half of the year to return to one of gradually increasing price pressures as spare capacity is absorbed and the labour market tightens further. By the time of the November Inflation Report the MPC will have seen the Preliminary Estimate of GDP for the third quarter of this year, which we expect will be relatively robust, especially given the likely catch-up effects as delayed spending and investment plans are implemented.
Consumer price inflation is forecast to be below target in the second half of this year and throughout 2017. However, looking two years ahead from the final quarter of 2016, price pressures should be sufficient to have raised inflation substantially. Given the lags in policy transmission, we expect the MPC to move to raise rates by the end of this year and then follow a policy of gradually tightening to 1.5 per cent by the end of 2017. There exists a significant possibility that caution will stay the hand of the MPC until February of 2017, by which point they will have had a larger base of post-referendum data outturns to assure them that this trajectory of prices is established. Assuming that the subsequent path of policy tightening would be carried out at the same pace, such a call would make little material difference to the forecast presented here.
The exchange rate
In early April, the sterling effective exchange rate had depreciated by around 8 per cent since the start of the year. This has somewhat reversed in recent weeks, but sterling still sits 4½ per cent lower than it did at the beginning of January. Understanding the cause of this depreciation is fundamental to our forecast of how the real economy evolves (Reference Kirby and MeaningKirby and Meaning, 2014). The uncovered interest rate parity condition in our underlying model dictates that this can be caused either by a shift in the interest rate differentials between the UK and her trading partners, or by a widening of the premia associated with sterling. Historically these premia have been dominated by changes in risk, though more recently they have also captured non-interest rate monetary interventions, such as quantitative easing.
The stance of monetary policy has relaxed in the UK since February 2016, for a given equilibrium interest rate, as expectations of Bank Rate have fallen back relatively sharply. All else equal this could be expected to lead to depreciation through a worsening interest rate differential. However, it is important to remember that a differential can be affected from both sides. Interest rate expectations in many of the UK's trading partners have also softened over this period, and it is the relative movement of rates that matters. In the Euro Area, for instance, this reduction in expectations is quantitatively similar to that observed in the UK. In the US the reduction is slightly smaller, meaning that monetary conditions in the UK have loosened relative to the US.
To assess the impact of these shifts we have performed a simulation exercise using the National Institute's Global Econometric Model, NiGEM. We impose the change in monetary policy expectations as an exogenous shock to the future path of policy rates and allow the structure and dynamics of the model to determine the path for exchange rates and the rest of the economy.
Recent interest rate movements can be expected to lead to a marginal depreciation of the sterling effective exchange rate, roughly ¼ of 1 per cent. This is driven by the depreciation against the US dollar, as the sterling/euro exchange rate actually appreciates slightly. With the additional unconventional monetary stimulus announced by the ECB in this period, which is not fully captured by our interest rate shocks, we would expect this appreciation against the euro to be even stronger. These results imply that little of the recent depreciation of sterling has been driven by changes in the fundamental expectation of interest rates, leaving most, if not all to be a result of increased risk or uncertainty around the holding of sterling.
A second way of analysing the recent depreciation is to calibrate directly a shock to the risk premium associated with sterling. This can be done using a number of metrics, but we look at the 3-month implied volatility, as shown in figure 7. Here we can see a marked increase in expected volatility since the start of the year, with a particular jump on 23 March 2016. This is the point at which the 3-month contracts used to derive these estimates of volatility first encapsulated the date of the EU referendum. The series implies markets are pricing in a period of significantly elevated volatility, and therefore risk, in sterling around the referendum.
CPI inflation rate fan chart (per cent per annum)

Implied 3-month sterling volatility

A longer time series shows that at present this expected risk is about two-thirds of the level observed in the financial crisis of 2008—9. We therefore calibrate the size of our shock by scaling the widening of the risk premium implied by our model in the last financial crisis by two-thirds. Consistent with the data in figure 7 we introduce the shock over two quarters, from the beginning of 2016. To ensure we isolate the risk premium impact on the exchange rate, we hold short-term interest rates constant, implying that monetary policy does not act to offset the impact of the currency movement on domestic prices.
The shock leads to a depreciation of around 11½ per cent of the sterling effective exchange rate. This is not quantitatively too dissimilar to the 8 per cent we observed in the actual movements in the effective exchange rate between the start of the year and mid-April. It suggests that markets have already built much of the expected volatility into currency prices. It also echoes the result found by our initial approach, that risk has been the predominant driver of the recent depreciation of sterling.
Given this, and our assumption that the EU referendum will result in a vote to remain in the European Union, the risk and uncertainty associated with the vote itself should dissipate relatively rapidly after 23 June, causing the exchange rate to appreciate sharply in the third quarter. We therefore forecast the sterling effective exchange rate to end this year broadly in line with where it started in 2015.
Should the referendum result not prove decisive, even if on balance the UK ultimately decides to remain in the EU, then uncertainty around sterling may prove more persistent than in our central forecast. Were this to be the case then the bounce back in sterling in the third quarter would be more muted, though it is unlikely to be a permanent shock and in all probability would make the difference up within a short number of quarters.
Similarly, as the referendum itself approaches, there is the possibility that the risk associated with sterling increases, either because markets attach a higher probability to the chance of a vote to leave, or because they downgrade their view of the world in the case of such a vote. Such a pattern would be consistent with what was observed around the time of the Scottish independence referendum where markets re-evaluated the weight they put on a independence outcome in the final fortnight before the vote, leading to sharp movements in financial markets. Such a move this time would lead sterling to depreciate further between now and 23 June.
Prices and earnings
12-month consumer price inflation rose in March for the fifth consecutive month, reaching ½ per cent compared to 0.3 per cent in February and a 0.1 per cent contraction in October 2015. The increase between February and March was driven in part by the earlier timing of Easter, which acted to push up air fares significantly, but which should be reversed by a similar offset in April.
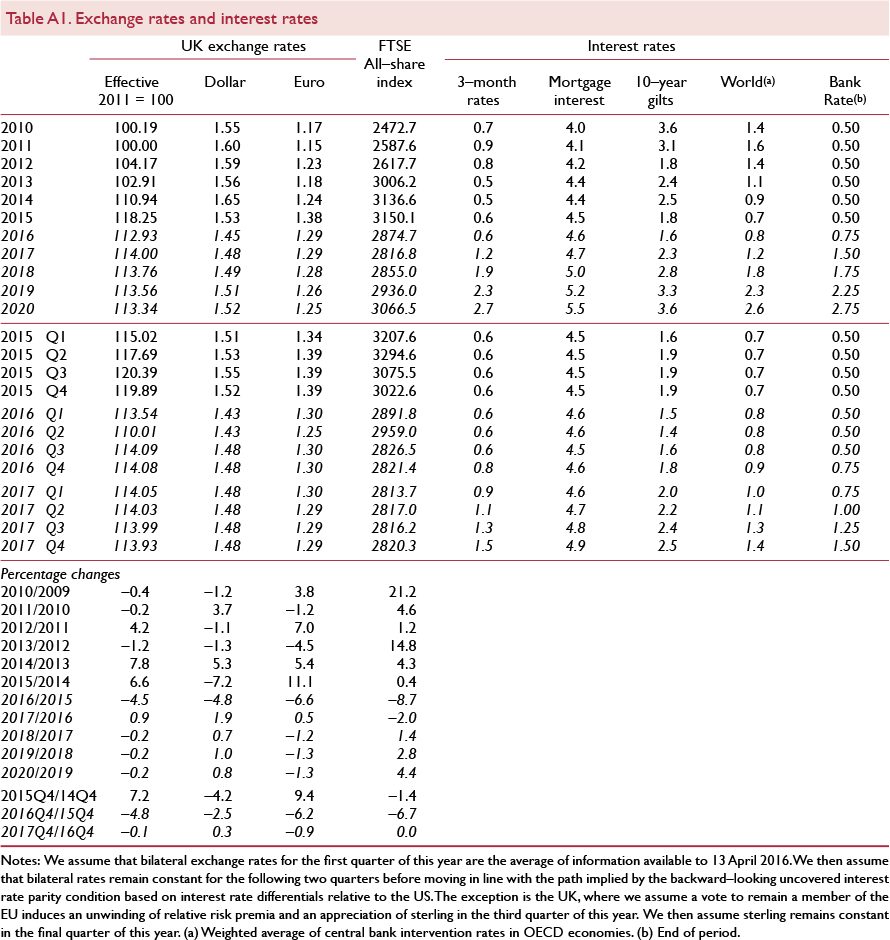
Recent developments in exchange rates, oil prices and monetary policy expectations
by Simon Kirby and Jack Meaning
As forecasters we aim to minimise our forecast errors. Outturns for economic phenomena will undoubtedly differ from what we had expected; the future, after all, is uncertain.Footnote 1 The aim of this box is to illustrate the implications for our current forecast from movements over the past three months in three conditioning assumptions which are published at daily frequency: exchange rates, oil prices; and monetary policy expectations. This exercise is undertaken through a set of simulations using our global econometric model, NiGEM.
The underlying oil price path, based on projections by the Energy Information Administration of the US Department for Energy, is significantly weaker this year than we had previously assumed. From 2018 global oil prices are assumed to grow at broadly similar rates, consequently leading to a permanently lower path for oil prices over the long run.
Expectations of monetary policy have softened since our last forecast, both at home and abroad. According to market indicators the Bank of England is not now expected to begin the tightening phase of the monetary cycle until the first quarter of 2020 and Bank Rate is expected to be 0.94 per cent by the end of that year, 72 basis points lower than the expectation three months ago.Footnote 2 The United States and Euro Area have both experienced a similar fall back in expectations around their future paths for policy rates, although in the US case these have been quantitatively smaller.
Sterling has depreciated against a basket of currencies by more than we foresaw three months ago, due largely to increased uncertainty, which would appear to be related to the upcoming referendum on the UK's continued membership of the European Union. We assume the UK remains a member of the EU. When the referendum is over, a great deal of this uncertainty should dissipate quickly and so the path of the sterling exchange rate in the second half of 2016 is little changed. However, the brief depreciation and subsequent snap-back within 2016 will almost certainly have consequences for inflation.
For the oil price, we begin from our February forecast baseline and impose the updated oil price projection allowing the response of the rest of the economy to be determined endogenously by the model. Likewise in a second simulation we impose the changes in market expectations for Bank Rate, the Fed Funds rate and the ECB's Main Refinancing Operations (MRO) rate as exogenous shocks, and track changes to variables in the rest of the model. For the exchange rate impact, again we begin with the baseline forecast from February and introduce the updated path for the exchange rate.Footnote 3 Lastly, we look to see how all three sets of shocks interact, applying them all simultaneously in a single simulation. The results of all four exercises are presented in table A1.

When combined, the major developments since February have a weakly inflationary pressure this year. However, for 2017, the effect is disinflationary by over a ¼ percentage point. This is predominantly a result of the sharp appreciation in the second half of 2016 as the exchange rate snaps back from the recent depreciation, as uncertainty surrounding the referendum subsides. The past three months has served to add inflationary pressure in the medium term, largely a result of the looser expectations of monetary policy. The outlook for GDP growth is stronger by around a quarter of a percentage point this year, and marginally less in 2017. Recent developments look to add around 30 basis points to the level of GDP by the end of our forecast period.
The impact on the rate of inflation and GDP growth

However, these changes are not the only factors that adjust our forecast. While we have lowered our forecast for the rate of inflation by broadly similar magnitudes to those reported in this box, this year and next, the same cannot be said of the change in GDP growth, especially for this year. As we discuss in the chapter, a marginally weaker outturn to the start of this year and a more subdued near term weigh on the GDP growth forecast for this year.
Notes
1 For many economic statistics so is the past.
2 This is the relative change in market expectations as implied by the Bank of England's forward OIS curve. These do not directly relate to the central paths on our model which are based on the author's judgement for the modal path for Bank Rate.
3 The shock is applied to the bilateral dollar/sterling and euro/sterling exchange rates with the short-term nominal interest rates in the UK, US and Euro Area held fixed. Fixing the interest rates translates the imposed exchange rate movement into a risk premia shock for sterling and the euro against the US dollar and thus can be interpreted as a relative risk premium shock for sterling against both the US dollar and the euro.
Dollar oil prices were lower in the first quarter of 2016 than we had expected in February's Review, but look to have rebounded more strongly in the second quarter. The net effect leaves the level broadly consistent with our forecast from three months ago. The Energy Information Administration projections which underpin our forecast are substantially softer in the second half of this year than those in our previous release, falling to $36 a barrel. This lull is never caught up and so, despite similar growth rates over the medium term, the oil price level has been permanently revised down. It now reaches $47 a barrel in 2017 and just $51 a barrel by the end of our forecast horizon.
Adjusting for the bilateral exchange rate accentuates the disinflationary impact of the revision with sterling oil prices falling by 4 percentage points more than in our February forecast in 2016 and rising by 8 percentage points less in 2017. Should the outlook for the sterling/dollar exchange rate prove softer than our central forecast, for reasons discussed previously, then the changes to our oil price projection would have a muted inflationary consequence.
Stripping out energy and other volatile components of the consumer basket, core inflation rose to 1.5 per cent in the twelve months to March, from 1.2 per cent in February.
Sterling's recent depreciation could be expected to exert additional inflationary pressure over the near term. However, it is our assessment that this depreciation has been driven largely by an increase in uncertainty associated with the impending referendum on EU membership and as such, the exchange rate will snap back in the second half of the year to around the level observed at the end of 2015. This volatile 12-month period for sterling will cause a sequence of shocks to consumer price growth, first inflationary and then disinflationary, which will come to fruition through 2017.
Even with a vote to remain, if the ultimate result of the referendum is in any way indecisive then uncertainty around sterling may prove to be more persistent than in our central case, which would weigh down on the exchange rate and generate more inflationary pressure than is currently projected.
In all, we expect the next 12–18 months to be a volatile period for consumer price inflation, with a number of temporary factors filtering through. The general trend however remains one of building price pressures and a gradual return of inflation to the Bank of England's target (figure 6). This gradual return to target includes a softer near-term profile for inflation rates than were published three months ago (figure 8). But at the two-year policy horizon inflation is expected to be around target.
Inflation forecasts

Average weekly earnings, as measured by regular pay rose at an annual rate of 2.2 per cent in the three months to February 2016. While this is significantly lower than the 4 per cent growth observed in the years prior to 2008, adjusting for inflation it represents relatively robust growth in real earnings. Real earnings growth averaged 2.3 per cent per annum in the same pre-crisis period, and stood at 2 per cent in February of this year. It would seem to indicate that nominal earnings are being held down by low inflation, rather than any particularly large degree of slack in the labour market.
Nominal earnings growth is also disparate between sectors. Public sector earnings growth remains subdued and significantly below the whole economy average. Conversely, the construction sector has experienced earnings growth in excess of 7 per cent per annum, while in the financial and business services sector it has been around 3 per cent. This could indicate tightening becoming more acute in particular industries.
Twelve-month unit labour cost growth, as measured by the ONS, slowed at the end of 2015 to 1.3 per cent in the final quarter, from 1.7 per cent in the third. We expect it to remain subdued throughout 2016 and 2017 as productivity growth offsets increasing wage pressure. By 2018 though, unit labour costs should increase more robustly, adding inflationary pressure to the economy.
Components of demand
Revisions in the March 2016 Quarterly National Accounts release by the ONS lifted output growth for 2015 by 0.1 percentage point to 2.3 per cent, partly related to a marginally stronger outturn for economic growth in the final quarter of the year. In contrast, the ONS's Preliminary Estimate of GDP for the first quarter of this year suggests a 0.2 percentage point moderation from the last quarter of 2015 to a growth rate of 0.4 per cent per quarter (figure 9). This may reflect concerns over the risk of a majority vote to leave the EU in the upcoming referendum. If this is indeed the case, then a further softening in the rate of economic growth could occur in the second quarter of this year as we converge on the referendum date. Indeed, we expect economic growth to slow to 0.3 per cent per quarter in the second quarter of this year. Given our forecast is conditioned on a vote to remain, we expect an acceleration in economic activity in the second half of this year, as delayed investment plans begin to be implemented. Overall we have softened our prediction for output growth in 2016 by 0.3 percentage point to 2 per cent per annum.
Real GDP growth (per cent per quarter)

Domestic demand is expected to contribute 2.5 percentage points to overall GDP growth this year. Although we project a softening in the rate of expansion of consumer spending, as outlined in the Household Sector section of this chapter, it is still forecast to be the main factor behind the expansion of domestic demand, explaining 1.8 out of the 2.5 percentage points that domestic demand contributes to GDP. Private consumption will be sustained by a low rate of consumer price inflation, a consequence of external disinflationary pressures, and positive wealth effects stemming from real house price inflation. Just as in our Review published in February 2016, we expect net trade to be a drag on growth, subtracting 0.7 percentage point from GDP growth this year.
We have incorporated the adjustment to the government revenue and spending plans outlined in Budget 2016. We build in the announced plans for government consumption and investment, assuming they are largely met over the forecast period. Last November's Comprehensive Spending Review set the government departmental spending plans for the period through to the end of fiscal year 2019–20. Even with the re-profiling of government investment plans within this period, there is little impact on the overall contributions to GDP growth.
The net external sector subtracted from GDP growth by an average of ½ percentage point over the period 2012 to 2015. We expect net trade to continue to weigh on growth in the first half of 2016. Growth in export volumes accelerated to 5.1 per cent in 2015, from 1.2 per cent in 2014. This was, nevertheless, far more modest than the acceleration in the rate of growth of import volumes, which increased from 2.4 per cent to 6.3 per cent over the same period. This performance differential has continued into the beginning of this year according to recent ONS trade data. In the three months to February 2016, the volume of goods exports declined by 1.9 per cent, due primarily to a reduction in exports to non-EU export markets.
The weakness in demand from the UK's major export market, the Euro Area, has weighed on UK exports since the end of the Great Recession (figure A3). The forecast improvement in export volumes is dependent on the Euro Area sustaining its own economic recovery. Net trade is expected to add 0.3 and 0.8 percentage point to GDP growth in 2017 and 2018, respectively.
Between 2013 and the end of 2015, the UK's real effective exchange rate has appreciated by almost 15 per cent. During the first quarter of 2016 some of this has been reversed as sterling depreciated by 6 per cent, an effect we think has been induced by the risk of a vote to leave the EU in the upcoming referendum. We expect this pattern to continue over the second quarter of 2016 with a further depreciation of 4 per cent. Fundamental to our forecast is an assumption that sterling will ‘snap back’ following a vote to remain and the real effective exchange rate will recover most, but not all, of the ground lost since the end of last year, leaving it 5 per cent below the recent peak recorded in 2015, and 12 per cent below the pre-crisis peak.
The appreciation in the UK's real effective exchange rate, from the middle of 2013, was accompanied by a decrease in export price competitiveness. The magnitude of the loss in competitiveness was smaller in relative terms than the appreciation of the real effective exchange rate; a pass-through of less than 50 per cent, slightly less than suggested by benchmark estimates from the IMF (2015) who find that around 60 per cent of real effective exchange rate movements are passed through to export prices in the first year, falling to around half in the long run. We observe the same phenomenon when we compare the magnitude of the depreciation of the real effective exchange rate and the increase in export price competitiveness during the period between 2007 and 2009. One reason for this result could be that exporters took advantage of the depreciation to build up their margins after the onset of the Great Recession, especially given the large amount of uncertainty that surrounded that period and that, when sterling recovered part of the ground lost, they buffered against the potential losses in competitiveness by narrowing their margins.
In our forecast, we assume that price competitiveness moves broadly in line with developments in the real effective exchange rate (figure 10), however this may not necessarily be the case if exporters decide to absorb part of the depreciation into wider profit margins just as they did during the 2007–9 period. This poses a downside risk to our forecast for UK export volume growth over the next few years.
Real effective exchange rate and competitiveness

Household sector
Real personal disposable income (disposable income henceforth) grew by 3.3 per cent in 2015, fuelled by a low rate of consumer price inflation derived from the fall in energy prices, the lagged effect from an appreciation in sterling, and a rise in income due to strong employment growth. We expect real disposable income growth to ease to 2.2 per cent per annum in 2016. The long-term evolution of disposable income depends crucially on the return of meaningful productivity growth which has failed to materialise so far and which we expect to return in 2017. Our forecast is that disposable income growth will trough in 2017 as consumer price inflation returns gradually to the Bank's target of 2 per cent and recover from then onwards as real wages pick up following the path of productivity. Together with population projections, our forecast implies an average real per capita income growth of close to 2 per cent between 2017 and 2021.
According to our preferred measure of house prices, the seasonally adjusted mix-adjusted house price index published by the ONS, house prices have increased by an annual rate of 7.4 per cent in the three months to February 2016 compared to 6.9 and 5.5 per cent in the three months to November and August 2015. The Halifax and Nationwide index, which act as leading indicators for the ONS measure as they are derived earlier in the house purchase process, portray a very similar picture of accelerating inflation in the near term: house price inflation in the first quarter of 2016 compared to the same quarter one year earlier was 10.1 per cent according to Halifax, compared to 9.7 and 8.7 per cent in the fourth and third quarter of 2015. Nationwide reports an annual rate of growth of 5 per cent in the first quarter of this year compared to 4 and 3.5 per cent in the preceding quarters.
Such acceleration in house price inflation was expected as second-home buyers and those buying to let brought their house purchase plans forward in response to the April 2016 increase in the Stamp Duty tax rate for buy-to-let and second homes property announced in November's 2015 Autumn Statement. The surge in demand has been remarkable as it can be seen in data on the volume of residential property transactions from HMRC: residential property transactions increased from around 110 thousand in January this year, to 117 and 165 thousand in February and March, respectively (figure 11). The March figure is the highest in the data reported, on a consistent basis, by HMRC since 2005. The historical series on property transactions contains only two similar, albeit smaller, spikes: the first one in December 2009 associated with a temporary increase in the lower threshold of the Stamp Duty Land Tax and another peak in March and April 2012 that coincided with the ending of the first time buyer's Stamp Duty tax relief. In both cases, following the policy-induced rise in transactions, a period of depressed activity followed. We do not expect the effect of this policy change to be any different: Royal Institute of Chartered Surveyors’ (RICS) data on buyers’ enquiries have already displayed a steep decline in March 2016 compared to the previous month (figure 12). Given the lag in the process of purchasing a house, a drop off in buyer enquiries would be expected prior to the tax change coming into effect. Data on mortgage approvals for house purchasing from the March 2016 Bank of England Money and Credit report display only a gradual increase of approvals since November 2015, a piece of data that seems at odds with the data from HMRC on property transactions. However, both pieces of evidence can be reconciled by looking at the value of loans secured on property which have increased by £4 billion in just one single month to March 2016 (figure 13).
Mortgage approvals for house purchases and residential property transactions (thousands)

Buyer enquiries (net balance)

Monthly mortgage loans and capital repayments (£billion)

We expect the rate of house price inflation to peak in 2016. While income growth should provide a support to house price inflation, affordability remains an acute constraint on the inflow of first-time buyers. The recent tightening of lending standards by the Financial Policy Committee (Bank of England, 2016), together with the start of gradual increases in Bank Rate and the pass-through to mortgage rates, should weigh on future demand for housing. Overall, we expect house price inflation to moderate over the forecast horizon.
Household consumption was the main driver of economic growth in 2015, contributing 1.8 out of 2.3 percentage points to output growth. Expenditure has been sustained on the back of strong income growth, wealth effects of house price inflationFootnote 4 and the appreciation of sterling and falling energy prices which increased the purchasing power of households.
We estimate that robust consumer spending growth continued into the first quarter of this year. Data on retail sales until March 2016, which constitute a timely indicator of consumer spending and represent around a third of the total, increased by 0.8 per cent during the first quarter of this year, a slight decline compared to an average rate of growth of 1.1 per cent in 2015. We have revised our projection of consumer spending growth for this year to 2.8 per cent, down from 3.6 per cent in our previous Review. This revision incorporates the effects driven by heightened uncertainty of the referendum. We expect further moderations in the growth rate of private expenditure between 2017 and 2021 as house price inflation moderates, consumer price inflation returns to the 2 per cent target of the Bank of England and income gearing – the share of income devoted to interest rate payments – increases following the likely increase in Bank Rate.
Following a period of deleveraging from a peak of almost 170 per cent, the household debt-to-income ratio has remained stable at around 141 per cent since 2013. We expect the ratio to increase by 2 percentage points by 2017, driven by a strong expansion of consumer credit that feeds the strong performance of private consumption together with the recent pick-up in the value of loans secured on property, and to decrease from then onwards as nominal income growth picks up.
The saving ratio, which includes the adjustment for changes in net equity of households in pension funds, has reached a new historical low of 3.8 per cent in the fourth quarter of 2015. The dip has been almost entirely driven by an increase in consumption expenditure which has made a dent in the overall savings of households. The favourable dynamics of employment growth and the gains in purchasing power from external developments have spurred consumption plans of consumers that might otherwise have been delayed. This raises the question of whether consumers have based these decisions on real interest rates remaining low for an extended period of time. A sharper rise in the real rate of interest may lead to a re-evaluation of expectations by consumers, and poses a downside risk to our growth forecast. Looking ahead we expect the saving ratio to trough in 2016 and to recover from 2017 onwards as the average propensity to consume moderates as households use more of the future gains in real consumer wages to improve their balance sheets. The degree of trade-off between current and future consumption will crucially depend on the outlook for the real rate of interest and productivity performance of the economy.
Supply conditions
The 2016 Budget included a further cut in the main rate of corporation tax to 17 per cent to come into effect in 2020. This follows a cut from 28 per cent to 20 per cent in 2010 and is intended to support business investment in the UK. Although business investment as a share of GDP has been following an upward trend since the middle of 2010, it remains low relative to other developed economies and is below the level in all the G7 economies apart from Canada (figure 14). The Bank of England's Credit Conditions Survey for the first quarter of 2016 reports that the supply of credit to businesses of all sizes has remained unchanged for the second quarter in a row. Demand for credit from small and medium businesses is reported to have fallen, while demand from large businesses was unchanged but is expected to increase in the second quarter of this year. Spreads on lending to large companies have been narrowing since the end of 2012 but were unchanged in the first quarter of this year and are expected to remain so in the second quarter. Spreads remained broadly unchanged for small and medium sized businesses but associated fees and commissions fell.
Business investment

As noted above, uncertainty is likely to weigh heavily on investment between now and the June referendum, and for the following two years or so of the negotiation period in the event of a vote for leaving the EU. Our central forecast assumes the UK remains a member of the EU, but uncertainty surrounding the referendum still features. We have constructed an uncertainty index based on various measures of uncertainty and volatility (see Baker et al. in this Review). This index shows a sharp increase in uncertainty, of 0.65 standard deviations, in the first quarter of 2016. Uncertainty as measured by this index was about half the magnitude of the peak associated with the sovereign debt crisis and a sixth the 2008 peak during the global financial crisis. Our forecast for business investment has been revised downwards to account for an increasingly uncertain economic environment. We now expect business investment to grow by 3.2 per cent this year and 5.9 per cent next year before starting to slow, down from our previous forecast of 6.1 and 5.5 per cent for this year and next respectively.
The National Living Wage (NLW) came into force in April this year. It applies to workers aged 25 and over and is currently 24 per cent above the National Minimum Wage (average of London and rest of UK). The CPID and Resolution Foundation (2016) conducted a representative survey of 1,037 employers to gauge likely responses to the policy change. Their findings suggest that a significant share of firms will be unaffected or will face only a small increase in their wage bill and that job losses are unlikely, at least in the short term. Hospitality, retail and other low-paid sectors will be disproportionately affected. Of the employers surveyed, 54 per cent expected to be affected by the NLW, but only 18 per cent to ‘a large extent’. Those that expected to be affected were asked to identify up to three responses from a list that they were most likely to implement. The most popular responses were ‘improve efficiency/raise productivity’ and ‘take lower profits/absorb costs’ which were identified by 30 and 22 per cent of employers respectively. Reducing the number of employees and reducing hours worked by staff were identified by 15 and 9 per cent of employers respectively.
Productivity growth, in terms of output per hour worked, gained momentum throughout most of 2015 before being almost entirely reversed in the final quarter (figure 15), falling by 1.2 per cent compared to the third quarter. Even in the service sector, which has seen the most robust recovery in productivity since the crisis, output per hour fell by 0.7 per cent. Conversely, output per worker and output per job have stayed approximately constant in the fourth quarter, following three quarters of growth. This seems to be driven, at least in part, by a sudden increase in average hours worked of just over 1 per cent in the three months to December 2015 (figure 16). Data from the three months to February show that average weekly hours and total hours worked have both declined. Weekly hours worked per employee were on a downward trend for most of 2015 and we expect this trend to persist.
Whole economy productivity

Average weekly hours worked

Following the drop in hourly productivity, we have revised down our hourly productivity growth forecast for 2016 from 1.2 to 0.7 per cent, and slightly reduced our forecast over the following four years. The rate of transition from unemployment to employment reached its highest level since 2007 at 29.8 per cent in the three months to December 2015. Worryingly, the rate of transition from unemployment to inactivity has also been increasing, reaching 19.2 per cent in the same period, compared to an average of 17.7 per cent since 1997. The ratio of vacancies to unemployment has been increasing rapidly since the start of 2014, but the rate of increase slowed towards the end of 2015 and the number of vacancies per unemployed person fell in the three months to February 2016. We expect the unemployment rate to fall to 5.2 per cent this year and next before starting to decline.
Self-employment as a proportion of total employment, which tends to move counter cyclically, has been fairly constant over the past two years but increased slightly in the three months to February to 14.8 per cent, compared to an average of 13.7 per cent over the past ten years. Temporary employment as a proportion of total employment has been on a downward trend throughout 2015, but has increased slightly in recent months. The number of temporary workers who wanted but were unable to find permanent employment has been declining and dropped to 33.0 per cent in the three months to February from 35.2 per cent in the previous three month period. Similarly, part-time employment as a proportion of total employment has stayed at around 26 per cent since 2009, but workers who work part-time because they cannot find full-time employment has been declining since mid-2013. This implies a tightening in the labour market which might not be reflected in unemployment data as underemployment is reduced.
Public finances
The first outturn for fiscal year 2015–16 suggests only a gradual reduction in the magnitude of public sector net borrowing. ONS public finance data, which differs from the national accounts data we publish in table A8, suggest borrowing fell from £91.7 billion (5 per cent of GDP) in 2014–15 to £74 billion (4.1 per cent of GDP) in 2015–16. These figures are broadly in line with what we had expected just three months ago. The government's primary target is for the public sector to become a net lender to the rest of the economy in 2019–20. This leaves less than four fiscal years to lower borrowing by 4 per cent of GDP.
In the absence of any discretionary policy changes, our forecast would suggest public sector net borrowing of around £10 billion (½ per cent of GDP) in 2019–20. The government has used a reprofiling of a corporation tax policy change and capital expenditures over the period 2016–17 to 2019–20 to ensure an absolute surplus is achieved in 2019–20.
The secondary target, the Fiscal Mandate, is for public sector net debt, as a per cent of GDP, to be lower in each and every year from 2015–16. According to current official estimates, this target has been breached, by just 0.2 per cent of GDP. This is due to delays in assets sales, namely the government's holdings of bank equities, because of adverse market conditions.
Debt dynamics dictate that debt, as a share of income, will be on a downward trajectory if borrowing relative to income is smaller than the rate of growth of nominal income. However, in fiscal year 2016–17 we do expect nominal GDP to report a growth figure smaller than borrowing, or more precisely, the public sector's net cash requirement, as a share of GDP. As a consequence, we expect public sector net debt, as a per cent of GDP, to have increased by the end of 2016–17. Further out, continued fiscal consolidation and a rebound in nominal GDP growth are expected to enable public sector net debt, as a per cent of GDP, to fall. As stated, given the additional policy changes announced in Budget 2016 and our outlook for the UK economy, we expect a fiscal surplus to be achieved in 2019–20. Upon reaching this year, we expect public sector net debt, as a per cent of GDP, to fall rather sharply, since running a surplus means a reduction in the nominal amount of debt, not just the relative magnitude of debt; falling to 79.1 per cent of GDP in 2019–20 and 76.6 per cent by 2020–21.
Saving and investment
The balance of payments on the current account is the net position of saving and investment in the economy. Table A9 disaggregates this into the household, corporate and government sectors. For each sector, if investment exceeds saving, then that sector is a net borrower and requires external finance from the rest of the economy. If in aggregate investment is greater than saving, then finance from abroad is needed to fund investment. The current account balance provides information on the immediate funding needs of the economy and does not imply anything about the optimality of levels of saving or investment.
Household saving rose sharply following the onset of the crisis to peak at 8.8 per cent of GDP in the third quarter of 2010. Since then it has declined and in the last quarter of 2015 reached 2.6 per cent of GDP, the lowest level on record.Footnote 5 Real consumer wages fell by 1.8 per cent in the final quarter of 2015 and accordingly we have lowered our expectations for the level of real consumer wages in the near term. This feeds into our forecast for household saving ratio, which we have revised downwards by 0.1 to 0.2 percentage point in each year from 2016 until 2020. Saving, as a share of GDP, is projected to continue to fall further in 2016. We expect this to be the trough for household saving. The desire to improve household balance sheets should result in the saving ratio rising over our forecast period. Investment by households has increased only modestly over the past few years; rising from 4.3 per cent of GDP in 2010 to 5.3 per cent in 2015, below the 6 per cent plus levels seen pre-crisis. Housing investment is expected to outpace GDP growth through to the end of our forecast horizon, resulting in investment figures of around 6 per cent of GDP. However, these figures are in nominal terms and are a reflection of rapid house price increases in recent years rather than a robust increase in the volume of activity in the housing market. With nominal housing investment expected to outstrip saving, households will remain net borrowers from the rest of the economy throughout our forecast period. However, the gap between saving and investment is expected to narrow from 3.6 per cent of GDP in 2016 to under 2 per cent in 2020. Growth in gross disposable incomes of the household sector ensures that this continued borrowing keeps the household debt to income ratio stable over our forecast horizon.
Investment by companies fell markedly at the start of the crisis and has been gradually increasing since late 2009. The corporate sector has been a net lender to the rest of the economy since 2003 but we expect this position to reverse this year and for the external funding required to increase throughout our forecast period as investment increases and savings continue to fall.
The government has been a net borrower since 2002 but the gap between saving and investment increased substantially during the crisis to reach a peak of 9.0 per cent of GDP in 2009. This was due to a large drop in savings during 2008 and 2009 while government investment as a share of GDP rose slightly. The amount of external finance required has been declining as a share of GDP but remains substantial at 3.9 per cent in 2015. Our projections for government consumption and investment are based on the spending plans and policy changes detailed in the 2016 Budget. The government has announced discretionary policy changes that tighten fiscal policy in order to re-establish a surplus by fiscal year 2019–20. However, our forecast for nominal GDP growth has been revised downwards over the period 2016–20. Tax revenues depend on the magnitude and composition of nominal demand within the economy.Footnote 6 With little change to general government consumption plans since the November 2015 Comprehensive Spending Review, the outcome should be to lower the expected path for government saving over our forecast horizon. However, discretionary policy changes mean that government saving is expected to be higher at the end of our forecast horizon.
The current account balance has deteriorated, in an almost consistent fashion since 2011. This deficit reached a record 5.2 per cent of GDP in 2015 as a whole. Unlike previous episodes of high current account deficits, the trade balance has remained relatively stable. The primary factor in the recent deterioration is a drop in net FDI investment income which fell from a surplus of 3.3 per cent of GDP in 2011 to a deficit of 0.2 per cent in 2015. This has been driven in part by exchange rate movements, and also by stronger growth in the UK than in major partner countries, contributing to higher returns on foreign investment in the UK than on UK investments abroad. Weaker commodity prices may also have contributed to reduced income from FDI. Since liabilities are more likely to be held in domestic currency than assets, the recent depreciation of sterling has resulted in an increase in the net asset position at the same time as current balances as a proportion of GDP have fallen. We are forecasting the current account deficit to be 6.5 per cent of GDP in 2016 and 6.6 per cent in 2017 before narrowing over our forecast period. Net assets are expected to be 1.0 per cent of GDP in 2016, falling to −9.4 per cent in 2017 and continuing to fall, averaging −23 per cent of GDP in 2018–20.
The implications of the recent deterioration of the current account depend on how long we expect this phenomenon to last. Reference LaneLane (2015) suggests that this might be a transitory effect as a result of financial engineering, whereby UK firms have been relocating their headquarters abroad, perhaps to take advantage of lower taxes or a looser regulatory environment, while economic activity continues to take place domestically. The view of the IMF (2016) on the other hand, as outlined in their recent Article IV report on the UK, is that while returns on foreign assets are likely to recover, the shift in the net stock of FDI is likely to have been driven by more permanent shifts such as the reduction in UK corporate tax rates, making the UK a more attractive place to invest thus increasing income flows from non-residents’ investment in the UK relative to income flows from UK residents’ investment abroad.
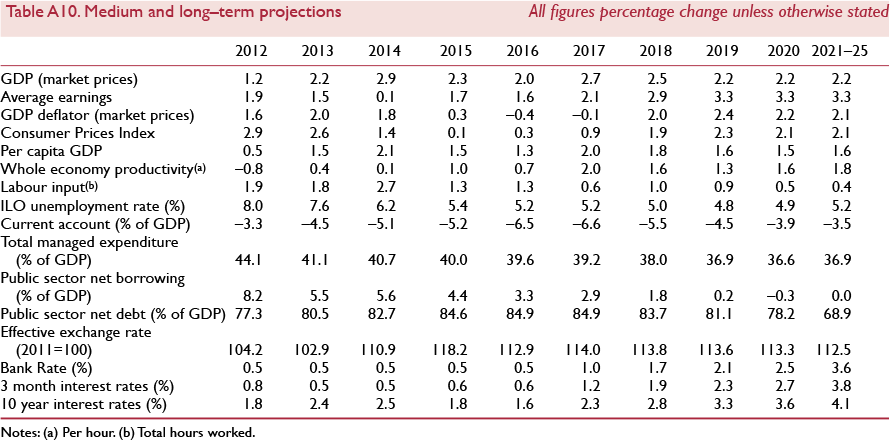
Medium-term projections
Following the Great Recession, the recovery of the UK economy has been protracted, with economic growth below estimates of its potential rate for a number of years. Our projections for the medium term, which are dominated by the gradual process of returning to equilibrium, are presented in table A10. These figures reflect our baseline forecast and we understand that shocks, which are by definition unpredictable, will undoubtedly move the economy away from this path. We represent this uncertainty using fan charts (figures 3, 4 and 6).
One near-term risk with long-run implications that can easily be identified is the event of a vote to leave the EU in the 23 June referendum. What is more uncertain is the magnitude of the impact on the UK, not least because we do not know which of the exit states will be the path the UK economy eventually travels. Ebell and Warren, in this Review, present a range of scenarios to illustrate the medium to long-term economic effects of this shock materialising. The estimated negative impacts on GDP of between 1.5 and 3.7 per cent are somewhat smaller than those of other recent studies that they compare their results to.
Since our February forecast we have changed our expectation of when Bank Rate will first increase from August to November 2016, but also predict a more rapid tightening in rates so that our medium term view remains largely unchanged. We expect interest rates to normalise over the forecast period and to be 3½ per cent in 2021–25.
Critical to our forecast is the assumption of the return of meaningful productivity growth, which is the key driver of long-run growth in real consumer wages and improvements in the economic welfare of the population. Following poor data outturns at the end of 2015, we have revised down our expectation of whole economy per hour productivity from 1.2 to 0.7 per cent in 2016. Our forecast is for productivity growth to regain momentum over the following four years and we expect robust growth of around 1.8 per cent per year in 2021–25.
Labour input has increased rapidly over the past few years due to increases in both employment and hours worked. The rate of increase slowed in 2015 and we expect this slowdown to persist as unemployment nears its long-run level of 5–5½ per cent and the population growth rate declines, in part due to current government policy of targeting a reduction in net immigration. This is likely to be offset somewhat by an increase in the participation rate of those aged 65 and over as the state pension ages for men and women are equalised, but this effect will level off once the process of equalisation has finished in 2021. We expect unemployment to remain at 5.2 per cent in 2016 but to overshoot slightly, dipping below its long-run level as the economy rebounds rapidly, before settling at around 5 per cent.
Recent weakness in commodity prices means that consumer price growth is expected to be subdued, with annual inflation rates of 0.3 and 0.9 per cent in 2016 and 2017 respectively. Our forecast is for inflation to pick up as these effects dissipate, overshooting the Bank of England's 2 per cent target in 2019 before settling at 2.1 per cent on average in 2021–5.
Our projections for monetary policy globally inform our forecast for interest rate differentials which determine exchange rates in our forecast. Following the recent depreciation of sterling, our expectation of the level of the effective exchange rate in 2016 has been lowered by around 3 per cent, compared to our forecast published three months ago. We expect the effective exchange rate to remain broadly flat from 2017 until the end of our forecast period.
Appendix – Forecast details

Inflation expectations have eased marginally in recent quarters

Private and public sector nominal wage growth


Goods exports volumes to the EU remain close to pre-recession levels

Per capita consumer spending is expected to reach its pre–recession peak this year (2007Q4=100)


Household income gearing

We expect households’ propensity to save to rise over the medium term (per cent of gross disposable incomes)


Productivity has returned to pre-recession levels

National saving is not expected to recover pre-crisis levels over our forecast horizon (per cent of GDP)


In 2016Q1 GDP was 7.3 per cent higher than its pre-crisis peak and employment is estimated to be 5.8 per cent higher

The Beveridge curve suggests continued improvement in the labour market matching process