


I. INTRODUCTION
The Powder Diffraction File (PDF) is a database produced and maintained by the International Centre for Diffraction Data (ICDD®), a non-profit scientific organization committed to meeting the needs of the scientific community through the collection, editing, publishing, and distribution of powder X-ray diffraction (PXRD) data for the identification of materials (Fawcett et al., Reference Fawcett, Kabekkodu, Blanton and Blanton2017). The primary purpose of the PDF is to serve as a quality reference tool for the powder diffraction community. This tool provides insight into the structural and crystallographic properties of a material, which allows for phase identification using powder diffraction techniques. The PDF has been the primary qualitative crystalline phase identification reference for powder diffraction data since 1941 (Jenkins et al., Reference Jenkins, Holomany and Wong-Ng1987) and, in recent years, has expanded its coverage to include semi-crystalline and amorphous materials (Gates et al., Reference Gates, Blanton and Fawcett2014).
Databases, like the PDF, that provide structural details, such as lattice parameters, space group, atomic coordinates, and thermal parameters, can be used for a range of tasks, including (but not limited to) structure modeling, phase identification, and quantification [Belsky et al., Reference Belsky, Hellenbrandt, Karen and Luksch2002 (ICSD); Downs and Hall-Wallace, Reference Downs and Hall-Wallace2003 (AMCSD); Gražulis et al., Reference Gražulis, Daškevič, Merkys, Chateigner, Lutterotti, Quirós, Serebryanaya, Moeck, Downs and Le Bail2012 (COD); Groom et al., Reference Groom, Bruno, Lightfoot and Ward2016 (CSD); Villars and Cenzual, Reference Villars and Cenzual2018 (PCD)]. As a result, structural databases are one of the key tools used in the crystallographic community (Kuzel and Danis, Reference Kuzel and Danis2007). Though these databases do tend to have some common applications, they often differ in content, format, and functionality. In PDF-4 products, structure details, when available, are provided on a designated tab of the PDF card, as will be discussed later in the text.
A. Creation of the PDF
In 1941, the American Society for Testing and Materials (ASTM) published the first official set (Set 1) of the PDF; each entry was printed on a 3″ × 5″ paper card [Figure 1(a)]. The Joint Committee on Powder Diffraction Standards (JCPDS) was evolved from ASTM in 1969 and renamed to ICDD in 1978. The inaugural PDF database consisted of 978 cards displaying a collection of d–I data pairs, where the d-spacing (d) was determined from the angle of diffraction, and the relative peak intensity (I) was obtained experimentally under the best possible conditions for a phase pure material. The list of d–I data pairs is often described as the diffraction “fingerprint” of a compound. Each 3″ × 5″ PDF file card was formatted so that the d–I pairs of the three most intense peaks were placed at the top-left edge of the card, which was ideal when using the Hanawalt search method (Hanawalt et al., Reference Hanawalt, Rinn and Frevel1938) for phase identification. The full d–I list and supporting information were presented on the remaining space of each card. In 1967, a computer-based version of the PDF (PDF-1) became available on magnetic tape, with limited data provided for search-match only. However, it was not until 1985 that the first digital version containing all of the data that appeared on a PDF card image was made available in computer-readable format on CD-ROM (PDF-2) (Messick, Reference Messick2011).
(Color online) PDF card image for Ce2(SO4)3 from PDF Set 1 as issued (a) in 1941 and (b) in 2019.
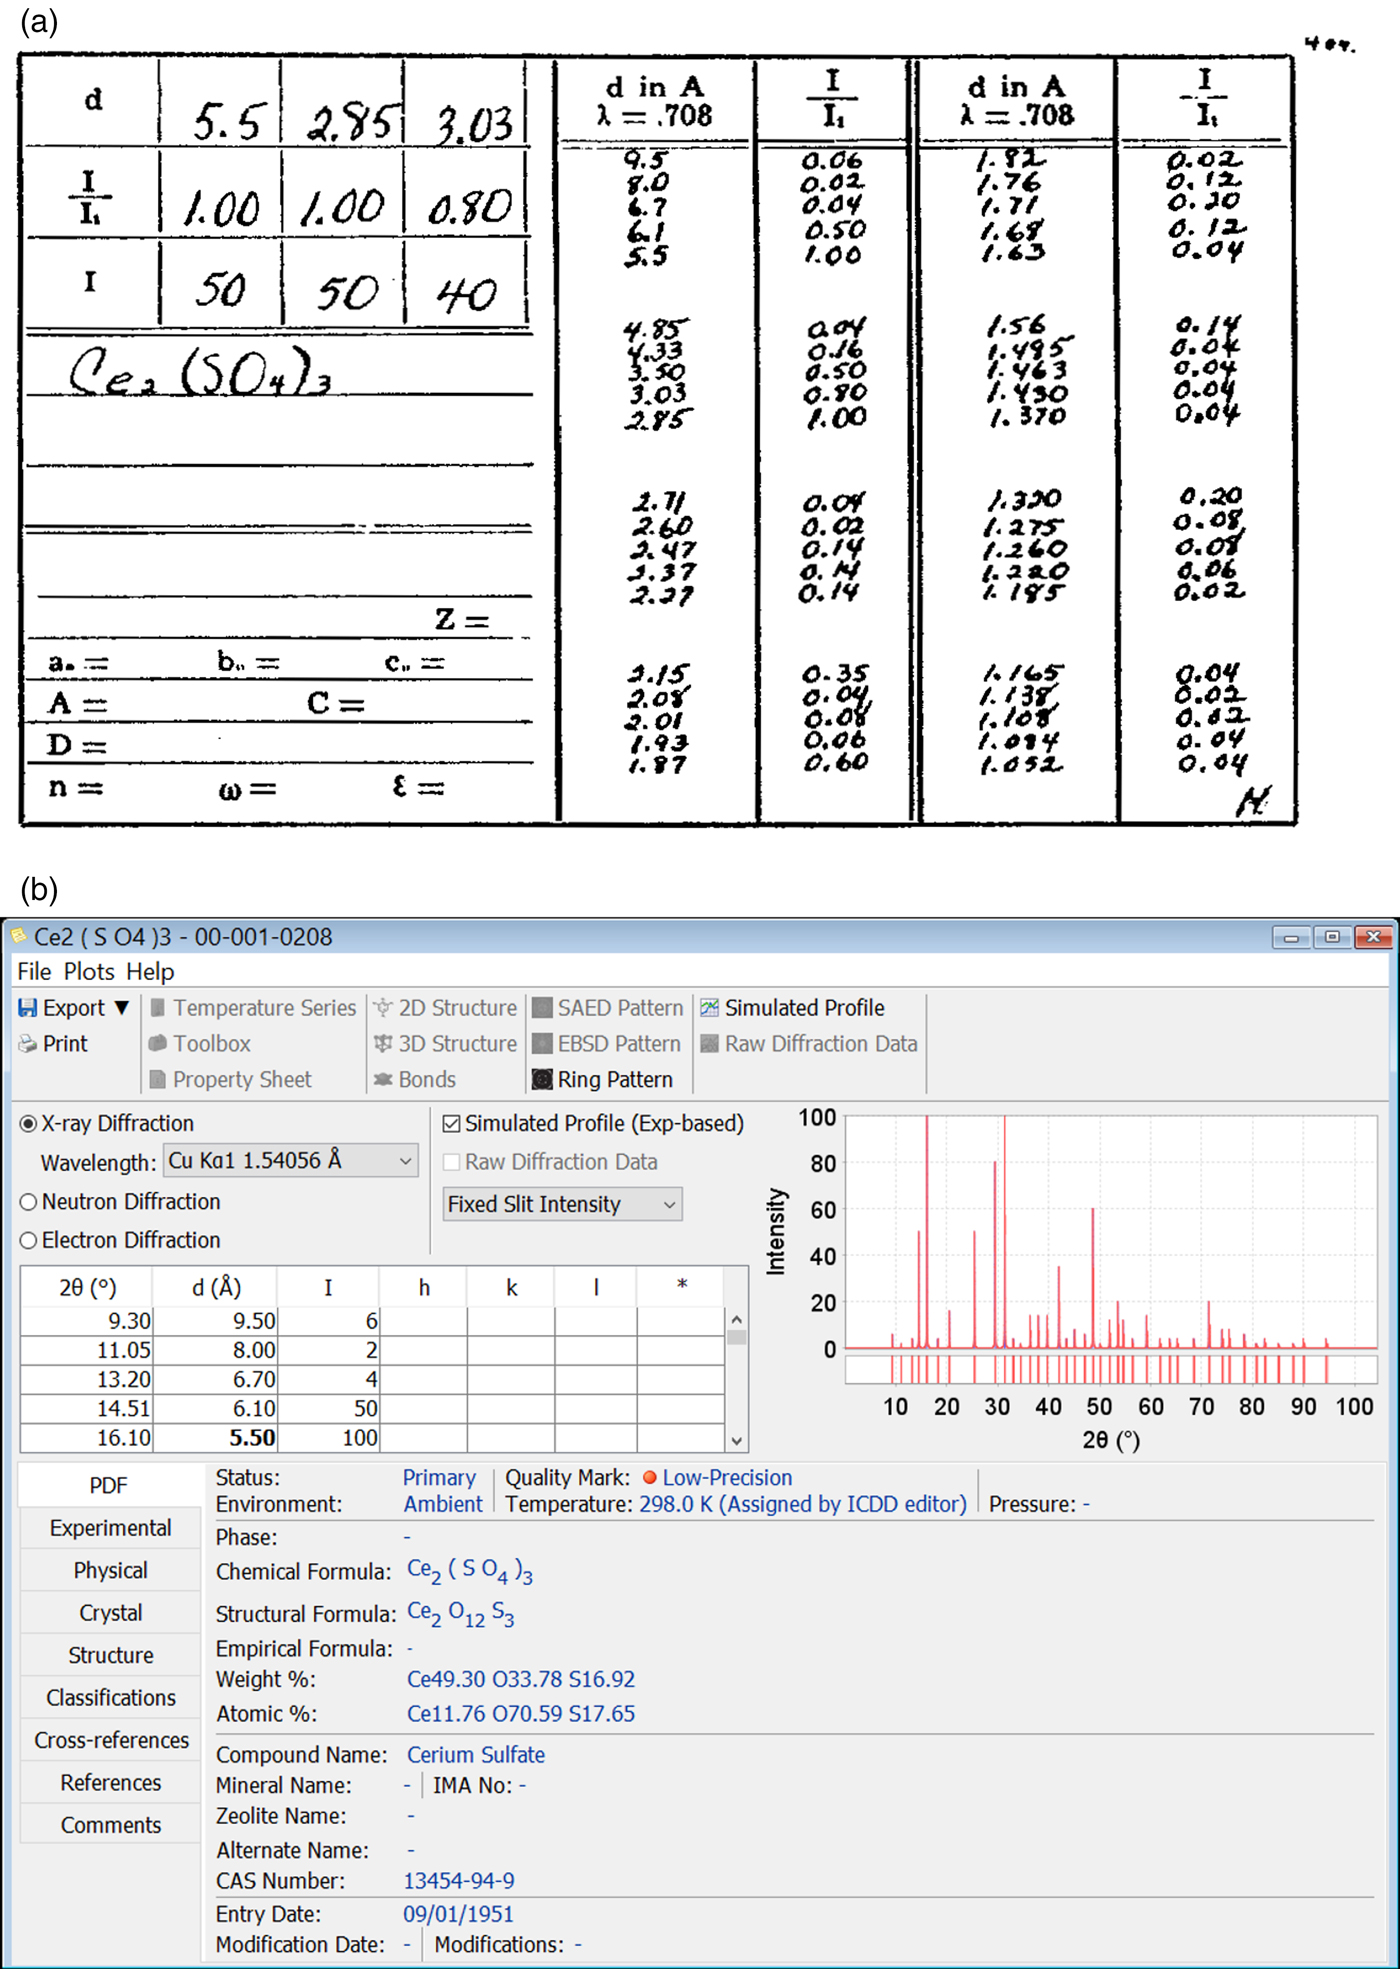
The increased use of the computer-based PDF database, and the problems associated with the storage of the classic cards, prompted the ICDD to discontinue the production of cards in 1987, leaving books as the only hardcopy form published (Smith and Jenkins, Reference Smith and Jenkins1996). Over the years, various seminal events have transformed the original card catalog/index styled database into an electronic resource, having a relational database format (Faber and Fawcett, Reference Faber and Fawcett2002). The initial design of the PDF “card” supported the primary purpose of the database, phase identification by search-match processing. Thus, the core design was retained upon conversion from printed to digital cards and has progressively been enhanced over time [Figure 1(b)]. With reduced limitations on presentation space, pivotal information pertaining to the phase(s) of interest were added to PDF card entries, which greatly enriched the comprehensiveness of the database. By 2015, benefits associated with the computer-based PDF significantly outweighed those of hardcopy versions. Thus, as of 2017, all printed PDF database products were discontinued.
Having a comprehensive database that houses all PDF patterns allows users to carry out single and multi-phase identification. The capacity of the database has evolved over time in order to support innovative analyses methods and instrumentation advances that have been developed in the field of diffraction. Currently, the PDF contains data to support analysis pertaining to X-ray, electron, and neutron diffraction, which may include entries for crystalline, semi-crystalline, amorphous, modulated, disordered clays, and nanomaterials (Bruno et al., Reference Bruno, Gražulis, Helliwell, Kabekkodu, McMahon and Westbrook2017).
II. DATABASE DEVELOPMENT
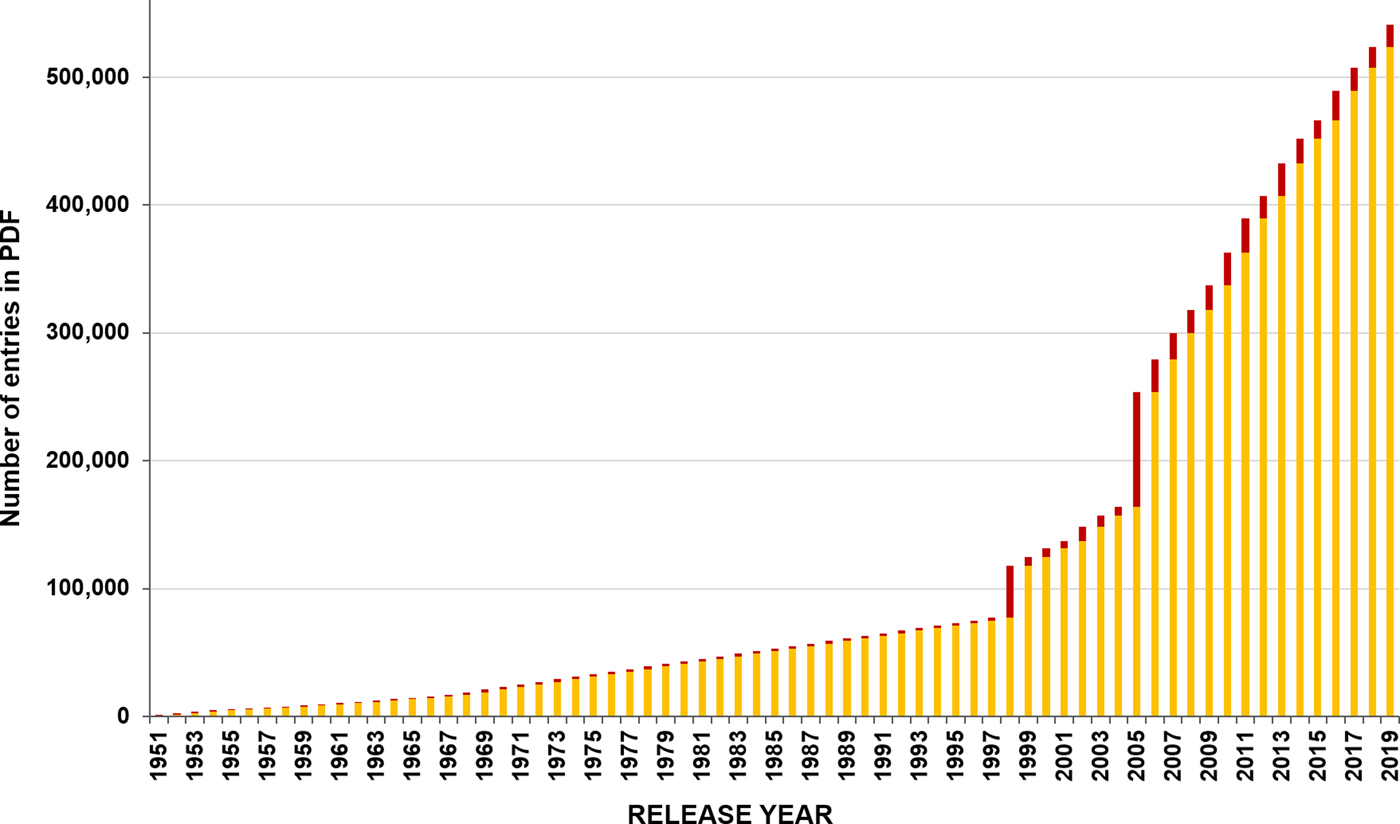
The PDF is continuously enhanced, and maintained, by ICDD staff and members. An updated, revised, and new version of the database is released annually providing users a contemporary reference tool that helps them to obtain “correct” answers – not just “any” answer. Each new PDF release comes with an increased number of entries (Figure 2), as well as enhanced functionality via new software features. In recent years, there have been expectations for reference data to be freely available, but often times this comes at the sacrifice of quality.
(Color online) Graphical representation of the lifetime growth of PDF-4, with the number of new entries for the specified annual release shown on top (red). The spike in newly published entries observed in 1998 and 2005 reflect the onset of collaborations with FIZ (ICSD) and MPDS (LPF), respectively.
The overall quality of the PDF improves progressively as higher quality entries are included in the database. Subsequently, the number of low-quality patterns has decreased by ~10% in the last 15 years. Though some believe that low-quality entries can undesirably influence the overall statistics of the database and they should be removed, these patterns are editorially reviewed and included with significant details. The mindset being, even a partial match of data may be crucial in assisting users in proper phase identification, or even elimination of certain phases/possibilities.
A. Data acquisition (data sources)
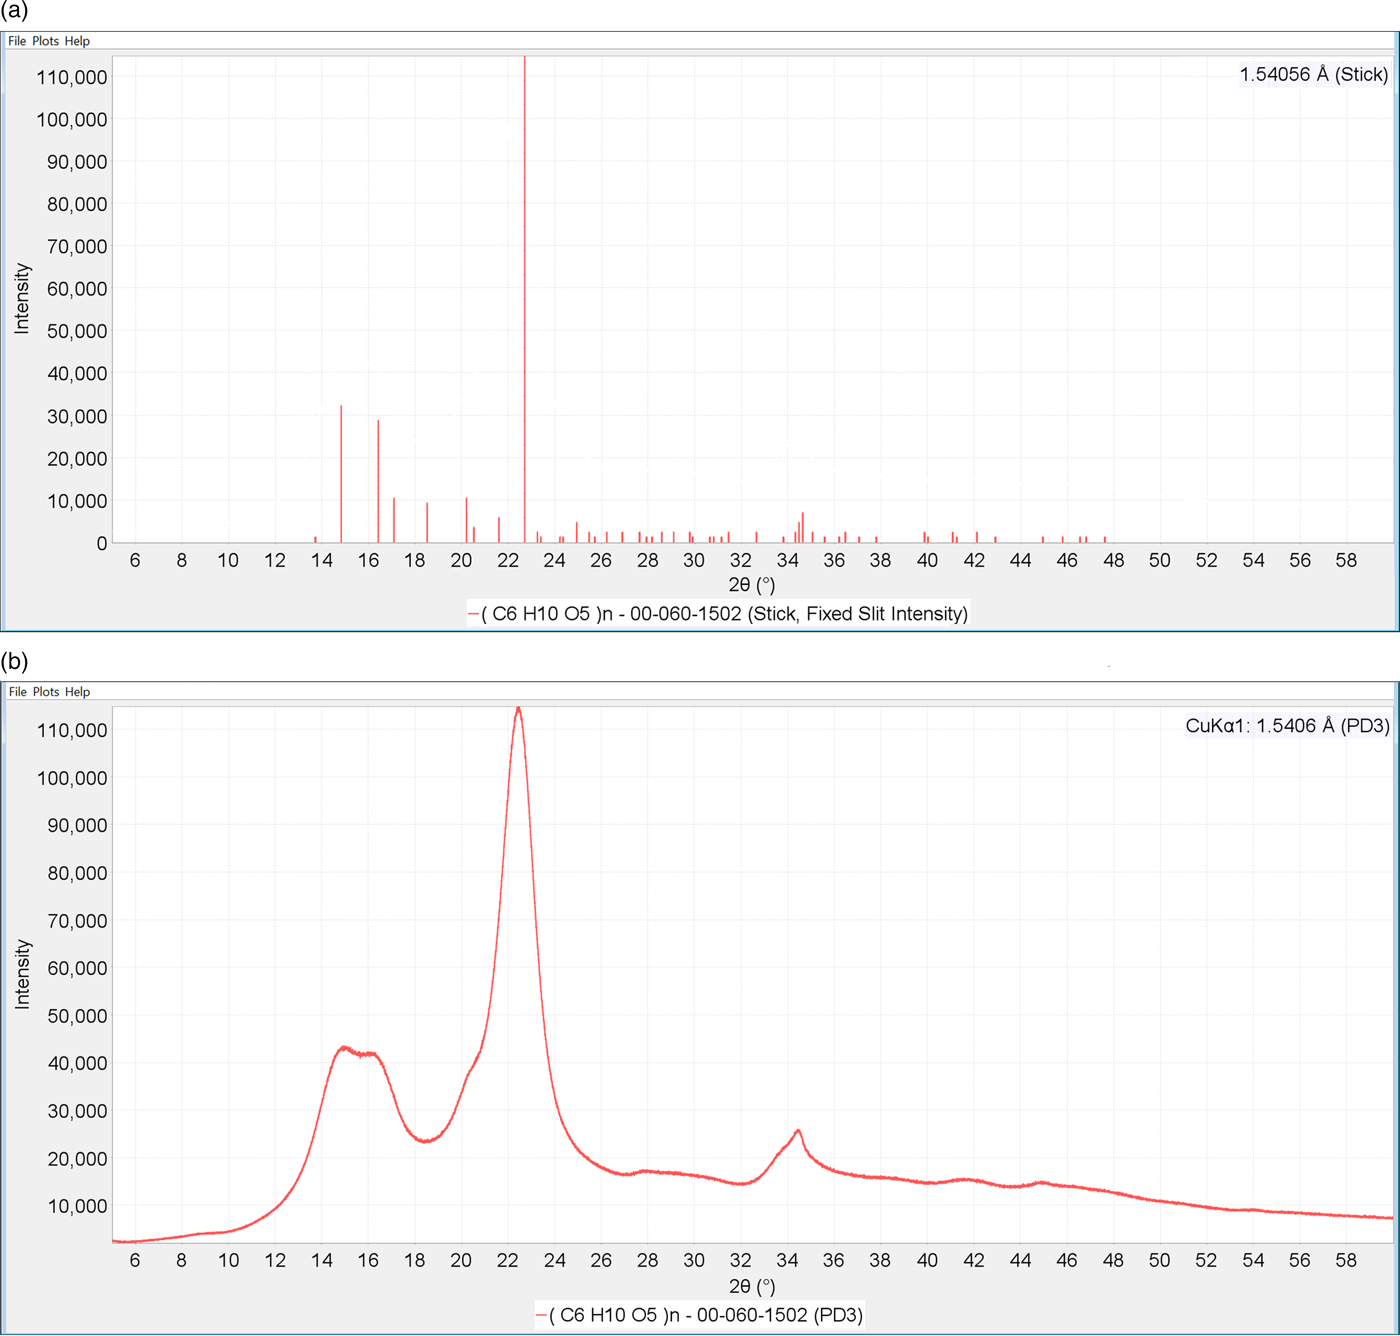
The PDF is a compilation of diffraction data from various sources, including ICDD and contributions from collaborative databases: Inorganic Crystal Structure Database (ICSD), the Linus Pauling File (LPF), the National Institute of Standards & Technology (NIST) Crystal Data, and Cambridge Structural Database (CSD). As a result, much of the diffraction data originates from the literature and originally lacked uniformity. The quality of the data is generally limited by both the diffraction technique used during experimentation and the instrument capabilities at the time of publication. Therefore, when utilizing data from multiple sources, ICDD processes entries in a manner that converts data into a common format and requires every entry to undergo editorial review and be classified based on their level of quality. Various databases offer calculated PXRD data, including the PDF. However, a unique feature of the PDF is the availability of actual experimental raw powder data acquired primarily through ICDD's grant-in-aid program. This type of data is useful during materials’ characterization as the calculated PXRD data may not always clearly explain the observed diffraction pattern and can be significantly different from what is observed during the experiment. Therefore, theoretical, or calculated, patterns may not always properly represent what is truly observed during experimental data collection. Some examples of where this discrepancy is evident are materials of small crystallite size, polymeric materials, and clays. When the phase of interest is amorphous or semi-crystalline, a d–I list and/or atomic coordinates will not adequately define the amorphous profile observed in a diffraction pattern (Figure 3). To allow for improved whole pattern analysis, particularly when amorphous phases are present, the PDF also includes digital raw data patterns, referred to as PDF experimental patterns (PD3s), for amorphous, semi-crystalline, and crystalline phases (Gates et al., Reference Gates, Blanton and Fawcett2014).
(Color online) (a) Stick pattern (d–I list) and (b) raw data (PD3) representation of cellulose Iβ. This example demonstrates how raw data patterns for polymers cannot always be accurately represented from a d–I list alone.
B. Data standardization (quality system)
Another distinct attribute of the PDF is its quality system. Once the data are obtained from a source, prior to inclusion in the PDF, each entry is reviewed for appropriateness and quality. In the past, the evaluation of quality was somewhat subjective until 1965 when the d-values and intensities were first entered into computer-readable files (Smith and Jenkins, Reference Smith and Jenkins1996). This allowed data to be checked based on crystallographic principles in a timely and efficient manner. Over time, important criteria could be added, or removed, based on the knowledge of the crystallographic field and experimental capabilities of the time. As a result, the review process has become more rigorous, with multiple computer algorithms utilized to aid in pattern assessment and quality determination. The benefit being an objective uniformity of quality mark assignments.
ICDD has developed a multi-tiered editorial process that enables the categorization of each entry based on the quality and comprehensiveness of the data. Subsequently, a quality mark (QM) is assigned to each entry to distinguish for PDF users the high-quality (QM = * or G), medium-quality (QM = I, C, P, or M), low-quality (QM = B or O), or hypothetical (QM = H) patterns. The original criteria for quality mark assignment were somewhat broad and designed for single phase crystalline patterns. As the database grew and evolved in both content and format, so did the quality system. The original five quality marks and criteria, shown in Table I (Jenkins and Smith, Reference Jenkins and Smith1987), have expanded in order to reflect processed/refined data patterns, as well amorphous and semi-crystalline materials (Bruno et al., Reference Bruno, Gražulis, Helliwell, Kabekkodu, McMahon and Westbrook2017). The current quality marks and major criteria are shown in Table II, along with a brief description of any commonly associated warnings.
Original major criteria in the assignment of quality marks for PDF entries.
Notes: (1) An “O” indicates: low precision, no cell quoted, poorly chemically characterized, and possible mixture (or a combination of the above). (2) A “Blank” indicates patterns which do not meet the criteria for a “★”, an “I”, or an “O” or patterns for which no cell is known and, therefore, cannot be assessed for consistency and line indexing.
Major criteria for PDF quality mark assignment.
Entries with the prototype (P) and hypothetical (H) quality marks require editorial action and an extensive, proprietary review that is determined on a case-by-case basis.
Another benefit resulting from ongoing editorial review of the PDF is the designation of subfile(s) and subclass(es). The PDF subfiles are generated based on (1) chemical definitions and/or (2) field application (via expert opinion). Subfiles are powerful tools in the database, as they allow users to target their searches in order to save time and reduce the frequency of false matches during the identification process. Some of the editorial improvements, not available in other databases, result from specialized task groups. These expert-lead groups focus on specific classes of materials (i.e. Ceramics, Metals & Alloys, Minerals, Zeolites, etc.) and make detailed recommendations based on the field of study (subfile), for specific PDF entries. These recommendations are then submitted for final review before being incorporated into the database(s). The PDF subfiles are continuously edited, reviewed, and classified by ICDD, and can be used with any software system that recognizes ICDD subfile designations, to improve the efficiency and accuracy of the identification process when using the PDF.
III. THE PDF CARD
Individual entries of the PDF are often referred to as “PDF cards”, which is a term carried over from the original “hardcopy” format of the database. The “cards” are categorically numbered (AA-BBB-XXXX) to indicate the data source (where AA means “00” – ICDD; “01” – ICSD; “02” – CSD; “03” – NIST; “04” – LPF; and “05” – ICDD(crystal data)). Each data source has set numbers, BBB, corresponding to the annual publication, and a pattern number (XXXX). As a result, one can surmise from the PDF card in Figure 4 (00-045-0338) that this entry contains data from an ICDD pattern (data source = 00) that was first included in set 45 (published in 1995) and is pattern number 0338. The PDF entries also contain extensive chemical, physical, bibliographic, and crystallographic data. The red labels in Figure 4 highlight the different components of the PDF card and corresponding details can be found in Tables III and IV.
(Color online) Digital PDF card 00-045-0338: calcium iron phosphate, Ca9Fe(PO4)7 with designators corresponding to descriptions in Tables III and IV.
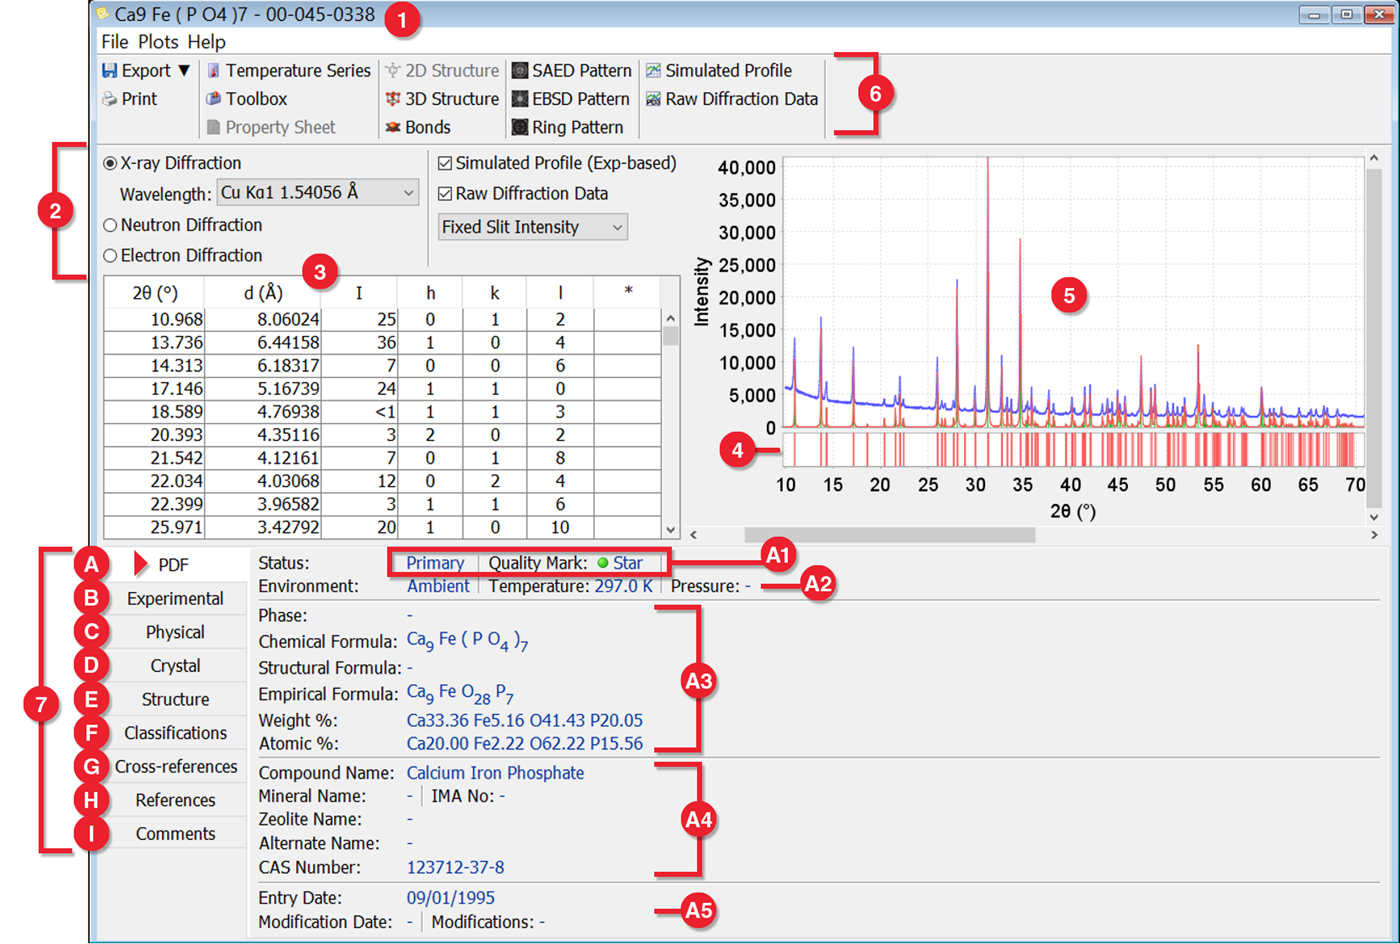
Overview of contents of a PDF entry.

Details for fields on the “PDF” supplemental information tab (Tab A in Figure 4).

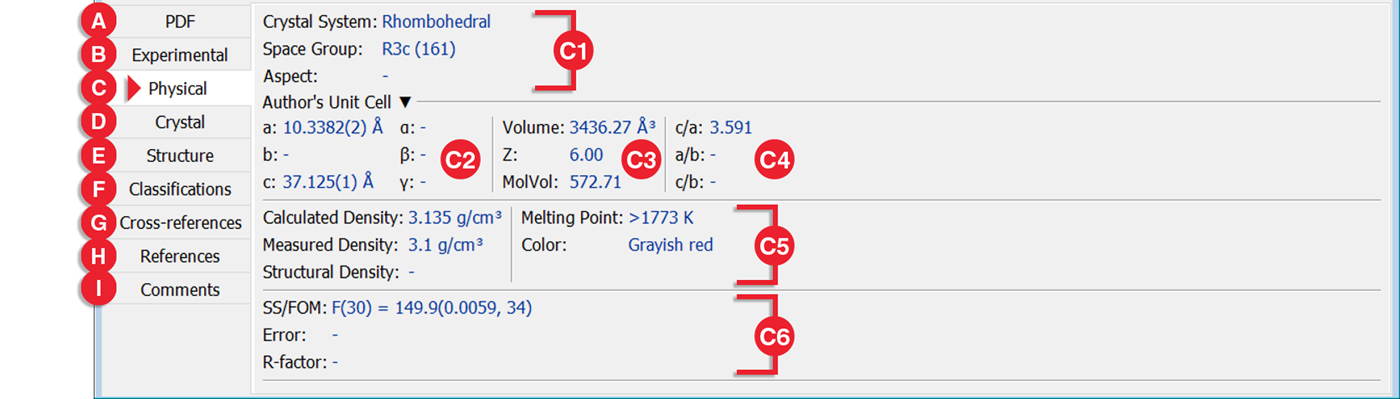
When available, much of the crystallographic data resides on the “Physical” tab of the PDF card (Figure 5). This is where the basic information pertaining to the unit cell can be found (i.e. crystal symmetry, lattice parameters, space group, etc.).
(Color online) “Physical” tab with designators showing where to locate (C1) unit cell settings, (C2) lattice parameters, (C3) unit cell volume, (C4) axial ratio(s), (C5) density values (calculated, measured, and structural), and (C6) data validation values.
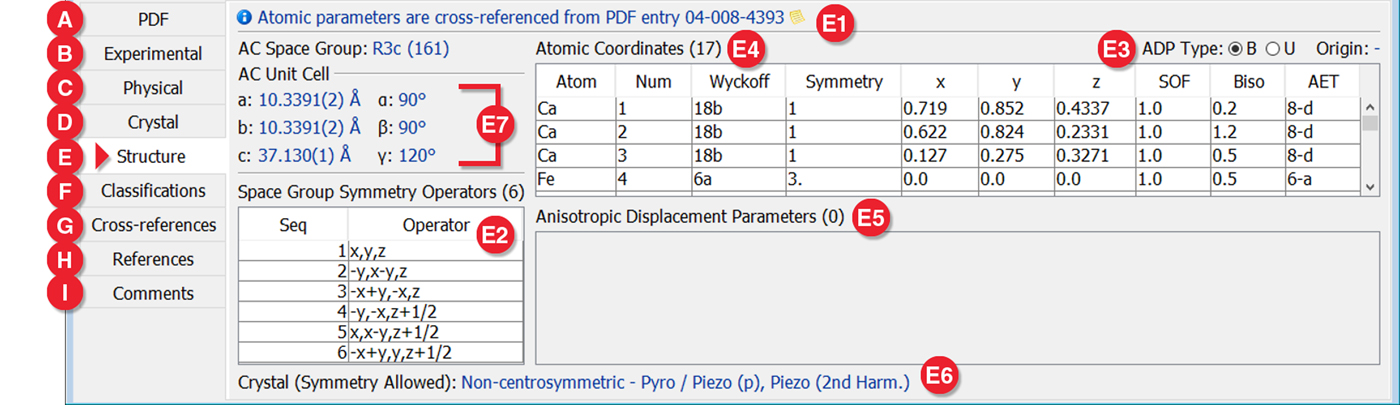
Atomic coordinates are included for a significant number of PDF entries and can be located on the “Structure” tab, shown in Figure 6. The information provided on this tab enables users to perform qualitative and/or semi-quantitative analyses using the PDF-4 products. Additionally, users have the option to export the crystallographic information in several different formats for use in third party pattern fitting software including quantitative analysis techniques.
(Color online) “Structure” tab with designations pertaining to (E1) the original source of the atomic coordinates (if cross-referenced), (E2) symmetry operators, (E3) thermal parameter type, (E4) fractional/atomic coordinates, (E5) anisotropic displacement parameters, (E6) and (E7) unit cell information derived from the single crystal experiment (which can be different from powder unit cell information on the “Physical” tab).
IV. AVAILABILITY
The PDF is available for individual or collaborative use. ICDD provides numerous database products that are specifically designed to meet the needs of those in a variety of areas in the diffraction community, ranging from phase identification (PDF-2) to semi-quantification or full pattern fitting using atomic coordinates (PDF-4). Product summaries, licensing info, and operating specifications for each member of the PDF product line are available on the ICDD website (www.icdd.com).
Currently, ICDD collaborates with licensed software developers, including equipment manufacturers and independent developers, and works diligently to cultivate commercial data analysis programs that work seamlessly with our databases. PDF products include their own front-end software that allows the use of the stored PDF entry data for data mining, compound and structure visualization, and data simulations. Use of the PDF front-end software offers valuable features, and information that may not always be seen through vendor's software. This factor can be of benefit to users looking for additional details or supplemental information pertaining to a material, or group of materials. Also available is ICDD's search indexing programs, SIeve or SIeve+, that are operable through the PDF front-end software. SIeve/SIeve+ is designed to search and identify unknown materials by engaging data mining interfaces, searches, sorting, and then applying various algorithms to optimize the phase identification process.
V. SIGNIFICANCE OF UPDATING PDF (CONCLUSION)
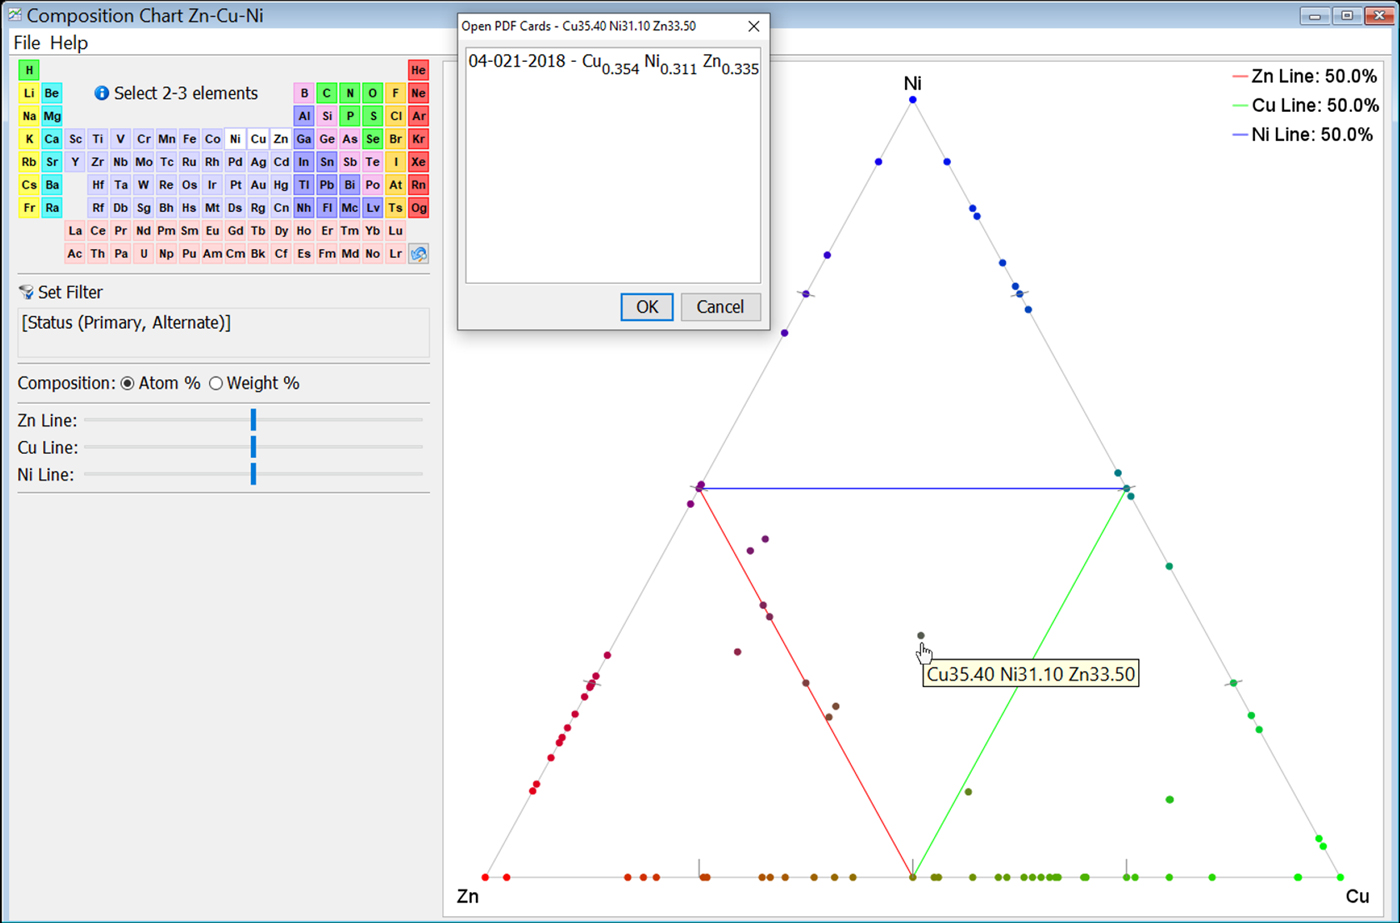
Technological advances in instrumentation over the years have undoubtedly influenced the manner in which PXRD data are collected, reviewed, stored, and presented in PDF products. These advances play a role in the quality of diffraction data inserted into the database. The data collection capabilities of newer instruments, combined with meticulous editorial processes, have greatly improved the overall quality of the PDF database. Though the initial creation the PDF was intended for phase identification, over the years the database has transitioned into a high-quality, comprehensive, materials’ identification tool whose increased size and functionality has also improved its quality and usefulness. Recent developments include the addition of composition graphing, 2D diffraction pattern overlay capability, 2D diffraction phase identification analysis (in SIeve+), and microanalysis (XRF) searches. The phase composition graph/search feature allows the user the ability to data mine based on binary or ternary compositions, and generate a resultant plot (Figure 7) where the user can select any data point on the graph to open the corresponding PDF entry. This new functionality has reduced the necessary steps it takes to compare and contrast binary and/or ternary phases in the PDF and has proven quite useful for individuals working with metals and alloys. With significant changes made annually, it is of benefit to all PDF users to keep their PDF databases up-to-date in order to ensure comprehensiveness and relevancy.
(Color online) Composition graph displaying PDF entries as points on the phase diagram of Zn, Cu, and Ni.
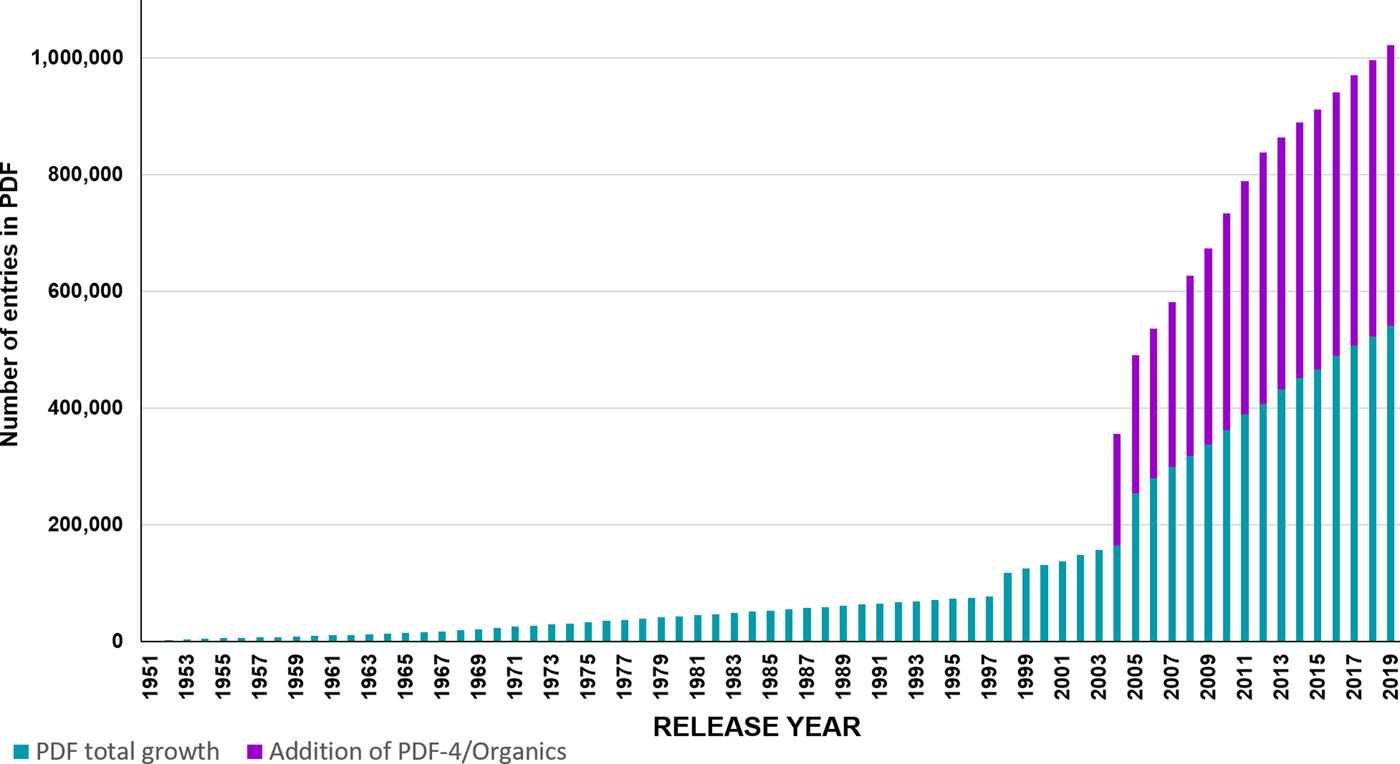
The current release of PDF products (Release 2019) contains a combined total of 1 004 568 published entries (Figure 8) that can be used in analyses of powder diffraction data. Using PDF product that are several years old omits recently added entries and prevents users from taking advantage of the latest features and capabilities of the PDF. The Powder Diffraction File continues to grow and evolve concurrently with the community and remains the world's most comprehensive source of inorganic and organic diffraction data for phase identification and materials’ characterization.
(Color online) Lifetime growth of the PDF-4+ (teal) and PDF-4/Organics (purple) databases.


 Open access