

Introduction
Ogives are alternate dark and light coloured bands on a glacier, hyperbolic in plan with the curves pointing down-glacier. They only occur below ice falls or avalanche fans, and one light and one dark band usually occupy the distance moved by the glacier in a year, if allowance is made for ablation and for variations in the speed of flow of the glacier over a period of years. They were first described fully by Forbes, Reference Forbes 1 who also noted that very much narrower veins of dark glassy ice, separated by opaque whiter ice, outcropped parallel with the ogives. We think that these latter structures are as typical of ogives as the large scale alternations of dirty and clean ice. These narrow structures alone would allow the ogives to show up in favourable weather conditions, especially after heavy rain. Similar large and small scale features occur in the accumulation zone at the head of glaciers, and have been studied in great detail in Midt Jotunheimen by a Cambridge group. Reference Grove and Lewis 2 The confusion between these two sets of features, the one the normal result of snowfall, melting and dust distribution in the firn, and the other associated with ice falls, has bedevilled the literature since the time of Agassiz and Forbes. Tyndall, Reference Tyndall 3 however, was not confused. He described stratification bands with the veined structure perpendicular to them, and acknowledged that Agassiz had observed this previously. Agassiz Reference Agassiz 4 certainly insisted that he had followed the “ogives” from the glacier’s snout right up to the firn field, and Forbes, Reference Forbes 5 just as strongly insisted that they ended at ice falls. Agassiz may not have been referring to ogives in the strict sense that Forbes intended and in which they are discussed here.
The Evidence of Vareschi—Grosser Aletschgletscher
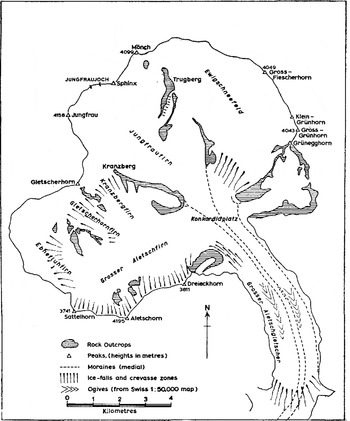
Vareschi has done some important work on ogives which has been appraised by Godwin. Reference Godwin 6 Vareschi Reference Vareschi 7 analysed the pollen included in various layers forming ogives on the Grosser Aletschgletscher, Switzerland. The evidence that Vareschi presented cannot be disputed, but he was possibly mistaken in some of his interpretation. He confused, as Agassiz did, the upper accumulation layers of the glacier with the ogives present lower down the glacier. As we consider that Vareschi produced critical evidence in favour of our present interpretation of ogives, his results must be examined carefully. Vareschi’s work has been criticized because it has been claimed that the Grosser Aletschgletscher does not possess the necessary ice falls, and thus Vareschi’s “ogives” have not been considered true ogives. Photographs in Vareschi’s. 1942 paper give indisputable evidence of the presence of ogives. The paper also includes maps of the ogives from which he collected samples and includes photographs and sketch-maps of individual ogives. Altogether he gives a most adequate presentation of evidence from a glacier on which, admittedly, the ogives are not very clear. In addition there is the magnificent 1:50,000 map (Jungfrau Sheet 264, 1939 Edition), photogrammetrically surveyed between 1927 and 1931, and first published in 1933. In this excellent Swiss Survey sheet both the contours and all morainic and other markings on the glaciers are clearly shown. Two of the three sets of ogives referred to by Vareschi are clearly shown, and the third set, on which he did most detailed work, can also be recognized indistinctly (Fig. 1). Thus there is indisputable evidence that ogives occur on the Grosser Aletschgletscher, but their relationship to the ice falls must be considered.
Location map of grosser Aletschgletscher, showing firn fields and ogives
Gross-Fiescherhorn, Klein-Grünhorn and lower Ewigschneefeld with 300 m. ice fall to Konkordiaplatz from the northern slopes of the Dreieckhorn, Switzerland. (Photograph by Photo-Verlag Gyger, Adelboden, Switzerland)

Gross-Grünhorn, Trugberg and the Grosser Aletschgletscher from Sphinx. By courtesy of Eidg. Landestopographie, Bern, Switzerland

If it is assumed that the stream lines of the Aletsch Glacier run parallel with the moraines, the ice including the ogives can be traced back up-glacier to its source in the snowfields. The easternmost system can be traced back unmistakably to the great 300 m. high ice fall where the Ewigschneefeld ice pours down on to the Konkordiaplatz (Fig. 1). Figure 2 (p. 912) shows this ice fall with the Gross-Fiescherhorn rising to 4,049 m. in the background. This set of ogives, therefore, satisfies Forbes’ criterion. A series of about 7 waves also occurs at the foot of this ice fall (see Blick auf Jungfraujoch, 45824, J. Gabarell A.G., Photo Verlag, Thalwil). The westernmost set of ogives is spread across the bulk of the ice which can be traced back to the Grosser Aletschfirn. This is fed from the south by very steep ice falls clinging to the precipitous slopes of the Sattelhorn, Aletschhorn and Dreieckhorn. The larger northern ice streams originate in the Ebnefluhfirn, which is broken in mid-altitudes by an ice fall nearly 200 m. high, and by the Gletscherhornfirn and the Kranzbergfirn, both of which are interrupted, again in their middle reaches, by highly crevassed zones. Therefore ice falls interrupt much of the ice feeding into the Grosser Aletschfirn, though in these latter instances they lie much nearer the top of the collecting ground than do the ice falls which are associated with the most distinct ogives. This leaves only the third narrow central set of indistinct ogives, which are barely 100 m. from horn to horn, on which Vareschi did most work. Vareschi’s central ogives are found to lie three-quarters of the way across the ice stream delimited by the Kranzberg and the Trugberg moraines, nearer the latter. If this flow line is traced up-glacier to and through the Jungfraufirn, always keeping one-quarter of the collecting ground east of the line, one is led to the foot of the elongated westernmost exposure of rock running south from the Trugberg, shown surrounded by ice in Figure 3 (p. 912). The west side of the western Trugberg ice stream towers above this rock exposure and great masses of ice regularly break off this face in summer and avalanche down on to the ice field below. This avalanche ice may be the source of the indistinct and very narrow ogives. If this interpretation is accepted then all three sets of ogives on the Grosser Aletschgletscher are normal ogives as defined by Forbes, all being associated with ice falls.
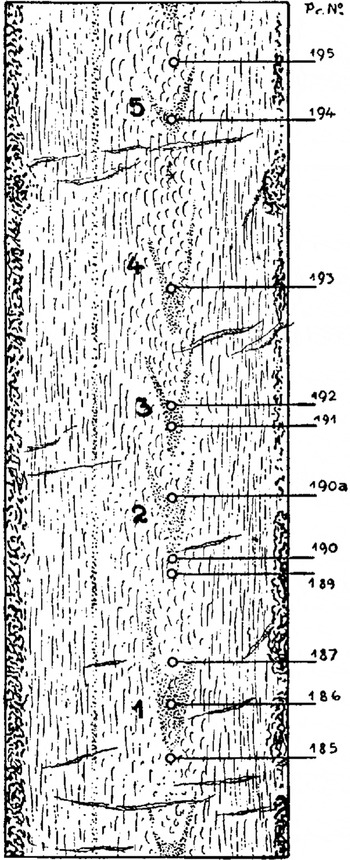
Vareschi attempted to determine the stratigraphical succession of the third series of ogives by pollen analysis. At their largest the individual ogives are more than 200 m. long and about 80 m. wide. The distance between them is not very uniform and varies between 150 and 280 m. The white parts of the ogives are filled with rough, bright knobs of ice, which on the flanks of the ogives gradually become longer and longer ribs and finally, near the moraines, they change into parallel banding. Samples were taken from points along the middle line, but it was difficult to determine their exact location in relation to the dark and light bands. Specimen 185 from the up-glacier end of a light band (Fig. 4) contained only one pollen grain from the Scots fir and Mountain pine group, of which the pollen is very fine and drifts around the whole year. Vareschi, who can speak with authority concerning the pollen, interpreted this as coming from a “winter layer”. Sample 186, from the darkest part of ogive 1, contained 12 pollen grains, 9 of which were the very late-flowering pine (Pinus cembra) and Spruce. Vareschi interpreted this as coming from an “autumn layer”.
Vareschi’s pollen diagrams (After Godwin)
Veslgjuv-breen, Midt-Jotunheimen, Norway

Panorama of Austerdalsbreen from ast Camp Station, July 1959

Vareschi shows that despite irregularities some system appears in the arrangement. The dark places in general show summer, spring and autumn aspects, but are also found sometimes almost without pollen. The lighter areas quite clearly contain everywhere winter layers. The seasons follow one another in their correct order as the ice flows past a fixed point. This is, in our view, the most significant conclusion that Vareschi draws from his excellent field studies. His evidence fits very well our hypothesis that the pollen grains fall into the avalanching ice below the Trugberg precisely at the seasons that Vareschi indicates. From this point Vareschi is probably mistaken in his interpretation; he seems to have been a follower of Agassiz rather than Forbes, although his direct acknowledgement is to Heim and Hess.
The most cogent reason for not accepting Vareschi’s view that the ice containing the ogives from which the pollen samples were taken, represents the strata as laid down in the névé is the excessive proportion of the whole which he attributes to summer and autumn accumulation. Seligman, Perutz and Hughes, working on the Jungfraufirn, Reference Seligman 8 , Reference Perutz and Seligman 9 , Reference Hughes and Seligman 10 , confirmed and expanded Ahlmann’s and Sverdrup’s Reference Ahlmann 11 classic work on more northern glaciers, that net accumulation in temperate glaciers is virtually confined to the winter. Any snow falling in the spring, summer or early autumn is removed by ablation. Yet on Vareschi’s interpretation roughly one-third of the net annual accumulation, as represented by the ice containing the ogives, is attributed to summer and autumn. Vareschi’s evidence for substantial summer accumulation, is not nearly as convincing as is his interpretation of the seasonal nature of the ice forming the ogives. High up on the crest of the Ewigschneefeld he marks the firn layers as spring, summer, autumn and winter. The proportion of ice that he attributes to each season is what would be expected. The summer layer is about one-third of the spring layer, which is about three-quarters of the winter layer. This snow accumulation on the crest of the divide at an altitude of nearly 3,600 m. is destined, as it moves slowly down-glacier, to be deeply buried and will not re-appear on the glacier surface until near its snout. It is not this snow that crops out in the zone of the ogives only half way down the glacier. This latter ice must accumulate near the middle of the névé much lower, at altitudes of about 3,200 m., where there can be little or no net summer accumulation.
Vareschi has shown clearly the seasonal nature of the ice forming the ogives, but his view that this originated in the firn cannot be accepted. A second major reason for not accepting Vareschi’s interpretation on this point is that, if his interpretation were correct, ogives would occur in all glaciers at all levels below the firn line, quite irrespective of the presence or absence of ice falls or avalanche fans. All the Aletsch glacier ice is derived from the firn fields, yet only a small proportion is characterized by ogives. This small proportion probably passed through extensive crevasse fields, which, in our opinion, allowed pollen to impregnate the ice rhythmically following the seasons. It is significant, also, that the ogives die out far above the snout of the glacier and therefore mark ice which was impregnated lower down, in the middle of the firn fields, and not high up near the mountain crest-line.
Midt-Jotunheim glaciers-sedimentary banding
The most satisfactory way to resolve this problem of the relation between accumulation layers in the snowfield and ogives in the glacier tongue is to examine a simple glacier, flowing without complication from the snowfield to the melting zone. Figure 5 (p. 912) shows Veslgjuv-breen, which is such a glacier. The panorama shows the main central part of the glacier from the collecting area on the left through the glacier proper, below the snow line, to the ice cliff on the right. Mrs. Grove’s work Reference Grove and Lewis 2 shows that this portion of the glacier has a simple life history. The snow which lies thickly on the glacier in winter melts back in summer well to the left of the snow line shown in the photograph taken on 15 July 1959. As the snow melts in summer the contained dust gets concentrated on the surface and is added to by the dust which blows on to the glacier from the bare vegetation-free ground in the neighbourhood, from which the snow clears early in the summer. This dirty layer then gets covered by the snows of the succeeding winter and therefore originates the succession of annual layers of thick, white, relatively clean winter ice, and very thin layers of dusty ice which represents the summer deposit. As the layers move down glacier they tip up so that their down-glacier ends crop out along the surface of the glacier forming the parallel bands which can be readily traced right across the glacier. The thick white bands represent very snowy winters and the thin ones derive from winters with light snowfall. Some of the very black bands represent summers during which the previous, and one or more earlier winter’s snowfall was completely melted away. The longitudinal continuity of these layers is also shown in the ice cliff, which reveals a good section through the glacier.
The Ogives of Austerdalsbreen
The panorama of Austerdalsbreen in Figure 6 (p. 912), taken from “East Camp Station”, shows for comparison the markings within the ogives which have been so understandably confused with the accumulation layers shown in Figure 5. On the glacier, close to, the two types of banding are indistinguishable. In terms of annual movement, however, one major dark and one major white band on Austerdalsbreen corresponds with one small dark and one small white band on Veslgjuv-breen. The unvarying difference between Veslgjuv-breen and Austerdalsbreen is that the small black and white bands on the latter, however clear they may be at one point, never continue unchanged if followed for a few hundred metres along the glacier. We suggest that the smaller bands on Austerdalsbreen represent crevasse fillings and individual blocks of ice arranged roughly en échelon in the ice fall, and greatly narrowed and rendered parallel by compression acting down the glacier, and lengthened by stretching at right angles to the compression.
(a) The Accumulation Area on Jostedalsbreen
Ice collects in Jostedalsbreen, which lies on a flat plateau where snows of successive winters lie horizontally as they slide slowly towards the ice falls (Fig. 7, p. 921), down which the ice pours to form the glacier tongues about 1,000 m. below. The arcuate crevasses seen in the centre foreground mark the ice flowing towards Thorsbreen, the eastern of the twin ice falls. Beyond is the more localized crevasse system above Odinsbreen, the ice fall which is discussed in most detail, while Lokebreen, now hanging above Austerdalsbreen, lies beyond it. The sinuous tracks in the right-hand corner mark the dirty outcropping ends of the snowfall of the winters immediately preceding 1947. They show that the snow line in that very warm summer, following a winter with little snowfall, was high above the top of the ice falls. The snow feeding Odinsbreen seems to have a particularly tranquil journey from the summit of Jostedalsbreen towards the lip of the ice fall, being interrupted only by occasional crevasses, where the underlying rock approaches or breaks the surface. The Brathay Exploration Group, led by Mr. W. G. Jenkins, carried out some arduous and helpful investigations in these crevasses in 1955 and 1956. They have given us a fairly clear picture of the nature and arrangement of the ice layers at the head of Odinsbreen. The beds curve over towards the lowering ice surface above the lip before the ice accelerates markedly in the upper part of the ice fall. Figure 8 (p. 921) shows the ice layers in this position. The bedding is as yet little disturbed but it has already been broken into great rectangular blocks by a series of steeply inclined faults, along which differential movements have occurred. The new snow falling on these blocks forms a sharp unconformity, seen at the top of Figure 9 (p. 921) This deep crevasse in the ice near the lip, just up-glacier from the heavily crevassed zone, was examined to a depth of 37 m. The systematic winter layering of firn separated by the summer dirt bands, seen alongside the ladder, continued downwards to a depth of 13 m., and represents snowfall that had fallen on the area of the ice cap immediately up-glacier within about 1,000 m. of the crevasse. Beneath, down to the full depth examined, the ice had no visible dirt; it was hard and consisted of alternating layers of relatively white opaque ice, in which crystals were visible, and thinner layers of dark glassy ice with no visible structure. This represented ice from snow which had fallen nearer the centre of the ice cap and which constitutes the bulk of the ice which travels down to the foot of the ice fall. Figures 10 and 11 (p. 922) show another crevasse which was descended, the nearest one to the rock outcrop seen in Figure 7, west of the crevassed zone at the head of Odinsbreen. Firn layers and dirt bands occurred to a depth of 10.5 m., below which layers of clear, glassy and crystalline ice alternated. Figure 10 shows, in the centre, the alternating layers of crystalline white ice and glassy dark ice. Figure 11 was taken with the camera pointing upwards. The fresh snow visible was again layered in spite of its almost vertical attitude. In fact, snow which has accumulated from individual showers, as is normal over an area of any size in temperate latitudes, is nearly always layered. A little crust forms on the top of the newly fallen snow as a result of melting, with some refreezing, compaction and crystal growth, between the falls. If the pause is long and the weather varied, these crusts become thicker, and when finally covered may delay or even prevent the downward percolation of melt water. This may freeze in situ and form a clear ice layer, which may thicken by several such additions of frozen melt water. In this way the sections shown in Figure 12, reconstructed from pits dug by the Brathay Exploration Group in 1955, are formed. This, then, is the condition of the ice when it reaches the top of the ice falls.
Looking west over Jostedalsbreen, showing the head of Thorsbreen and Odinsbreen, and all Lokebreen, taken 28 August 1947. By courtesy of wideroe’s Flyveselskap of Polarfy A/S

The top of Odinsbreen, showing unconformity of new snow lying on fractured sedimentary layers

Sedimentary banding in deep crevasse near the top of Odinsbreen.

Sedimentary banding 20 m. down a bergschrund.

Looking vertically up the crevasse shown in Figure 10, showing the vertical stratification in the crevasse.

Pit sections dug near the top of Odinsbreen to show the distribution of dirt bands and ice bands of sedimentary origin

(b) Odinsbre ice fall
Neither Odinsbre nor Thorsbre ice falls have been examined close up owing to the physical difficulty of doing so. However, Nye Reference Nye 12 has made an original and important point regarding the velocity of flow in the ice fall. Photographs of Odinsbreen were taken at 12-hour intervals for 38 days in July and August 1956. This gives approximate but valuable data concerning the speeds of flow in the different parts of the ice fall. We are greatly indebted to Dr. Nye, who has organized and collated the measurements of the whole team, for the data on which Figure 13 is based. The velocity approximates to 2,000 m. a year near the top of the ice fall, 400 m. a year at the site of the tunnel, and 100 m. a year down-glacier from the waves; thereafter it falls steadily to about 30 m. a year along the ogive-marked tongue, except for the sudden retardation at the snout, where flow observations have been made by Glen. Reference Glen This longitudinal velocity profile is one of the most important sources of evidence in considering the history of Austerdalsbreen with reference to the formation of both the waves near the foot of the ice falls and the ogives which characterize the remainder of the glacier.
Semi-logarithmic graph to show the variation in the rate of flow of Odinsbreen and Austerdalsbreen. The time taken for ice to travel down the glacier is also indicated

Nye Reference Nye 12 concluded from this evidence that the ice must be very attenuated in the upper fast-moving part of the ice fall, and must expose a very high proportion of its surface per volume to ablation in summer. On the other hand, ice passing through this part of the ice fall in winter is largely protected from ablation by the covering of snow and the lower winter temperatures. Accordingly one pulse of thick ice and one of thinner ice passes down the ice fall each year; these pulses produce waves in the glacier below. This is the essence of a part of Nye’s thesis. This idea has been used and developed further, perhaps too far, in our attempt to account for the ogives which succeed the waves immediately down-glacier. Figure 13 also shows the approximate time it takes for ice, starting at the top of ice fall, to reach the various points down glacier to the snout. It is based on the annual measurements made in various years between 1955 and 1959, although ogive separation suggests variations in rates of flow in the past.
The first large-scale effects of the acceleration of the ice as it moves towards and over the lip of the fall is to form the great arcuate crevasses shown in Figure 7. This action alone very greatly increases the surface area of ice exposed to the air and thus liable to ablation. A close-up of conditions in August 1955 at the head of Lokebreen is shown in Figure 14 (p. 922). The narrow “seracs” shown in the right foreground are rapidly melted down to more subdued forms as they move towards the area shown in the centre foreground, and at the same time inclusions of the previous winter’s snow are carried down. All this ice, moving as a thin attenuated layer, melts completely away in descending little more than 100 m. Similar losses must occur in Odinsbreen and Thorsbreen, which may well be as little as 50 m. thick or even less in the upper part of their ice falls. All the melt water produced by the rapid and extensive summer thaw pours into the crevasses and percolates into and through the mass, melting small crystals, freeing air bubbles, and, on freezing, adding to the size of larger crystals. In this way the bulk of the ice passing through the swift-moving part of the ice fall in summer changes more rapidly into the large, coarser crystalline formation, which Seligman Reference Seligman 14 demonstrated so well in the lower parts of Alpine glaciers. Inter-digitated within the rather coarsely crystalline ice will be remnants of new snow which penetrated to the bottom of the crevasses and there survived the succeeding summer’s ablation. Tyndall Reference Tyndall 15 noted the occurrence of white compact ice with innumerable round air cells on the Glacier du Géant where it often stood 3–4 ft. (1 m.) above the general level. He traced these ridges up-glacier to snow-filled crevasses. The melt water also does not always escape promptly from the bottom of the deeper crevasses as has been observed in some of the crevasses in Odinsbreen. Severe frosts in late summer and in autumn cause these deep narrow pools to freeze, forming the blue bubble-free ice which occurs in many places on Austerdals breen at a much lower level. Forbes Reference Forbes 16 attributed the blue ice in his “veined structures” to this action. Wright and Priestley Reference Wright and Priestley 17 are forthright in their explanation of what they term “vertical ice-dykes”: “Perhaps the most striking and frequent (especially in the northern regions of South Victoria Land) of all the types of blue and white banding are the vertical, or nearly vertical, ice-dykes which obviously bear little relation to the horizontal stratification of the glacier.
Lokebreen ice fall, showing snow-filled crevasses, taken 23 August 1955.

“There is fortunately no doubt about the origin of this striking feature of the Antarctic glaciers, for every stage may be seen from the open crevasse to the perfect blue ice-dyke, with the air concentrated in regularly arranged air-tubes which do not appreciably affect the brilliant blue colour of the ice. The occurrence of these ice-dykes is particularly frequent in glaciers, such as Warning Glacier, which descend steeply from a high elevation, and are in consequence particularly heavily crevassed. Their formation is favoured when, as in the same instance, the summer climate is comparatively warm and snow-free, so that the crevasses of the ice-falls often lie open throughout the summer when the influence of the summer sun is at a maximum.” Professor Debenham, in his lectures on glaciology at Cambridge, as on the Antarctic Expedition, strongly supported this view of the origin of many white bands and blue bands that occurred on Antarctic glaciers such as the Ferrar Glacier. He considered that crevasse fillings could be rotated, so as eventually to form long nearly horizontal layers, because of the greater velocity in the upper layers of a glacier. Wright and Priestley Reference Wright and Priestléy 18 hesitated to accept this explanation fully as it applied to silt bands, because they thought that most of the crevasses studied were far too irregular and discontinuous to give rise to the often orderly series of silt bands observed.
These frozen pools can be recognized not only by their deep blue colour but also by the tendency of the long axes of the crystals to align themselves radially, perpendicular to the surface of the ice bounding the pools. It seems reasonable, then, to assume that ice which has experienced summer conditions whilst passing through the upper part of the ice fall, will, when it reaches the lower ice fall be arranged in crudely sub-parallel wedges. These will consist of coarsely crystalline ice with occasional thinner blue layers between them, and also some thin layers of “young” white ice, composed of very small crystals with many very small air bubbles within it.
One further significant change occurs. During the summer when the country-side is free from snow, dust from the higher bare ground, exposed to the strong winds, and pollen from the lower vegetated ground, blows on to the glaciers, is deposited in the sheltered crevasses and is trapped between the crystals of new snow in the crevasses and other sheltered areas as suggested by Tyndall. Reference Tyndall 19 This dust is greatly augmented by avalanches, and especially by rock falls from the steep bounding walls of Odinsbreen, Thorsbreen and Austerdalsbreen. In this way the marginal moraines are provided with great additions of rock waste, in phase, as it were, with the dusting of the exposed ice in the upper ice falls. Excessive accumulation of dirt in crevasses may give rise to thin silty bands. The whole surface of the glaciers and ice cap receives its share of dust, but the dust to ice ratio will tend to be highest in the attenuated ice falls.
Circumstances are very different when ice travels through the upper ice fall in winter. The crevasses form and open where the flow is accelerating, as in summer, as it seems that velocities in the glacier below vary little between summer and winter; Reference Nye 12 but once the crevasses have opened instead of their being widened still further by ablation as they move down the ice fall, they are now filled with snow. This snow cover which Mr. W. H. Ward (private communication) states is not complete even in a snowy winter, also helps to protect the ice from dust and pollen, some of the finer particles of which blow round throughout the year. Nor is the transformation of this ice into coarser crystalline ice so rapid as when ample and widely distributed supplies of melt water are available. The result may well be that the “winter” ice reaches the lower two-thirds of the ice fall, where slackening velocity halts or even reverses the crevasse-widening process, very little altered. In this part of the ice fall the upper layers, which consist of thick vertical wedges of new snow filling crevasses between surviving blocks of ice, are melted away. Only the ice that was buried more deeply in the upper part of the ice fall survives to contribute to Austerdalsbreen below. Some snow wedges still survive in this but they do not form a large proportion of the whole.
The confused surface of upper Odinsbreen, where the velocity is about 2,000 m. a year, is shown in Figure 15 (p. 922). The glacier at this point is a fast-sliding composite slab of crushed ice, perhaps less than 50 m. thick. The individual masses twist and fall in their downhill journey; presenting a very large surface to ablation in proportion to the total volume of ice. The degree of confusion of the ice in this ice fall led the authors to hesitate some years before suggesting the present explanation, which relates the ordered series of ice layers in the ogives of the glacier below, directly to these chaotic conditions in the ice fall itself. But now evidence is accumulating that suggests that the ice is relatively thin in the upper part of the ice fall, it is therefore reasonable to assume that some of the crevasses continue through to the bottom layers of this ice, into less disordered ice masses which survive ablation in the ice fall and reach the glacier below. An early attempt to attribute ogives to the different conditions experienced by an ice fall in summer and in winter was made by Milward Reference Milward 20 a century ago. He considered that in winter ice little saturated by water moves down the ice fall, and in summer the ice is more sáturated. This, he assumed, gave rise to alternating wide bands of compact ice and narrow bands of porous ice, the distance apart corresponding with the annual movement.
Upper Odinsbreen, where the velocity is about 2,000 m. yr. −1

(c) The History of the Ice Structures—down-glacier Changes
Alternate layers of dark ice, with relatively few included air bubbles, and of whiter ice, with smaller inclusions of very white, finely crystalline ice, and many small air bubbles, could be easily recognized at the site of the tunnel entrance. Reference Glen 21 At this point these sub-parallel rudimentary layers, which thinned out or bifurcated in an erratic manner, dipped up-glacier at about 51° from the horizontal. It is interesting to note that this dip is perpendicular to the direction of maximum stress, as deduced from the tunnel survey by Glen, which is roughly parallel to the surface slope. Further down-glacier the dip was 72° and was again at right angles to the surface slope. There is a gradual reduction of dip down-glacier with a marked reduction near the snout; the maximum value of 88° occurred just below the waves. Representative values are shown on the map (Fig. 16). The gradual reduction of dip down the main part of the glacier is due to the drag of the rock bed, retarding the lower layers of ice. This has also been noted by Untersteiner. Reference Grove and Lewis 22
Plane-table survey of the ogives of Austerdalsbreen in July 1959

The orderly, parallel arrangement of the ice bands, which characterize most of the lower glacier tongue does not occur immediately at the foot of the ice fall. Figure 17 (p. 923) shows structures dipping at right-angles to the usual direction in the zone near the tunnel entrance. Note that the dark bands are very wide here, as well as being discontinuous. Figure 18 (p. 923) shows a very clear white band varying considerably in width especially below the ice axe. This photograph also shows two small caverns that have been formed by lateral compression due to the ice fall to the left. Another irregularly shaped inclusion of white ice is shown in Figure 19 (p. 923). The inclusion did not continue up to the surface of the glacier on which the rucksack rested. Two thinner streaks of dark ice are also shown roughly parallel with the white band. When examined outcropping in plan these inclusions of white ice can be traced some distance and their high degree of irregularity is then evident as shown in Figure 20 (p. 923). This photograph was taken a little further down-glacier than the preceding ones. These white patches reflected the sun’s rays more than the neighbouring darker ice and therefore projected above the general level of the ablating surface as smooth, hard ice. The white ice contained many little round air bubbles; the larger were about 1 mm. across but most of them were very much smaller. The bubbles were usually only a few millimetres apart. This ice remained smooth to the touch even on a hot day. The bubbles could not be interconnecting since the ice remained white in the bottoms of pools although water invariably penetrated the darker ice and made it appear a leaden grey.
Ice structures dipping 90° away from the normal dip in the zone of the tunnel site.

A white ice band near the tunnel entrance

Inclusion of white ice at the foot of the ice fall

Jagged inclusion of while ice, shown in plan near the foot of the ice fall

The wedge-shaped pattern of outcrops on the glacier surface, shown in Figure 21 (p. 923), was rather more typical in this ice a few hundred metres down-glacier from the site of the tunnel entrance. This white ice with its small crystals forms from snow which fell into the crevasses in the ice fall. As they move down-glacier away from the ice fall they become corn-pressed in the direction of the axis of the glacier, and stretched out sideways. Thus, they gradually become more and more regular and parallel as they move down-glacier. A second and perhaps more important reason for their increasing regularity down-glacier is because the most irregular inclusions, formed near the surface in the ice fall, where the crevassing was more severe, disappear by ablation before moving far from the immediate foot of the ice fall. An example of the removal of the superficial layers of ice is provided by the huge avalanche fan at the foot of Thorsbreen (Fig. 22, p. 923). The reconstituted ice from the upper layers of this fan all melts away before it has travelled many hundred metres from its origin.
Close-up of wedge-shaped inclusion of white ice and of dark ice near the foot of the ice fall

A general view of Odinsbre and Thorsbre ice falls from Austerdalsbreen

Dr. J. W. Glen was probably the first member of our glacier research group to express the view that some features of the ogives had originated in crevasses in the ice fall. This, like so many other good ideas, is not entirely new and was suggested by Forbes and Debenham to mention only two authorities working in very different environments and at very different times. Our only claim is to have incorporated this idea into a fairly consistent scheme of glacier development.
The amount of compression suffered by the ice moving down the middle of the ice fall and glacier below, is indicated by the velocities shown in Figure 13. Ice moves five times as fast near the top of the ice fall as it does past the site of the tunnel entrance; this ratio is 10 for the ice moving through the zone of waves, 33 for the ice at the 1959 camp site, and 100 for the ice at the top of the steep curve-over at the snout. This implies a maximum compression of 100 times down the centre line. The map in Figure 16 shows that the ogives are dragged back and are far more attenuated near the side of the glacier than near the centre, especially west of the camp site. In this area the compression may be about 100 to 200 times. It is not surprising that the irregularities of the seracs and crevasse-fillings are flattened out into long thin parallel bands. In considering the relationship between crevasses and the fine banding, Dr. Nye suggested that we should make a rough calculation of the effect of longitudinal retardation and side drag. It may be noted that the velocity of ice flow near the glacier side at the camp site is only a fifth of that of the central ice. The speed of flow in the centre is reduced from about 2,000 m. a year to about 50 m. a year, a reduction of about 40 times. At the side of the glacier, therefore, where the band count was made (Fig. 16) the compression should be about 220 times. The measured width of white bands was 5 cm., this would allow the original crevasses to be 11 m. wide, which is not unreasonable for their deeper parts, where the snow filling would have originated. Even if the average speed in the ice fall were considerably less, possibly about 800 m. a year, the width of the original crevasses would be about 4.5 m.
Evers Reference Evers 23 followed Tyndall, Reference Tyndall 24 and to a lesser extent Forbes, Reference Forbes 25 in suggesting that the veined or slaty structure of the ice indicates a condition of great pressure derived from an ice fall. He notes that it is the alternation of compact and veined ice that gives rise to the dirt bands, and with Forbes Reference Forbes 1 he believes that it is the cellular or friable ice that can hold the dirt and thus discolour the dirt band. Figures 23 to 27 (p. 924) show the flattening process on Austerdalsbreen. Figure 23, taken nearest to the ice fall, shows very irregular, wedge-shaped, discontinuous inclusions of dark ice. Figure 24 shows the character of the ice layers further down-glacier, where compression has made them narrower and parallel, but the elongated wedges and ends of layers are visible, together with some very white layers. The narrow vertical wedge shown on the left is bounded, on both sides and below, by a V-shaped inclusion of white ice, possibly due to water freezing in a crevasse already partly filled with compacted snow. An extreme case of thinning and rendering parallel is shown in Figure 25. The best exposures of these layers are always deep down the sides of crevasses, where neither the sun’s radiation nor warm winds penetrate. Melting always occurs more rapidly in the dark ice than in the white ice owing to the different albedos. The breaking up of the dark ice layers in which the crystals are 2 or 3 cm. across, a few metres down in the crevasse, into loose separate crystals near the surface of the glacier, can also be recognized in Figures 24 and Figures 25. This quicker melting of the darker layers tends to concentrate little runnels of melt water along these layers. This further accelerates differential melting, as can be seen in Figures 26 and 27, where two little water-falls are shown melting their way back into the upper face of the crevasse along the dark layers. Figure 27 also shows the concentration of dark layers in the dirty ogive and the higher proportion of white layers in the light ogive. The gently wavy surface produced by differential melting between the dark and light ogive as a whole can also be seen in Figures 26 and 27. The greater proportion of dark ice in the dirty ogive is a feature stressed by Lewis for some years as being an essential characteristic of these ogives, and an absolutely fundamental fact in the present thesis.
Irretvelar inclusions of dark ice near the ice fall of Odiasbreen

Inclusions of and while ice rendered long, thin and parallel by compression

Very thin parallel layers of dark and of white ice near the west side of Austerdalsbreen

Parallel ice layers in the compressed ogives near the west side of Austerdalsbreen

Closer view of the subject of Figure 26

In order to check this, a band count was made at points “B C 1” and “B C 2” whose positions, on the west side of Austerdalsbreen, are marked on the map (Fig. 16). Points were chosen where the respective dark and white bands within the ogives were clearly visible in crevasses. Both widths and numbers of bands were observed, and the results are shown in Table I. The thin layers were divided into seven categories according to their lightness or darkness as judged by eye. The various bands fell readily into these few types.

The position of the first band count was at the up-glacier limit of the well-defined ogives. All categories occurred in both the dark and the light ogives, but in very different proportions. The crevasse walls used were dry so that included water in the ice did not confuse the colouring. The deep blue ice is only found in very small amounts in the light ogives, but white ice, although more plentiful in the light ogives, is also found in the dark ones. This favours the suggestion that, whereas snow falls into crevasses in the ice fall both in summer and in winter, water pours in and freezes about three times as often in summer as in winter, which seems reasonable. The off-white ice occurs abundantly in both ogives, being more abundant oddly enough, in the dark one. Perhaps this is the type of ice which is least changed during its passage through the ice fall. It is the next darker shade of greyish white ice that really differentiates the dark from the light ogive, the proportion increasing from less than 10 per cent in the dark ogive to more than 40 per cent of the total in the light one. The “mixed” category which could not be differentiated is fairly small in both cases. The amount of the three categories of blue ice further distinguishes the dark ogive from the light one, the combined percentage being 31.2 in the dark and 12.1 in the light. This very real difference may reflect the soaking with water which much of the ice near the top of the ice fall experiences in summer compared with winter. These different characteristics, however they originate, are definitely formed in the ice fall. The ice bands counted would have been in the ice fall in about 1947, that is when the air photograph, Figure 7, was taken.
Band count 2 was carried out in ice about 15 years older. It confirms the general picture given by the previous count, but yet shows interesting differences. How much these differences are due to the longer time these layers have spent in the glacier, and how much is due to a difference in conditions in the ice fall in 1931 or 1932 and in 1946 or 1947 cannot be estimated. Undue importance must not be attached to the extra 15 years within the glacier, because during most of this time the ice was buried deeply in the glacier, the annual ablation being roughly 7 m. at this altitude. White ice was completely absent; this may be due to the failure of the crevasses to reach deep enough into the ice fall to allow inclusions of new snow to be trapped at the necessary depth. Alternatively percolating water may have so enlarged the crystals during the ensuing 15 years, as to transform it into the other categories of ice. It may be significant that only one deep blue band occurred, thus lending some support to the suggestion of insufficient crevasse depth. Even this isolated blue band may have been formed in Austerdalsbreen itself, by a pool freezing in a crevasse or melt-hole, or by water percolating down a fracture and freezing. The remaining categories occur in rather similar proportions to those measured in B C 1. Again the difference in the proportion of blue ice is decisive.
The conclu]the band counts, supported by evidence of Figures 6, 26 and 27, is that it is the different proportions of dark and white ice within the ogives that is their unalterable characteristic. The fact that one clearly marked band cannot be traced very far along the ogives before it disappears, again seems to support the view that the ice bands. are old crevasse fillings and seracs greatly squeezed and drawn out.
(d) The link between the waves and the ogives
If this interpretation of the ogives is correct then the dark ogives should derive from ice that was in the upper part of the ice fall in summer. Nye’s convincing thesis attributes the wave crests below Odinsbreen to ice that was in the upper part of the ice fall in winter, and the troughs to ice that was in that position in summer. The wave crests should therefore correspond fairly closely with the light ogives, and the troughs with the dark ogives. The coincidence may not be precise because the position of maximum velocity in summer, which corresponds to the trough, need not be in the same place as the position of maximum crevassing,. which tends to be a little higher up the ice fall, nearer the lip. The crevasses, however, extend a long way down the ice fall. Nye and Lewis independently examined the waves in 1959, and Nye thought it possible that the down-glacier fronts of the wave crests may correspond with the light ogives. Lewis favours this suggestion, but it is not an easy one to prove because the waves virtually disappear slightly up-glacier from the zone where the ogives begin to show clearly.
The panorama, Figure 28 (p. 925), shows the west side of Austerdalsbreen taken from above point “W C S S” (Figure 16). The ogives can be seen to start down-glacier from the waves and the lowest wave discernible in this panorama is darkened by dirt. Two photographs of this critical area are shown in Figures 29 and 30. Figure 29 (p. 925), was taken in 1956. The furthest projection, in an up-glacier direction, of the shadow in the bottom right corner reaches a light ogive; then scanning up-glacier there follows a succession: dark, light, dark, light; the next dark ogive is less distinct and is succeeded immediately up-glacier by a succession of five crests and five troughs, the crest-to-crest distances increasing systematically up-glacier. The upper end of this widest crest is at the projecting point of the left shadow. This succession can be checked against that on the far side of the glacier, which seems to be in phase when traced across the wide spread of medial moraine. The same area is shown from a different view-point in Figure 30 (p. 925), taken from the lower part of Odinsbreen in July 1958. The best indicators in the zone of the waves in this photograph are the thin lines of new snow occupying the up-glacier sides of the troughs. Counting down-glacier there appear five clear ones and again they get closer together down-glacier, even if allowance is made for the foreshortening. The fifth line of snow appears to be at the up-glacier end of a dark band and continuing down-glacier the succession of dark and light ogives is very clear. The two photographs forming Figure 31 (p. 926), were taken in July 1956, and show the critical zone where the waves below Odinsbre ice fall merge down-glacier into the ogives. This panorama seems to confirm our view that the crests of the waves closely correspond with the light ogives and the troughs with the dark ogives. Counting from the bottom left corner, four wide crests—widely spaced because of the considerable annual movement in this part of the glacier—can be counted in the left photograph. They seem to pass, in phase, into what are undoubted light-coloured ogives in the right photograph.
Panorama from above point W C S S (Figure 16) on the west side of Austerdalsbreen

The junction zone of waves and ogives on Austerdalsbreen.

The junction zone of waves and ogives from the lower part of Odinsbre ice fall

Waves merging down-glacier into ogives below Thorsbre ice fall

Figures 29, 30 and 31 do seem to give the key to the linking of the waves with the ogives.
Figure 32 (p. 926) shows the waves as they appear nearby. Cloud shadows fell on the first and third crests, and the two people were standing on the first and second crests respectively. The light appearance of the second crest is therefore largely due to reflected sunlight, but the nearer crest, to the left (west) of the little stream valley, is wholly in the shade. The immediate left foreground is rather dark, although the very dark patch is mainly due to surface dirt; then the crest rising towards the nearer figure is relatively light and is probably a potential light ogive. The other side of the little stream valley shows alternations of dark and light ice, some thick, some thin, which according to our interpretation, represent a continuation of the same light ogive just referred to. At least this photograph serves to show how cautious we must be in linking the ogives with the waves. In this position the ogives are far wider than further down the glacier, where they are so very much easier to detect. At this point the compression is not so great. The increased compression further down-glacier that brings the dark and light ice closer together probably makes the colour contrast easier for the eye to detect and the camera to record.
The waves below Odinsbre ice fall

Another reason for the ogives not being clear in the zone of waves immediately below the ice fall may be that the differences we attribute to winter and summer conditions respectively in the upper part of the ice fall, are not really systematic in the excessively disturbed surface layers of the ice fall. Only when this ice is lost by ablation does the more systematically altered ice of the deeper layers emerge at the surface and show the ogives clearly (see Figure 31).
(e) The concentration of dirt in the dark ogives
The east side of Austerdalsbreen is shown in the panorama, Figure 33 (p. 926), taken from the snow avalanche fan near survey point 4 E (Figure 16). This side of the glacier is much dirtier than the west side, and the ogives are correspondingly much clearer, except where the widespread dirt mantle almost conceals them, just beyond the lower end of the great rock fall shown in the right foreground. Figure 16 shows that these ogives, produced by the avalanching Thorsbre, are very closely in step with those produced by Odinsbreen the whole length of the glacier.
Panorama of the east side of Austerdalsbreen from point 4 E (Fig. 16)

Forbes stressed that the ogives on the Mer de Glace only showed clearly in cloudy weather, and not when the sun shone brightly on the glacier. The reason, probably, is not the lighting conditions, but the condition of the immediate surface of the glacier. Bright sunshine, especially in the Alps, quickly melts the crystal boundaries, especially of the darker ice. This gives a diffused reflection of the light and also makes the little blue and white bands much less distinct, even when viewed close up. In this state the glacier is easy to walk on because the irregularities in the surface, and the partly loosened ice crystals, enable one’s boots to grip. After heavy rain the surface is much smoother and more slippery. The loosened crystals have been melted away and the fresh coherent underlying crystals form the new surface. It is in this state that the ogives show most clearly, and thus favour our view that it is the nature of the fine ice bands, or Forbes’ veins, and not the presence or absence of dirt that really characterizes the ogives.
The question of the systematic distribution of dirt on the dark ogives, when it occurs in some quantity, must be considered. Some method of distributing dirt more on the dark ogives throughout the full length of the glacier is required. If the dirt were only spread on the surface in one particular zone, this initial cover would soon get more and more dispersed as streamlets, wind, and the lowering of the surface by ablation redistfibutes the dirt. Two main methods by which the dirt can remain so precisely distributed on the dark ogives can be suggested. Either it can emerge on to the appropriate parts of the surface during each summer’s ablation period because it is distributed in depth primarily within the blue-layered ice, having got into this position in the ice fall as previously suggested, or there is some property or action which enables the ice of the dark ogives to collect and hold new supplies of dirt concentration that occur. The second method may well be the more important as shown by an experiment started by Dr. J. F. Nye in 1959. A patch on a dark ogive, marked “C P” on Figure 16, was swept and chiselled clear of surface dirt. From a distance this cleared patch then appeared white like the other part of the ogive. This supported our view that dirt was extremely sparse within the body of the glacier, within “summer” and “winter” ice alike, and only darkened the surface after much melting had led to a great concentration of dirt on the surface. The chief object of this experiment was to observe future changes on this artificially cleaned patch. After one year the cleaned patch was already much dirtier, which proves that dirtying is now proceeding actively.
The effect of lingering snow-drifts may be considered first. Figure 34 (p. 927) shows the conditions of the upper part of Austerdalsbreen on 2 July 1958, when the snow had collected more thickly in the slight ablation troughs of the dark ogives. Presumably the foehn like down-draught of warm air melts the slightly projecting crests of white ice more than the slightly sheltered shallow troughs, and prevents differential ablation from deepening the troughs more than about 0.5 m. Nevertheless, even this greater thickness of snow in the troughs enables it to last a few days more, especially as the white snow surface reflects radiation and retards ablation. Fresh falls of snow in summer also repeat the condition shown in the photograph several times each season. These systematic lines of snow act as efficient dust traps just at the times of the year when dust begins to blow around freely from the surrounding snow-free countryside. Not only is dust trapped between the snow crystals more readily than on the smoother surfaces of ice, but the rain which washes particles off the ice only carries the dust on the snow downwards as it percolates freely to the bottom of the patch. Thus the bottom layers of snow patches get highly charged with dust (see Figure 35, p. 927). As the linear snow patches finally melt away they leave their burden of dust in lines across the glacier. Although it then starts to be washed away itself, small dark patches and little pebbles melt downwards into the surface, where they tend to remain in little pockets and pits—or dust-wells.
Snow patches along dark ogives, 2 july 1958

The concentration of dirt at the bottom of a snow patch

Tyndall Reference Tyndall 26 noted this capacity of snow-beds to trap silt carried down the glacier by streamlets, and then, on melting, to leave it as a concentrated deposit on the glacier’s surface marking the lines of the dark ogives. He thought that the greater porosity of the ice beneath was due to the absorption of the sun’s, rays by the dark dirt and the resultant formation of countless dust-wells. We tend more to Forbes’ view Reference Forbes and Coolidge 27 that the greater porosity developed by melting is related also to the type of ice, and is not only due to dust-wells. The white ice has already been described as hard and smooth, slow to melt and therefore upstanding, properties that dispel rather than hold any dirt falling on, or washing across, its surface. The dark ice behaves very differently. Its surface readily melted into separate crystals 1 to 2 cm. across. Blocks of this transparent ice contained large air bubbles 1 to 2 cm. in diameter, but very much further apart than the small round bubbles in the white ice. On a hot sunny day the blue ice contained numerous vertical cylindrical holes about 1 mm. in diameter. Their shape was probably due to dust melting vertically downwards. These cylindrical holes were 2 to 3 cm. deep, and a large number of samples examined were riddled with them. They certainly act as very efficient dirt traps.
A simple experiment was carried out in 1955 by Mr. M. F. Clarke and Miss J. Heath. They washed clean the vertical surface of clear blue and white bubbly ice, outcropping in the side of a melt-water tunnel in the glacier. Then dirty, silty sludge, was rubbed on to the surface of the two types of ice. Again the surfaces were washed clean. They found that the silt washed off the white ice completely, none having penetrated beneath the surface. However, the clear blue ice allowed both silt and water to penetrate beneath the surface to a depth of at least 1 cm., thereby outlining crystal interstices which were otherwise almost invisible. Elongated air bubbles, extremely thin in section, but up to 4 cm. in diameter in plan, were delineated. The white bubbly ice showed no crystal structure except on the exposed surface, but the clear ice appeared definitely crystalline to a depth of several cm. at least, the crystals appearing irregular and partly fused when viewed at 10 times magnification.
This investigation provides the key to the problem of the dirt-holding properties of the dark ice. The results as they appear on the surface of the glacier are shown in Figures 36 and 37 (p. 927). In each case under differing surface conditions, the thin outcrops of coarsely crystalline ice have trapped the dust. In the foreground of Figure 36, the individual bands are clearly darkened, but beyond the ice axe the combination of many little dark lines produces broader dark patches. A dirty part of the glacier is shown in Figure 37, where the spreading streams have deposited a mantle of dirt right across a light ogive. This photograph serves as a reminder that the dirt is not stagnant and, during the melt season, is actively moved from one part of the glacier’s surface to another. The little streams always tend to carry dirt swiftly down a deep, narrow channel but deposit it where they spread out widely on gentle slopes. This feature is shown in Figure 38 (p. 927). The streams had cut deep little channels through the upstanding white ice of the light ogive, shown in the right foreground, but they spread out, forming pools, on the dark ogive on the left. This behaviour of the streams also lightens the light ogives and darkens the dark ones without addition of dirt; the upstanding white ice is well drained and relatively dry, while the dark ice is sodden and grey, a characteristic pointed out during the Expedition by Mr. W. H. Ward.
Dirt concentrated along layers of coarsely crystalline ice

Dirt by a stream interrupting a light ogive

Streams draining a light ogive and waterlogging and darkening a dark ogive

A close-up photograph of dirt on a dark ogive

A close-up photograph of a light ogive, close to that in Figure 39

The best evidence for correlating the dark ogives with ice which passed down the ice falls in summer comes from the snout. Figure 41 (p. 928) shows the glacier from the top of the east wall of Austerdalen. In the foreground six large black extensions of the medial moraine, arranged ogive-like on Thorsbre ice, can be correlated with the ogives from Odinsbreen. The oldest moraine extension correlates with the oldest dark ogive which is mostly out of the picture where it joins the widely spread medial moraine. The next five morainic bands up-glacier all fit well with the corresponding ogives on the other (west) side of the moraine. Near the centre of the photograph the moraine can be seen to be more concentrated and consists mainly of a series of mounds of debris, which again correlate with the dark ogives on Odinsbre ice. Morainic material, which is arranged in this seasonal pattern must, surely, be attributed to rock waste falling on to the ice falls each summer.
The ogives Austerdalsbreen showing concentrations of debris in the mediclsmoraine corresponding with the dark ogives.

Further evidence may correct, modify or disprove this theory of ogive formation, but we feel justified in publishing it at this stage in the hope that it will stimulate further discussion and research.
Acknowledgements
It is impossible to thank adequately all those who have helped in this work, the many students from Cambridge, Nottingham and other Universities, the Brathay Exploration Group, and above all our own colleagues in this piece of research, Mr. W. H. Ward, Dr. J. F. Nye and Dr. J. W. Glen. Our discussions and arguments on the glacier and elsewhere have always been most exhilarating and helpful; some ideas which we think are our own may come from another at such times, and more often from the literature, but whenever we have consciously used ideas culled from others, we have tried to acknowledge them. The work could not have proceeded without the financial support of the Royal Society, the Royal Geographical Society, the Mount Everest Foundation, the University of Cambridge, including the Scandinavian, the Tennant, and the Worts Funds. Trinity College, Cambridge, contributed generously both at the outset of our researches in 1955, and again to help this paper to be so fully illustrated. With many other Cambridge Colleges, Trinity College also gave grants to undergraduates helping in this combined operation. We are most grateful for all this help.
The unacknowledged photographs were taken by W.V.L.


