


Introduction
Investigations into pathogen-induced diarrhea in weaned piglets carry significant implications for both veterinary and human health (Huang et al. Reference Huang, Luo and Liu2024). The gastrointestinal tract of piglets, particularly during the vulnerable post-weaning period, is highly susceptible to microbial dysbiosis and enteric infections (Gresse et al. Reference Gresse, Chaucheyras-Durand and Fleury2017; Han et al. Reference Han, Hu and Jin2024). These infections not only compromise animal welfare and productivity but also serve as important models for understanding host–microbe interactions, mucosal immunity, and antimicrobial resistance in early life (Albernaz-Gonçalves and Olmos Antillón Reference Albernaz-Gonçalves and Olmos Antillón2022; Mooyottu et al. Reference Mooyottu, Muyyarikkandy and Yousefi2025; Virdi et al. Reference Virdi, Coddens and De Buck2013). Multiple pathogens – such as Escherichia coli, Clostridium perfringens, rotavirus, and porcine epidemic diarrhea virus (PEDV) – are known to be involved, each triggering distinct pathophysiological responses in the host (Jin et al. Reference Jin, Xu and Yang2024a; Li et al. Reference Li, Ma and Dong2022; Uzal et al. Reference Uzal, Navarro and Asin2023; Yang et al. Reference Yang, Fan and Mao2024). Understanding host genetic susceptibility to these diverse pathogens is critical for developing targeted breeding strategies and improving disease resilience in swine populations.
Over the past decade, advances in genomics have facilitated genome-wide association studies (GWAS) to identify genetic loci associated with disease resistance in pigs (Uemoto et al. Reference Uemoto, Ichinoseki and Matsumoto2021; Xu and Lin Reference Xu and Lin2025). However, most traditional GWAS approaches are limited by linear assumptions and a lack of interpretability when modeling complex host–pathogen interactions (Bartoli and Roux Reference Bartoli and Roux2017; Roux and Bergelson Reference Roux and Bergelson2016). Furthermore, they often fail to differentiate genetic risk profiles across multiple pathogens, thereby limiting their precision in informing pathogen-specific disease management strategies (Duchen et al. Reference Duchen, Vergara and Thio2023; Nadeau et al. Reference Nadeau, Thorball and Kouyos2022). Recently, machine learning (ML) approaches have emerged as powerful tools for capturing nonlinear relationships in high-dimensional genomic data (Chafai and Bonizzi Reference Chafai and Bonizzi2024). Yet, the “black-box” nature of many ML models has hindered their application in genomics where biological interpretability is essential (Alvarez-Costes Reference Alvarez-Costes2025; Conard et al. Reference Conard, Denadel and Crawford2023). Interpretable machine learning (IML) models – especially those combining predictive performance with transparent decision rules or feature attribution – offer a promising framework to overcome this limitation (Chen and Yang Reference Chen and Yang2024; Sutradhar et al. Reference Sutradhar, Akter and Shamrat2024). By integrating IML with multi-pathogen infection data, it becomes feasible to uncover distinct host genetic architectures associated with susceptibility to specific diarrheal pathogens.
In this study, we construct a comprehensive, IML framework to identify risk genes associated with pathogen-specific diarrheal outcomes in pigs. By integrating host genomic data with microbiological diagnostic records across diverse diarrheal cases, we (i) develop predictive models to classify infections by pathogen type, (ii) identify key host genetic features contributing to pathogen-specific susceptibility, and (iii) validate the biological relevance of these genes through functional annotation and literature-based evidence. Our findings provide new insights into the genetic basis of differential immune responses to enteric pathogens and offer actionable targets for genetic selection programs aimed at improving disease resistance in swine.
Materials and methods
Study design
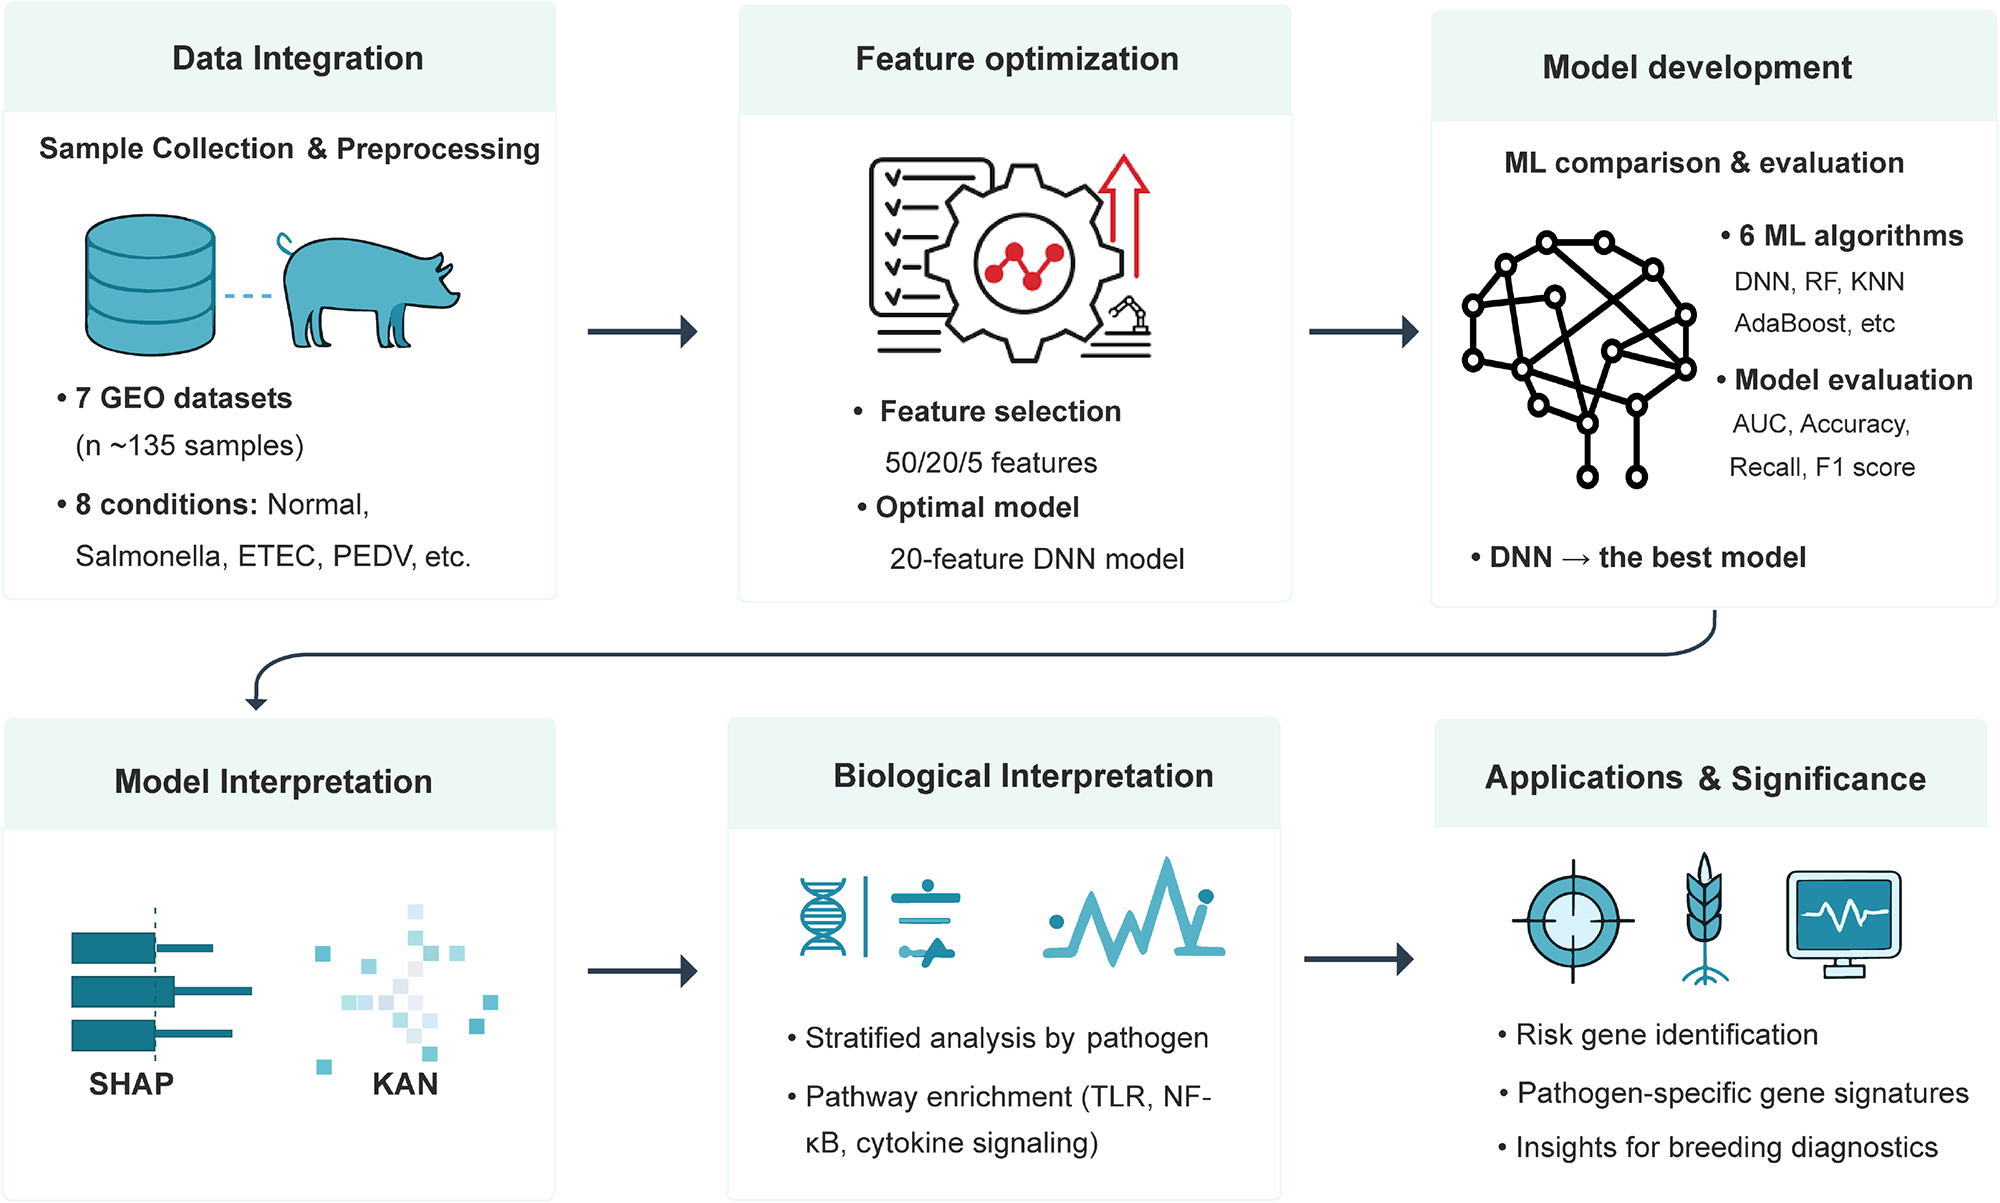
The overall study design (Fig. 1) was aimed to develop and interpret ML models to identify pathogen-specific risk genes associated with porcine diarrhea. The pipeline includes data integration, feature selection, model training and comparison, model interpretation, and biological validation through pathway enrichment analysis.
Workflow for pathogen-specific risk gene identification in porcine diarrhea using interpretable machine learning (ML). The pipeline begins with data integration from 7 Gene Expression Omnibus (GEO) transcriptomic datasets (∼135 samples) under 8 conditions (e.g., Normal, Salmonella, ETEC, PEDV). Feature selection was performed. Multiple ML models (DNN, RF, KNN, AdaBoost, etc.) were developed and evaluated using performance metrics (AUC, accuracy, recall, F1 score), with the 20 features deep neural network (DNN) selected as the best-performing classifier. Model interpretation was conducted using SHapley Additive exPlanations (SHAP) and Kolmogorov–Arnold network (KAN) to ensure biological interpretability. Biological insights were derived through stratified pathogen-specific analyses and pathway enrichment (e.g., TLR, NF-κB, cytokine signaling). Final outputs include risk gene identification, pathogen-specific gene signatures, and diagnostic insights relevant to pig breeding and disease resistance.

Data source and preprocess
Transcriptomic data were collected from seven Gene Expression Omnibus (GEO) datasets (GSE134130, GSE105797, GSE122764, GSE182240, GSE28003, GSE136705, and GSE41756), comprising 135 samples across 8 clinical categories: healthy controls (n = 54) and infections caused by Salmonella typhimurium, Clostridium perfringens type C, Lawsonia intracellularis (LI), transmissible gastroenteritis virus (TGEV), PEDV, enterotoxigenic Escherichia coli (ETEC), and porcine deltacoronavirus (PDCoV). Preprocessing included quantile normalization, log2 transformation, and batch effect correction using the ComBat method.
Feature selection
To improve the model’s performance and reduce the risk of overfitting, we adopted a multi-stage feature selection process, considering the importance and stability of features. The specific process is as follows. First, the original feature data is preprocessed using standard deviation normalization. Then, a three-stage feature screening strategy is applied. Filter method was used for initial screening. The SelectKBest method combined with the f class if scoring function is used to perform univariate analysis on all features, selecting the top K1 (set to 50 in this study) significant features. Embedded method was used for further screening. Based on the results of the first stage screening, the LASSO regression model with cross-validation to automatically adjust the regularization parameter is used to identify features with non-zero regression coefficients, retaining the top K2 (set to 20) most representative features, including FTL, COL3A1, ACTG1, STAT1, HSPA5, SLC5A1, HADHA, ATP1A1, RPS3A, EEF1G, FCGRT, RPL11, MX1, PRDX6, RPS12, VDAC1, FLNB, RPS18, RPL29, and COL5A2. Wrapper method was used for final screening. The Recursive Feature Elimination (RFE) algorithm is utilized, with logistic regression as the base model, to further screen the features obtained from the second stage, ultimately obtaining a K3 (set to 5) optimal feature subset, comprising FTL, COL3A1, ACTG1, STAT1, and HSPA5. The selected features are finally used to train and test the multiple classification models to select the optimal model with better classification performance.
Model training and comparison
We evaluated six classifiers: deep neural network (DNN), Adaptive Boosting (AdaBoost), Gradient Boosting Decision Tree (GBDT), Random Forest (RF), eXtreme Gradient Boosting (XGBoost), and K-Nearest Neighbors (KNN). Performance metrics included area under the receiver operating characteristic (ROC) curve (AUC), accuracy, precision, recall, and F1-score, which was assessed using stratified 10-fold cross-validation. The DNN model showed the best performance and was selected for the subsequent interpretation.
Model interpretation
To enhance the interpretability of the model, we introduced the SHapley Additive exPlanations (SHAP) method to explain the output results of the final model. SHAP is a game theory-based model interpretation method that provides a unified and consistent measure of feature importance by calculating the marginal contribution of each feature to the model’s predictions. In this study, we used the TreeExplainer-based SHAP implementation to interpret the DNN prediction model, thereby identifying the key features that have the greatest impact on the prediction results. The DNN architecture consisted of three fully connected layers with 128, 64, and 32 neurons, using rectified linear unit (ReLU) activation functions for hidden layers and softmax for the output layer in the case of classification tasks. We trained the DNN using the Adam optimizer with a learning rate of 0.001, with categorical cross-entropy loss. The model was trained for 50 epochs, using a batch size of 32, with early stopping to avoid overfitting. To explain the DNN model, we visualized SHAP values using bar plots, beeswarm plots, force plots, and waterfall plots, which allowed us to analyze the contribution direction and intensity of each feature across different samples, assisting in identifying biologically significant variables.
Additionally, the Kolmogorov–Arnold network (KAN) was employed in this study. Unlike conventional multilayer perceptrons that rely on fixed activation functions, KAN replaces activation functions with learnable nonlinear operators, such as B-spline functions, and restructures the computation using element-wise additions and multiplications. This design enables KAN to achieve higher approximation accuracy and enhanced interpretability. The KAN architecture in this study included several hidden layers with spline-based units, specifically configured with 4 hidden layers, each having 64 spline units. We implemented the model using an open-source PyTorch-based KAN framework, and the network was trained using the Adam optimizer with a learning rate of 0.001, along with a cross-entropy loss function. Early stopping was applied to mitigate overfitting during training. After training, we visualized the learned nonlinear transformations, allowing us to better understand how each input dimension contributed to the final prediction. The KAN model showed improved performance and interpretability, offering insights into the complex relationships between the input features and the target labels.
Stratified and functional analyses
To investigate pathogen-specific host gene responses, we conducted a stratified SHAP analysis across each pathogen group. For functional validation, Gene Ontology (GO) and Kyoto Encyclopedia of Genes and Genomes (KEGG) pathway enrichment analyses were performed on the top 50 SHAP-ranked genes using the cluster Profiler package, with adjusted P-values < 0.05 considered significant.
Statistical analysis
All statistical analyses and computational procedures were conducted using R (version 4.4.1) and Python (version 3.9.12). A two-sided P-value less than 0.05 was considered to indicate statistical significance. For ML modeling, the XGBoost algorithm was implemented via the “eXtreme Gradient Boosting” package (version 2.0.3). Other classification models, including DNN, GBDT, RF, AdaBoost, XGBoost, and KNN were developed using the scikit-learn library (version 1.3.2), with data preprocessing and management facilitated by pandas (version 1.5.3) and numpy (version 1.23.5). The DNN models were built using TensorFlow (version 1.13.1), and the KAN was implemented with the PyKAN library (version 0.2.8).
Results
Baseline information and study design
A total of 135 transcriptomic samples from 7 publicly available GEO datasets were integrated, encompassing 8 conditions: normal (n = 54), Salmonella typhimurium (n = 20), Clostridium perfringens type C (n = 10), LI (n = 17), TGEV (n = 14), PEDV (n = 2), ETEC (n = 15), and PDCoV (n = 3) (Table 1). Following preprocessing and harmonization, feature selection was performed to mitigate the curse of dimensionality and enhance model generalizability. Six ML algorithms were trained and compared. Model interpretation via SHAP and KAN methods revealed key pathogen-specific gene contributions. Stratified pathway enrichment analysis highlighted distinct immune-related mechanisms, including TLR, NF-κB, and cytokine signaling pathways (Fig. 1). The final output included candidate risk genes and pathogen-discriminative signatures, offering mechanistic insights and potential translational value for disease diagnostics and selective breeding.
Baseline information of datasets

C. perfringens: Clostridium perfringens type C; LI: Lawsonia intracellularis; TGEV: transmissible gastroenteritis virus; PEDV: porcine epidemic diarrhea virus; ETEC: enterotoxigenic Escherichia coli; PDCoV: porcine deltacoronavirus.
Model performance and optimal feature selection for pathogen prediction
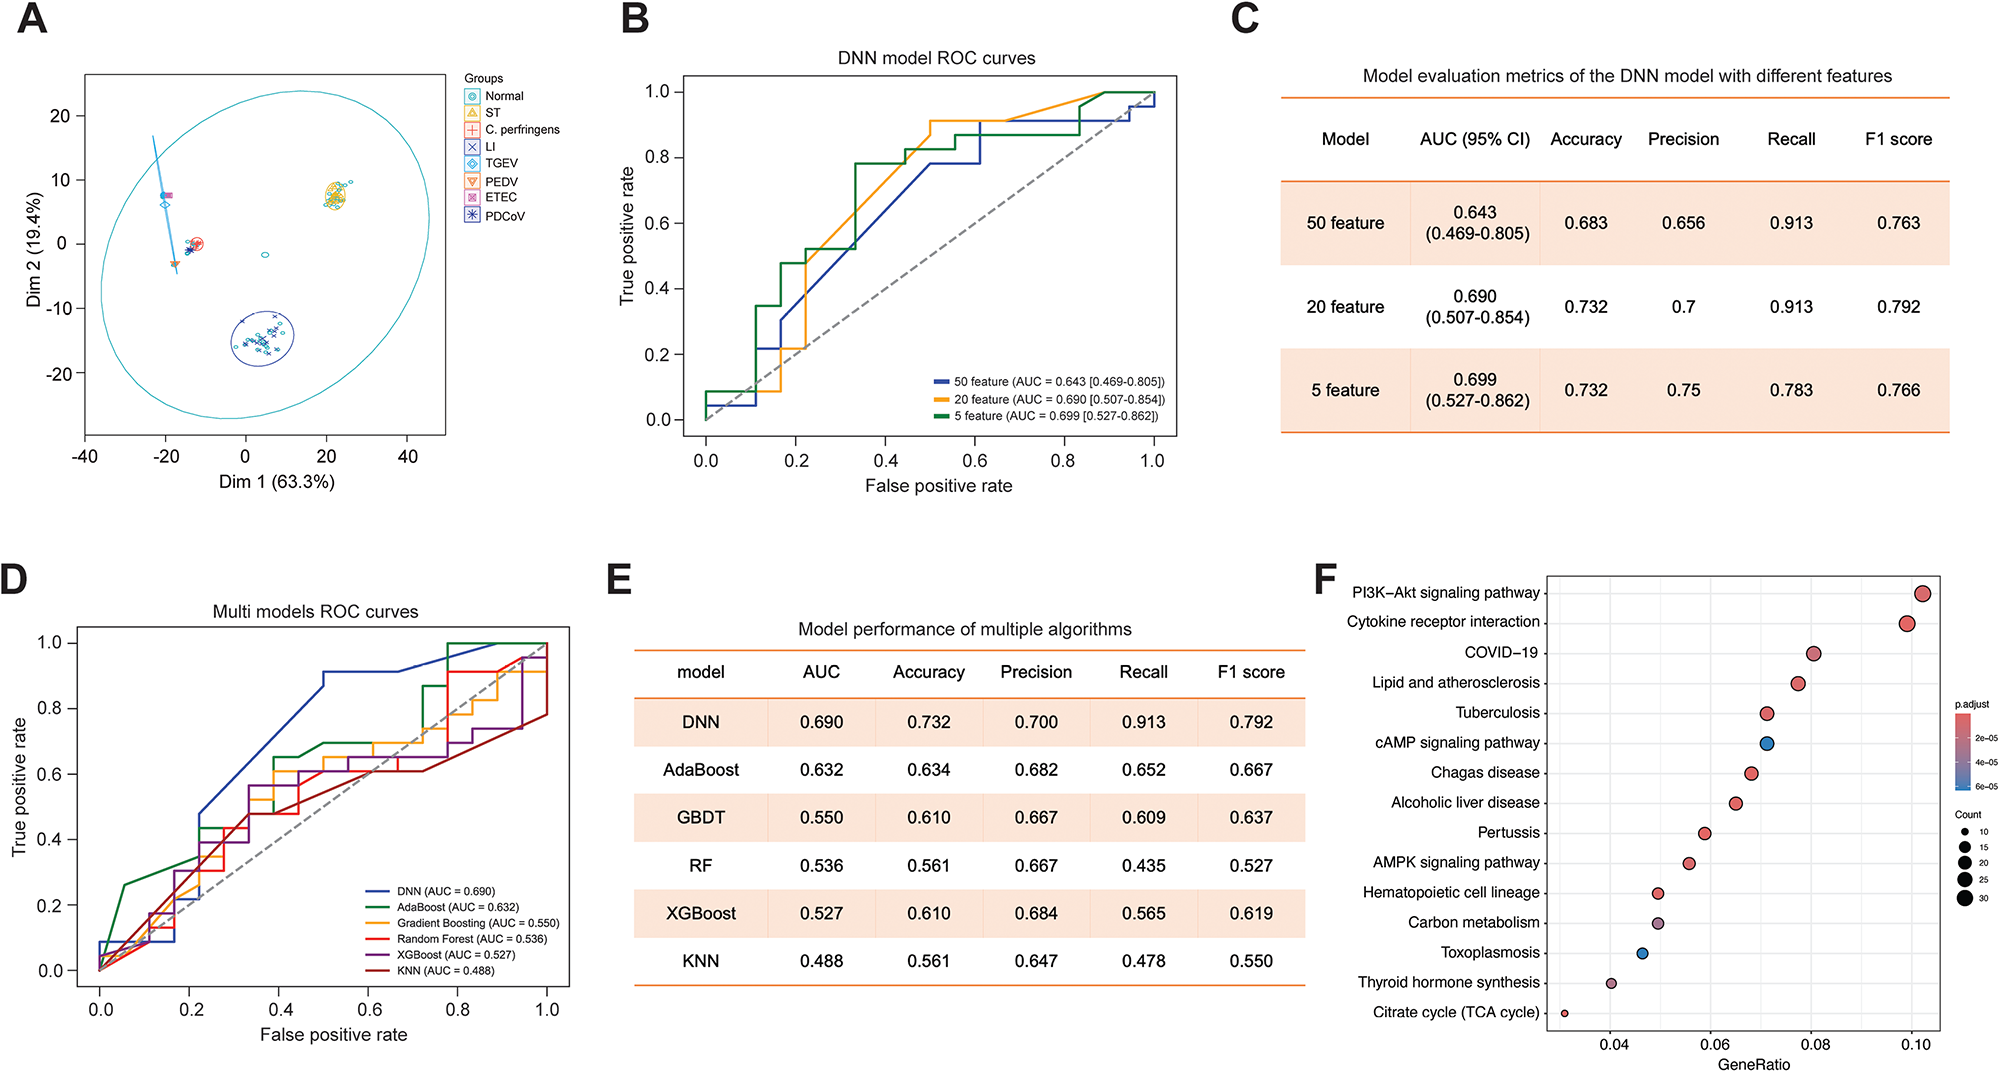
To explore whether host transcriptional signatures could discriminate different infection states, we first performed dimension-reduction analysis on the training cohort. The samples corresponding to healthy controls and each pathogen formed relatively compact and well-separated clusters in the first two dimensions (Dim1 = 63.3%, Dim2 = 19.4%; Fig. 2A), indicating that the gene-expression profiles contained sufficient structure for downstream classification. Then, we evaluated the impact of different feature set sizes on the performance of the DNN classifier to optimize model performance while reducing dimensionality. Three feature subsets containing 50, 20, and 5 genes were generated through a stepwise feature selection strategy, and DNN models were trained using each subset. As shown in Fig. 2B and C, the DNN models constructed with 20 and 5 features exhibited comparable classification performance, with similar AUC values, both outperforming the model trained on 50 features. This result indicates that effective dimensionality reduction can be achieved without substantial loss of predictive accuracy.
Comparative performance of ML models and feature optimization in predicting pathogen-specific gene signatures. (A) Principal component analysis (PCA) of host transcriptomic profiles showing separation of healthy controls and different pathogen groups in the first two dimensions. (B) ROC curves of the DNN model built with 50-, 20-, and 5-feature sets. (C) Corresponding performance metrics of the DNN models with different feature numbers, showing that the 20-gene model achieves a favorable balance between discrimination and stability. (D) Receiver operating characteristic (ROC) curves of six ML models evaluated on the test set, including DNN, Adaptive Boosting (AdaBoost), Gradient Boosting Decision Tree (GBDT), Random Forest (RF), eXtreme Gradient Boosting (XGBoost), and K-Nearest Neighbors (KNN). (E) Summary table of model performance metrics (AUC, accuracy, precision, recall, and F1 score) for the six algorithms, highlighting the superior performance of the DNN classifier. (F) KEGG pathway enrichment analysis of the 20 selected genes, with dot size indicating gene count and color representing adjusted P value.

Although the 5-gene model demonstrated competitive performance, we reasoned that such a highly compact feature set might not fully capture the biological complexity and heterogeneity of host transcriptomic responses to diverse diarrheal pathogens. Therefore, considering both predictive performance and biological representativeness, the 20-gene feature set was selected as the optimal model for subsequent analyses. Based on this 20-gene feature set, we next compared the performance of six ML algorithms, including DNN, AdaBoost, GBDT, RF, XGBoost, and KNN. As shown in Fig. 2D, the DNN classifier consistently outperformed the other five models, achieving the highest AUC, along with superior accuracy, recall, and F1 score (Fig. 2E). In contrast, ensemble-based tree models and distance-based methods showed moderate to poor performance, with several models performing close to random classification. Together, these results demonstrate that the DNN model built on the 20-gene feature set provides an optimal balance between classification accuracy, robustness, and biological interpretability and was therefore selected for downstream SHAP interpretation, KAN modeling, and pathogen-specific analyses.
Functional enrichment analysis of these 50 genes revealed significant over-representation of immune- and metabolism-related pathways, including PI3K–Akt signaling, cytokine–cytokine receptor interaction, COVID-19–related pathways, lipid and atherosclerosis, AMPK signaling, carbon metabolism, and the tricarboxylic acid cycle, among others (Fig. 2F). These pathways are closely linked to host inflammatory responses and metabolic reprogramming during infection, supporting the biological plausibility of the selected feature set.
SHAP-based interpretation of the 20-gene DNN classifier highlights ACTG1, SLC5A1, and ATP1A1 as key contributors
To enhance the interpretability of the optimal 20-gene DNN classifier, we applied SHAP analysis to quantify the contribution of each gene to the model output. The global heatmap and importance ranking (Fig. 3A and B) showed that ACTG1, SLC5A1, and ATP1A1 were the dominant contributors among the 20 predictors: their mean absolute SHAP values were 0.1529, 0.1489, and 0.1248, respectively, markedly higher than the remaining genes. Across patients, ACTG1 and SLC5A1 displayed consistently large negative SHAP values in many instances, indicating that higher expression of these genes tended to drive the predicted probability away from the target class, whereas lower expression favored a positive prediction. In contrast, ATP1A1 showed a wider spread of SHAP values, including several samples with strongly positive contributions, suggesting that increased ATP1A1 expression can substantially enhance the predicted risk in a subset of patients (Fig. 3B). The dependence plots further illustrated these patterns at the single-gene level: ACTG1 and SLC5A1 exhibited nonlinear but predominantly negative relationships between feature value and SHAP value, with most points clustering around or below zero (Fig. 3C and D), whereas ATP1A1 showed a flatter profile at low–moderate expression but a sharp increase in SHAP value at the upper expression range (Fig. 3E). Functionally, ACTG1 encodes a cytoskeletal protein, SLC5A1 is a sodium-glucose cotransporter, and ATP1A1 encodes a Na⁺/K⁺-ATPase α-subunit; together they are involved in cytoskeletal dynamics, nutrient uptake, and ion homeostasis (Bunnell and Ervasti Reference Bunnell and Ervasti2010; Han et al. Reference Han, Qu and Aydin2022; Jiang and Wu Reference Jiang and Wu2025). Their prominent and heterogeneous SHAP patterns, therefore, provide biologically plausible, gene-specific hypotheses on how host structural and metabolic programs modulate the classifier’s decision boundary, offering concrete entry points for downstream mechanistic studies and biomarker development.
SHAP-based interpretation of gene contributions in the 20-feature DNN model. (A) Global SHAP heatmap showing sample-wise contributions of the top 9 genes and the summed contribution of the remaining 11 features to the model output; red indicates positive and blue negative impact on the prediction, with the black bars on the right denoting mean absolute SHAP value for each feature. The line on top represents the corresponding model output f(x) for each instance. (B) SHAP summary “beeswarm” plot ranking features by mean absolute SHAP value and displaying their distribution across all samples; each dot represents one sample, and color encodes the normalized gene-expression level (red, high; blue, low). (C–E) SHAP dependence plots for ACTG1, SLC5A1, and ATP1A1, respectively, showing the relationship between feature value (x-axis) and SHAP value (y-axis), which reflects the marginal effect of each gene on the predicted probability of infection in the DNN model.

Case-level SHAP explanations highlight additive gene effects on DNN prediction
To enable sample-specific interpretability, we further examined SHAP force and waterfall plots for representative predictions from the 20-gene DNN classifier (Fig. 4A and B). In a case with a relatively high predicted probability of infection (f(x) = 0.723 vs. base value E[f(x)] = 0.573), the force plot showed that increased expression of ACTG1 (6.65) and SLC5A1 (5.13) were the main drivers pushing the prediction toward the positive class, contributing +0.32 and +0.29 to the logit output, respectively. In contrast, several genes, including RPS18, RPL11, COL3A1, ATP1A1, RPS3A, PRDX6, and RPL29, exerted small negative SHAP values, partially offsetting the effect of ACTG1 and SLC5A1. A second example with a moderately elevated predicted probability (f(x) = 0.691) highlighted a different combination of dominant contributors: high ATP1A1 (109.6) and ACTG1 (444.92) expression increased the output by +0.09 and +0.08, respectively, with additional smaller positive contributions from SLC5A1, EEF1G, and HSPA5, whereas FTL (5819.6) and RPS12 acted as major negative contributors (−0.13 and −0.04). Together, these case-level decompositions illustrate how the same set of genes can combine in distinct additive patterns to yield patient-specific risk estimates, providing an intuitive view of the model’s internal decision process and reinforcing the biological plausibility of individual gene perturbations in pathogen discrimination.
Case-level SHAP explanations of the 20-gene DNN classifier. (A) SHAP force plot for a representative sample with a predicted probability of infection f(x) = 0.723 compared with the model base value E[f(x)] = 0.573. Red bars indicate genes whose expression pushes the prediction toward higher risk (e.g., ACTG1 and SLC5A1), whereas blue bars indicate genes that decrease the prediction (e.g., RPS18, RPL11, COL3A1, ATP1A1, and other features). (B) Corresponding SHAP waterfall plots for two representative cases, showing the stepwise additive contribution of individual genes to the final prediction. The x-axis represents the cumulative model output starting from the base value, with each bar denoting the signed SHAP value of a single gene. These plots illustrate how different combinations of high-impact genes (such as ACTG1, SLC5A1, ATP1A1, FTL, and RPS12) shape patient-specific risk estimates.

KAN-based modelling achieves comparable performance with an explicit linear gene-to-node function for pathogen prediction
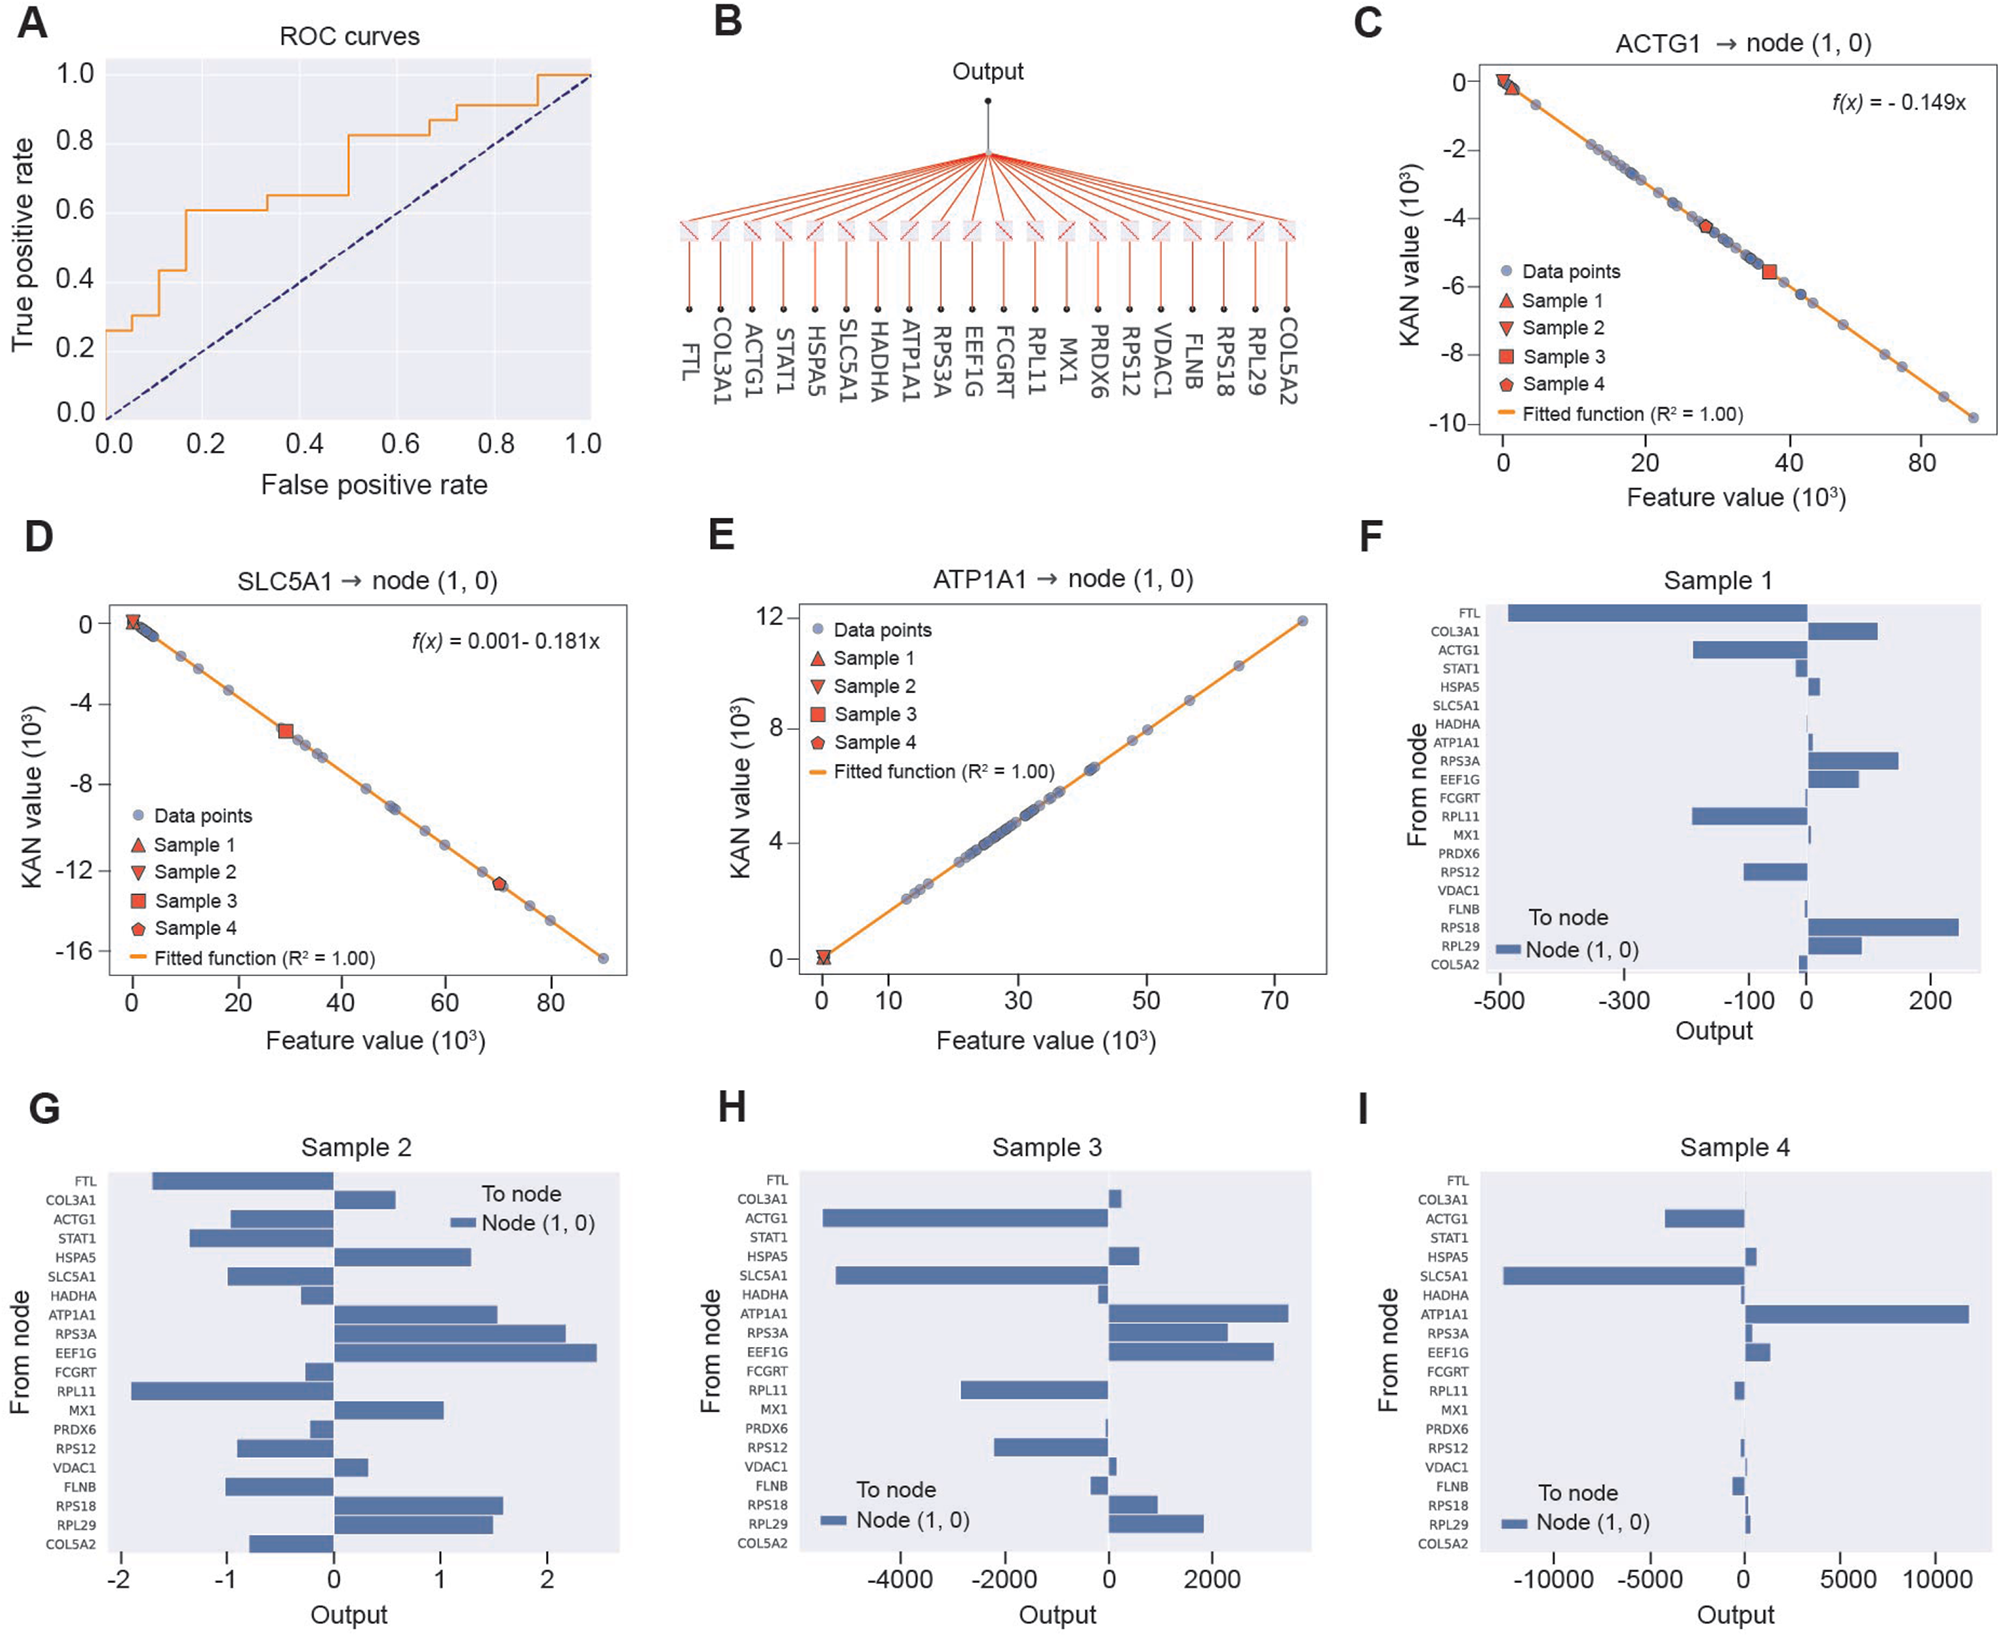
To further enhance the model’s expressive power and approximation capability, we implemented a 20-gene KAN. The KAN achieved a test AUC of 0.71 (Fig. 5A), comparable to and slightly higher than the DNN classifier, indicating that the alternative architecture preserved good discriminative performance. Visualization of the learned architecture revealed a relatively sparse feature-to-output topology, in which all 20 input genes were funneled into a single hidden node (node [1,0]) that directly controlled the final prediction (Fig. 5B), with thicker edges highlighting genes with stronger effective influence. At the functional level, the KAN yielded explicit mappings between gene expression and node activation. For ACTG1 and SLC5A1, the relationship between the raw feature value and the transformed KAN value at node (1,0) was almost perfectly linear with a negative slope (R 2 = 1.00; Fig. 5C and D), indicating that increasing expression of these genes monotonically suppressed the internal risk signal, whereas ATP1A1 displayed an approximately linear positive mapping (R 2 = 1.00; Fig. 5E), whereby higher expression increased node activation and thus elevated the predicted probability. Importantly, the KAN provided a closed-form expression for the activation of node (1,0) as a weighted sum of all 20 standardized gene inputs: f (1,0)(x) = −0.155 x 1 + 0.212 x 10 − 0.03 x 11 − 0.17 x 12 + 0.218 x 13 − 0.022 x 14 − 0.076 x 15 + 0.035 x 16 − 0.14 x 17 + 0.14 x 18 + 0.132 x 19 + 0.152 x 2 − 0.171 x 20 − 0.153 x 3 − 0.161 x 4 + 0.111 x 5 − 0.185 x 6 − 0.041 x 7 + 0.161 x 8 + 0.175 x 9 + 0.009, where x 1–x 20 denote the 20 input genes in their predefined order. We next examined four representative samples to trace how these gene-specific functions combined at the case level. Bar plots of contributions to node (1,0) showed distinct additive patterns across individuals (Fig. 5F–I): in some samples, ATP1A1, RPL29, and RPS3A were the dominant positive drivers of node output, while ACTG1, SLC5A1, COL3A1, or FTL exerted strong negative effects; in others, a broader set of stress-response and ribosomal genes contributed modestly in either direction. Together, these results demonstrate that the KAN not only matches the predictive accuracy of the DNN but also encodes transparent, mathematically explicit gene-to-node relationships, thereby offering a biologically interpretable framework for modelling host transcriptional responses in pathogen prediction.
KAN modelling and explicit gene-to-node functions. (A) ROC curve of the 20-gene KAN classifier on the test set. (B) Visualization of the KAN architecture, in which all 20 gene inputs are connected to a single hidden node (node 1,0) that feeds the output. (C–E) Learned functional mappings between standardized expression of ACTG1 (C), SLC5A1 (D), or ATP1A1 (E) and the activation of node (1,0); gray dots represent all samples, colored symbols highlight four representative samples, and the orange line shows the fitted function (R 2 = 1.00), indicating approximately linear negative effects for ACTG1 and SLC5A1 and a linear positive effect for ATP1A1. (F–I) Gene-level contributions to node (1,0) for four representative samples (Samples 1–4), with horizontal bars indicating the signed effect of each gene on node output (rightward, positive; leftward, negative), illustrating distinct additive patterns of ATP1A1, ACTG1, SLC5A1, and other genes across individuals.

Pathogen-stratified SHAP patterns reveal shared and distinct host transcriptional signatures
To further delineate pathogen-specific host transcriptomic responses, we performed SHAP-based feature decomposition for each major diarrheal pathogen. For LI, SLC5A1, ACTG1, and ATP1A1 showed the highest mean absolute SHAP values, exerting strong negative contributions to the predicted output in most samples, whereas ribosomal genes (RPS18, RPL11, RPS3A) and FTL contributed more modestly (Fig. 6A). In a representative LI-infected case, elevated SLC5A1 and ACTG1 jointly drove the prediction toward the LI class, partially counterbalanced by negative effects from RPS18 and COL3A1 (Fig. 6A). A similar pattern was observed for ETEC, where ACTG1 and SLC5A1 again dominated the feature ranking, with ATP1A1 and RPS18 providing additional support (Fig. 6B); in the illustrative ETEC sample, high ACTG1 expression produced the largest positive shift in model output, while PRDX6 and RPL29 dampened the prediction (Fig. 6B). For TGEV, ACTG1 and SLC5A1 remained the leading contributors, but COL3A1 and FTL gained importance, and several ribosomal genes exerted consistent negative effects (Fig. 6C); the corresponding force plot showed that coordinated upregulation of ACTG1 and SLC5A1 was sufficient to overcome inhibitory signals from RPS12, RPL29, and PRDX6, yielding a high TGEV probability (Fig. 6C). In contrast, PDCoV exhibited a distinct profile in which FTL and ATP1A1 were the primary positive drivers, accompanied by HSPA5 and ACTG1, while RPS18 and COL3A1 mainly reduced the predicted risk (Fig. 6D); at the single-sample level, ATP1A1 and HSPA5 strongly pushed the prediction toward PDCoV despite counteracting contributions from FTL and SLC5A1 in some cases (Fig. 6D). Finally, Clostridium perfringens type C was characterized by leading contributions from FTL and ACTG1, with ATP1A1 and multiple ribosomal genes (RPS18, RPS12, RPL11) shaping the decision boundary (Fig. 6E); in the representative case, high FTL and SLC5A1 expression markedly increased the output, whereas RPS18 and COL3A1 suppressed it (Fig. 6E). Taken together, these stratified SHAP signatures reveal both convergent and divergent host responses across pathogens: nutrient transport (SLC5A1), cytoskeletal remodeling (ACTG1), ion/energy homeostasis (ATP1A1), iron metabolism (FTL), and ribosomal/stress-response pathways are recurrently involved, suggesting that this triad constitutes a core cross-pathogen host signature with key predictive value for diverse infectious etiologies.
Pathogen-stratified SHAP interpretation of the 20-gene DNN classifier. (A–E) SHAP decompositions for Lawsonia intracellularis (LI) (A), enterotoxigenic Escherichia coli (ETEC) (B), transmissible gastroenteritis virus (TGEV) (C), porcine deltacoronavirus (PDCoV) (D), and Clostridium perfringens type C (C. perfringens) (E). For each pathogen, panel (i) shows the mean absolute SHAP value of each gene across all samples in that group, ordered by importance (bars labelled “Other features” represent the summed contribution of the remaining genes). Panel (ii) displays SHAP summary (beeswarm) plots, where each point corresponds to one sample, the x-axis indicates SHAP value (impact on model output), and point color encodes normalized gene-expression level (red, high; blue, low). Panel (iii) presents representative force/waterfall plots for a single sample from each pathogen group, illustrating how high-impact genes (e.g., ACTG1, SLC5A1, ATP1A1, FTL, and selected ribosomal or stress-response genes) additively push the prediction away from (blue) or toward (red) the pathogen-specific output relative to the expected model value E[f(x)].

Discussion
Diarrhea remains one of the leading causes of morbidity, mortality, and economic loss in pig farming globally, particularly affecting neonatal and weaning piglets at their most immunologically vulnerable stages (Saha et al. Reference Saha, Namai and Nishiyama2024; Zhai et al. Reference Zhai, Sun and Zhang2022). Although previous research has elucidated pathogen-specific mechanisms and host responses associated with porcine enteric disease, most studies have relied on traditional statistical models or single-pathogen analyses, often lacking scalability, mechanistic clarity, or predictive precision. In this computational hypothesis generation study, we present a biologically IML framework that addresses these limitations by integrating DNNs with SHAP and KAN interpretive tools. This dual approach enables robust classification of pathogen-specific diarrheal states while yielding insight into underlying host genomic determinants. Compared with earlier transcriptome-based classifiers – which often suffer from overfitting or opaque inference – our framework achieves both high predictive performance and mechanistic transparency, a combination rarely realized in host–pathogen modelling.
The identification of key innate immune genes such as ACTG1 and SLC5A1 through SHAP analysis is consistent with previous work on mucosal immunity (Momoh et al. Reference Momoh, Adeniran and Ramos2025; Schlaberg et al. Reference Schlaberg, Barrett and Edes2018). These findings further reinforce their central roles in recognizing lipopolysaccharide and initiating inflammasome-driven IL-1β responses (Xu et al. Reference Xu, Huang and Zhou2025; Zong et al. Reference Zong, Xiao and Jie2021). Additionally, Kononikhin et al. (Reference Kononikhin, Brzhozovskiy and Ryabokon2019) found that ACTG1 plays a significant role in pathogenic E. coli infection. Similarly, SLC5A1 has been demonstrated to exhibit a strong negative correlation with C. perfringens in necrotizing enterocolitis of premature pigs (Støy et al. Reference Støy, Mølbak and Delègue2015). Furthermore, SLC5A1 expression levels are significantly reduced in the intestines of mice infected with ETEC (Lin et al. Reference Lin, Fu and Li2021). These results echo findings from both experimental immunology and in vivo infection models, lending biological credibility to our pipeline. Notably, the detection of FTL and ATP1A1 and other interferon-stimulated genes supports a distinct antiviral transcriptional axis, particularly relevant in the context of coronavirus infections such as TGEV. Among these, although direct antiviral research on the FTL gene remains relatively limited, existing studies indicate that its expression levels can be modulated by antiviral drugs and that it influences the viral replication microenvironment by participating in cellular iron homeostasis (Tang et al. Reference Tang, Wang and Sun2023). In addition, the ATP1A1 gene can block the host cell invasion process of coronaviruses by mediating the Src signaling pathway (Burkard et al. Reference Burkard, Verheije and Haagmans2015). Wang et al. (Reference Wang, Yang and Li2025) further suggested an indirect relationship between ATP1A1 and Escherichia coli in their research on the pathogenesis of dampness syndrome. It is evident that this finding further addresses the limitations of previous studies, which often examined viral and bacterial diarrhea in isolation.
One of the major advantages of our framework lies in its resilience to dimensionality reduction. The preservation of classification accuracy with as few as five genes suggests that minimal transcriptomic signatures may suffice for diagnostic purposes – an important consideration for real-world implementation in resource-limited or high-throughput settings. This contrasts with previous approaches that rely on broad or unwieldy gene panels, limiting their translational applicability (Edsj et al. Reference Edsj, Russnes and Lehti2024). Pathway enrichment analysis confirmed systemic activation of mucosal defense mechanisms, including NF-κB and IRF signaling cascades, pattern recognition receptor pathways, and downstream immune responses – findings that are broadly concordant with prior proteomic and histological studies in diarrheic piglets (Ishizuka et al. Reference Ishizuka, Kanmani and Kobayashi2016; Jin et al. Reference Jin, Wu and Li2024b; Liu et al. Reference Liu, Fang and Ke2020; Saeng-Chuto et al. Reference Saeng-Chuto, Madapong and Kaeoket2022). However, our approach moves beyond descriptive biology by linking these pathways to specific, interpretable model outputs, offering a more integrated understanding of host–pathogen dynamics.
Despite the strengths of the proposed IML framework, several limitations of this study should be acknowledged. First, although we integrated multiple publicly available transcriptomic datasets, the sample sizes for certain pathogen categories, particularly PEDV (n = 2) and PDCoV (n = 3), were extremely limited. Such small sample sizes are insufficient to support independent model training or robust statistical inference and therefore constrain the reliability and generalizability of pathogen-specific conclusions for these viruses. We performed a comprehensive re-screening of the GEO database using multiple search strategies but were unable to identify additional PEDV or PDCoV related intestinal transcriptomic datasets that met our inclusion criteria, highlighting a current limitation of publicly available resources rather than dataset selection bias.
Importantly, PEDV and PDCoV samples were not used as primary drivers of model optimization or performance evaluation. Instead, they were included only in downstream, exploratory SHAP-based stratified analyses to provide preliminary insights into potential host gene contribution patterns. As such, findings related to PEDV and PDCoV should be interpreted cautiously and regarded as hypothesis-generating rather than definitive. Future studies with adequately powered cohorts will be essential to validate virus-specific risk genes and to extend the applicability of the proposed framework to these clinically important pathogens. In addition, while SHAP and KAN approaches substantially improve model interpretability, they primarily capture additive or low-order nonlinear effects and may not fully represent complex gene–gene or regulatory network interactions. Furthermore, although batch-effect correction and cross-validation were applied, residual heterogeneity across datasets and experimental conditions cannot be entirely excluded. Finally, the absence of independent experimental validation limits causal interpretation of the identified risk genes. Integrating larger, prospectively collected cohorts and multi-omics data, together with functional validation experiments, will be important directions for future research.
Conclusion
In summary, by integrating conventional ML models, a DNN, and a KAN, we constructed interpretable host-transcriptome classifiers that robustly discriminate multiple diarrheal pathogens. The 20-gene DNN achieved the best balance between discrimination and parsimony, and pathway enrichment confirmed that the selected features map to immune and metabolic pathways relevant to infection. SHAP analyses at the global, case, and pathogen-specific levels, together with the explicit linear gene-to-node functions learned by the KAN, convergently highlighted ACTG1, SLC5A1, and ATP1A1 as recurrent high-impact predictors whose expression exerts large, directionally consistent effects on model output across diverse etiologies. These results indicate that a compact, mechanistically plausible host signature centered on cytoskeletal remodeling (ACTG1), nutrient transport (SLC5A1), and ion/energy homeostasis (ATP1A1) underlies accurate prediction of a broad spectrum of enteric infections, providing both a practical basis for diagnostic development and prioritized targets for future mechanistic studies.
Data availability statement
The gene expression datasets analyzed in this study are available in the GEO repository at https://www.ncbi.nlm.nih.gov/geo/ under accession numbers GSE134130, GSE105797, GSE122764, GSE182240, GSE28003, GSE136705, and GSE41756. All other data supporting the findings are included in the manuscript or supplementary materials.
Acknowledgements
We thank Guoyu Tan and members of the Lun Lun Research Institute for technical support and suggestions that improved the manuscript.
Author contributions
YGL, LYZ, and SQL: investigation, methodology, and writing – original draft. LH and SX: data curation. ERJ: methodology. XY: formal analysis. XZ: conceptualization, writing – review and editing, funding acquisition, and project administration. All authors contributed to the article and approved the submitted version.
Funding statement
This work was supported by the National Natural Science Foundation of China (32372890), the National Key Research and Development Program of China (2022YFD1301500), and the National Ten Thousand Talents Program for Young Top-notch Talents.
Conflict of interest
The authors declare that they have no conflict of interest that could have appeared to influence the work reported in this paper.
Ethical standards
Not applicable.


 Open access