

Introduction
Physician-scientists, trained in the conduct of scientific research as well as clinical practice, play key roles translating bedside observations to the bench, and in moving research findings into clinical practice, thereby contributing importantly to biomedical and translational research [Reference Goldstein and Brown1–Reference Roberts3]. Awards that represent the highest research achievements have gone disproportionately to physician-scientists including: 41% of basic and 65% of clinical Lasker Awards, and 37% of Nobel Prizes in Physiology or Medicine physician-scientist [Reference National Institutes4]. Physician-scientists are also important leaders in scientific organizations, representing almost 70% of NIH Directors and 70% of scientific officers in the top 10 pharmaceutical companies [Reference Wyngaarden5]. This group is a unique and irreplaceable national asset.
NIH data dating back to 1979 show decreasing proportions of MDs among postdoctoral trainees, research fellows, Research Career Development awardees, and first-time recipients of NIH Research Project Grants [Reference Nathan6]. Career Development Awardees are early career scientists who have received funding that allows them protected time to engage in mentored research. Research Project Grants (RPGs) are defined by NIH as awards made to an institution/organization to support discrete, specified, circumscribed projects to be performed by named investigators in areas representing their specific interest and competencies.
Since then, several groups have identified a sustained decline in participation of MDs in NIH-supported research [Reference Rosenberg7–Reference Garrison and Deschamps9]. In 1988, MDs represented over 19.4% of first-time R01s awarded, but by 2011, they represented only 15.9% [Reference Ley and Rosenberg10]. While some have suggested that this trend is worrisome, others suggest that the numbers alone do not accurately portray the broader roles that physician-scientists play in the research enterprise, and therefore overestimate the problem, perhaps because national databases typically do not provide information about researchers working on projects that are not NIH funded [Reference Garrison and Deschamps9, Reference Sutton and Killian11, Reference Feldman12]. These limitations were noted in the NIH Physician-Scientist Workforce Working Group Report (PSWR) [Reference National Institutes4]. It has also been suggested that the traditional definition of “physician-scientist” is too narrow; thus, a portion of the drop-off in physician-scientist numbers may reflect a rise in clinician-scientists who do not hold MDs.
To address some of these issues and aid strategic planning at OHSU, the Oregon Clinical and Translational Research Institute convened key stakeholders to survey the local landscape. Surprisingly, few consensus methods were available to measure and benchmark OHSU with respect to national comparators. In response, we sought to develop clear and objective metrics describing physician-scientist success at our institution. By focusing on local funding, we were able to generate more complete and robust data than others have reported. These data also permit us to compare ourselves to the national workforce, using well-curated and accessible national databases. The goal of the analyses is to contribute to strategic decision-making by portraying the local physician-scientist workforce, comparing it to the national landscape, and making recommendations about mechanisms to address potential opportunities. This has led us to develop a simple quantitative dashboard, which now permits OHSU to craft strategic targets and address successes and opportunities. These approaches are likely to be valuable elsewhere.
Methods
Study Design
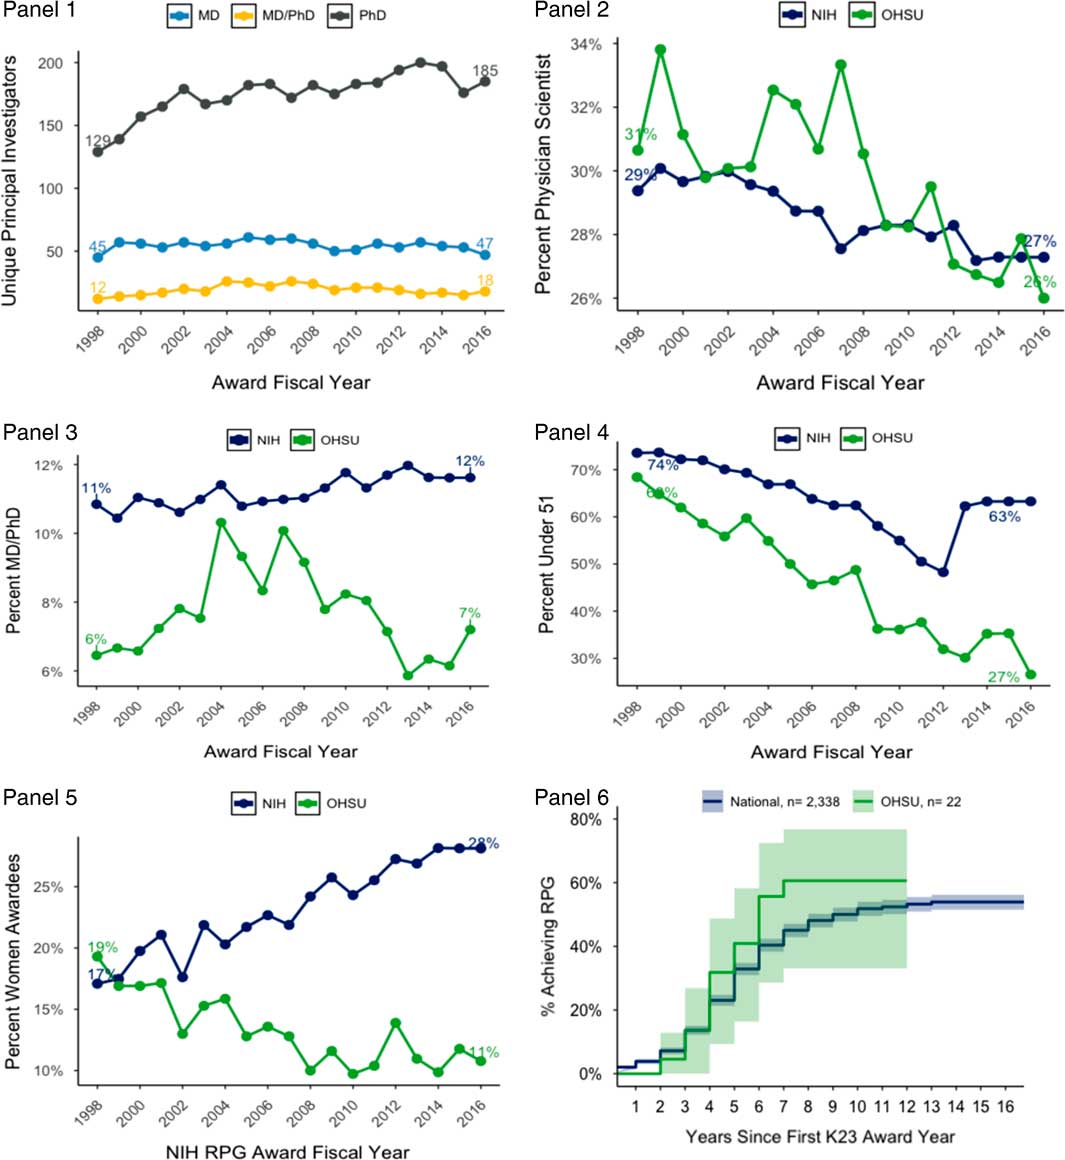
The study design consisted of (1) selecting available and relevant national level data on the physician-scientist workforce, (2) curating local level data to align it with the national indicators, (3) comparing the 2 sets of data to look for differences in trends over time, and (4) supplementing the analyses with additional local data not available at the national level. Key comparisons were tested for statistical significance and plotted on a dashboard, which was then reviewed by an OHSU internal working group focused on physician-scientists. The dashboard (Fig. 5) consists of 6 panels. Each panel charts a key indicator of physician-scientist demographics at OHSU (Table 1).
List of measures
OHSU, Oregon Health & Science University; RPG, Research Project Grant; VA, Veterans Affairs.
Setting
OHSU is a medium-sized academic health center in Portland, OR, USA. According to the OHSU Report of Research, in 2016 OHSU had over 1200 principal investigators and held NIH research funding totaling $234.3 Million.
Definition of Physician-Scientist
The primary focus of our investigation was physician-scientists who receive extramural funding, primarily RPGs. We used the definition of the physician-scientist provided in the PSWR, “scientists with professional degrees who have training in clinical care and who are engaged in independent biomedical research” [Reference National Institutes4]. According to the report, physician-scientists hold a medical degree (MD, MD/PhD, or DO) and are inclusive of those with combination degrees, such as Master of Public Health (MPH) or Master of Science (MS). To align with other analyses, we distinguish physician-scientists with an MD only, or with an MD and a master’s degree, from MD/PhDs For this distinction, we use the indicator “MD-only”. For future analyses, we hope to include non-MD clinicians, such as researchers with DDS/DMD or DVM/MD degrees. We also hope to look separately at nurses with funded research programs.
Data Sources
National data were provided by the NIH and come directly from the NIH Databook, updated through fiscal year 2016. We requested relevant data from the NIH and they provided de-identified, aggregated, data. The Databook provides demographic statistics for RPG-holding scientists by degree, sex, and race/ethnicity. Total investigator counts by degree are not provided, therefore totals were calculated by adding the counts for “male” and “female.” Current figures span the years 1998–2016. NIH Databook data are similar to that found within the NIH Biomedical Research Workforce Dashboard [Reference National Institutes13], with a key difference in that the Databook includes both competing and noncompeting awards, while the Dashboard typically includes only competing awards (although this varies by analysis). Very small group sizes are suppressed within the data provided to us by the NIH. Local OHSU data on RPG-holding investigators were obtained through extraction and analysis of the publicly downloadable NIH ExPORTER Data Catalog. NIH data were used to maintain consistency and reliability across the comparative local and national analyses. These project data were also used to complete the K to R comparative analysis. The NIH Dashboard uses 51 activity codes to define RPGs, with the unit of analysis being an individual rather than an award; these same activity codes were applied to OHSU data. As mentioned, all analyses include both competing and noncompeting awards, as well as both principal and co-principal investigators. American Recovery and Reinvestment Act (ARRA) funding is excluded from both national and local level analyses. Demographic data on OHSU investigators (e.g., degree, sex, date of birth) were obtained from departmental and human resource records. Where this information was incomplete, supplemental information was obtained via internet search. In a few cases, only a current age could be found and an estimation of birth date was used. Human resources data were also used to determine dates of employment at OHSU. The data matching process utilized both manual and automated methods. The NIH utilizes a unique identifier for each investigator. The investigator name, associated institution, department, spending categories, and terms associated with the project were used to manually match investigators with the OHSU human resources data. The human resources data include unique employee identifiers. First, an automatic matching of first and last names was completed, then the matches were validated by manual review of departments and subject areas associated with the investigator. Although initially labor intensive, historical matching has now been completed and yearly updates are less time-consuming. In addition, going forward, new OHSU investigators will have their NIH PI identifier matched to their OHSU employee ID.
For analyses of OHSU investigators holding funding other than RPGs, we relied on institutional data from the OHSU Office of Proposal Management, which provides fiscal and administrative stewardship of all externally sponsored projects. We also received data from the Veterans Affairs Portland Health Care System (VAPORHCS) for research funded by the Department of Veterans Affairs (VA). Institutional data were used for these analyses, as direct comparisons were not made with national data. To link investigators across local datasets, we used a matching process similar to that described above. An automated matching of names occurred across sponsored projects and human resources data, followed by manual data cleaning and checks against departmental data and institutional termination records data.
Time Periods
The periods identified for analysis straddle the NIH budget-doubling period, which occurred from 1999 to 2003. As mentioned, the NIH Biomedical Research Workforce Dashboard data cover the fiscal years 1998–2016. OHSU institutional data also cover the fiscal years 1998–2016, with 1998 being the first year where continuous, comprehensive electronic data were available. OHSU (July to June) and NIH (October to September) fiscal years do not directly align; for comparative analyses the NIH fiscal year was applied to both datasets.
Statistical Analysis
All statistical tests were conducted using either the publicly available R or Graphpad Prism. To evaluate trends in counts of RPGs over time, we used Pearson’s linear correlation statistics along with a linear regression model where the number of RPG-holders by degree category is linearly associated to time trends (Figs 1a, b ). To test differences between slopes, we used analysis of covariance. To test group differences, we used Fisher’s exact test (Figs 2a, b ). A p-value of 0.05 was used to assess statistical significance. To estimate differences in time from K award to RPG award, we utilized the Kaplan-Meier method, and the survfit R package.
Number of RPG awardees holding PhD-only versus MD. (a) National data. (b) OHSU data (NIH ExPorter combined with demographic variables from OHSU Office of Grants Administration). The number of PhD RPG awardees increased during this period nationally and locally. *p<0.05. OHSU, Oregon Health & Science University; RPG, Research Project Grant.

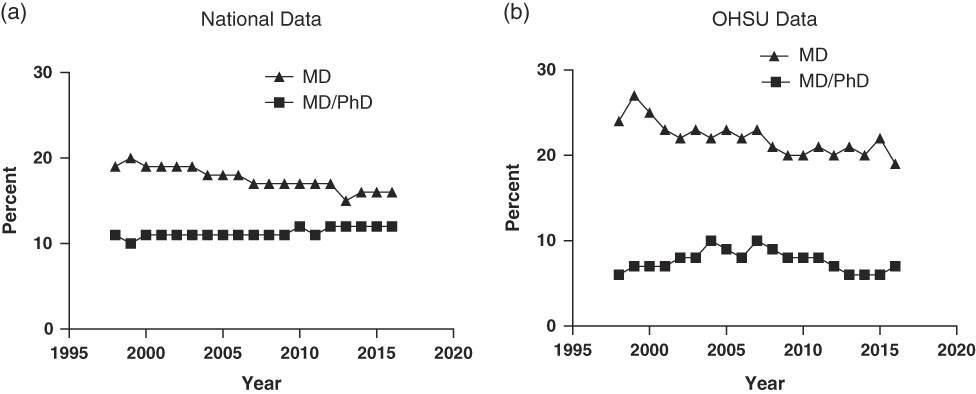
Percentage of RPG awardees who are PhD, MD and MD/PhD (a) National data. (b) OHSU data. Data obtained as in Fig. 1. OHSU, Oregon Health & Science University; RPG, Research Project Grant.
There are analysis limitations. For some analyses, within-group counts are small. For the age group analyses, NIH data were not available for very early career investigators (under 30) due to small group sizes. Emphasis should be on the graphical summaries presented in the figures and the dashboard.
Results
Physician-Scientists at OHSU and Nationally
We chose to compare the number of PhD investigators with the number of physician-scientist investigators, over time and across both national and local datasets. The number of PhD investigators holding RPG grants nationally between 1998 and 2016 increased from 14,663 to 23,125 (58% increase), with a strong linear association between the count of PhD-RPG investigators and time (r 2=0.72, p<0.001) (Fig. 1a ). During the same period, the number of physician-scientists (MD-MD/PhD) holding RPG grants also increased (r 2=0.32, p=0.012). The 2 slopes are significantly different (F=32.73, p<0.0001), however, indicating less growth for physician-scientists. At OHSU, during this same period, the number of PhD investigators holding RPG grants also increased from 129 to 185, again showing a strong linear association (43% increase, r 2=0.64, p<0.001), Fig. 1b ), while the number of RPG-holding physician-scientists did not change significantly (r 2<0.01, p=0.9823). These 2 slopes are also significantly different (F=20.93, p<0.0001). Although the overall trend is flat, the graphical summary in Fig. 1b shows that the number of physician-scientists holding RPG grants peaked in 2007 and has decreased since then.
One dramatic difference between local and national profiles involves comparing MD-only to MD/PhD RPG holders. Nationally, since 1998, RPGs to MDs have declined, while grants to MD/PhDs have remained steady (Fig. 2a ); this means that, in 2016, 75% of RPGs to physician-scientists were held by MD/PhDs In contrast, the percentage of RPGs held by MD/PhDs at OHSU has remained low, comprising only 37% of RPGs over the same period (Fig. 2b ).
Physician-Scientist Age
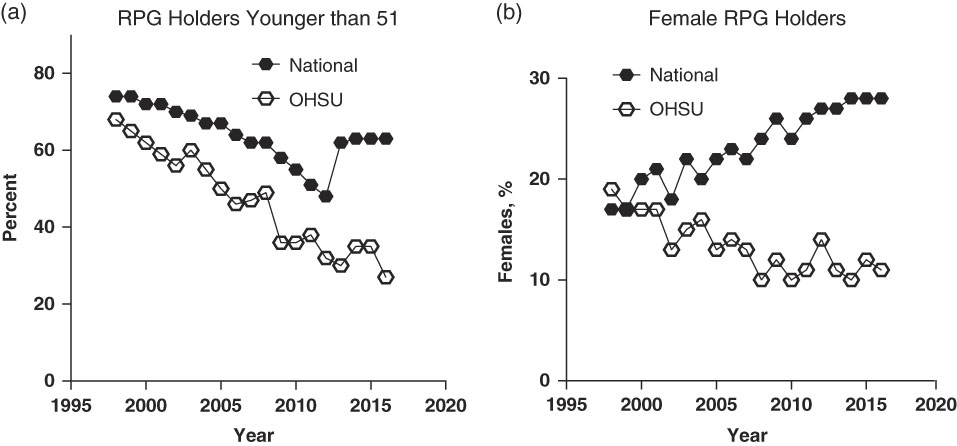
Another often-cited concern is the increasing average age of RPG recipients, often reflected as age at first R01. As we could not ascertain this metric locally, we examined the percentage of physician-scientist RPG holders whose age was less than 51; this approach also aligns with the new NIH Biomedical Research Workforce Dashboard, which categorizes RPG holders by age. Although the NIH uses 6 categories (30 or less, 31–40, 41–50, 51–60, 61–70 and 70+, we elected to aggregate the first 3 and the last 3. These 2 categories, 50 and younger and 51 and older, are a better fit for the small group sizes in the local OHSU data. The percentage of RPG holders younger than 51 has declined substantially between 1998 and 2016. However, nationally the percentage of younger investigators has recently begun to rise, while at OHSU the downward trend is continuing (Fig. 3a and [Reference Charette14]).
Percentage of RPG-holding physician-scientists less than 51 years old (a) and percentage of RPG-holding physician-scientists who are women (b). Data obtained as in Fig. 1. OHSU, Oregon Health & Science University; RPG, Research Project Grant.
We also investigated the average age of physician-scientist PIs without RPGs (PIs on other types of NIH or non-NIH grants), reasoning that younger physician-scientists who had trouble obtaining, or were dissuaded from applying for, RPGs might nevertheless obtain funding of other types. These data were only available at the local level, and only through 2012. Non-RPG PIs are considerably younger. In 2012, 69% were under the age of 51, with no decline since 1998 (68%).
Female RPG Recipients at OHSU
Hypothesizing that women are likely to be less represented, we examined the percent of female RPG holding physician-scientists. Nationally, the percent of RPG holding physician-scientists who are female has increased from 1998 to 2016, from 17% to 28% (Fig. 3b ). At OHSU however, these percentages have declined, moving from 19% to 11% over the same period.
Diverse Funding for Physician-Scientists
One critique for using RPGs as the metric for research funding is that it ignores funding from sources other than NIH [Reference Garrison and Deschamps9]. Here, our ability to ascertain funding from other sources at the local level allows us to gain a more comprehensive funding picture. A subset of available OHSU proposal and awards management data, from 2007 to 2013, were used for this analysis. All dollar amounts are represented as 2013 real dollars using the Biomedical Research and Development Price Index. In 2013, only 33.1% (n=238) of all OHSU principal investigators were RPG-holding PIs, with the remainder holding non-RPG funding. During a time when inflation-adjusted RPG-level funding decreased 13.1% ($150 M in 2007 to $130 M in 2013), inflation-adjusted funds to OHSU from non-RPG sources (industry, non-RPG NIH, non-NIH federal, and private) remained relatively stable ($211 M in 2007 and $210 M in 2013).
These non-RPG sources of funding provide critical support to both physician-scientists and PhDs at OHSU. From 2007 to 2013, non-RPG funds supported an average of 578 research projects per year for physician-scientists and 582 projects for PhD principal investigators. Total yearly non-RPG funding for physician-scientists has decreased slightly, from $112 M in 2007 to $99 M in 2013, whereas, PhD, non-RPG funding has increased slightly from $90 M in 2007 to $101 M in 2013.
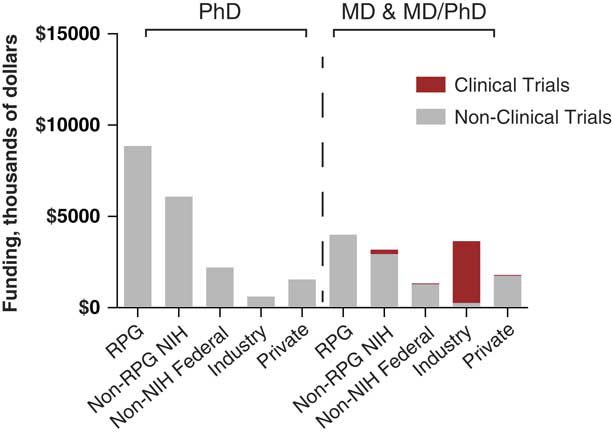
Figure 4 illustrates the distribution of RPG and non-RPG award dollars to physician-scientists and PhD-only PIs. It shows that, although both physician-scientists and PhD. PIs hold substantial funding, the distribution of sources differs. Physician-scientists hold significantly more funding from industry and private sources (typically philanthropy), while PhDs hold more federal funding. Physician-scientists are the principal investigators for the vast majority of clinical trials at OHSU.
Distribution of RPG and non-RPG Award Dollars at OHSU to physician-scientists and PhD. PIs: fiscal year 2013. Data are from OHSU Office of Grants Administration. All dollar amounts are represented as 2013 real dollars using the Biomedical Research and Development Price Index. Clinical trials, shown in red, were defined using the NIH definition employed prior to 2017. RPG, Research Project Grant.
Another key component of support for physician-scientists that is often overlooked in national analyses is the VA [Reference Zucker15]. While the direct dollar commitment from the VA is smaller than from the NIH, VA funding is skewed towards physician-scientists. In 2014, 35.1% (n=13) of VA Merit Review recipients at VAPORHCS were MDs or MD/PhDs. Out of $33.8 M in total funding administered by the local VA, 42.9% was awarded to physician-scientists. It should also be noted here that, owing to a different funding model, the reported funding amounts substantially underestimate the impact of these funds. In contrast to NIH, where physician-scientist salary is a direct cost on RPGs, salary is not included as a direct cost for VA funded physician-scientists, who derive their salary support through a different model; thus, the effective contribution of VA dollars to physician-scientist research is even higher than it appears.
Time Spent on Research
Another component of the research landscape that has proved difficult to capture at the national level is the amount of time physician-scientists spend in their research roles. Capturing full-time equivalent breakdowns for non-NIH funded researchers is particularly problematic. As an approximation, we chose to investigate the proportion of an OHSU scientist’s institutional base salary that was designated as research salary. This measure provides only an estimate of research time across large groups of physician-scientists and PhD researchers and is only available for 2013. We designated 20% as the threshold for significant participation in research, based on the consensus of our OHSU Physician-scientist Task Force. In 2013, 21% of all faculty holding an MD-only degree, 50% of MD/PhD faculty, and 88% of PhD, faculty had 20% or more of their salary designated as research salary. Across all MDs with any research salary, the average percentage of base salary linked to research activity was 35%; for MD PIs with NIH funding, the percentage of base salary linked to research activity was 64%, suggesting that extramural funding supports a substantial percentage of their effort.
Career Development
Increasing the number of physician-scientists requires either adding more physician-scientists to the faculty, and/or having fewer leave the physician-scientist workforce. Developing new successful physician-scientists from within an institution is likely to be a key component of a successful strategy. The NIH created the K08 and K23 awards specifically to support the development of research skills among clinically trained postdoctoral trainees. Many commentators have tracked the number of K applications and award levels as indicators of the early career physician-scientist pipeline [Reference Nathan6, Reference Garrison and Deschamps9–Reference Sutton and Killian11, Reference Chao, Schiffman and Gedde16]. Others have investigated the rates at which early career development grant awardees have gone on to attain a major NIH research grant such as an R01-equivalent [Reference Levitt17–Reference Neilson19]. Thus, we compared the success of OHSU K08 and K23 awardees to the national rates with respect to achieving RPG funding (type 1 and type 2 for this analysis). Within 7 years (median) of the K award, nationally, 54% (n=2738) of those who received K08 awards between 1988 and 2010 have received RPG funding. At OHSU, during the same period, 61% (n=20) of recipients have (p=0.49). For K23s over the same time period, the rate is 62% (n=1445) nationally and 68% (n=15) at OHSU (p=0.20) (Fig. 5, panel 6).
Physician-scientist dashboard for OHSU. Panel 1: counts of RPG-funded investigators at OHSU; Panel 2: percentages of physician-scientists locally and nationally, compared with national data; Panel 3: percentages of RPG-holding MD/PhDs locally and nationally; Panel 4: the average age of RPG-holding physician-scientists, locally and nationally; Panel 5: the percent of RPG-holding investigators who are women, locally and nationally; and Panel 6: a survival-curve showing the trend of achieving RPG status for K23 awardees, locally and nationally. Further details about these data are included in the text. OHSU, Oregon Health & Science University; RPG, Research Project Grant.
Conclusions and Dashboard Development
The PSWR recommended developing a Biomedical Workforce Dashboard (Recommendation 4) to provide real-time tracking information to help address the crisis in physician-scientist numbers. This recommendation has very recently been accomplished (https://report.nih.gov/bmwdashboard/app/#!/), providing up-to-date information about the research workforce nationally. Yet, this provides little guidance for individual institutions in their attempts to sustain and increase the physician-scientist workforce. Thus, we developed a dashboard to guide institutional assessment and planning, an approach that can easily be adopted elsewhere. In developing our proposed institutional dashboard (Fig. 5), we sought metrics that were generally accessible, were clearly relevant, could be compared with national data, collected and adjudicated in the same way, and that provided actionable information. We also, in consultation with institutional leadership, selected target values to define success for each metric.
Our dashboard (Fig. 5) derives directly from our results. Panels 1 and 2 track the number and percentage of institutional principal investigators who are physician-scientists. Using national comparator data and semistructured polling of OHSU institutional leadership and department chairs, we set a goal that 30% of RPG-holding scientists at OHSU will be physician-scientist, within 5 years. A notable difference between OHSU and the national sample is in the percentage of RPG holders who are MD/PhDs (Panel 3). At OHSU, in 2012, only 7% of RPG-recipients held MD/PhDs, whereas nationally, this the figure was 15%. The reasons for this difference are not clear, and the implications are complex. Nevertheless, there are reasons to advocate increasing their numbers. In 2012, MD/PhD graduates from Medical Scientist Training Programs (MSTP) were much more likely to receive RPG funding (36% of first-time applicants) than MDs (15%), PhDs (12.5%) or MD/PhDs trained in non-MSTP (12%). While these data are merely correlative, they suggest that OHSU should recruit MSTP graduates for faculty positions.
Another area of opportunity for OHSU, as nationally, is to reduce the average age of its RPG-funded physician-scientist workforce. Two possible contributors to the ongoing increase in age are, (1) the pool of investigators in academic research is aging generally (individuals are maintaining funding longer) or (2) the difficulty in achieving first RPG funding makes entry into the pool harder. While novel grant funding mechanisms may help, we here target actions that can be developed locally and will reduce the average age at OHSU by nearly 1 year over the next 5 years (Panel 4). The OHSU medical school has admission policies that enroll students who are on average older than students admitted to other schools, which may select for individuals less likely to commit to a long-term research career [Reference Neilson19]. We have recently implemented a physician-scientist track within the MD program, and plan to closely examine the data on our incoming medical school applicants, matriculating cohorts, and the subset of those who self-select into the physician-scientist track to determine age ranges. We will then identify opportunities to recruit scientifically focused individuals directly from undergraduate programs, as they will require prolonged immersive training to achieve professional success [Reference Neilson19].
A fifth target is to reduce gender disparity at OHSU so that at least 25% of RPG holding physician-scientists are women by 2020 (Panel 5). The percentage of women physician-scientist RPG recipients has increased nationally, relative to men, since the 1990s. Unfortunately, at OHSU, the disparity is more pronounced and there is no evidence for closing the gender gap. Even though there can be other measures of academic achievement, an RPG is a significant indicator of investigator professional success, as full professorship is associated with NIH funding and clinical trial leadership [Reference Jena20]. Addressing this goal at OHSU will require purposeful recruitment efforts; 1 approach would be to recruit female graduates of MSTP programs.
Locally, a bright spot is the K to RPG transition rate for K23 awardees (Panel 6), which compares favorably with national data. Our target is to continue to meet or exceed national K to R success rates. One reason for our success is our strong mentorship program, provided through our CTSA-sponsored institute (OCTRI Scholars). Of special note, we endorse recommendation #9 from the PSWR, suggesting that Clinical and Translational Science Award (CTSA) Institutes play pivotal roles in monitoring and enhancing the success of the physician-scientist workforce [Reference National Institutes4].
At OHSU, the vice provost of academic career development and mentoring convened stakeholders to address deficits identified in this paper. Although reversing current trends will not be easy, our analyses suggest that the average age of RPG level physician-scientists at OHSU would decrease, were OHSU were to match the national-level proportions of women and MD/PhD physician-scientists. Thus, several perceived deficiencies might be addressed with adjustment of 1 or 2 policies. While the specific opportunities and strengths may be different at other institutions, our proposed dashboard, which couples publicly curated, freely accessible databases, with readily available institutional resources, should help institutions to set and achieve their own goals.
Acknowledgments
We are grateful to the Division of Biomedical Research Workforce, Office of Extramural Research, Office of the Director, National Institutes of Health for providing information from their research workforce databook and providing advice on methodology. The National Center for Advancing Translational Sciences of the National Institutes of Health under award number UL1TR002369.
Disclosures
The authors have no conflicts of interest to declare.


 Open access