Information on multiple deliveries has been scarce for most Southern European countries (Parazzini et al., Reference Parazzini, Tozzi, Mezzanotte, Bocciolone, La Vecchia, Fedele and Benzi1991). This applies particularly to the Iberian Peninsula (Spain plus Portugal), until the publication of Fuster et al. (Reference Fuster, Zuluaga, Román-Busto and Colantonio2010), a study dealing with the temporal and territorial variation of multiple deliveries in Spain.
With regard to Portugal, Bulmer (Reference Bulmer1960) reported for the years 1955–1956 twinning rates of 10.1 for standardized maternal ages. This figure was considered low in comparison with other European countries, but higher than the value of 5.1 indicated by the same author for Spain (1951–1953). Other studies on Portugal refer to genetic or clinical questions affecting twins (Maia et al., Reference Maia, Santos, Freitas and Thomis2013; Matias et al., Reference Matias, Montenegro and Areias2000, Reference Matias, Montenegro and Areias2001; Munar-Qués et al., Reference Munar-Qués, Pedrosa, Coelho, Gusmão, Seruca, Amorim and Sequeiros1999; Pinheiro et al., Reference Pinheiro, Nona, Cohen, Nascimento and Valido2009), an approach far from the interest of the present research.
Studies that focused on European countries revealed a reduction of twinning (Hajn, Reference Hajn1997), which was especially evident in Western Europe throughout the 1960s and the 1970s (James, Reference James1982). Continental regional differences in multiple delivery rates are mainly attributable to dizygotic twins (James, Reference James1986). Moreover, a geographic gradient was found, consisting of maximum rates for the Northern countries and minimum for the Southern Latin ones (Astolfi et al., Reference Astolfi, Ullizzi and Zonta2003; Eriksson et al., Reference Eriksson, Abbot, Kostense and Fellman1995; Fellman & Eriksson, Reference Fellman and Eriksson2009b).
A set of factors has been analyzed as possibly influencing temporal and geographic variation in twinning rates. As examples of these factors, maternal age and birth order may be indicated (Fellman & Eriksson, Reference Fellman and Eriksson1987). However, according to Eriksson et al. (Reference Eriksson, Abbot, Kostense and Fellman1995), Eriksson and Fellman (Reference Eriksson and Fellman2004), and Fellman and Eriksson (Reference Fellman and Eriksson2003), such variability cannot be explained satisfactorily. Other demographic variables, including increasing population movements and urbanization processes, should be taken into account (Eriksson & Fellman, Reference Eriksson and Fellman2004; Fellman & Eriksson, Reference Fellman and Eriksson1990).
With the arrival of assisted reproductive treatments in the 1980s, the frequency of multiple deliveries reversed the previous declining tendency (Eriksson & Fellman, Reference Eriksson and Fellman2004), with patterns differing among countries (Imaizumi, Reference Imaizumi2003; Pison & d'Addato, Reference Pison and D’Addato2006).
The objective of the present paper is to study for the first time the pattern of double and triple deliveries in Portugal throughout time and its spatial variation among its 20 administrative districts. Moreover, demographic factors explicative of such variation are considered. The results are compared and interpreted within an Iberian Peninsula context, based on the findings published for Spain.
Material and Methods
The information analyzed comes from the Portuguese Institute of Statistics (INE), consisting of 13,915,101 deliveries occurring throughout the period 1930–2011. Between 1930–1989 and 2003–2010, data were aggregated yearly. Since 1988, information has also been available from individual registers of births filed annually (micro-data). Because these data files assigned one case to each birth corresponding to a multiple delivery (two cases for twins, three for triplets, and four for quadruplets), only one case per delivery was analyzed. The present study considered the temporal variation for the whole country. Data were then segregated by the 20 districts of Portugal (territorial variation). Because from 1990 to 2002, the geographic units were modified (Nuts II) to include several districts, cases were regrouped into the original districts according to the municipality code of mother's residence (1990–2011). This criterion is consistent with that applied by the Portuguese INE for the aggregated data (see Almeida Remoaldo, Reference Remoaldo1999). For 1988 to 2010, both sources of data (micro-data and aggregated) were compared: small differences in the annual absolute number of double and triple deliveries were observed, ranging between -26 and -7, and -5 and +1, respectively; but the variation in the corresponding rates of twins and triplets (× 1,000 deliveries) was negligible (R: 0.993, p < .001 for twins; R: 0.873, p < .001 for triplets). In order to compare the Portuguese and the Spanish patterns of multiple deliveries, data published in Fuster et al. (Reference Fuster, Zuluaga, Román-Busto and Colantonio2010) were used. To include the year 2011, additional information was provided by the Spanish National Institute of Statistics.
To study temporal and territorial changes in the triple and double delivery rates, Fellman and Eriksson (Reference Fellman and Eriksson2009a) report that statistical analysis based on Hellin's law was used. According to these authors, the Hellin ratio (HR) is a measure of the agreement with Hellin's law, with HR = triplet rate/(double rate)2. Values greater than 1 represent an excess of triplets, while HR <1, indicates a deficit of triplets.
Results
Variation Throughout Time
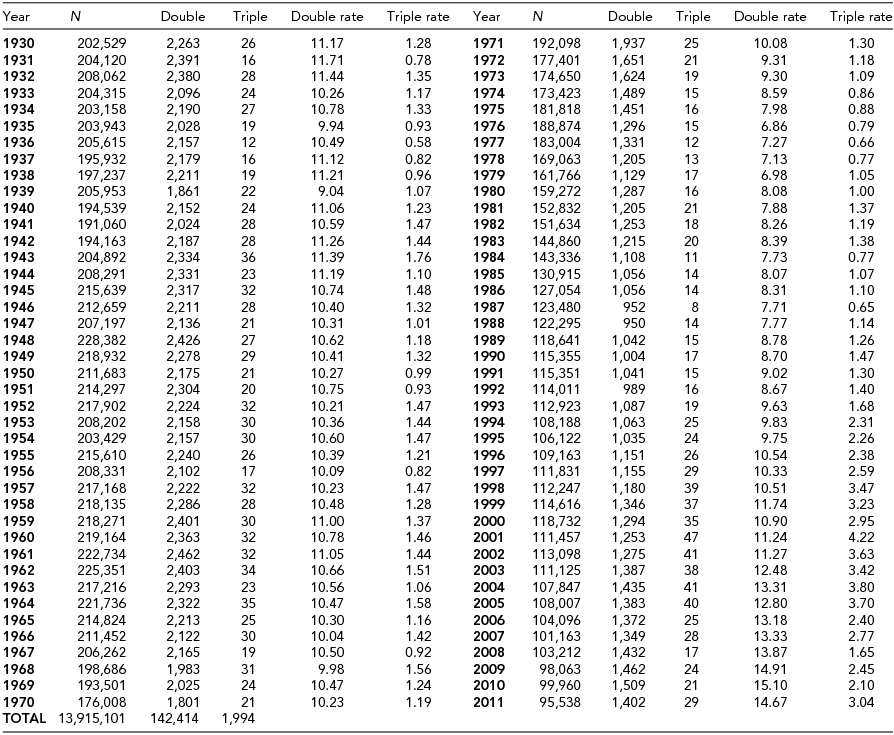
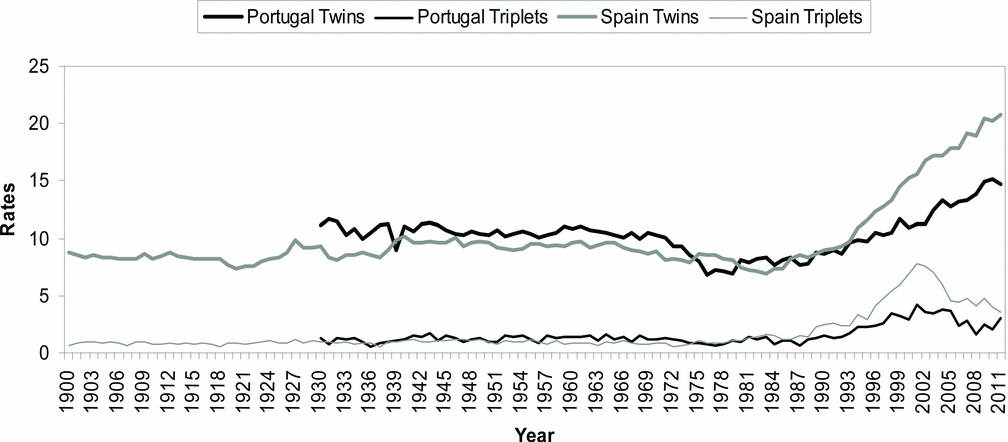
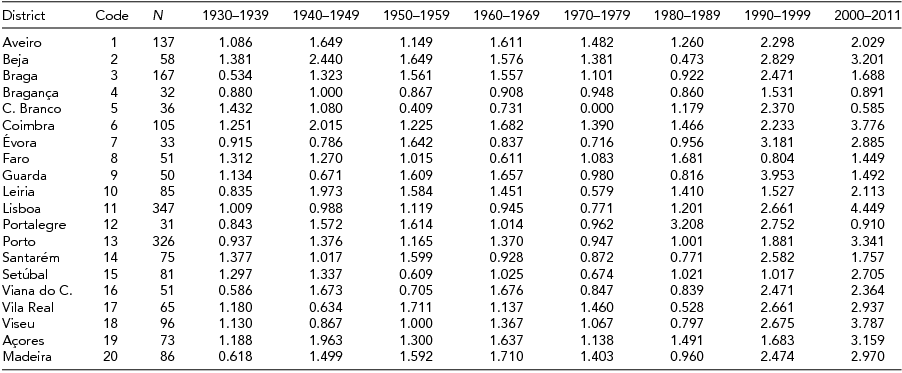
Table 1 shows the yearly absolute frequencies of twinning and triple deliveries occurring in Portugal for the period 1930–2011 and their totals, as well as the corresponding number of deliveries (13,915,101). The rates for twins and triplets appearing in this table are displayed in Figure 1, where values for Spain are also represented for comparison. In Portugal, the observed yearly frequencies for twins had slight variation up to the 1970s. Since then, a rapid reduction is observed, followed by a recovery from 1990, reaching a maximum in 2010. For triplets, the highest rates occurred between 1999 and 2002. The Portuguese temporal pattern is close to the Spanish, although rates in Spain have always been slightly lower than the Portuguese, with the exception of the minimum level for twins at the end of the 1970s, which occurred earlier in Portugal than in Spain. The increase of rates occurring in the 1980s and the 1990s was more rapid in Spain than in Portugal for both types of multiple deliveries. For triplets, the decrease in the 2000s was initially more intense in Spain than in Portugal, but Spanish rates both for twins and triplets continued to be more elevated than the Portuguese.
Yearly Frequency of Double, Triple, and Total Deliveries (N)

Twins and triplet rates calculated per 1,000 and 10,000 deliveries, respectively. Since 1990, values come from micro-data files (individual inscriptions).
Yearly twinning (× 1,000) and triplets’ (× 10,000) rates: Portugal versus Spain. Since 1990, Portuguese values come from micro-data files (individual inscriptions).
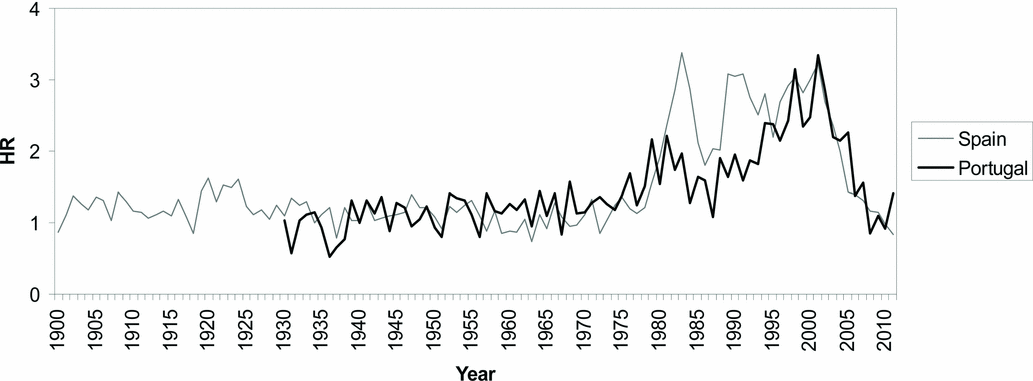
Figure 2 shows the ratio (HR) between the rate for triplets and the square of the rate for twins, both with respect to total deliveries. The values of HR in Figure 2 illustrate how the proportion of triple to double deliveries varied differently in Portugal and Spain in the period where reproductive treatments began to be extensively applied, with triplets increasing in Spain considerably more than twins. In Portugal, HR nearly reached a value of 3, with a certain delay respecting Spain. Finally, since 2006, HR has practically returned to 1, the level existing before 1970.
Yearly Hellin ratio (HR) in Portugal and Spain. Since 1990, Portuguese values come from micro-data files (individual inscriptions).
Demographic Factors Related to Multiple Deliveries in Portugal
Throughout the period 1988–2011, the rate of multiple deliveries (double, triple, and quadruplet) was related to a set of variables recorded at the Portuguese INE live births database. During these years, the mean maternal age at delivery increased from 26.35 to 30.35 years (115%), while mean parity reduced by 88% (1.86 to 1.63). The percentage of unmarried mothers increased from 13.7% to 42.9%, but only 10.9% of the latter reported not being in cohabitation in 2011. Children born from non-native Portuguese increased from 2.3% in 1995 to 10.4% in 2011.
These variables were related to the incidence of multiple deliveries, categorized as follows: mother's age at delivery (younger than 30 years vs. 30 and older), parity or number of children born including the delivery studied (1 and 2 or more), type of mating (1988–2011: married or unmarried; 1995–2011: in a couple or not in a couple). The mother's country of origin was not included in the analysis because this item has only been available since 1995 (N = 112,431 cases).
Significant differences (p < .001) between simple and multiple deliveries were obtained for the mother's age, type of mating, and parity. The corresponding Pearson χ2 (df = 1) decreased as follows: maternal age (1,590.175), mating (61.019); since 1995, marriages (128.373), cohabitation (88.687), and parity (27.232).
Significant differences (p < .001) persisted for the maternal age regardless of the year when the delivery occurred. For the type of mating, these differences were consistently found since the year 2002 (either for married or cohabitating couples) and for parity since 2003.
To find a possible association among the above variables, a logistic regression analysis was applied using the presence–absence of a multiple delivery as the dependent categorical variable and the remaining indicators as co-variables (Table 2). Several trials were performed considering maternal age either as continuous or categorical (two or five categories) as well as the year of delivery (continuous; ordinal). Although no accurate prediction for multiple births was obtained, the values of the odds ratios (ORs) were consistent with those expected. The odds indicate that delayed maternity, a delivery in recent years, lack of previous reproduction, and marriage are conditions favoring multiple deliveries.
Forward Stepwise Parameters of Logistic Regression
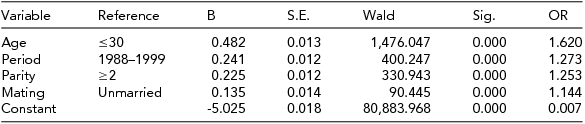
OR = odds ratios.
Territorial Patterns
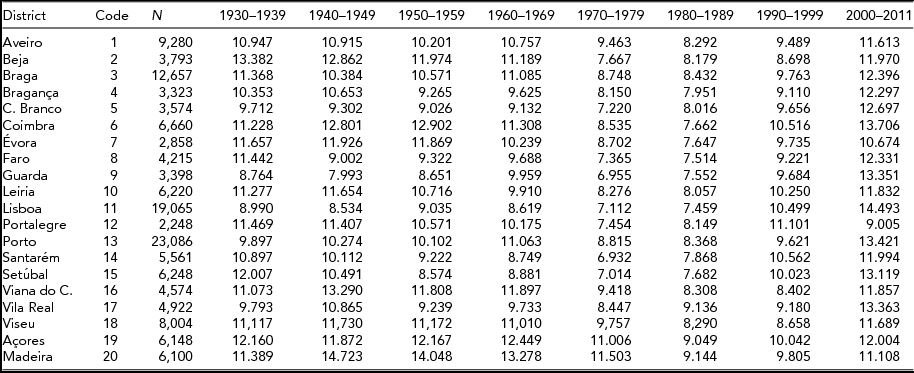
The multiple birth pattern observed among the 20 Portuguese administrative districts (see Figure 3) was rather stable throughout time for twins, with minimum rates corresponding to 1970–1989 when total rates in Portugal were low (Table 3). For most districts, maximum values occurred in the last period (2000–2011), exceptions being Evora (code 7) and Portalegre (code 12). For triplets, however, (Table 4) the greatest variation occurred since 1990. For triplets, Braganza (code 4), Castelo Branco (5), and Portalegre (12) do not exhibit the generalized increase appreciable in the other districts in 2000–2011.
Total Number (N) of Twins and Twinning Rate (×1,000 deliveries) by District and Period
Since 1990, values come from micro-data files (individual inscriptions).
Total Number of Triplets (N) and Triplet Rate (×10,000 deliveries) by District and Period
Since 1990, values come from micro-data files (individual inscriptions).
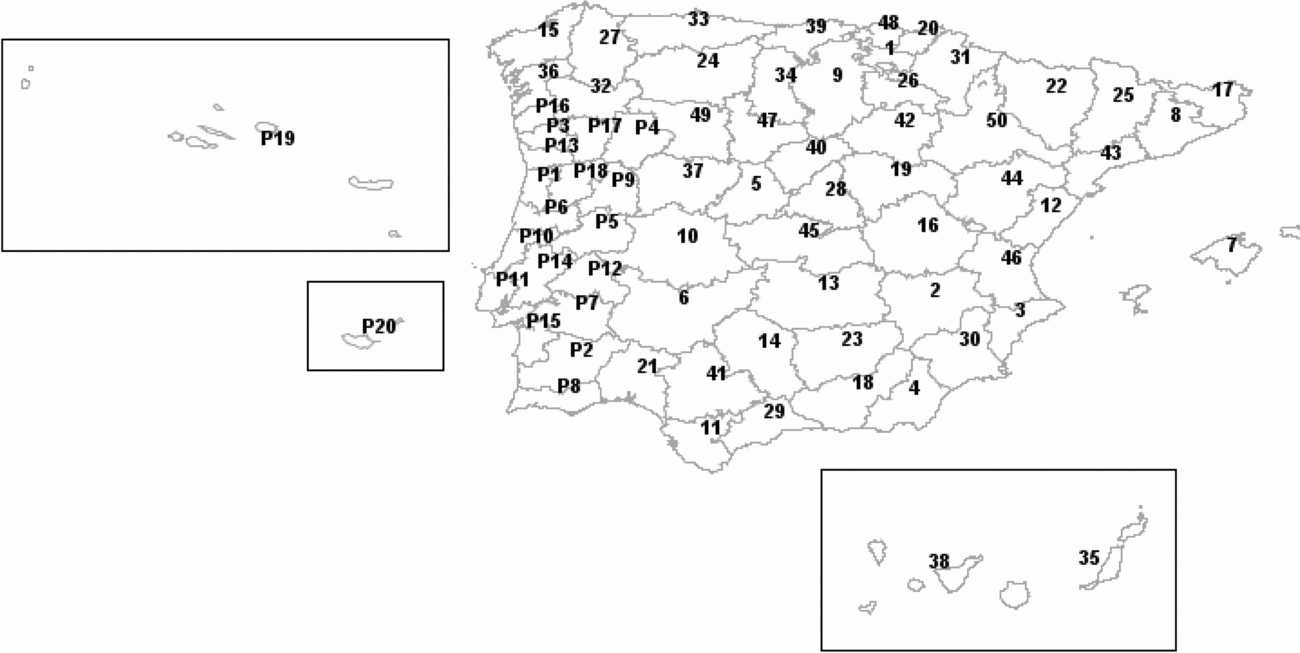
Map showing the administrative districts of Portugal (P) and Spanish provinces. Portuguese district codes are the same as in Table 3. The codes for the Spanish provinces, which are mentioned, appear in the text. For a complete list of codes, see Fuster et al. (Reference Fuster, Zuluaga, Román-Busto and Colantonio2010), Table 2.
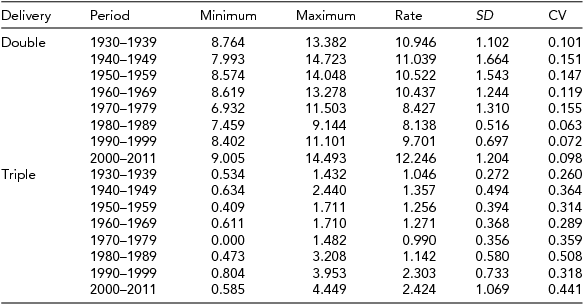
With regard to the inter-district comparison, Table 5 summarizes the pattern of differentiation by districts, showing the interval of values and the coefficient of variation for double and triple delivery rates. For twins, rates were most homogeneous between 1980 and 1999. For triplets, they were least similar among districts in the periods 1980–1989 and 2000–2011.
Rate Intervals for Twins (×1,000) and Triplets (×10,000), Standard Deviation (SD), and Coefficient of Variation (SD/mean) by District and Period
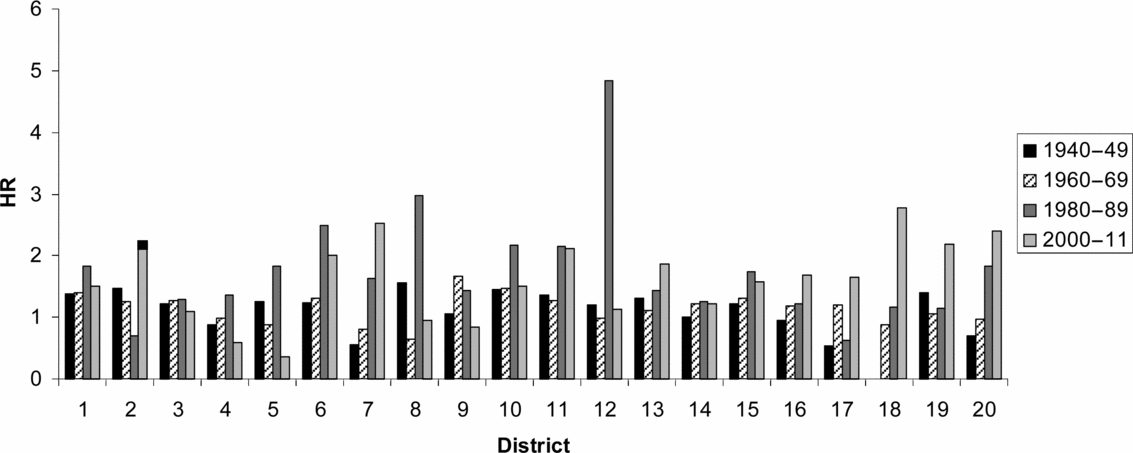
The HRs are shown by district in Figure 4. Elevated values in the last period (2000–2011) were found in Évora (district 7), Vila Real (17), Viseu (18), Madeira (20), Açores (19), Beja (2), and Coimbra (6). In the period 1980–1990, HR was far from Hellin's expectations in Portalegre (12).
Yearly Hellin ratio (HR) by district and decade. 1: Aveiro; 2: Beja; 3: Braga; 4: Bragança; 5: Castelo Branco; 6: Coimbra; 7: Évora; 8: Faro; 9: Guarda; 10: Leiria; 11: Lisboa; 12: Portalegre; 13: Porto; 14: Santarém; 15: Setúbal; 16: Viana do Castelo; 17: Vila Real; 18: Viseu; 19: Açores; 20: Madeira.
Multiple Deliveries of the Iberian Peninsula
In order to define a common territorial pattern for multiple deliveries of the Iberian Peninsula, the rates for twins and triplets in Portugal and Spain are compared for the decades between 1940 and 2011. For Spain, the years 1981–1982 were not considered because the values provided for multiple deliveries are erroneous for some provinces (see Fuster et al., Reference Fuster, Zuluaga, Colantonio and De Blas2008). For Spain, deliveries were assigned to provinces according to the mother's residence, as was done for Portugal. In Figures 5 and 6, only two periods representative of the years prior to and after the fertility treatments and the second demographic transition (Van de Kaa, Reference Van de Kaa1987) are shown.
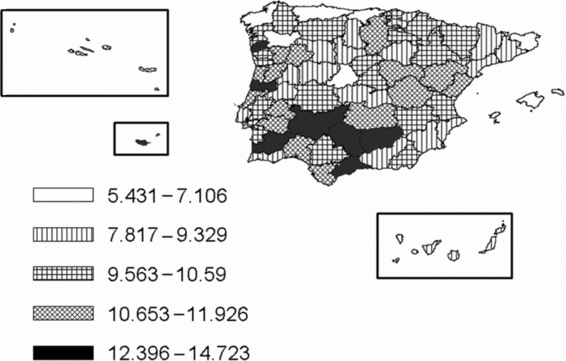
Twinning rates in Portuguese districts and Spanish provinces: 1940–1949. The names of the districts and provinces are shown in Figure 3.
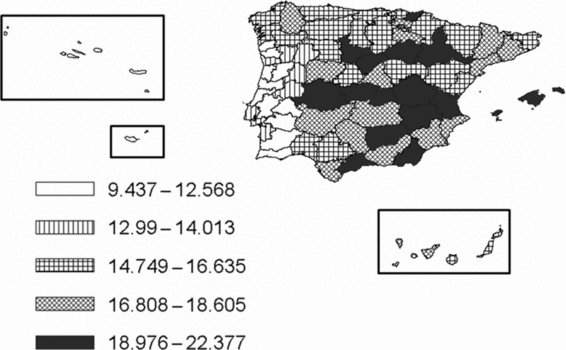
Twinning rates in Portuguese districts and Spanish provinces: 2000–2011. The names of the districts and provinces are shown in Figure 3.
From 1940 to 1969, the rates of multiple deliveries show a north–south pattern of increase in Portuguese and Spanish administrative units that are geographically close. Figure 5 shows that for 1940–1949, the Spanish provinces located in the south east — Cáceres (code10), Huelva (21), and Badajoz (6) — display the same high rates as observed in the Portuguese districts of Beja, Évora, Santarem, Setubal, and Portalegre.
Intermediate rates are found in the Portuguese districts close to the border: Castelo Branco, and Guarda reveal values that correspond to the Spanish provinces of Murcia (30) and Alicante (3), and northeast and most of northern Spanish plateau, Salamanca (37), Palencia (34), Zamora (49), and Valladolid (47). The lowest rates appear in the northern Atlantic provinces of Spain: Guipúzcoa (20), Cantabria (39), Asturias (33), Orense (32), and Coruña (15). Exceptions for the common Portuguese–Spanish gradient are: Burgos (9), Coimbra, and Viana do Castelo. Regarding the islands, no common pattern is observed among the Spanish archipelagos (Balears and Canary Islands: codes 7, 35 and 38) and the Portuguese (Açores and Madeira), but a pattern is evident between the two latter islands, where values have always been very high.
In the most recent years (2000–2011), the Spanish rates tend to be more elevated than the Portuguese. Although some districts and provinces maintain the proportionality of the rates of the previous periods, a territorial pattern is not evident. In this period, a great reduction of rates is noticeable in the archipelagos of Açores and Madeira (Portugal).
The differences in the absolute value of distances in latitude among the capital of each Portuguese district and Spanish province were correlated by means of the Mantel test with the distances of the corresponding rates of multiple deliveries. In the period 1940–1949, the twinning rates had a significant correlation, thus confirming the existence of a north–south cline (R: 0.120; p = .011) as displayed in Figure 5. For the remaining periods, correlations were not significant.
With regard to triplets, no clear geographic patterns can be indicated. However, a similar proportionality among rates for twins and triplets existed. The Mantel test does not provide significant correlations among the matrices of distance (latitude-triple delivery rates) for any of the periods considered. However, the test between the rates of double and triple deliveries within each administrative unit provides significant correlations for the periods 1940–1949 (R: 0.309, p = .000) and 1960–1969 (R: 0.166, p = .017).
Discussion
The results obtained for Portugal are consistent with those reported by Bulmer (Reference Bulmer1960) for the 1950s. A decreasing tendency took place until the 1970s, changing to an increasing tendency since the 1980s. The temporal evolution of the rates of multiple deliveries in Portugal and Spain was compared. This comparison confirms that from 1930 to 1989 the Portuguese twinning rates consistently surpassed those of Spain. Variations in age at maternity and in the distribution of parities or in the criteria applied for recoding data could explain the small differences observed between both countries throughout the years prior to the introduction of reproductive treatments.
In recent years, the Spanish rates became more elevated than the Portuguese. This pattern of evolution is similar to that described by D’Addato (Reference D’Addato2007) for 15 developed countries. The evolution of twinning rates is related to the calendar of maternity as compared to younger mothers, older women have twins more frequently. Moreover, the growing frequency of multiple births also depends on reproductive treatments, which are largely applied in developed countries (D’Addato, Reference D’Addato2007; Pison & D’Addato, Reference Pison and D’Addato2006). This increase is largely attributable to ovulation induction and in vitro fertilization, combined with delays in parenthood (Burt & Klump, Reference Burt and Klump2012). According to Martin et al. (Reference Martin, Hamilton and Osterman2012), older maternal age accounts for about one-third of the growth in the twinning rate over this period. The higher availability and use of reproductive treatments likely explains much of the remainder of the rise.
Based on the data from the total treatment cycles (Andersen et al., Reference Andersen, Goossens, Ferraretti, Bhattacharya, Felberbaum, de Mouzon and Nygren2008a), the abundance of multiple deliveries in Spain in comparison with Portugal, as well as the higher proportion of triplets with respect to twins in Spain, is consistent with a more extensive use of assisted reproductive technology. Schenker (Reference Schenker1997) reported at that time a lower number of units practicing assisted reproduction per million of inhabitants in Portugal than in Spain, as well as more limitations according to the marital status in Portugal. Other differences referred to the use of ICSI versus IFV: in the years 1997–2004, the Spanish percentages surpassed those of Portugal (Andersen et al., Reference Andersen, Goossens, Ferraretti, Bhattacharya, Felberbaum, de Mouzon and Nygren2008b).
When comparing triple and double deliveries, according to Fellman and Eriksson (Reference Fellman and Eriksson2009a), agreement with Hellin's law could be verified using the HR: values greater than 1 represent an excess of triplets, while HR < 1 indicates a deficit of triplets. Before 1980, the yearly HR values were similar in Portugal and Spain (Figure 2). Since 1980, Spanish HR surpassed that of Portugal, and only in the most recent years have both countries returned to the values existing before 1970. Data from England and Wales showed high HR values coinciding with the introduction of subfertility treatments (Fellman & Eriksson, Reference Fellman and Eriksson2009a). The changes described for Portugal and Spain can also be attributed, according to Fuster et al. (Reference Fuster, Zuluaga, Colantonio and De Blas2008), to a more extensive use of reproductive treatments in Spain.
The results of the logistic regression (Table 2) prove that multiple deliveries are more frequent in cases of higher maternity age and the absence of previous reproduction, as well as the existence of a marital union. These factors have been reported to determine increased rates for twinning and triplets in Spain (Fuster et al., Reference Fuster, Zuluaga, Colantonio and De Blas2008, Reference Fuster, Zuluaga, Román-Busto and Colantonio2010) and in other European countries (Fellman & Eriksson, Reference Fellman and Eriksson2005a). These authors stated that maternal age is the most important non-genetic factor influencing the twinning rate. This age factor is enhanced by the influence of artificial reproduction technologies and particularly the use of fertility-enhancing drugs (Fellman & Eriksson, Reference Fellman and Eriksson2005a; Pison & D’Addato, Reference Pison and D’Addato2006). However, according to Abel and Kruger (Reference Abel and Kruger2012), maternal age effect is independent of factors also associated with twinning. With regard to Canada, Collins (Reference Collins2007) reported that older maternal age, associated with the social trend to delayed childbearing, accounts for 25–30% of the rise in multiple birth rates since 1970. Assisted reproduction technology and ovulation stimulation account for similar proportions of both twin births (20–30%) and triplet births (30–40%). In the present analysis, the marital status also revealed a relationship to multiple delivering, probably through better economic conditions in the case of stable couples than in single mothers.
Silva and Barros’ (Reference Silva and Barros2012) study revealed inequalities in access to reproductive health: reproductive units are geographically concentrated and proliferate in the private sector, where policies on the total number of treatments are less restrictive. In the most recent period (2000–2011), the ratio between triplets and twins increased mainly in urban districts followed by the archipelagos of Açores and Madeira. Because of natural conditions, the proportion between triple deliveries and double is expected to remain stable, the changes throughout time shown in Figure 4 for districts may reflect, among other influences, that of regional differences in access to reproductive treatments (Khoshnood & Blondel, Reference Khoshnood and Blondel2006). This increase can be explained by urban advantage over rural areas regarding access to health facilities. These results differ from those reported by Hur and Kwon (Reference Hur and Kwon2005), who examined whether residing in industrial areas was associated with multiple births in South Korea. With regard to the archipelagos of Madeira and Açores, besides elevated marital and maternity ages, a high migratory exchange toward the United States, which may have produced cultural exchange with the families of origin, resulted in more receptivity for the reproductive treatments than in other rural areas of Portugal.
For the first two decades studied (1949 to 1969), the rates of multiple deliveries tended to increase from north to south in Portuguese and Spanish neighboring administrative units (Figure 5). At this time, effective contraception was not yet generalized and modern reproductive treatments did not exist; twinning depended on socio-demographic and reproductive behavior partly common for both countries. With regard to triplets, no clear geographic patterns can be indicated. The infrequent occurrence of this type of delivery in some administrative units may have obscured the observation of obvious territorial patterns. For these decades, a geographic correspondence also existed between double and triple deliveries. Areas in northern Portugal and Spain, where isolation and elevated inbreeding and endogamy were common (Fuster & Colantonio, Reference Fuster and Colantonio2002), had low rates for both types of deliveries.
In Europe, a progressive increase has occurred in the twinning rate from south to north (Fellman & Eriksson, Reference Fellman and Eriksson2009b). In the Fellman and Eriksson (Reference Fellman and Eriksson2005b) study on Sweden, it is stated that the observed regional heterogeneity cannot be explained by differences in the distribution of maternal age and parity. The authors suggest that the convergence of twinning rates with time may be caused by increased urbanization and industrialization and by the increased interregional migration of citizens as a consequence of better communications, which lead to the breaking up of isolates and decreased endogamy.
It is concluded that the temporal evolution of double and triple deliveries in Portugal and its territorial distribution show affinities with Spain. Moreover, the factors determining multiple births are similar in both countries, indicating an Iberian Peninsula pattern.
Acknowledgments
The authors thank the Institute for Statistics of Portugal for the facilities given in order to obtain the data on which this article is based. This study has been partly supported by the project ‘Urban Spaces: Demographic and Socialdynamics (XVII–XX centuries)’, reference code PTDC/HIS-HIS/099228/2008, co-financed by the program COMPETE — Operational Program for Factors of Competitiveness, funded by FEDER, and by Portugal's state financed Foundation for Science and Technology as well by Project CGL2008-03737 (Spain). The authors also thank Erik Lundin for revising the article.