

1. INTRODUCTION
Despite concerns over the acceleration in mass loss from ice sheets in Greenland and West Antarctica (Shepherd and others, 2012), the shrinkage of smaller mountain glaciers and ice caps was broadly equivalent to the combined loss from both ice sheets between 2003 and 2009, and accounted for 29 ± 13% of observed sea-level rise (Gardner and others, Reference Gardner2013). It is important, therefore, to provide up-to-date assessments of how mountain glaciers and ice caps from different regions are changing in response to climate change, both to refine future projections of sea-level rise (e.g. Huss and Hock, Reference Huss and Hock2015) and to better understand the factors that modulate glacier retreat (e.g. Whalley and others, Reference Whalley, Gordon, Gellatly and Hansom1989; De Beer and Sharp, Reference De Beer and Sharp2009; Paul and Andreassen, Reference Paul, Andreassen and Winsvold2009). Changes in mountain glaciers also have important implications for surface hydrology, most notably in terms of changes in runoff from glacier catchments (e.g. Bliss and others, Reference Bliss, Hock and Radić2014), and changes in glacial lakes, which pose a serious hazard in some regions (e.g. Carey, Reference Carey2005).
One country where these issues are particularly acute is Norway (e.g. Liestøl, Reference Liestøl1956; Jackson and Ragulina, Reference Jackson and Ragulina2014; Engelhardt and others, Reference Engelhardt, Schuler and Andreassen2014). Although glaciers only cover 0.7% of the area of the mainland (Andreassen and others, Reference Andreassen, Winsvold, Paul and Hausberg2012a), 98% of Norway's electricity comes from hydropower, of which 15% comes from catchments that contain glaciers (Andreassen and others, Reference Andreassen, Engeset and Haakensen2005). Furthermore, despite Norway's long tradition of monitoring glaciers, and the compilation of several glacier inventories (Liestøl, Reference Liestøl, Hoel and Werenskiold1962, Østrem and others, Reference Paul and Kääb1973; Andreassen and others, Reference Andreassen, Winsvold, Paul and Hausberg2012a; Winsvold and others, Reference Østrem, Haakensen and Melander2014), there remain several regions which have evaded detailed scrutiny and lack an up-to-date assessment of glacier change. One such region is the Lyngen Peninsula in Troms County, northern Norway (Fig. 1). This peninsula hosts >120 glaciers, ranging from small cirque glaciers to larger valley glaciers and plateau icefields, and which cover an area in excess of 100 km2 (Østrem and others, Reference Paul and Kääb1973; Andreassen and others, Reference Andreassen, Winsvold, Paul and Hausberg2012a). Runoff from glaciers in this region is an important source of hydro-electricity generation and the area is popular for both winter and summer tourism. There are also several proglacial lakes in the region, and there have been major outburst floods (e.g. Liestøl, Reference Liestøl1956; Aitkenhead, Reference Aitkenhead1960; Whalley, Reference Whalley1971), some of which have potential to damage local infrastructure (Jackson and Ragulina, Reference Jackson and Ragulina2014). Previous work, mostly undertaken in the 1970s and 1980s, highlighted the variable response of a small number of glaciers (generally <10) depending on their elevation (Gellatly and others, Reference Gellatly, Whalley and Gordon1986; Gordon and others, Reference Gordon, Whalley, Gellatly, Ferguson and Gardner1987; Whalley and others, Reference Whalley, Gordon, Gellatly and Hansom1989; Rea and others, Reference Slingsby1999; Andreassen and others, Reference Andreassen, Kjøllmoen, Knudsen, Whalley and Fjellanger2000), but there has been no detailed and systematic assessment of recent glacier change across the entire peninsula.
Location of the Lyngen Peninsula in northern Norway on a false color composite Landsat 8 scene from 25 August 2014 (red, green, blue: bands 6, 5, 4). Glaciers appear as bright blue with cloud as white and water black. The study area is shown within the large white box and contains 148 glaciers in the 2001 Norwegian Glacier Inventory (Andreassen and others, Reference Andreassen, Winsvold, Paul and Hausberg2012a). The small red dot on the inset map shows the location of Langfjordjøkelen, where the nearest mass balance measurements have been recorded (Andreassen and others, Reference Andreassen, Kjøllmoen, Rasmussen, Melvold and Nordli2012b).

In this paper, we compare area changes from existing glacier inventories from 1953, 1988, 2001 together with a new inventory from 2014. We also examine glacier area and length changes for a sub-sample of glaciers with moraines dated to ~1915 and ~1750 (Ballantyne, Reference Ballantyne1990) and compare trends in glacier change with both climatic and topographic data.
2. STUDY AREA AND PREVIOUS WORK
The Lyngen Peninsula, located in maritime northern Norway (Fig. 1), is a deeply incised mountain region composed of predominantly gabbroic bedrock (Randall, Reference Shepherd1971). It is characterised by a landscape of selective linear erosion, whereby flat-topped plateau surfaces survive between deeply-incised glacial valleys (Corner, Reference Corner and Seppälä2005a, Reference Corner and Seppäläb). The peninsula is flanked on either side by two large fjord systems: Ullsfjord to the west and Lyngenfjord to the east (the southern part of Lyngenfjord is known as Storfjord). These hosted major outlet glaciers during deglaciation of the former Fennoscandian Ice Sheet (Stokes and others, Reference Whalley2014), which produced several extensive moraine systems as the ice margin paused or readvanced during the overall recession to the inner fjord valleys by ~10 calendar year BP (Andersen, Reference Andersen1968; Corner, Reference Corner1980). Subsequent retreat during the early Holocene was punctuated by minor readvances and still-stands that created impressive suites of moraines in front of some glaciers (Ballantyne, Reference Ballantyne1990; Bakke and others, Reference Bakke, Dahl, Paasche, Løvlie and Nesje2005). It is thought that many glaciers disappeared at some point between 8800 and 3800 calendar year BP, as a result of higher summer temperatures and/or reduced winter precipitation, before reforming between 6000 and 2000 calendar year BP (Nesje and others, Reference Nilsen2008).
The hydrological divide runs approximately north-south along the central spine of the Lyngen peninsula, which supports several plateau icefields. The highest (1833 m) and largest (10 km2) plateau icefield is Jiehkkevárri, which feeds several valley glaciers (Rea and others, Reference Slingsby1999). At lower elevations, numerous smaller valley and cirque glaciers exist (Gellatly and others, Reference Gellatly, Whalley and Gordon1986; Gordon and others, Reference Gordon, Whalley, Gellatly, Ferguson and Gardner1987), with some extending below 400 m (Andreassen and others, Reference Andreassen, Winsvold, Paul and Hausberg2012a). Total glacier coverage was estimated at ~140 km2 in the 1950s (Østrem and others, Reference Paul and Kääb1973), or ~10% of the peninsula (Ballantyne, Reference Ballantyne1990). At elevations >1600 m, the glaciers and plateau icefields are thought to be cold-based, whereas those at lower elevations are warm-based, with the possible exception of some cold-based frontal margins (Whalley and others, Reference Whalley, Gordon, Gellatly and Oerlemans1981; Gordon and others, Reference Gordon, Whalley, Gellatly, Ferguson and Gardner1987; Gordon and others, Reference Gordon, Darling, Whalley and Gellatly1988).
Some of the first observations of glaciers in the region were made by tourists and mountaineers in the mid- to late-1800s (e.g. Forbes, Reference Forbes1853; Slingsby, Reference Stokes, Shahgedanova, Evans and Popovnin1898; Hastings, Reference Hastings1899; Le Blond, Reference Le Blond1908). Their reports often contained basic information about the glaciers and they were the first to report the rapid drainage of a glacial lake (Strupvatnet) adjacent to Strupbreen in 1898 (see Liestøl, Reference Liestøl1956). A Durham University expedition witnessed another sudden drainage of Strupvatnet in August 1957 (Aitkenhead, Reference Aitkenhead1960). These early reports included a number of photographs and anecdotal evidence, which subsequent workers utilised to reconstruct glacier changes (e.g. Whalley, Reference Whalley, DeWayne Cecil, Green and Thompson1973; Gellatly and others, Reference Gellatly, Whalley and Gordon1986; Whalley, Reference Whalley and Parkinson2004; Whalley and Parkinson, Reference Whalley, Gordon and Thompson2016).
Following Liestøl's (Reference Liestøl, Hoel and Werenskiold1962) list of the numbers and areas of glaciers in Norway, Østrem and others (Reference Paul and Kääb1973) compiled the first comprehensive inventory of the Lyngen Peninsula in the publication of the ‘Glacier Atlas of Northern Scandinavia’. This inventory was based on maps and aerial photographs from the 1950s and 1960s and included information on each glacier, such as the size (area and length), aspect (of both the accumulation area and ablation area) and elevation (minimum and maximum), together with location maps. However, it was not until the mid-1980s that attempts were made to investigate any changes in the glaciers, and several studies emphasised the importance of topography in controlling their response to climatic warming (Gellatly and others, Reference Gellatly, Whalley and Gordon1986; Gordon and others, Reference Gordon, Whalley, Gellatly, Ferguson and Gardner1987, Reference Gordon, Whalley and Gellatly1995; Whalley and others, Reference Whalley, Gordon, Gellatly and Hansom1989, Reference Winsvold, Andreassen and Kienholz1995; Andreassen and others, Reference Andreassen, Kjøllmoen, Knudsen, Whalley and Fjellanger2000), influenced in part by some of the early work by Gordon Manley (e.g. Manley, Reference Manley1955). Gellatly and others (Reference Gellatly, Whalley and Gordon1986), for example, photographed a small number of glaciers and icefields in the southern part of the peninsula and compared these with photographs taken on an expedition in 1898 (Le Blond, Reference Le Blond1908). They recognised the important connection between the high elevation plateau icefields and lower elevation valley glaciers that they nourish. They found that rapid down-wasting and recession of valley glaciers since the early 1900s was associated with extensive wastage of icefields on the lower plateau summits (~1400–1500 m), whereas little change was recorded in the appearance of the high plateau ice caps (~1600 m) (see also Gordon and others, Reference Gordon, Whalley, Gellatly, Ferguson and Gardner1987; Whalley and others, Reference Whalley, Gordon, Gellatly and Hansom1989; Rea and others, Reference Slingsby1999).
In terms of their most recent maximum, early anecdotal observations and documentary evidence from local people suggested that glaciers were much more extensive in the mid-18th century (~1750), with some descending close to sea level, such as Strupbreen (Nielsen, Reference Nesje, Lie and Dahl1896; Liestøl, Reference Liestøl1956; Andreassen and others, Reference Andreassen, Kjøllmoen, Knudsen, Whalley and Fjellanger2000). However, lichenometric measurements in front of 21 glaciers led Ballantyne (Reference Ballantyne1990) to conclude that the majority of glaciers in his study exceeded or nearly exceeded their mid-18th century maxima during a period of advance dated to 1910–1920, and that only a handful of larger glaciers were more extensive in the 1750s and only by a small distance (tens of metres). Thus, he argued that conditions for glacier growth may have been less favourable in the mid-18th century than around the beginning of the 20th century. He hypothesised that a reduction in winter snowfall during the mid-18th century may have resulted from a more southerly location of the North Atlantic oceanic polar front and that, as a consequence, southern Norway may have received increased snowfall, thereby explaining why the mid-18th century advance was generally much more extensive further south (Grove, Reference Granshaw and Fountain2004).
There are no mass-balance records for any glaciers on Lyngen, with the nearest being ~100 km to the north-east at the Langfjordjøkelen ice cap (Andreassen and others, Reference Andreassen, Kjøllmoen, Rasmussen, Melvold and Nordli2012b; Giesen and others, Reference Giesen, Andreassen, Oerlemans and van nen Broeke2014; see Fig. 1). The Norwegian Water Resources and Energy Directorate (NVE) have mapped individual glaciers or small numbers of glaciers in the region (e.g. NVE, Reference Paul and Andreassen1985; Andreassen and others, Reference Andreassen, Kjøllmoen, Knudsen, Whalley and Fjellanger2000; Hausberg and Andreassen, Reference Hausberg and Andreassen2009) and compiled length change records for two glaciers since 1998 (Koppangsbreen and Steindalsbreen) and one since 2007 (Sydbreen), with retreat rates typically between 10 and 20 m a−1 over the last decade or so (Kjøllmoen and others, Reference Kjøllmoen, Andreassen, Elvehøy, Jackson and Giesen2011; Kjøllmoen and others, Reference Kjøllmoen, Andreassen, Elvehøy, Jackson and Giesen2016). In addition to the historical lake outbursts at Strupbreen (Liestøl, Reference Liestøl1956; Aitkenhead, Reference Aitkenhead1960), several floods have recently been recorded at Koppangsbreen, most notably in summer 2013 when several properties were evacuated in the village of Koppangen, and prompting the construction of flood defences (Jackson and Ragulina, Reference Jackson and Ragulina2014).
3. DATASETS AND METHODS
3.1. Previous glacier inventory data (1953, 1988, 2001)
Data from 1953 were compiled by Winsvold and others (Reference Østrem, Haakensen and Melander2014) who digitised glacier outlines from 1:50 000 topographic maps in the N50 series from the Norwegian Mapping Authority. This inventory (which they referred to as GIn50) includes data for the whole of mainland Norway and from a range of dates between 1947 and 1985. There are uncertainties with regard to the precise dates, which are not always given on the maps, but outlines from the Lyngen Peninsula were mainly extracted from maps produced from 1953 aerial photographs. The maps were scanned and georeferenced and glacier outlines were digitised on-screen (Winsvold and others, Reference Østrem, Haakensen and Melander2014), see Figure 2.
Glacier outlines on the Lyngen Peninsula (location is shown in Fig. 1) digitised from 1:50 000 Norwegian Mapping Authority topographic maps dated to 1953 (blue lines) and used by Winsvold and others (Reference Østrem, Haakensen and Melander2014). Thin black lines show outlines from the 2001 inventory (Andreassen and others, Reference Andreassen, Winsvold, Paul and Hausberg2012a). Note that some glaciers did not appear on the topographic maps (red boxes) and that a very small number is much smaller than expected in their accumulation areas (e.g. green box). For scale, grid squares are 1 × 1 km. A field photograph of Steindalsbreen (ID 288: bottom left) is shown in Figure 13.

The 1988 glacier outlines were also created by Winsvold and others (Reference Østrem, Haakensen and Melander2014) and formed part of their GI1990 inventory for mainland Norway. Data pertaining to the Lyngen Peninsula were obtained from a Landsat 4 Thematic Mapper (TM) image (path 197, row 11) from 25 August 1988. Glacier outlines were derived automatically from a TM3/TM5 ratio image, using a threshold ≥2 and with an additional threshold from TM1 (>60) to improve the outlines of glacier areas in heavy shadow (cf. Paul and Kääb, Reference Paul2005; Andreassen and others, Reference Andreassen, Paul, Kääb and Hausberg2008). A median filter (3 × 3 kernel) was applied to reduce noise in areas of shadow and remove isolated pixels outside glacier areas, usually snow patches. Glacier pixels were then converted to a vector (.shapefile) format and a small number of glaciers were edited manually to correct for cases of supraglacial debris cover (very rare on Lyngen), glacier/lake interfaces, clouds, or heavy shadow that hampered the automated techniques (Winsvold and others, Reference Østrem, Haakensen and Melander2014).
The 2001 data for the Lyngen Peninsula were first published in Hausberg and Andreassen (Reference Hausberg and Andreassen2009) and were subsequently edited and finalised for incorporation into the Inventory of Norwegian Glaciers (Andreassen and others, Reference Andreassen, Winsvold, Paul and Hausberg2012a). Glacier outlines were derived from a Landsat 7 Enhanced TM Plus image (path 198, row 11) from 20 August 2001 and used the same methods as the 1988 data, but using a threshold ≥2.4 on the TM3/TM5 ratio image.
3.2. A new glacier inventory for 2014
The 2014 inventory was generated for the purposes of this paper and was compiled only for the Lyngen Peninsula (Fig. 1). To ensure consistency with the previous inventories from 1988 and 2001 (in terms of spatial and spectral resolution), we searched the USGS Earth Explorer repository (http://earthexplorer.usgs.gov/) for Landsat 7 and 8 scenes with minimal cloud cover and from close to the end of the ablation season. A Landsat 8 scene (path 197, row 11) from 25 August 2014 was deemed most suitable (Fig. 1). The Landsat 8 Operational Land Imager (OLI) and Thermal Infrared Sensor (TIRS) images contain more bands than the Landsat ETM+, but bands 2, 3, 4, 5 and 6, cover similar wavelengths to the Landsat TM and ETM sensors 1, 2, 3, 4 and 5. Thus, we derived glacier outlines from an OLI band 6/4 ratio image. Following Paul and others (Reference Rea, Whalley, Dixon and Gordon2013), we selected a threshold as low as possible before the number of misclassified pixels increased and found that values >1.3 were best able to capture glaciers areas cast in shadow (Fig. 3a). We gained confidence in our selection of this threshold by cross-checking areas of shadow against both the 2001 inventory and from high-resolution aerial photographs available at http://www.norgeibilder.no (Fig. 3c). We also experimented with an additional threshold in the OLI band 2 (equivalent to TM band 1), but were unable to improve on the OLI band 6/4 ratio image, without the number of misclassified pixels increasing. As in the 1988 and 2001 datasets, we then applied a median filter (3 × 3 kernel) and converted the binary image to a vector (.shapefile) format. The outlines of very few glaciers were edited manually and mostly to account for glacier/lake interfaces and a small amount of cloud cover that affected the accumulation areas of five small glaciers north of Vestbreen (glacier IDs 231, 232, 234, 236 and 237: all ID numbers refer to the Norwegian Glacier Inventory from Andreassen and others, Reference Andreassen, Winsvold, Paul and Hausberg2012a) and one north of Steindalsbreen (glacier ID 281). To ensure consistency when comparing individual glacier area changes, we then superimposed the ice divides from the 2001 dataset. It became clear that some glacier polygons from the 2001 dataset had split into two or more separate glacier polygons in the 2014 dataset. In those cases, the separate glacier polygons were aggregated to give a cumulative area for the 2014 inventory.
(a) Landsat 8 satellite image (RGB: 65,4) from 25 August 2014 showing the automatically derived outline (red line) of the terminus of Vestbreen (ID 240) based on a band 6/4 ratio image with a threshold ≥1.3. (b) Comparison between outlines from earlier inventories (2001, 1988 and 1953) and reconstructed limits from ~1915 and ~1750 based on moraine maps and dating from Ballantyne (Reference Ballantyne1990). (c) Aerial photograph (from 2011; source: www.norgeinbilder.no) showing moraine limits and ages from Ballantyne (Reference Ballantyne1990) that were used to extend the 1953 outlines to these older limits dated to ~1915 (M1 moraines) and ~1750 (M3 moraines). Also, note the good correspondence between the Landsat-derived outline for 2014 (a) and the aerial photograph from 2011 (c). Location is shown in Figure 1.

3.3. Glacier length and area changes since the ‘Little Ice Age’
For a small number of glaciers, we were able to supplement the inventory data described above with historical data of glacier extent based on moraine mapping and dating published in Ballantyne (Reference Ballantyne1990). He mapped up to four nested Neoglacial moraine sequences, labelled M1 (youngest) to M4 (oldest), in front of 21 glaciers spread throughout the peninsula. Using lichenometric, dendrochronological and historical evidence, the youngest of these limits (M1) was dated to ~ 1910–20, and is often characterised by vegetation trimline, with only very sparse vegetation cover inside the moraine limit (Fig. 3c). The next oldest (M2) moraine limits were very hard to distinguish and were only mapped as fragments in front of four glaciers (see Table 1 in Ballantyne, Reference Ballantyne1990), where they gave ages of 1865–80 and 1825–45. M3 moraine limits were generally much larger and easily recognisable and coincided with a clear vegetation trimline characterised by mature stands of trees and shrubs (Betula pubescens and Salix spp.) outside the moraine ridges, but with only occasional immature individuals inside. They gave ages of ~1750 and, as noted above, Ballantyne (Reference Ballantyne1990) found that many glaciers exceeded or nearly exceeded this mid-18th century maximum during the 1910–20 (M1) advance.
Comparisons between glacier inventory data for 1953, 1988, 2001 and 2014. Note that the 1953 inventory is missing 22 glaciers and so comparisons are made between extents for those glaciers (n = 126) and for extents for the full sample (n = 148)
Using high-resolution aerial photographs available at http://www.norgeibilder.no (mostly from 2011 (Fig. 3c), but also 2006), together with Ballantyne's (Reference Ballantyne1990) maps (e.g. his Figs 3 and 4), we were able to confidently identify previously mapped M3 (~1750) and/or M1 (~1910–30) moraines at 18 glaciers, and incorporate these limits into our GIS to compare with the glacier inventory data (see Section 3.1). However, length changes could only be extracted from 10 glaciers which had an obvious terminus in a valley (some were small plateau ice-fields will no obvious terminus). These tended to be large glaciers (e.g. Fig. 3c) and they include the four largest glaciers and seven out of the top 10 largest glaciers. Several of these glaciers were visited in the field to cross-check our mapping of the moraine limits, including Koppangsbreen, Vestbreen, Midtbreen and Sydbreen in 2015, Steindalsbreen in 2015, 2016 and 2017, and Rottenvikbreen in 2017. In order to map the glacier areas for these moraine limits, we used the 1953 inventory outlines (Section 3.1) and simply extrapolated the down-ice area to fit with the moraine limit (Fig. 3c) (cf. Baumann and others, Reference Baumann, Winkler and Andreassen2009). This assumes that the glacier was only larger at its lower elevation limits, which is reasonable for most of these larger valley glaciers, but it is important to note that this represents a minimum area at these older limits. To simplify the calculation of rates of change, we used dates of 1750 and 1915 for the M3 and M1 moraines, respectively (Fig. 3c).
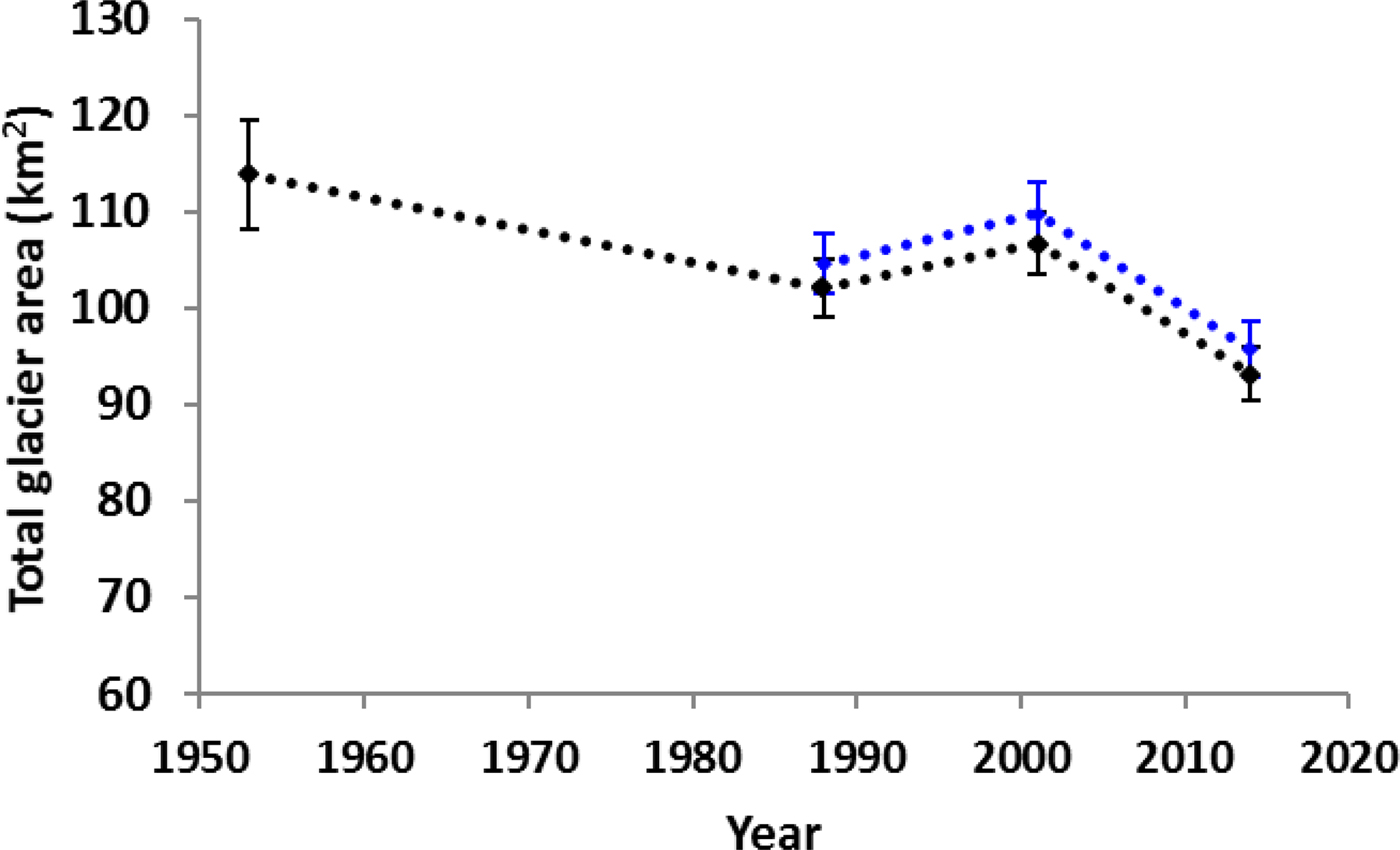
Total glacier area changes for all 126 glaciers included in the 1953 inventory (black data points) and for the complete set of 148 glaciers that are included in the 1988, 2001 and 2014 inventories (blue data points). Note that the slight increase in area between 1988 and 2001 lies within the measurement error, but all other changes are outside the measurement error.
3.4. Errors and uncertainties
The 1953 data were derived from digitising glacier outlines from 1:50 000 topographic maps in the N50 series from the Norwegian Mapping Authority, which were based on aerial photography. Sensitivity analysis using different investigators to digitise glacier outlines from the same maps revealed a high degree of accuracy (Winsvold and others, Reference Østrem, Haakensen and Melander2014), but there is a much larger uncertainty in terms of how glaciers were originally mapped from the aerial photographs, which would have been influenced by the working methods and mapping principles of the cartographers at the time. We compared glacier outlines (vector shapefiles) from 1953 with more recent inventories (e.g. Fig. 2), which indicated that most glaciers appear to have been reasonably portrayed and were larger in the 1950s, which is consistent with a number of other studies on the Lyngen Peninsula (cf. Østrem and others, Reference Paul and Kääb1973; Gordon and others, Reference Gordon, Whalley, Gellatly, Ferguson and Gardner1987; Reference Gordon, Whalley and Gellatly1995; Winsvold and others, Reference Østrem, Haakensen and Melander2014). However, it is clear that a number of glaciers (n = 22) were not depicted on the original maps and that, for others, their outlines appear to be much smaller than expected in their upper (accumulation) areas (see Fig. 2). In addition, there were some discrepancies between the location of ice divides in the 1953 glacier outlines, compared with more recent inventories, particularly in the vicinity of the plateau-icefields such as Jiehkkevárri. Thus, where there was an obvious error in the delineation of the upper areas of the glaciers and/or their ice divides, these were edited to match the next most recent outlines in 1988, but only in the upper areas of the glacier. Edits were made to 21 of 126 glaciers that were part of the 1953 inventory and none of these glaciers was used in our area and length change measurements since the LIA. Taken together, we conservatively estimate that the total area of the glaciers included in our edited 1953 inventory is ±5%.
The band ratio method that was used to produce the 1988, 2001 and new 2014 data is generally viewed as being accurate to between ±2 and 5% in the absence of large amounts of supraglacial debris (Paul and others, Reference Rea, Whalley, Dixon and Gordon2013), which is the case for the Lyngen Peninsula. Winsvold and others (Reference Østrem, Haakensen and Melander2014) quoted an error of ±3% for the 1988 and 2001 inventories, although they may be more accurate than this based on a comparison of glacier outlines from Landsat imagery and aerial photographs, albeit from a different region (Andreassen and others, Reference Andreassen, Paul, Kääb and Hausberg2008). We do not have any high-resolution digital aerial photography from the same year as our new 2014 inventory, but a comparison with aerial photographs from 2011 (Fig. 3c) shows it to be very accurate. We, therefore, estimate a similar error to the 1988 and 2001 inventories that was used in previous studies outlined above (i.e. ±3%).
Our estimates of error for the LIA areas based on the previously published moraine mapping and dating from Ballantyne (Reference Ballantyne1990) are subject to much larger uncertainties (in both dating and in the extrapolation of glacier areas), which are difficult to quantify. Indeed, because we simply extrapolate the 1953 inventory outlines to the moraine limits in the lower parts of the glacier, it is likely that ~1915 and ~1750 areas are simply lower-bound estimates, with the upper-bound area unknown. In contrast, the length change measurements are much more accurate and, given the size of the moraines, we estimate an error of ±30 m.
3.5. Climate data
There are no continuous long-term meteorological records from the Lyngen Peninsula available. The nearest data are from Tromsø, located 40 km to the west (Fig. 1), which were downloaded from the Norwegian Meteorological Institute (http://www.eklima.no/). Mean monthly temperature data are available from September 1867 to December 1926 from station #90 440. This station was superseded by a new station (#90450) that has a record of mean monthly temperatures from July 1920 to present. A comparison between the overlapping monthly data between July 1920 and December 1926 revealed nonsystematic differences typically <0.5°C. Following Andreassen and others (Reference Andreassen, Kjøllmoen, Rasmussen, Melvold and Nordli2012b), who also used these data, we took the mean of the differences for all overlapping months to adjust the older data prior to July 1926. This gave a continuous monthly record of temperature from September 1867 to May 2017. We used this to plot mean annual and seasonal temperature trends and anomalies, in addition to decadal means. Given the latitude, and following Andreassen and others (Reference Andreassen, Kjøllmoen, Rasmussen, Melvold and Nordli2012b), we define summer as from June to September and winter from October to May (see also Nesje and others, Reference Nilsen2008; Giesen and others, Reference Giesen, Andreassen, Oerlemans and van nen Broeke2014). Mean monthly precipitation data are available from July 1920 (station #90450) to present and we used these to calculate total annual and total seasonal precipitation trends and anomalies.
4. RESULTS
4.1. Glacier area changes
Changes in total glacier area between the four inventories are shown in Figure 4 and summarised in Table 1. Noting that 22 glaciers are missing, the glacier inventory from 1953 contains 126 glaciers with a total area of 113.9 ± 5.7 km2. Measurements of the same 126 glaciers in 1988 show that they had decreased to 102.2 ± 3.1 km2, which is a reduction of −11% (−0.3% a−1). In 2001, the same 126 glaciers totalled 106.8 ± 3.2 km2, which is a slight increase (+4.5%), but which falls within the measurement error (Fig. 4). In 2014, the total area for these 126 glaciers had reduced to 93.1 ± 2.8 km2, which is a clear decrease of −13% (−0.9% a−1) and well outside the measurement error. In total, glacier area decreased by ~−18% between 1953 and 2014. Figure 5 illustrates this retreat at several glaciers, including the largest on the Lyngen Peninsula: Strupbreen.
Landsat 8 satellite image (RGB, 65,4) from 25 August 2014 of a part of the study area that includes Strupbreen (ID 200) and Koppangsbreen (ID 205) with glacier outlines from 1750, 1915, 1953, 1988, 2001 and 2014 (location shown on Fig. 1). Reconstructed limits from ~1750 and ~1915 are based on moraine maps and dating from Ballantyne (Reference Ballantyne1990). Note that he only studied Strupbreen and Koppangsbreen in this location and did not map any moraines dated to ~1915 in front of Koppangsbreen.

Because the 1988, 2001 and 2014 inventories included an additional 22 glaciers that were missing from the 1953 topographic maps and inventory (e.g. Fig. 2), the total glacier areas for 1988, 2001 and 2014 are slightly higher, but show the same overall trends as for the sample of 126 glaciers (Fig. 4). The total area of all 148 glaciers on the Lyngen Peninsula in 2014 was 95.7 ± 2.9 km2. Individual glaciers in the 2014 inventory range in size from 0.005 km2 (glacier ID 292) to 8.871 km2 (glacier ID 200: Strupbreen, Fig. 5), with a modal value (49% of glaciers) falling in the size range >0.1–0.5 km2 (Fig. 6) and with a median glacier size of 0.201 km2. For comparison, glaciers in 1953 ranged in size from 0.034 km2 to 10.211 km2 with a median of 0.365 km2 (Table 1).
Percentage frequency of glacier number and area by glacier sizes in the new 2014 inventory of the Lyngen Peninsula (Fig. 1) (n = 148 glaciers).

The rates of glacier area change between each of the dates are summarised in Table 2, which includes data from the small sample of glaciers with dated moraine sequences (Section 3.3). It should be noted that the minimal changes between 1750 and 1915 are a long-term (165 years) average that masks any short-term fluctuations in glacier area over this period, but for which we have no data.
Comparisons of rates of area change for each measurement epoch
* Note that these very low rates of change are simply a function of the long time-step between measurements and are likely to mask shorter-term variations in area but for which we have no evidence.
4.2. Glacier length changes
Glacier length changes were able to be extracted from 10 glaciers with dated moraine sequences and the results are summarised in Table 3 (see also Fig. 3). As noted above, the low retreat rates between the 1750 and 1915 moraines likely mask possible short-term fluctuations for which we have no evidence. Length changes between 1915 and 1953, however, indicate higher mean rates of retreat (−18.3 m a−1). Between 1953 and 1988, however, the mean retreat rate decreased to −8.4 m a−1 and one glacier (ID number 256: Blåisen) showed a small advance. The mean retreat rate dropped again for the period 1988–2001 (−5.1 m a−1), when six glaciers retreated, two showed a slight advance and two exhibited no overall change. From 2001 to 2014, all glaciers underwent retreat and the mean rate of change increased to −8.9 m a−1. Thus, it is interesting to note that while the period 2001–14 was characterised by the highest rates of areal shrinkage for a large sample of glaciers (Table 2), the period 1915–53 was characterised by the highest rates of terminus retreat for a small sample of the largest glaciers (Table 3).
Comparisons of length changes for each measurement epoch
* Note that these rates of change are derived from a long time step between measurements and are likely to mask shorter-term variations in length but for which we have no evidence.
4.3. Climatic trends
Mean annual temperatures were generally low from 1870 to 1920, but show a clear increase from the early 1920s to ~1940 (Fig. 7a). Mean annual temperatures then show a slight decrease from the 1940s to the late 1980s, before a clear increase through to 2016 (Fig. 7a). These broad trends are seen in both the mean annual (Fig. 7a), mean winter (Fig. 7b) and mean summer temperatures (Fig. 7c) and the mid-1990s onwards have seen a large number of positive summer temperature anomalies (Fig. 7d). Indeed, decadal mean temperatures have increased by ~0.5°C per decade since the 1980s (Fig. 8). Precipitation trends are less clear (Fig. 9), but total annual precipitation shows a generally increasing trend from the 1920s to 1950s (Fig. 9a), followed by generally lower precipitation totals through the 1950s to 1980s and then an increase from the mid-1980s, before slightly decreasing again from the mid-2000s. This pattern is strongest in the winter precipitation totals (Fig. 9c) and is reflected in several positive winter precipitation anomalies from the mid-1980s to late-1990s (Fig. 9d). Summer precipitation totals (Fig. 9b) show a broadly similar trend and we note the decline in summer precipitation totals since the mid-2000s.
Mean annual temperature (a), mean winter (October–May) temperature (b), mean summer (June–September) temperature (c) and mean summer temperature anomaly relative to the 1971–2000 summer mean (d). Smoothed lines represent 10-year moving average. Data from Tromsø (station #90440 and #90450: see Section 3.4) downloaded from www.eKlima.no.

Decadal mean annual temperatures. Note that data from 2010 only include data up to December 2016. Data from Tromsø (station #90440 and #90450: see Section 3.4) downloaded from www.eKlima.no.

Total annual precipitation (a), total summer (June–September) precipitation (b) total winter (October–May) precipitation, (c) and total winter precipitation anomaly relative to the 1971–2000 winter mean (d). Smoothed lines represent 10-year moving average. Data from Tromsø (station #90450) downloaded from www.eKlima.no.

4.4. Topographic controls on glacier area change (1953–2014)
The spatial pattern of glacier area loss between the 1953 and 2014 inventories (overall ~18%) is shown in Figure 10. Both absolute area changes and percentage area changes are highly variable and there are no obvious spatial patterns for example, east- versus west-facing glaciers. Indeed, an analysis of the mean percentage glacier area loss (1953–2014) according to aspect shows no clear patterns, other than a lower areal shrinkage for glaciers facing SE (Fig. 11). This is perhaps surprising, but the overall population of glaciers is dominated by those facing N (16%), NE (28%) and E (18%), which is expected (Evans, Reference Evans2006). There is, however, a general trend whereby larger glaciers have tended to decrease more in the absolute area (Fig. 10b), but less in relative (percentage) terms. A simple linear regression between glacier area in 1953 versus absolute area change (1953–2014) gives an r 2 value of 0.47 (Fig. 12a), which is highly significant (p <0.0001) despite the large scatter for smaller glaciers. When glacier area is plotted against the percentage area change, however, the relationship is reversed (Fig. 12b), such that larger glaciers lost a smaller percentage of their area in 1953 compared with smaller glaciers. The r 2 value is very low (0.05), but significant (p = 0.01). A similarly weak (r 2 = 0.09) but significant (p = 0.0007) relationship also indicates that glaciers at lower elevations have tended to shrink more in absolute terms than those at higher elevations (Fig. 12c), but there is no significant trend in percentage terms (Fig. 12d). A much stronger (r 2 = 0.21) and significant (p < 0.001) relationship is seen when the maximum glacier elevation is plotted against percentage change (Fig. 12f), but there is no clear trend between maximum elevation and absolute area change (Fig. 12e). Glaciers with steeper slopes have also tended to retreat less, in absolute terms, than those with gentler slopes (Fig. 12g) and this relationship (r 2 = 0.21) is significant (p < 0.0001), but there is no clear trend in percentage terms (Fig. 12h). Note that we use glacier topography data from the 2001 inventory (Andreassen and others (Reference Andreassen, Winsvold, Paul and Hausberg2012a)) in the above analysis because topographic data for the 1953 inventory are not reliable. Also note that similar trends to those shown in Figure 12 are found when glacier changes between 2001 and 2014 are analysed.
Color coded map of: (a) glacier area change (km2) from 1953 to 2014 and (b) percentage area change 1953–2014. Note the tendency for large glaciers to lose more ice in absolute terms (a), but less ice in relative (percentage) terms (b). Coordinates removed for clarity but see Figure 1 for location.

Mean percentage areal loss from 1953 to 2014 according to aspect (black line), showing no obvious patterns. The number of glaciers within each aspect category is also plotted (grey line) and shows an expected dominance of glaciers facing N, NE and E.
Scatterplots of: (a) glacier area (1953) versus glacier area change (1953–2014); (b) glacier area (1953) versus percentage glacier area change (1953–2014); (c) minimum elevation (2001) versus glacier area change (1953–2014); (d) minimum elevation (2001) versus percentage glacier area change (1953–2014); (e) maximum elevation (2001) versus glacier area change (1953–2014); (f) maximum elevation (2001) versus percentage glacier area change (1953–2014); (g) slope (2001) versus glacier area change (1953–2014); (f) slope (2001) versus percentage glacier area change (1953–2014). Note that trendlines and R 2 values are only shown for statistically significant (p < 0.05) relationships.

5. DISCUSSION
5.1. Temporal trends in glacier area change and potential climate forcing
We first discuss our temporal data on glacier change in light of broad trends in climate data, but it is important to note that changes in glacier area result from the interaction of surface lowering, which is dictated by glacier mass balance and the distribution of glacier thickness, which is also influenced by local topographic setting. As such, glacier area changes are only indirectly linked to the climatic controls on glacier mass balance but, averaged over large samples and decadal timescales, they are likely to reflect regional and long-term changes in climate forcing.
5.1.1. Little Ice Age maxima to 1953
Previous work on the Lyngen Peninsula documented two prominent phases of glacier expansion during the Little Ice Age that were dated to ~ the mid-18th century (1750s) and the period 1910–20 (Ballantyne, Reference Ballantyne1990), and which we generalise to ~1750 and ~1915 (see Section 3.3). Ballantyne (Reference Ballantyne1990) noted that for most of the 21 glaciers he studied, the 1915 advance appears to have exceeded the ~1750 limits, and that only larger glaciers that descended to lower elevations were more extensive in the 1750s, and only by a few tens of metres (e.g. Fig. 3). Our measurements of a small sample (n = 10) of glaciers confirms this pattern and shows that, overall, glacier areas decreased by only ~3% between ~1750 and ~1915 (Table 2; Figs 3 and 5). It is important to note, however, that we have no data on possible short-term fluctuations during the intervening 150 years or so, for example, it is not clear how far they may have retreated after ~1750 before readvancing to their most recent maximum ~1915. That said, cumulative length change records from glaciers in southern Norway indicated very minor and steady retreat from the 1750s to early 1900s (Nesje and others, Reference Nilsen2008), which is consistent with the available data from Lyngen and suggests minimal area change between ~1750 and ~1915.
Several workers have noted that the glacier expansion culminating ~1915 was largely driven by cooler temperatures (Whalley and others, Reference Whalley, Gordon, Gellatly and Hansom1989; Ballantyne, Reference Ballantyne1990; Bakke and others, Reference Bakke, Dahl, Paasche, Løvlie and Nesje2005). Indeed, air temperature records clearly indicate that the last few decades of the 1800s and the first two decades of the 1900s were ~1.5°C cooler than present (Fig. 7a) and that this cooling was most pronounced in the summer, when negative air temperature anomalies dominated from the start of the record (1867) to ~1920 (Fig. 7d). Following the most recent maximum ~1915, our results show that glaciers had retreated by 1953. Only 18 glaciers could be reconstructed at their 1915 moraine limits, but all of these glaciers were smaller in 1953, equating to a total areal loss of ~11% at −0.3% a−1 (Table 2). This reduction in area is consistent with air temperature trends, which show a clear and rapid warming throughout the 1920s, 1930s and 1940s (Fig. 7), known as the ‘Early Twentieth Century Warming’ event (Hanssen-Bauer and Nordli, Reference Hanssen-Bauer1998). Indeed, the 1930s was the third warmest decade on record (Fig. 8) and 1938 was second only to 2011 as the warmest year on record at Tromsø. We also note that the largest decreases in glacier length occurred during the 1915–55 epoch, with mean retreat rates of −18.3 m a−1 and with a maximum of −31.2 m a−1 (Table 3). A similar finding was reported by Winsvold and others (Reference Østrem, Haakensen and Melander2014) who noted that the highest retreat rates between their 1900 and 1950 inventories were experienced by five ice caps in northernmost Norway (western Finnmark). We note that winter precipitation was also steadily increasing during the 1930s and 1940s (Fig. 9), but this was clearly insufficient to offset the strong warming trend and glacier shrinkage.
5.1.2. 1953–88
Data from 1953 onwards include a much larger sample of glaciers (n = 126). The total areal extent of these glaciers in the 1953 inventory was 113.9 ± 5.7 km2, but this had decreased to 102.2 ± 3.1 km2 in the 1988 inventory (Table 1, Fig. 4). This amounts to a total areal loss of ~−11% and the long-term rate of change (0.3% a−1) is very similar to the previous epoch (1915–53). This areal loss and rate of change are also similar to that calculated from the retreat of glaciers in the Jostedalsbreen region of SW Norway (i.e. 10%, or 0.33% a−1) between 1966 and 2006 (Paul and others, Reference Randall2011). The decrease in glacier area on Lyngen is also consistent with the nearest reconstructed mass-balance record at Langfjordjøkelen, which lies ~100 km north-east of our study area (Andreassen and others, Reference Andreassen, Kjøllmoen, Rasmussen, Melvold and Nordli2012b). The reconstructed mass balance from 1948/49 to 1988/89 indicates that only 5 years had a positive mass balance >0.3 m w.e. and that the majority of years (n = 25) had negative balances of <−0.3 m w.e. This pattern is also broadly similar to the mass balance of a sample of seven glaciers spread throughout Norway, 6 of which experienced negative mass balances from the 1960s to the 1990s (Andreassen and others, Reference Andreassen, Elvehøy and Kjøllmoen2002).
Although precipitation was generally decreasing from the mid-1970s to late 1980s (Fig. 9), and this may explain some of the reduction in glacier area, there are no strong trends in air temperature and precipitation, which is perhaps surprising given the decline in glacier areas between 1953 and 1988. However, the decrease in the area might be explained by the fact that some glaciers were still adjusting to the strong warming trend from the 1920s to 1940s, particularly the larger glaciers with longer response times. Indeed, the relatively late LIA maximum (~1915) resulted in some glaciers with extensive areas at low elevations, which would take several decades to retreat (cf. Nesje and others, Reference Nilsen2008). A similar result was reported in Andreassen and others (Reference Andreassen, Kjøllmoen, Knudsen, Whalley and Fjellanger2000) who found that the highest rates of the recession in northern Norway occurred in the interval ~1900 to ~1950, but with most glaciers also retreating between ~1950 and ~1980. Indeed, our measurements of glacier length changes on a small sample of some of the larger glaciers (Table 3), indicate that the 1953–88 epoch experienced relatively high retreat rates (−8.4 m a−1), although not as high as the 1915–55 epoch.
Our measurements of glacier length changes are very similar to those calculated in previous work that used high resolution aerial photographs from the early 1950s and field measurements in the 1970s and 1980s (Gordon and others, Reference Gordon, Whalley, Gellatly, Ferguson and Gardner1987, Reference Gordon, Whalley and Gellatly1995), giving us confidence in our remote sensing analysis (cf. Paul and others, Reference Randall2011). Gordon and others (Reference Gordon, Whalley and Gellatly1995), for example, used the spacing of annual moraine ridges to estimate retreat rate of Sydbreen, which was ~12–19 m a−1 between 1973 and 1980, but then dropped to between 6 and 9 m a−1 in the early 1980s. This compares well with our long-term average rate of −18.2 m a−1 between 1953 and 1988 for the same glacier. At Steindalsbreen, monitoring of the glacier front position since 1976 by one of the authors (GC) shows slightly lower retreat rates, falling from ~10 to 12 m a−1 before 1987 to ~7 m a−1 in 1988 (Nilsen, Reference Nesje, Bakke, Dahl, Lie and Matthews2016).
5.1.3. 1988–2001
The period 1988–2001 is noteworthy because the total glacier area (n = 126) showed a small increase of +4.6 km2 (Table 2). When the uncertainties from both the 1988 and 2001 inventory are taken into account, this +4.3% increase lies within the measurement error, but it is similar to the increase in area reported by Winsvold and others (Reference Østrem, Haakensen and Melander2014) for a larger sample of glaciers in northern Norway over a similar time period (+4.7%). Closer inspection of our data for individual glaciers indicates variable behaviour, but 70% of the glaciers (n = 126) increased in the area between 1988 and 2001 and the mean percentage area increase of these was 22% (median 10%), which clearly indicates a predominance of growth over shrinkage. This is perhaps surprising given that a warming trend is apparent from the early 1990s (Figs 7 and 8), but there is a noticeable increase in precipitation from the mid-1980s to the early 2000s (Fig. 9). Moreover, this is a period when maritime glaciers elsewhere in Norway experienced positive mass balances and were known to advance as a result of enhanced winter precipitation (e.g. Nesje and others, Reference Nielsen2000, Reference Nilsen2008; Andreassen and others, Reference Andreassen, Engeset and Haakensen2005; Engelhardt and others, Reference Engelhardt, Schuler and Andreassen2013). Positive mass balances were also measured at eastern outlet of Langfjordjøkelen in the early 1990s, but the average value for the glacier over the period 1989–95 (including modeled values for 1994 and 1995) remained slightly negative (−1.1 m w.e.: Andreassen and others, Reference Andreassen, Kjøllmoen, Rasmussen, Melvold and Nordli2012b; Andreassen and others, Reference Andreassen, Elvehoy, Kjøllmoen and Engeset2016).
It is also possible that enhanced winter precipitation in the 1990s could have resulted in the presence of more late-lying snow patches on and around glaciers on the Landsat image from 20 August 2001, which might have been misclassified as glaciers. However, winter precipitation in 2000/01 was not particularly high (and was below the 1971–2000 mean) and summer temperatures in 2001 were almost 1°C above the 1971–2000 mean. Thus, we suggest that many glaciers increased in area as a result of the increased precipitation from the mid-1980s to early 2000s, but this pattern was not ubiquitous and the response of individual glaciers was likely modulated by their local geometry and topography (see Section 5.2).
Measurement of glacier length change on a sample of ten glaciers also indicates variable advance and retreat with no clear overall trend (Table 3). Some large glaciers like Steindalsbreen, Strupbreen and Koppangsbreen show a pattern of overall retreat between 1988 and 2001 (averaging between −5 and −15 m a−1), but this does not preclude minor advances over shorter time-scales. For example, minor advances were recorded by NVE at Strupbreen and Koppangsbreen between 1984 and 1988, but both glaciers showed overall retreat between 1988 and 2001 (Hausberg and Andreassen, Reference Hausberg and Andreassen2009). Likewise, a small moraine ridge has been linked to a minor advance of the terminus of Steindalsbreen between 1982 and 1985, during a period (1976–87) when the overall retreat averaged 10–12 m a−1 (Nilsen, Reference Nesje, Bakke, Dahl, Lie and Matthews2016). Thus, our measurements of length change are consistent with the overall pattern of areal change, with some glaciers showing no obvious change in terminus position and others showing a slight increase in length between 1988 and 2001. This variability of both advance and retreat is similar to measurements of net frontal change of glaciers in northern Norway for the period 1980–98 (Andreassen and others, Reference Andreassen, Kjøllmoen, Knudsen, Whalley and Fjellanger2000) and is consistent with area changes in Jostedalsbreen for the 1980s and 1990s (Paul and others, Reference Randall2011) and the Svartisen region between 1968 and 1999 (Paul and Andreassen, Reference Paul, Andreassen and Winsvold2009). Notably, glacier recession was more widespread in the Jotunheim region of southern Norway over a similar time period (Andreassen and others, Reference Andreassen, Paul, Kääb and Hausberg2008), suggesting that glaciers in more maritime regions benefitted more from the enhanced precipitation during the mid-1980s and 1990s than their more continental counterparts (see also Nesje and others, Reference Nielsen2000; Reference Nilsen2008; Andreassen and others, Reference Andreassen, Engeset and Haakensen2005).
5.1.4. 2001–14
The period 2001–14 shows a very clear signal of shrinkage and the total glacier area decreased by ~−14 km2 or −13%. This equates to the highest reduction in the area of any of the epochs we measured (Table 2) and indicates an average shrinkage of −1% a−1. A similar acceleration in areal loss from the early 2000s has also been identified across many other regions of Norway (Nesje and others, Reference Nilsen2008; Paul and others, Reference Randall2011; Winsvold and others, Reference Østrem, Haakensen and Melander2014; Andreassen and others, Reference Andreassen, Elvehoy, Kjøllmoen and Engeset2016). Our measurements of length changes also indicate a clear pattern of retreat and an acceleration in the mean retreat rate from −5.1 m a−1 (1988–2001) to −8.9 m a−1 (2001–14). Similar rates of retreat for the period 2011–14 have been measured in the field at Sydbreen (−12.3 m a−1) and Steindalsbreen (−11 m a−1) (Kjøllmoen and others, Reference Kjøllmoen, Andreassen, Elvehøy, Jackson and Giesen2016). Not surprisingly, this acceleration in retreat coincides with a strong warming trend since the 1990s (Fig. 8), particularly in winter, but also in summer (Fig. 7). The 2000s were >1.5°C warmer than the 1900s and 1910s, and the rate of warming since the 1980s is ~0.5°C per decade (Fig. 8). Moreover, this strong warming trend has been accompanied by a decrease in both summer and winter precipitation since the early 2000s. Thus, the combination of increased temperatures and decreased precipitation between 2001 and 2014 has led to a marked acceleration in glacier shrinkage. Field observations from Steindalsbreen (Fig. 13) suggest that the rate of retreat is continuing. The length change extracted from our inventories in 2001 and 2014 averaged −15.6 m a−1 and field measurements in September 2017 indicated a further −120 m of retreat between the 2010 marker-post and the glacier's terminus, equating to −17.1 m a−1 over those 7 years. This retreat is likely to be accelerated by the growth of a proglacial lake in front of the terminus that is forming in an overdeepening cut into bedrock below the icefall (Fig. 13).
Field photograph of the terminus of Steindalsbreen (glacier ID 288: see also map in Fig. 2) on 21 September 2017 taken from the position of the terminus in July 2010 (located by the marker post in the foreground). The terminus is now ~120 m from the terminus in 2010, equating to a retreat rate of 17.1 m a−1 over the 7-year period. Note the formation of a large proglacial lake that has developed since 2010 (Photo: C R Stokes).

The strong climatic warming post-2000s is also evident in the nearest measured mass-balance record of Langfjordjøkelen. Mass-balance measurements since 1989 show an increasingly negative cumulative mass balance since the mid-1990s, primarily driven by an increasingly negative summer balance, but also by winter balances that are becoming less positive (Andreassen and others, Reference Andreassen, Kjøllmoen, Rasmussen, Melvold and Nordli2012b). Indeed, the sensitivity of the annual mass balance to a 1°C warming is −0.76 m w.e., whereas a 10% increase in precipitation would only result in +0.2 m w.e. (Andreassen and others, Reference Andreassen, Kjøllmoen, Rasmussen, Melvold and Nordli2012b). Put another way, precipitation would have to increase by 40% to compensate for a 1°C warming. Elsewhere in Norway, mass balances modeled from a temperature-index model indicate a dramatic decrease in both summer and winter balances between 2000 and 2010 that is unprecedented in the previous four decades (Engelhardt and others, Reference Engelhardt, Schuler and Andreassen2013).
5.2. Topographic controls on glacier retreat
While the climatic trends identified above have governed the broad patterns in glacier change, it is clear that the response of individual glaciers is modulated by their local topographic setting and geometry. As expected, the strongest significant relationship is between glacier size and absolute area loss (Fig. 12a), which has been reported in several studies from other mountain regions (e.g. Granshaw and Fountain, Reference Grove2006; Paul and others, Reference Randall2011; Stokes and others, Reference Stokes, Corner, Winsborrow, Husum and Andreassen2013). This is because larger glaciers tend to descend to lower elevations where gently-sloping tongues are more sensitive to climate warming, i.e. only a small increase in the ELA can rapidly increase the ablation area. However, and as noted above, this relationship is reversed when area change is expressed as percentage loss, indicating that although smaller glaciers lose less ice in absolute terms, it is often a much larger proportion of their area (Fig. 12b). This relationship is very weak (r 2 = 0.05) and shows a similarly large scatter to other regional studies of glacier change in Norway (e.g. Baumann and others, Reference Baumann, Winkler and Andreassen2009; Paul and others, Reference Randall2011), but it is statistically significant (p = 0.01). Very small glaciers (e.g. <0.5 km2) are more susceptible to radiation from surrounding terrain (Demuth and others, Reference Demuth2008) and they tend to have higher volume-to-area and perimeter-to-area ratios, which makes them shrink faster than larger glaciers for any given ablation rate (Granshaw and Fountain, Reference Grove2006). That said, the large scatter in the response of smaller glaciers (Fig. 12b) likely reflects the fact that some are located in topographically favourable locations (e.g. sheltered cirques fed by wind-blow snow) that allows them to survive longer than might otherwise be the case (Kuhn, Reference Kuhn, Warrick, Barrow and Wigley1993; De Beer and Sharp, Reference De Beer and Sharp2009; Paul and Andreassen, Reference Paul, Andreassen and Winsvold2009; Stokes and others, Reference Stokes, Corner, Winsborrow, Husum and Andreassen2013). Thus, while glacier size is a good predictor of absolute area change, it is a rather poor predictor of the percentage glacier area change, which suggests that other factors are modulating glacier recession.
Previous work on Lyngen emphasised the importance of high-elevation plateau-icefields as source areas for glaciers at much lower elevations, such that valley glaciers at low elevations are more likely to persist if they are connected to high-elevation source areas (Gellatly and others, Reference Gellatly, Whalley and Gordon1986; Gordon and others, Reference Gordon, Whalley, Gellatly, Ferguson and Gardner1987, Reference Gordon, Whalley and Gellatly1995; Whalley and others, Reference Whalley, Gordon, Gellatly and Hansom1989, Reference Winsvold, Andreassen and Kienholz1995; Rea and others, Reference Slingsby1999). Our dataset is based on a much larger sample of glaciers than previous work (typically limited to <10 glaciers) but clearly supports some of these earlier assertions. For example, one of the strongest significant relationships is between the maximum elevation of glaciers and the percentage area change (1953–2014), indicating that glaciers with high elevation catchments have tended to show less shrinkage than those at lower elevations and that this relationship is significant (Fig. 12f). Gordon and others (Reference Gordon, Whalley, Gellatly, Ferguson and Gardner1987) suggested that glaciers with maximum altitudes below ~1400–1500 m had shown substantial ice loss and we note that the median percentage change for glaciers with maximum elevations >1400 m was just−9% (n = 39), whereas it was −28% for those with maximum elevations <1400 m (n = 86). Thus, the importance of high elevation catchments and plateau-icefields perhaps explains why maximum elevation is a much stronger predictor of glacier recession compared with the minimum elevation of glaciers (Fig. 12c, d). It may also explain why glacier slopes show little relationship with percentage area change (Fig. 12h). There is a tendency for glaciers with gentler slopes to retreat more in absolute terms than those with steeper slopes (cf. Winsvold and others, Reference Østrem, Haakensen and Melander2014), but this is likely to reflect the relationship between glacier size and slope (r 2 = 0.27), which is highly significant (p < 0.0001), i.e. mean slopes tend to be lower on larger glaciers which retreat more in absolute terms (Paul and others, Reference Randall2011).
5.3. Future evolution of glaciers on the Lyngen Peninsula
Climate projections for the region suggest that summer temperatures will increase by ~2°C by 2021–50, compared with 1961–90 epoch (Hanssen-Bauer and others, Reference Hanssen-Bauer and Nordli2015). Over the same period, winter precipitation is likely to increase by ~10%, but there is much more uncertainty (Hanssen-Bauer and others, Reference Hanssen-Bauer and Nordli2015). Any increase in winter precipitation is likely to make winter balances more positive, but increases in summer temperature are likely to make summer balances much more negative and, importantly, extend the length of the ablation season. In addition, increased temperatures will reduce the fraction of precipitation falling as snow. Thus, any increase in precipitation will only partly counteract increased temperatures and it is clear that glaciers will continue to retreat. The mass-balance records from Langfjordjøkelen suggest that this small ice cap is already far from an equilibrium state, with 7 of the 12 years (1998–2009) indicating that the eastern outlet had no accumulation area remaining at the end of the summer (Andreassen and others, Reference Andreassen, Kjøllmoen, Rasmussen, Melvold and Nordli2012b). This led Andreassen and others (Reference Andreassen, Kjøllmoen, Rasmussen, Melvold and Nordli2012b) to speculate that the glacier may disappear completely within the next 50–100 years.
Our data suggest that numerous glaciers have already lost >50% (with some >80%) of their area since 1953 and might disappear within the next 50 years, possibly within the next decade. Previous work noted that some of the lower-most plateau-icefields on Lyngen (<1500 m) had rapidly diminished from the early 1950s to 1980s (Gordon and others, Reference Gordon, Whalley, Gellatly, Ferguson and Gardner1987, Reference Gordon, Whalley and Gellatly1995). For example, Gordon and others (Reference Gordon, Whalley and Gellatly1995) reported that Bredalsfjellet (ID 236: maximum elevation: ~1400 m) was ~0.5 km2 in 1953, but had reduced to 0.21 km2 in 1979 and earlier work by Gordon and others (Reference Gordon, Whalley, Gellatly, Ferguson and Gardner1987) had predicted that it ‘might soon cease to exist’ (p. 752). Our data for the same glacier indicate an area of 0.47 km2 in 1953, 0.16 km2 in 1988, 0.17 km2 in 2001 and just 0.019 km2 in 2014 (the fourth smallest in the inventory). This represents a 96% decrease in area between 1953 and 2014 and an 89% decrease between 2001 and 2014, indicating that the glacier is close to the threshold for viability and is likely to vanish in the next few years if recent climatic trends persist. Moreover, there are 17 glaciers in the 2014 inventory that are <0.05 km2 and all of these have maximum elevations below ~1400 m. Given our data indicating that small glaciers with low maximum elevations are most vulnerable (Section 4.4, Fig. 12), it is not unreasonable to suggest that most, if not all, of these glaciers, will disappear in the next decade or so and be absent from future inventories. More generally, Nesje and others (Reference Nilsen2008) also used the altitudinal difference between the maximum elevation and the ELA, together with the size of the glacier, to assess glacier vulnerability to future climate change throughout Norway. Using climate projections for the period 2071–2100 that indicate an increased summer temperature of 2.3°C and a 16% increase winter precipitation, they suggested that glacier area is likely to be reduced by ~34% across mainland Norway and that seven of the 34 largest glaciers are likely to have melted away by 2100.
6. CONCLUSIONS
This paper presents new data on glacier change on the Lyngen Peninsula, northern Norway, using data from existing glacier inventories (1953, 1988, 2001) together with a new inventory from 2014 and glacier limits reconstructed during the LIA (Ballantyne, Reference Ballantyne1990). The most recent LIA maximum culminated ~1915 was likely driven by cooler air temperatures in the preceding four decades. Our results show that shrinkage from this position was widespread and driven by a rapid warming trend in the 1930s and 1940s that resulted in an areal reduction of ~−11% by 1953 (−0.29% a−1) and with length changes averaging −18.3 m a−1 (n = 9). Analysis of a much larger sample of glaciers between 1953 and 1988 (n = 126) revealed further areal shrinkage of ~−10% (−0.29% a−1) that was likely driven by a continued response to the warming of the 1930s and 1940s, and a decrease in precipitation from the mid-1970s to late 1980s. Length changes for a small sample of glaciers (n = 10) averaged −8.4 m a−1 between 1953 and 1988. Between 1988 and 2001, however, the total glacier area increased by +4.3% (+0.33% a−1). This lies within the measurement error, but is consistent with records of enhanced winter precipitation and occurred at a time when numerous maritime glaciers elsewhere in Norway experienced positive mass balances (Nesje and others, Reference Nielsen2000; Reference Nilsen2008; Andreassen and others, Reference Andreassen, Engeset and Haakensen2005; Engelhardt and others, Reference Engelhardt, Schuler and Andreassen2013). Measurements of glacier length changes (n = 10) also revealed a mixture of both advance and retreat between 1988 and 2001.
By far the most rapid rates of areal shrinkage (~1% a−1) occurred between 2001 and 2014, which saw a −13% reduction in total glacier area, which we link to declining precipitation and a sharp increase in the rate of warming since the early 1990s. Indeed, the decade beginning in 2000 was >1.5°C warmer than the decade beginning in 1910 and the rate of warming since the 1980s has been ~0.5°C per decade. The new inventory for 2014 includes 148 glaciers that occupy 95.7 km2. If the areal shrinkage of a small sample of glaciers (n = 18) between the LIA and 2014 is representative of the study region, then our results suggest that the total glacier area on the Lyngen Peninsula has decreased by ~−30% in the last century (~1915–2014), with most of the larger valley glaciers retreating −0.5 to −1.5 km over this period. The response of individual glaciers is highly variable, but our analysis shows that small glaciers with relatively low maximum elevations (~1400 m) have decreased the most in terms of their percentage loss since 1953 (with some losing up to 96%) and that these glaciers will be most vulnerable to future climate change (cf. Nesje and others (Reference Nilsen2008)). Under realistic warming scenarios of ~2°C by 2050 (Hanssen-Bauer and others, Reference Hanssen-Bauer and Nordli2015), we predict that several (~20) small glaciers <0.05 km2 that lie below ~1400 m will disappear in the next few decades. The terminus retreat of several of the larger glaciers will continue and, in some settings, this is likely to lead to the further development of proglacial lakes that may have implications for hydro-electricity generation and outburst floods.
DATA AVAILABILITY
Outlines from 1953, 1988 and 2001 are available from the CryoClim data portal (www.cryoclim.net/) and from the GLIMS database (www.glims.org). The 2014 inventory will also be submitted to GLIMS and is available from the lead author. Meteorological data are available for download from www.eKlima.no.
ACKNOWLEDGEMENTS
This research was part-funded by an anonymous alumni donation to the Department of Geography, Durham University. We thank Chris Elliott and Ollie Carpenter for fieldwork assistance in 2015, and Phil Steinberg together with numerous undergraduates from the Department of Geography, Durham University, who have participated in ‘Arctic’ fieldtrips to Lyngen. We also thank W. Brian Whalley and Colin Ballantyne for sharing their wealth of knowledge on glaciers in this region. The Centre for Arctic Gas Hydrate, Environment and Climate (CAGE), at the Department of Geology at UiT, the Arctic University of Norway hosted CRS as a Visiting Researcher during the completion of this manuscript and he would also like to acknowledge funding from People Programme (Marie Curie Actions) of the European Union's Seventh Framework Programme FP7/2007-2013/ under REA grant agreement no. 317217 (‘Glaciated North Atlantic Margins (GLANAM) project). This work is also a contribution to the project Copernicus bretjeneste (Contract NIT.06.15.5), which is partly funded by the Norwegian Space Centre through Copernicus. We thank two anonymous reviewers for their encouraging comments, the scientific editor, Joseph Shea and the Chief Editor, Graham Cogley.


 Open access