


INTRODUCTION
Influenza A viruses cause both natural and experimental infections in humans and animals, and interspecies transmission of these viruses also occurs frequently [1]. Co-infecting influenza viruses could undergo genetic reassortment in a permissible host, such as the pig, leading to generation of novel reassortants [Reference Zhou2]. In 2009, a novel influenza A(H1N1) virus, which was to become pandemic, emerged in North America. This virus, later officially referred to as influenza A(H1N1)pdm09 virus (afterward abbreviated as H1N1pdm09 in this paper), was a reassortant with genes from classical swine, North American avian, human seasonal and Eurasian avian-like influenza viruses [Reference Smith3]. In the post-pandemic period, the virus is now known to circulate as a seasonal strain in humans [4].
The virus has also been detected among swine populations in different parts of the world, including North America [Reference Nelson5], Europe [Reference Simon6], South America [Reference Schaefer7], Australia/Oceania [Reference Holyoake8, Reference Deng9] and Asia [Reference Hiromoto10, Reference Takemae11]. Moreover, in the post-pandemic period, genetic reassortment between H1N1pdm09 and other influenza A viruses has been observed to occur especially in pigs [Reference Vijaykrishna12]. H1N1pdm09 has also been detected among pigs in Africa. For instance, Njabo et al., Ducatez et al. and Adeola et al. provided molecular and/or antigenic evidence of the presence of the 2009 pandemic influenza virus among pigs in Cameroon, Togo and Nigeria, in that order, at various times from 2010 to 2014 [Reference Njabo15–Reference Adeola, Olugasa and Emikpe17].
Spatial analysis of influenza viruses has been conducted in different parts of the world. For instance, analysis of the 2009 influenza H1N1 pandemic in the United States revealed that the pandemic was characterised by significant spatial heterogeneity. This was because while the 2009 spring wave was found to be restricted mainly to northeastern cities, the larger fall wave affected the whole country [Reference Gog13]. Another study also reported the spatial clustering of swine influenza in Ontario, Canada in 2001 and 2003. In that study, the most likely spatial clusters of cases for each subtype and strain was identified by a spatial scan statistic in a purely spatial Bernoulli model [Reference Poljak14]. Since active circulation of the pandemic virus and co-circulation with endemic influenza A viruses in pigs are important for generation of novel reassortants [Reference Lycett18], this study was conducted to determine the presence of H1N1pdm09 among pigs in Ibadan, Nigeria and assess the relationship between identified viruses and H1N1pdm09 previously isolated from pigs in Africa. Spatial clusters of H1N1pdm09 infection in the study area were also investigated, and risk factors associated with transmission of the virus at the human–swine interface were identified.
METHODS
Ethics statement
This study was approved by the Nigerian National Veterinary Research Institute's Animal Use and Care Committee (NVRIAUCC). In line with The Principles of Humane Experimental Technique, the impact of the procedures on the well-being of animals was minimised by ensuring that specimens were collected by trained personnel early in the morning to reduce heat stress. Moreover, the duration of restraint and handling was minimised. Informed consent was also obtained from each pig handler administered a questionnaire.
Study location
This study was carried out in Ibadan, the metropolitan capital of Oyo State, Nigeria. The city is located in the South-western geo-political region of the country, between latitude 7°15′00″N, longitude 3°45′00″E and latitude 7°34′00″N longitude 4°05′00″E. It is a prominent transit point between the coastal region and the areas in the hinterland of the country. The city and its environs accounts for 11 of the 18 local government areas (LGAs) in Oyo State, Nigeria [Reference Ajayi19].
Sampling method and specimen collection
Collection of swine nasal swab specimens was carried out during the 2013–2014 and 2014–2015 early influenza seasons (December to March). Specimens were collected mostly from adult pigs sampled at the main public abattoir in Ibadan (afterward referred to as Ibadan abattoir) and also from different age groups of pigs in nine piggeries (identified herein as Ibadan farm 1–6 and Akufo farm 1–3) within the study area. These sites were selected based on geographical distribution and representation within Ibadan and environs. At each location, pigs encountered were stratified by age groups, and individual pigs were subsequently selected for sampling by simple randomisation.
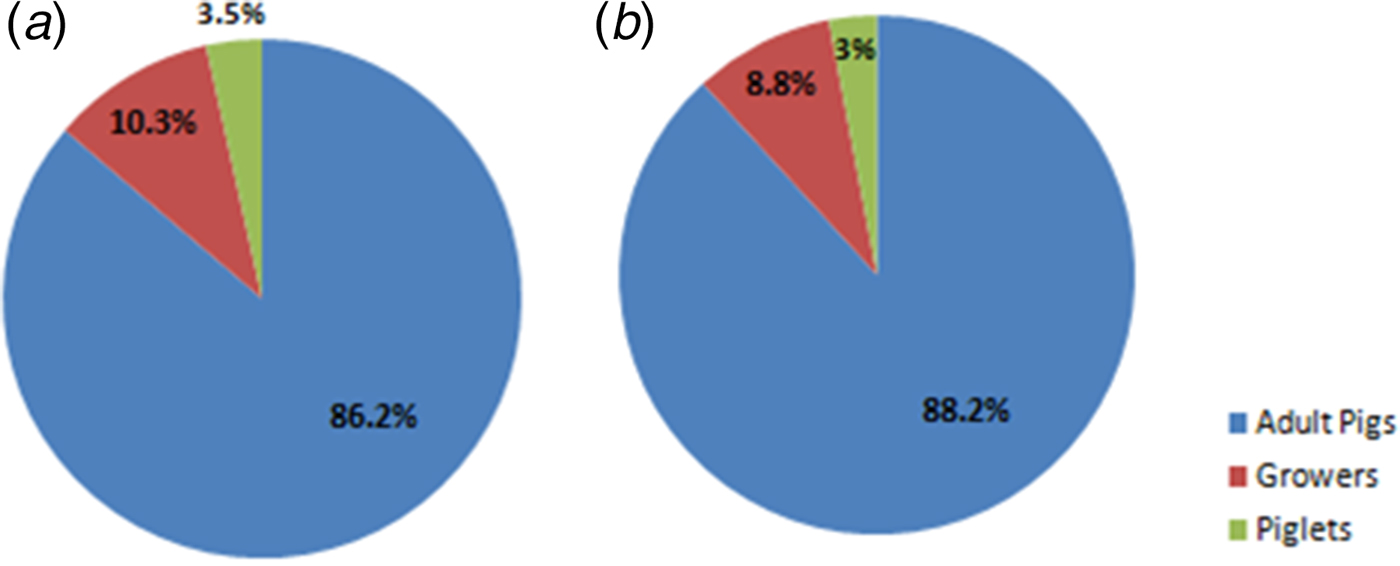
Premised on a previous report on the prevalence of influenza in pigs in Ibadan, Nigeria [Reference Adeola, Adeniji and Olugasa20], the estimated prevalence was taken to be 14·0% for Ibadan. At a 95·0% confidence level, the minimum representative sample size for the study population was calculated, as previously described, to be 185·01 [Reference Daniel21]. However, in order to improve the accuracy of results from the study, 218 pigs were used for this study. These pigs were either Landrace or Duroc breeds, and they did not show clinical signs of respiratory disease at the time of specimen collection. The proportions of specimens collected for the two influenza seasons, based on categories of pigs, are shown in Fig. 1. In order to enhance their inclusion, younger pigs, which were poorly represented during the first year of the study, were also purposively sampled at three locations (Akufo farm 1, Ibadan farm 3 and Ibadan farm 5) during the 2014–2015 influenza season.
Pie charts showing proportions of specimens collected from different categories of pigs. (a) Chart for 2013–2014 influenza season. (b) Chart for 2014–2015 influenza season.
Specimens were collected aseptically as previously described [Reference Adeola, Adeniji and Olugasa20] in 2 ml cryo-vial containing virus transport medium. These were immediately transferred into an ice-pack for transport to the laboratory for testing or storage at −80 °C. Laboratory work was conducted at the Molecular Biology Laboratory of the Centre for Control and Prevention of Zoonoses (CCPZ), University of Ibadan and at the Molecular Biology Laboratory, Bioscience Centre, International Institute of Tropical Agriculture (IITA), Ibadan, Nigeria.
Viral RNA extraction and influenza virus detection
Viral RNA was extracted from swine respiratory specimens using the ZR Viral RNA Mini Kit (Zymo Research Corporation, Irvine, CA, USA) according to the manufacturer's instructions. Sixty of the specimens collected at Ibadan abattoir, Ibadan farm 1, Ibadan farm 2 and Akufo farm 1 were pooled to reduce diagnostic cost. Pooling was done in groups of 3 (each pool contained 200 µl aliquots from each specimen), based on site of collection, pen in which pigs were located, and age group of pigs, prior to RNA extraction. The concentration and purity of the extracted RNAs were tested using a nanodrop reader (NanoDrop 2000/2000c Spectrophotometer, Thermo Scientific, Wilmington, DE, USA). RNA concentrations were recorded in ng/μl and purity was read at 260/280 nm.
The influenza A type-specific one-step RT-PCR was carried out with forward primer M30F2/08 (5′-ATGAGYCTTYTAACCGAGGTCGAAACG-3′) and reverse primer M264R3/08 (5′-TGGACAAANCGTCTACGCTGCAG-3′) [Reference Eisfeld, Neumann and Kawaoka22, 23], with One Taq® One-Step RT-PCR Kit (New England BioLabs, Ipswich, MA, USA). The steps involved are summarised as follows. Reagents and samples were taken out from storage and thawed on ice. Reaction components were mixed in sterile RNase-free microfuge tubes to make a 50 µl reaction volume. The reaction mix was prepared by adding 25 µl of One Taq One-Step Reaction Mix (2×), 2 µl of One Taq One-Step Enzyme Mix (25×), 2 µl of Gene-specific Forward Primer (10 µM), 2 µl of Gene-specific Reverse Primer (10 µM) and 14 µl of Nuclease-free water. To this, 5 µl of RNA template was added. Control reactions were also included.
Haemagglutinin (HA) subtyping one-step RT-PCR was carried out with the same RT-PCR Kit and protocol, with forward primer H1F1 (5′-AGCAAAAGCAGGGGAAAATAAAAGC-3′) and reverse primer H1R1264 (5′-CCTACTGCTGTGAACTGTGTATTC-3′) for H1N1pdm09 [23, Reference Lednicky and Loeb24]. PCR products were analysed in agarose gel as described by the WHO [23].
Sequencing and phylogenetic analysis
Positive PCR products representative of the two seasons of this study, and locations from which H1N1pdm09 cases were detected, were purified using ExoSAP (New England BioLabs, Ipswich, MA, USA), according to manufacturer's instructions. Sequencing of the M gene was done in both forward and reverse directions with the BigDye® Terminator v3·1 Cycle Sequencing Kit (Applied Biosystems, Inc., Foster City, CA, USA) according to manufacturer's instructions on a 3500XL Applied Biosystems capillary sequencer. Sequences were compiled, manually edited and analysed using the Geneious 9·1·4 software (Biomatters Limited, Auckland, New Zealand), and alignment of each sequence was created using MUSCLE [Reference Edgar25] provided in the software. Sequence searches were done using the Megablast (highly similar sequences) option of BLAST algorithm (NCBI, Bethesda, MD, USA). Phylogenetic relationships were inferred by Neighbor-Joining (NJ) algorithm available in MEGA version 6.0 (MEGA6) [Reference Tamura26].
In addition to sequences obtained through BLAST searches, all available African swine influenza virus M gene sequences (including the only one previously described in Nigeria), M gene sequence of the prototype H1N1pdm09 strain (A/California/04/2009), and African human H1N1pdm09 M gene sequences from 2013 to 2015 were retrieved from GenBank and included. Some other human H1N1pdm09 M gene sequences which circulated in other countries in 2014 and 2015 were also included to enhance the robustness of the analysis. Evolutionary distances were computed using Maximum Composite Likelihood (MCL) and Kimura-2 methods and are in the units of the number of transitional substitutions per site, and the rate of heterogeneity among sites was modelled as a 4-category discrete gamma distribution. The number of bootstrap replications was set to 1000. Phylogenetic trees were rooted to the M gene of A/chicken/France/150169a/2015(H5N1).
Nucleotide sequence accession numbers
Nucleotide sequences of the four viruses from this study are available in GenBank under accession numbers: KX429677-KX429680.
Data
Case definition
The case definition was based on recommendations by the World Health Organization (WHO), the World Organization for Animal Health (OIE) and the Food and Agricultural Organization of the United Nations (FAO) [23, 27, 28]. Premised on these recommendations, a sample was considered positive for H1N1pdm09 if results from tests using two different PCR targets (e.g. primers specific for universal M gene and A(H1N1)2009 HA gene) were positive. Thus, all pigs which tested positive, by RT-PCR, during this study were considered as confirmed cases. Cases were restricted to those from this study because data on confirmatory diagnosis of influenza in pigs in Ibadan and environs were unavailable at relevant government agencies and parastatals. Other H1N1pdm09-negative influenza A viruses detected during this study were also exempted because they did not fit into the case definition.
Focused group discussion
Prior to this study, information relating to practices within pig farms in the study area was obtained during focused group discussion with consenting members of the Pig Farmers’ Association of Nigeria, Oyo State branch, during one of their periodic meetings. Members of the local branch of this association represented owners of commercial pig farms within Ibadan and environs. Many of these piggery owners had herd sizes ranging from 20 to 100, and were directly involved in the day-to-day activities of their farms as workers. Large farms, in which more pigs were reared, also existed. Findings from this group discussion were partly used for risk assessment and they aided in the preparation of a questionnaire which was adapted to the study area.
Questionnaire survey
Enrolled pig handlers were humans who had had regular contact with live pigs, either within commercial pig farms or pig slaughter houses, for at least 6 months prior to the commencement of the study. Administration of the questionnaire to pig handlers was done by trained personnel. Technical terms were avoided as much as possible to ensure that respondents clearly understood the questions. Where such terms had to be used, their meanings were explained to the respondents. Information on routine farm practices, health of pig handler, farm biosecurity, awareness about swine and human influenza, and other relevant details were obtained. Informed consent was obtained from all pig handlers who were administered the questionnaire.
Statistical analyses
Data from questionnaire
Data from the questionnaires were collated, and epidemiological and spatial features related to H1N1pdm09 infection at the human–swine interface were identified. Categorical data obtained, using the Likert scale, were processed, as previously described [Reference Kamimura29, Reference Sullivan and Artino30]. For instance, data on ‘pig handler's awareness about swine influenza’ were obtained on a 4-point Likert scale (4 = no knowledge about swine influenza, 3 = limited knowledge about swine influenza, 2 = substantial knowledge about swine influenza, 1 = advanced knowledge about swine influenza). For data on ‘proximity of pig handler's residence to a pig farm’, a 4-point Likert scale was also used (4 = lives on pig farm, 3 = lives within 5 km of pig farm, 2 = lives within 10 km of pig farm, 1 = lives outside 10 km of pig farm). Scaling was done, based on answers provided by respondents to relevant questions, by trained personnel who administered the questionnaire.
Descriptive statistics on the seven epidemiological and spatial features were prepared from quantitative data and scores from categorical data. In line with previous reports [Reference Sullivan and Artino30–Reference Olugasa32], these were aggregated to location level and then related to cases of H1N1pdm09 for risk analysis. These features were grouped into two sub-sets of spatial variables. Group 1 comprised features related to degree of proximity and contact between pig handlers and pigs, whereas Group 2 comprised features related to pig handler's health and awareness about influenza.
Purely spatial scan statistic
High-risk local spatial clusters of H1N1pdm09 infection were detected by Kulldorff's two-dimensional spatial scan statistic [Reference Kulldorff33]. SaTScan software version 9.4.2 [34] was used to run purely spatial scan statistic to determine whether or not the cases were randomly distributed over space in Ibadan and environs. This method is premised on the use of circular window which represents the circular geographical area, and it scans for clusters in space. The scan statistic is advantageous because it controls for covariates and limits pre-selection bias by not specifying a priori observed set of cases within a cluster. In addition, the method does not require a priori knowledge of the population size for elevated risk [Reference Olugasa32, Reference Kulldorff33, Reference Kulldorff35].
In this study, H1N1pdm09 cases were assumed to have a Poisson distribution at each location [Reference Dhewantara36]. Spatial size of scan window was set at 50% of total population at risk and cluster radius of 10 km. A Monte-Carlo approach with 999 repetitions was performed to test the null hypothesis that there was no difference in relative risk (RR) between H1N1pdm09 clusters. Values of P < 0·05 were considered to be statistically significant. The cluster with the highest log-likelihood ratio (LLR) and RR was regarded as the cluster least likely to have occurred by chance, while others with significant LLR were considered as secondary clusters [Reference Olugasa32, 34, Reference Dhewantara36].
Classical regression model
The relationship between H1N1pdm09 cases and seven selected spatial variables was first tested by single variable regression analysis, using the ordinary least squares (OLS) regression model. In the absence of spatial auto-correlation, this model would sufficiently explain the relationship between H1N1pdm09 cases and the spatial variables [Reference Norman31, Reference Olugasa32]. However, where spatial auto-correlation exists, the OLS model would lead to biased estimation of parameters and incorrect inference [Reference Norman31, Reference Dhewantara36].
Spatial lag regression model
The spatial lag regression (SLR) model, in contrast to spatial error model, integrates the influence of unmeasured independent variables and also stipulates an additional effect of neighbouring attribute values (the lagged-dependent variable). In other words, it integrates spatial effects through inclusion of spatially lagged-dependent variables as predictors. The model was estimated by first creating spatial weights matrix based on the seven spatial features to be tested. This method provides unbiased regression estimates using a Maximum Likelihood approach (ML Spatial Lag) [Reference Norman31, Reference Olugasa32].
The seven spatial features identified were sorted into two sub-groups in order to ensure a robust analysis which reveals the effects of characteristics of the two groups separately. Group 1 comprised features related to level of pig handler's proximity to and contact with pigs. Features under this group were (i) proximity of pig handler's residence to a pig farm; (ii) frequency of visit of pig handler to pig pen; (iii) approximate time spent each week with pigs and (iv) approximate time spent each week in other pig farms or with pigs from different farms. Group 2 comprised features related to pig handler's health and awareness about influenza. These were (v) pig handler's awareness about swine influenza; (vi) presence of influenza-like illness among pig handlers and (vii) Handler's knowledge about signs of human influenza.
The regression model was defined by:
 $$y{\rm} = \rho Wy + X\beta + \varepsilon $$
where y is an N defined by 1 H1N1pdm09 case; ρ is the scalar spatial coefficient; Wy is an N defined by 1 weighted matrix of H1N1pdm09 cases; X is an N defined by k matrix of explanatory variables; β is a k defined by 1 vector of parameters; ε is an N defined by 1 vector of random error terms [27, Reference Sullivan and Artino30].
Data analyses were carried out using the Spatial Analyst Software of ArcGIS 10·3 (Environmental Systems Research Institute, Redlands, CA, USA) and GeoDa [Reference Anselin, Syabri and Kho37] version 1·8. Values of P < 0·05 were considered to be statistically significant.
Evaluation of model fitness for identification of risk factors
A seven symmetric spatial weights matrix, created by the queen contiguity method, was used for Moran's I and Lagrange Multiplier (LM) tests for evaluation of OLS regression residuals for evidence of spatial auto-correlation. The OLS and SLR models were subsequently compared using the Akaike information criterion (AIC), Schwarz criterion (SC) and R 2 value. In line with previous studies, the model with lower AIC and SC, and higher R 2 values was considered to have better model fitness [Reference Olugasa32, Reference Anselin, Syabri and Kho37, Reference Haworth and Cheng38].
RESULTS
Molecular detection of H1N1pdm09 infection and phylogenetic analysis
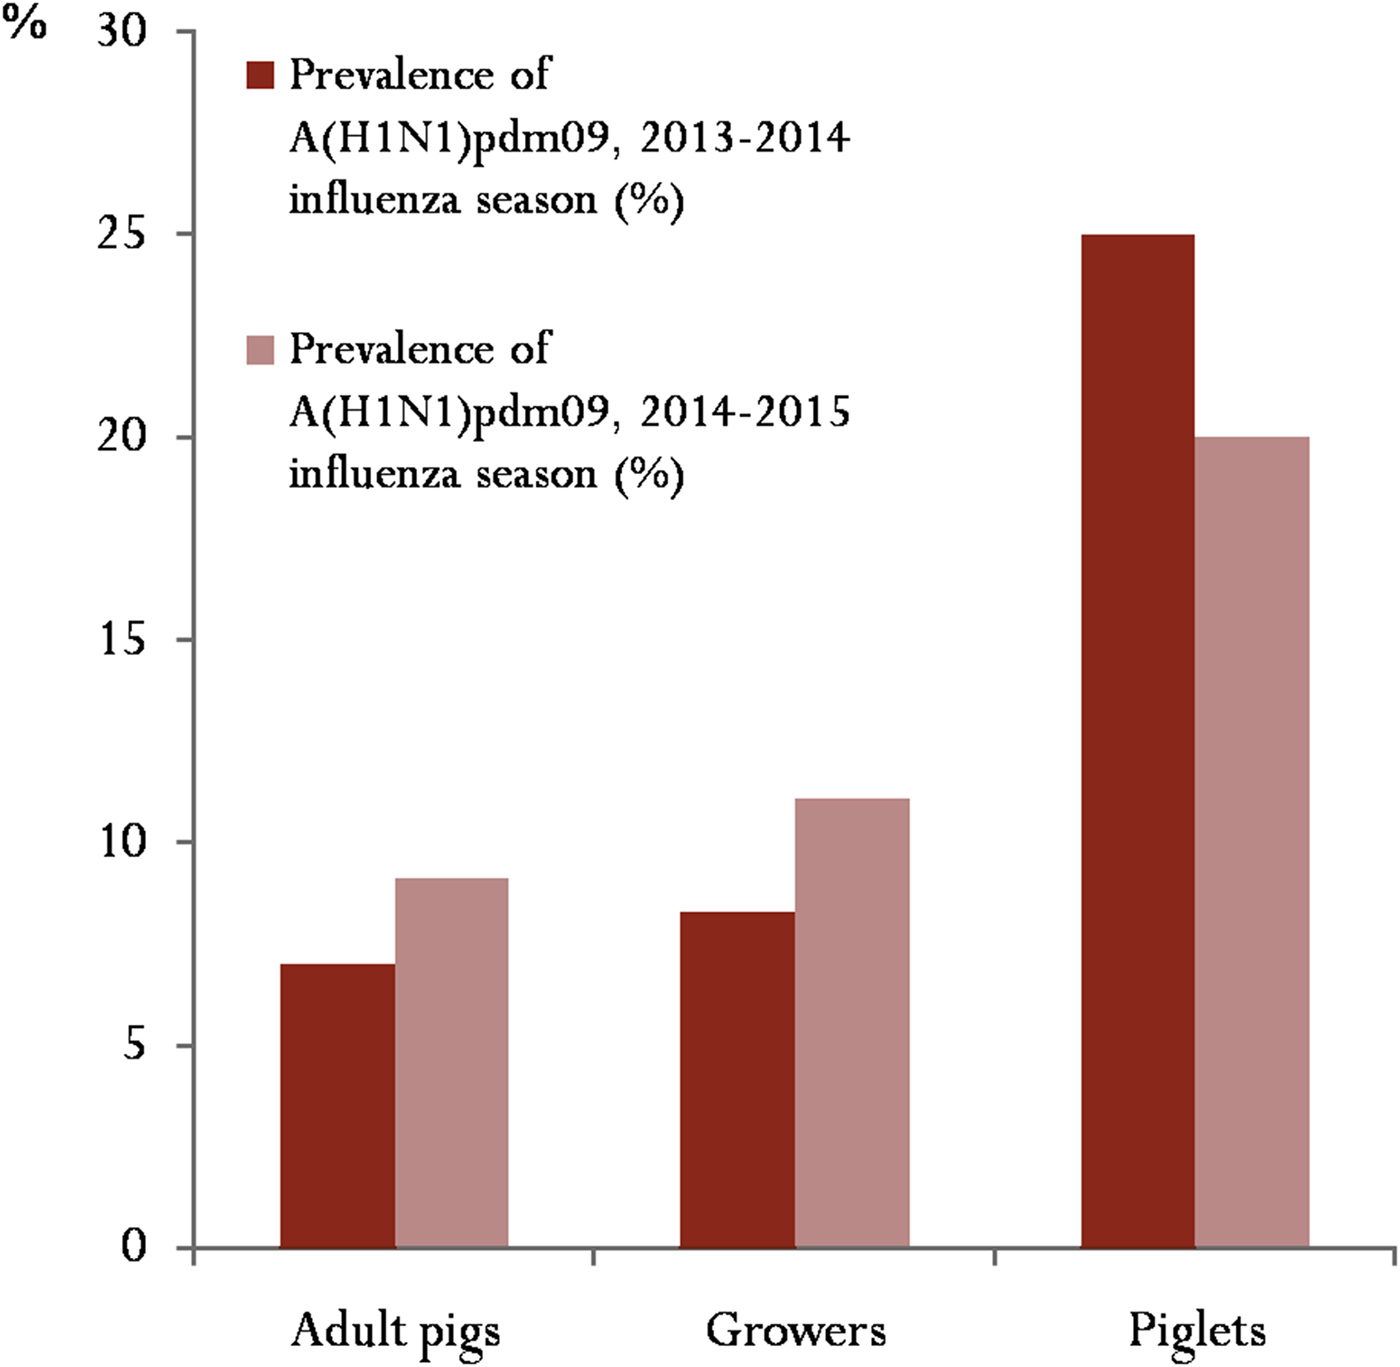
Twenty-four (11·0%) of the 218 swine specimens tested were positive for the presence of influenza A viruses. Nineteen of the 24 influenza A viruses detected were subtyped as H1N1pdm09. More analyses, based on antigen-detection quantitative ELISA and subtyping RT-PCR, were conducted to ascertain the subtypes of the other H1N1pdm09-negative influenza A viruses detected. Their results revealed that the remaining five influenza A viruses detected were of subtype H3N2. During the two influenza seasons of this study, H1N1pdm09 was detected with an overall prevalence of 8·7%. Prevalence in 2013–2014 and 2014–2015 early influenza season was 7·8% and 9·8%, respectively. Figure 2 reveals that adult pigs (boars, sows and gilts), which constituted over 87·0% of pigs sampled, consistently had the lowest prevalence during the study period. Out of the 10 locations used for the study, H1N1pdm09 was confirmed at three locations. The proportion of cases per positive location is shown in Table 1.
Prevalence of influenza A(H1N1)pdm09 based on categories of pigs sampled during the study: for this study, adult pigs included boars, sows and gilts.
Distribution of cases of influenza A(H1N1)pdm09 per positive location during the study

Phylogenetic analysis revealed that the M gene sequences of the strains obtained from Nigerian pigs during this study clustered with sequences of H1N1pdm09 strains which circulated in humans from 2011 to 2013 (Figs 3 and 4). The M gene sequences of the four Nigerian strains were subsequently compared with the prototype H1N1pdm09 strain (A/California/04/2009 FJ969513), with strains previously isolated from pigs in Nigeria [A/swine/Nigeria/12VIR4047-09/2011(H1N1)] and neighbouring West and Central African countries [A/swine/Togo/ONA32/2013(H1N1) and A/swine/Cameroon/11rs149-198/2010(H1N1), respectively], and with some closely related human strains. Viruses sequenced in this study grouped with A/Delhi/051/2011(H1N1) and A/Delhi/053/2011 (H1N1), and A/Ghana/KM001/2015(H1N1) with high bootstrap values of 94 and 75, in that order (Fig. 3). Figure 4 (based on the Kimura-2 parameter method) highlights the close relationship between viruses from this study and some human isolates from the same period (2013–2015). Comparative nucleotide sequence analysis of the M genes of the four viruses sequenced in this study with A/Delhi/051/2011(H1N1), A/Delhi/053/2011(H1N1), A/California/04/2009 FJ969513, A/swine/Nigeria/12VIR4047-09/2011(H1N1), A/swine/Togo/ONA32/2013(H1N1) and A/Ghana/KM001/2015(H1N1) is shown in Table 2. Amino-acid differences included non-conservative substitutions in the protein sequence of A/swine/Nigeria/IBDVR004/2015(H1N1) (S13F) and A/swine/Nigeria/IBDVR004/2015(H1N1) (A22 T and T37P).
Phylogenetic analysis of Influenza Matrix Gene Sequences by NJ method (complete tree). Phylogenetic relationship was inferred using the NJ method. The tree is drawn to scale, and evolutionary distances were computed using the MCL method. The rate variation among sites was modelled with a gamma distribution (shape parameter = 4). Nigerian swine isolates sequenced in this study are indicated by solid triangle (▲). The prototype H1N1pdm strain (A/California/04/2009) is indicated by inverted solid triangle (▼). Isolates from neighbouring African countries and a previous isolate from Nigeria are indicated by solid square (■). The number of bootstrap replications was set to 1000, and bootstrap values above 60 are labelled on major tree branches. Evolutionary analyses were conducted in MEGA6 and trees were rooted to A/chicken/France/150169a/2015(H5N1) KU310450. Scale bar indicates the number of nucleotide substitutions per site.

Relationship between M genes of influenza viruses from this study and some H1N1pdm09 strains which circulated in humans during the period of the study (2013–2015). The tree is drawn to scale, and evolutionary distances were computed using the Kimura-2 parameter method. The rate variation among sites was modelled with a gamma distribution (shape parameter = 4). Nigerian swine isolates sequenced in this study are indicated by solid triangle (▲), while related human strains isolated from humans from 2013 to 2015 are indicated by solid square (■). The number of bootstrap replications was set to 1000, and bootstrap values above 60 are labelled on major tree branches. Evolutionary analyses were conducted in MEGA6 and trees were rooted to A/chicken/France/150169a/2015(H5N1) KU310450. Scale bar indicates the number of nucleotide substitutions per site.

Nucleotide identity of M genes of sequences from this study and some previously identified influenza A(H1N1)pdm09 strains

* Mean sequence identity with influenza A(H1N1)pdm09 strains from pigs in West Africa.
† Mean sequence identity with closely related human strains.
Sequence identity of Nigerian swine strains with related human strains was generally higher than with swine strains.
Spatial distribution of H1N1pdm09 cases
Nineteen cases of swine H1N1pdm09 infection were confirmed during this study, and these occurred mainly in locations within 2 neighbouring LGAs out of the 11 LGAs in Ibadan and environs. The locations were Ibadan abattoir and Ibadan farm 1 in Ibadan North LGA and Akufo farm 1 in Ido LGA. A high-risk spatial cluster (hotspot) of swine H1N1pdm09 infection was identified in Ibadan North LGA, Oyo Sate (Ibadan abattoir) (Fig. 5). This significant principal cluster (P = 0·0046) had RR of 4·71, LLR of 5·66, and contained 15 (15·0%, n = 100) H1N1pdm09 cases. A descriptive summary of the primary and secondary purely spatial non-overlapping clusters of H1N1pdm09 cases is provided in Table 3. In all, 18 (10·5%, n = 171) H1N1pdm09 cases were confirmed in Ibadan North LGA.
Spatial pattern of influenza A(H1N1)pdm09 infection among pigs in Ibadan, Nigeria, 2013–2015: (a) Oyo State in south-western Nigeria; (b) enlarged view showing the study area (Ibadan and environs) and the LGA, with clusters of influenza A(H1N1)pdm09 infection highlighted in green and red, respectively.

Purely spatial clusters of influenza A(H1N1)pdm09 infection at location level in Ibadan, Nigeria, 2013–2015

* The case confirmed at Akufo farm 1 was not included in this table.
Ordinary least squares regression model
Based on the results from the OLS regression model, none of the seven spatial features tested was significant as a risk factor for human-to-swine transmission of H1N1pdm09 in Ibadan, Nigeria. A descriptive summary of the classical regression analysis on potential risk factors of H1N1pdm09 infection in the study area is presented in Table 4.
Risk analysis using OLS regression model

B, beta; s.e., standard error; P < 0·05.
* Potential risk factors of influenza A(H1N1)pdm09 transmission at the human–swine interface.
Spatial lag regression model
SLR results revealed that only the Group 1 model was significant, with a likelihood ratio test result of 6·51 (P = 0·0107), R 2 value of 0·91, lag coefficient (Rho) of 0·99 and AIC of 42·56, in comparison to Group 2 predictors [likelihood ratio test result of 0·13 (P = 0·7136), R 2 = 0·21, lag coefficient (Rho) = −0·19 and AIC = 59·83]. Two important risk factors were identified from this group. These were hours spent each week with pigs and hours spent each week in other pig farms or with pigs from different farms. A descriptive summary of SLR results for Groups 1 and 2 is provided in Table 5.
Analysis of risk of human-to-swine transmission of influenza A(H1N1)pdm09 in Ibadan, Nigeria using the SLR model

B, beta; s.e., standard error; P < 0·05.
For each group, effects of selected spatial variables were evaluated jointly.
Model fitness and risk factors
Evaluation of OLS regression residuals revealed high level of spatial dependence, with LM (lag) of 9·26 (P = 0·00) and LM (error) of 1·00 (P = 0·00). Robust LM (lag) and Robust LM (error) were 10·00 and 1·00, respectively. AIC and R 2 values obtained for the OLS model were 52·68 and 0·88, whereas those estimated for SLR model were 42·56 and 0·91, in that order. Premised on these findings, which revealed the presence of significant spatial auto-correlation, a spatial lag model was fitted on all the seven spatial features for the identification of risk factors, with Moran's I = 0·24. Thus, two highly significant risk factors (statistical significance was maintained even at P < 0·01), associated with H1N1pdm09 infection among pigs in Ibadan, Nigeria, were identified. These were hours spent each week with pigs (R 2 = 0·90, P-value = 0·0018) and hours spent each week in other pig farms or with pigs from different farms (R 2 = 0·91, P-value = 0·0001).
DISCUSSION AND CONCLUSION
Discussion
Few cases of human infection with H1N1pdm09 were reported in West and Central Africa, including Nigeria, during the 2009 influenza pandemic. In the post-pandemic period, the virus has been circulating globally as a seasonal human influenza virus [4]. In fact, because of the predominance of the pandemic virus over other seasonal influenza viruses in different countries, the pandemic virus has been consistently recommended as a component of both trivalent and tetravalent influenza vaccines in the last few years [39]. For the 2017–2018 northern and southern hemispheres influenza seasons, A/Michigan/45/2015 (H1N1) pdm09-like virus has been recommended as a component of both trivalent and tetravalent vaccines [40].
During this study, overall prevalence of H1N1pdm09 among pigs in Ibadan (8·7%) was lower than those previously reported in the West African sub-region [Reference Ducatez, Awoume and Webby16, Reference Meseko, Odaibo and Olaleye41]. Since young, growing pigs are thought to be more susceptible to influenza virus infection [Reference Ducatez, Awoume and Webby16], the lower prevalence obtained in the present study could be due to the fact that more than 87·0% of pigs tested were adult pigs. This was partly because specimens were collected mostly from pigs sampled at an abattoir. In addition, due to some restrictions encountered at some of the pig farms, very few piglets were made available for sampling. Future studies involving detection of influenza viruses in the sub-region should therefore include higher proportion of younger, growing pigs.
As previously noted, pigs sampled during this study did not show clinical signs of respiratory disease at the time of specimen collection. Nonetheless, H1N1pdm09 was observed to have circulated among these pigs during both years of the study. This is also similar to previous results obtained from studies in Nigeria [Reference Adeola, Adeniji and Olugasa20, Reference Adeola, Olugasa and Emikpe42], Togo, also in West Africa [Reference Ducatez, Awoume and Webby16], and Brazil [Reference Amorim43] during which influenza viruses were detected among apparently healthy pigs. This underscores the importance of strict adherence to measures which reduce interspecies transmission of influenza viruses at the human–swine interface. These measures include regular hand washing with soap or detergent, enforcement of sick leave for pig handlers (especially during the onset of clinical symptoms of influenza, at which time the shedding of the virus is expected to peak), controlled entrance of visitors to pig pens, provision of farm boots and clothing for handlers and visitors, restriction of handlers to specific units of farm and training of pig handlers on recognition of signs of influenza in humans and pigs [Reference Adeola, Olugasa and Emikpe17]. Compliance with these preventive measures should be ensured and monitored, even in the absence of clinical signs of swine influenza.
Minimal genetic variation was observed between the M genes of viruses detected during the two influenza seasons of this study. Moreover, while S13F substitution has been detected among influenza A viruses in Vietnam [Reference Anwar, Lal and Khan44], the significance of this and other mutations identified in this study has not been clearly elucidated. However, the variations observed in nucleotide and protein sequences of these viruses could be a reflection of the gradual evolution of these viruses, especially through antigenic drift. Sequence and phylogenetic analyses of M genes also revealed that H1N1pdm09 identified among pigs during this study formed a cluster distinct from H1N1pdm09 strains previously isolated from pigs in Nigeria, neighbouring West (Togo) and Central (Cameroon) African countries and Kenya in East Africa. On the other hand, the strains identified in the present study clustered with strains of H1N1pdm09 which circulated in humans prior to and during this study, from 2011 to 2015. These findings are suggestive of introduction of new strains of H1N1pdm09 into Nigerian swine populations through human-to-swine transmission. They may also be indicative of genetic reassortment between these human strains of the pandemic virus and endemic H1N1 strains circulating in Nigerian pigs. We hope to carry out whole-genome sequencing of these isolates in order to conclusively interpret these findings.
In recent years, new strategies for treatment and prevention of influenza have been developed. However, the risk of interspecies transmission, leading to reassortment of influenza viruses and generation of novel strains, has also increased globally [Reference Nelson5–Reference Schaefer7, Reference Hiromoto10–Reference Vijaykrishna12, Reference Adeola45]. Results from the present study revealed the presence of geographical hotspots of swine H1N1pdm09 infection in Ibadan and environs (Fig. 6). Ibadan abattoir was identified as the primary cluster with LLR and RR of 5·66 and 4·71, respectively. This implies that pigs within this location had 371·0% increase in risk of infection by the pandemic virus above those within other locations in the study area. In the light of the risk factors identified during this study, the heightened risk of human-to-swine transmission of H1N1pdm09 at this location was due to elevated contact time with pigs. Such closeness between humans and pigs at this abattoir could be due to two key factors.
Heat map of the spatial clusters of influenza A(H1N1)pdm09 infection among pigs in Ibadan, Nigeria, 2013–2015: (a) Ibadan, Oyo State, Nigeria; (b) enlarged view showing locations and cluster intensities at the primary and secondary spatial clusters.

To start with, pigs transported from different locations were kept, sometimes for up to 3 days, within a lairage located very close to the meat shop. This increased the likelihood of contact between humans (butchers, cleaners, salespersons and even customers) and these pigs. This is similar to the findings of Amorim et al. who reported that continuous exposure of abattoir workers to pigs in Brazil increased the risk for interspecies transmission of influenza A virus [Reference Amorim43]. Second, because of very dismal levels of personal and environmental hygiene observed at the abattoir, viruses shed by abattoir workers during the symptomatic phase of influenza could readily infect these pigs. This is corroborated by previous findings which observed that pig handlers in Nigeria had very low levels of compliance with measures which significantly reduce interspecies transmission of influenza [Reference Adeola, Olugasa and Emikpe17, Reference Adeola and Adeniji46].
To significantly reduce interspecies transmission of influenza and other diseases at this location therefore, the design of the abattoir should be overhauled to ensure adequate location of the lairage. Pig handlers and other personnel should also be trained on how to maintain adequate personal and environmental hygiene, and compliance with recommended measures should be monitored. Mandatory sick leave for pig handlers is also recommended, especially during the early symptomatic phase of influenza, during which shedding of the virus is expected to peak.
Although infected pigs were mostly slaughtered within 1–3 days after their arrival at the abattoir, the public health significance of H1N1pdm09 infection of these pigs lies in the fact that prolonged exposure of pig handlers to infected pigs at the abattoir could increase the likelihood of swine-to-human transmission of influenza viruses. In addition, some growers brought to the abattoir were occasionally kept close to human dwellings for an extended period of time. Such growing pigs, which have been found to have higher susceptibility to influenza virus infection, could play a role in genetic reassortment and evolution of influenza viruses [Reference Hiromoto10–Reference Vijaykrishna12, Reference Ducatez47]. They may also spread the virus to other pigs or humans. This possibility is even more noteworthy because of occasional foray of extensively raised pigs into the premises of the abattoir.
In rural communities of West Africa, including Nigeria, pigs are commonly reared under extensive (range) system. However, the number of intensive commercial swine production facilities has increased rapidly in recent years, especially in cities such as Ibadan in South-West Nigeria. Many of these farms have inadequate biosecurity measures (which comprises bioexclusion, biomanagement and biocontainment), and pigs are often moved from one farm to another. Many farm hands also worked in two or more pig farms concurrently. This was the situation at Ibadan farm 1, where a secondary cluster of swine H1N1pdm09 infection was identified during this study. Poor adherence to biosecurity measures at this farm must have also contributed to the higher H1N1pdm09 prevalence obtained at this location. The likelihood of contact between humans and pigs at this location was further increased by the fact that these pigs were routinely exposed to undergraduate students from an adjoining tertiary institution. Strict adherence to biosecurity measures is therefore advocated. Such measures include restriction of handlers to specific units of farm, controlled entrance of students and visitors to pig pens, practice of ‘all-in-all-out’ method and provision of farm boots and clothing for the use of pig handlers, students and visitors [Reference Adeola, Olugasa and Emikpe17].
A veiled but very crucial point, which needs to be brought to the fore, is the fact that while the presence of influenza-like illness in piggery workers did not significantly impact influenza detection in pigs, increased contact of piggery workers with pigs from different farms, and transport of pigs from one farm to another, did. This could be a pointer to the important role of fomites in indirect transmission of influenza viruses from humans to pigs, in addition to direct human-to-swine transmission, in the study area. This is in line with previous studies which reported that influenza A viruses, including H1N1pdm09, could survive on fomites for extended periods of time [Reference Greatorex48, Reference Oxford49]. In addition, fomites could also be involved in indirect transmission of influenza A viruses from infected to uninfected pigs [Reference Allerson, Cardona and Torremorell50]. Thus apart from introduction of influenza viruses into a piggery through infected pigs brought-in from other farms, pig handlers who work concurrently in different piggeries could inadvertently spread influenza viruses from one farm to the other through fomites, such as farm tools, feed and water troughs and boots. Interestingly though, adequate biosecurity remains effective for the prevention of influenza transmission through any of these routes.
Active circulation of H1N1pdm09 in a swine population has been known to enhance the probability of reassortment with other endemic influenza viruses [Reference Lycett18]. Thus, presence and active circulation of the human pandemic strain in Nigerian pigs, due to the risk factors identified during this study, could lead to genetic reassortment between this strain and endemic swine influenza viruses, and generation of novel strains. This pattern of reassortment has been reported in several countries, and they are reported to occur more frequently among isolates from pigs than those from humans [Reference Hiromoto10–Reference Vijaykrishna12, Reference Ducatez47]. Urgent steps should be taken by relevant government ministries and agencies [Reference Vincent51], and other stakeholders in Nigeria (such as the Pig Farmers’ Association of Nigeria), to improve on biosecurity of commercial pig farms and abattoirs by harnessing the recommendations from this study. Campaigns for adoption of adequate bioexclusion, biomanagement and biocontainment measures, in pig farms and abattoirs in West Africa, should also be introduced and sustained in order to prevent the emergence of a new influenza epicentre in the sub-region.
Conclusion
This study has provided molecular evidence of the presence of influenza A(H1N1)pdm09 infection among pigs in Ibadan, Nigeria during the early influenza seasons of 2013–2014 and 2014–2015. In addition, phylogenetic analysis revealed that H1N1pdm09 strains identified in this study formed a cluster different from H1N1pdm09 strains previously isolated from pigs in West Africa. They, however, clustered with H1N1pdm09 strains which circulated in humans just prior to this study, from 2011 to 2013. These findings are suggestive of either introduction of new strains of H1N1pdm09 into Nigerian swine populations through human-to-swine transmission or fomites, or genetic reassortment between H1N1pdm09 and endemic H1N1 strains circulating in Nigerian pigs. We hope to carry out whole-genome sequencing of these isolates in order to conclusively interpret these findings.
Spatial clusters were identified, and pigs within the primary cluster had 371·0% increase in risk of infection by the pandemic virus above those within other locations in the study area. Risk factors for human-to-swine transmission of the pandemic virus were also identified. These were ‘hours spent with pigs from different farms’ and ‘hours spent with pigs’. In addition to the risk of human-to-swine transmission, the risk factors identified also suggest a role for fomites in transmission of H1N1pdm09 to pigs Ibadan, Nigeria. Active circulation of human influenza strains among Nigerian pigs could enhance genetic reassortment with endemic swine influenza viruses and generation of novel strains.
We recommend that targeted sampling of younger pigs should be conducted in Nigeria and other West African countries in order to determine an accurate estimate of prevalence of influenza viruses and enhance analysis of the risk factors for piglet infection. Campaigns for adoption of adequate biosecurity measures, in pig farms and abattoirs in West Africa, should also be introduced and sustained in order to prevent the emergence of a new influenza epicentre in the West African sub-region.
ACKNOWLEDGEMENT
The authors sincerely appreciate the management and personnel of Molecular Biology Laboratory, Bioscience Centre of the International Institute of Tropical Agriculture (IITA), Ibadan for their co-operation during this study.
FINANCIAL SUPPORT
Support for this study was received through a grant from the John D. and Catherine T. MacArthur Foundation to the Center for Control and Prevention of Zoonoses (CCPZ), University of Ibadan, Nigeria (Grant number 97944).
CONFLICT OF INTEREST
None.


