

Bloodstream infections (BSIs) cause morbidity and mortality and are especially concerning in pediatric hematology-oncology (PHO) patients.Reference Ammann, Laws and Schrey 1 Most oncology patients and some hematology patients have a long-term central line that facilitates their treatment, and these devices can be a source of central-line–associated BSI (CLABSI). Other sources of BSI in immunosuppressed PHO patients include disrupted skin or mucosal surfaces, such as the upper or lower gastrointestinal tract, and deep-seated infections. Frequently, an obvious source of BSI cannot be found. CLABSIs in inpatients are considered healthcare-associated infections that are preventable and must be reportedReference Marsteller, Hsu and Weeks 2 to payors and local, state, and federal agencies, with implications for reimbursement.Reference Pronovost, Goeschel and Wachter 3 , Reference Srinivasan, Craig and Cardo 4 As a result, BSI surveillance in PHO inpatients has disproportionately focused on CLABSIs; the Centers for Disease Control and Prevention’s National Healthcare Safety Network (NHSN) surveillance definition of CLABSI is widely used for this purpose. 5 A BSI from an alternate source of infection (other than the central line), defined by the NHSN as “secondary BSI,” has not received similar scrutiny. Additionally, the NHSN definitions of BSI consider skin or oral commensals when a pathogen is isolated in only 1 blood culture (henceforth referred to as single positive blood culture [SPBC]) as potential contaminants that are not reportable. From a patient’s perspective, each BSI subcategory has clinical relevance, including but not limited to hospitalization, antibiotic treatment, and impediment of anticancer treatment.
Two years into a multicenter quality-improvement effort to track and reduce CLABSI in PHO inpatients by standardizing central-line–maintenance care,Reference Bundy, Gaur, Billett, He, Colantuoni and Miller 6 and prompted in part by an undercurrent of skepticism among participating center staff that CLABSI reporting is prone to misclassification, we broadened the scope of data collection to include all BSIs. Our goal was to describe the burden of all BSIs and to interpret CLABSI rates within and across centers in the context of all BSIs. We discuss the value of this patient-centered, holistic approach, how it helps inform interpret reported CLABSI rates and implications for quality-improvement assessments and interventions.
METHODS
Setting
The Children’s Hospital Association (CHA) organized a multicenter PHO QI network in 2009, which was subsequently named the Childhood Cancer and Blood Disorders Network (CCBDN), as part of a portfolio of quality-improvement network projects.Reference Bundy, Gaur, Billett, He, Colantuoni and Miller 6 – Reference Neu, Miller and Stuart 8 The initial focus of the quality-improvement network was to prevent inpatient CLABSIs. Participating centers used defined central-line–maintenance care bundles, met twice a year at in-person workshops to share learning and review results, held monthly webinars, and received monthly reports summarizing CLABSI data and aggregated data for the entire consortium.
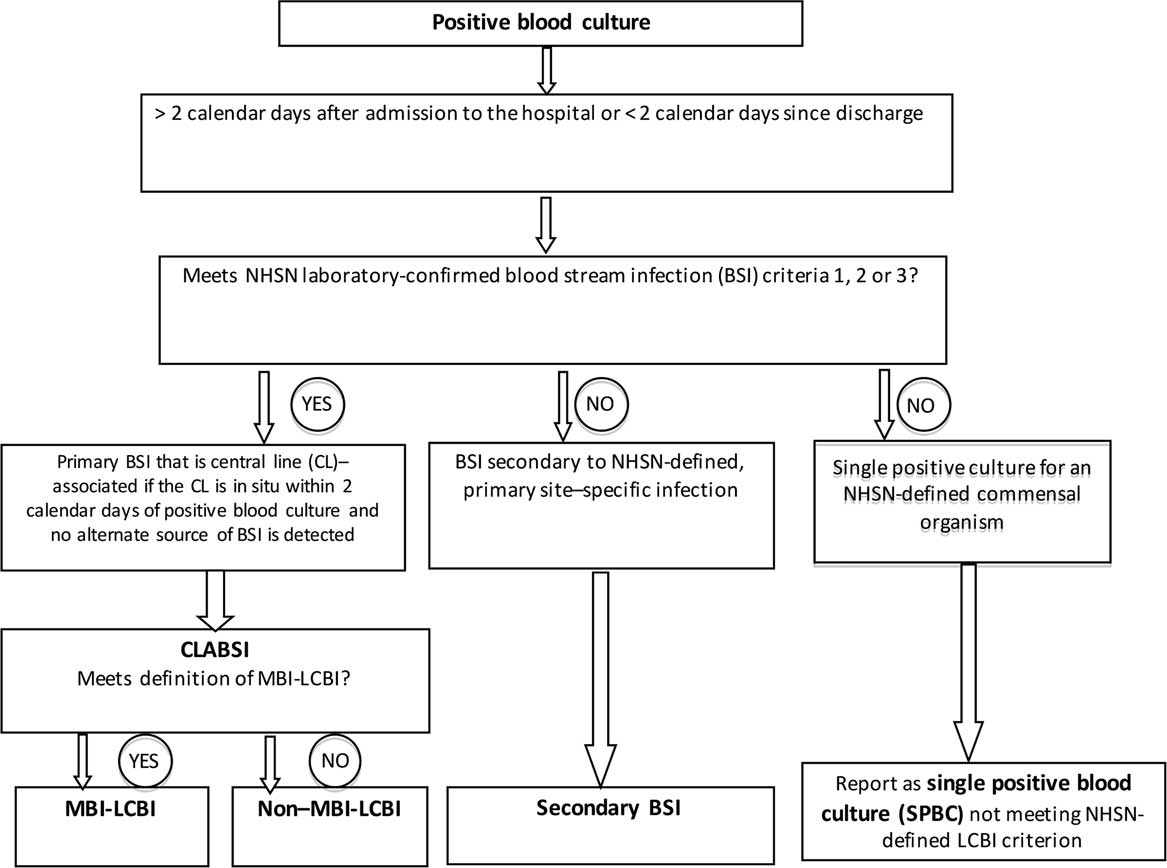
The CCBDN expanded its data collection to all BSIs, including secondary BSI and SPBC, in November 2011. Further classification of CLABSIs as MBI-LCBI or non–MBI-LCBI was instituted in August 2013 (Figure 1). 5 All positive blood cultures assigned to the various BSI categories were tracked and reported in the monthly CCBDN report. The Johns Hopkins University School of Medicine Institutional Review Board (IRB) approved the overarching collaborative; additionally, each unit obtained either approval or a waiver from their local IRB prior to submitting data to CCBDN.
Decision-making tree showing the process of classification of all positive blood cultures in the Childhood Cancer and Blood Disorders Network quality-improvement network.
Definitions
The number of central-line days was calculated per NHSN definitions. 5 A positive blood culture in a PHO inpatient with a central line initiated a process led by local infection preventionists or other assigned staff to identify the source/type of infection. Using applicable NHSN definitions, each positive blood culture was assigned to a specific category: CLABSI (subcategory MBI-LCBI or non–MBI-LCBI), secondary BSI, or SPBC (Figure 1). 5 In January 2015, NHSN made the criteria required for a secondary BSI more stringent. 5
For commensal organisms, the NHSN definition of a “laboratory-confirmed BSI” requires at least 2 positive blood cultures drawn on separate occasions, within 2 calendar days. If only 1 blood culture was positive for a commensal organism, then the SPBC, though not reportable to NHSN, was tracked by the CCBDN. Notably, blood culture practices were site specific and were not standardized across participating centers as part of the CCBDN.
Analytical Approach
During the study period, rates (per 1,000 central-line days) of the 4 subcategories of inpatient BSI (ie, MBI-LCBI CLABSI, non–MBI-LCBI CLABSI, secondary BSI, and SPBC) were calculated monthly, and trends were identified using summary estimates from each quarter of the year. Of the 39 PHO units in 34 centers, 22 reported data over the entire 26 months, 5 reported for >20 months, and 12 reported for various shorter periods.
We calculated the total BSI as the sum of CLABSI, secondary BSI, and SPBC events and then computed the relative contributions of those events to the total BSI rate. The ratios were plotted by event type over time. Additionally, we plotted the trends CLABSI versus non-CLABSI rates at individual centers over time for a descriptive assessment of across-center differences in reporting patterns of the BSI subcategories. Reporting patterns from 3 participating centers are shown as an example to illustrate the potential significance of evaluating across-center differences in BSI reporting.
The proportions of BSIs identified as CLABSI versus those identified as secondary BSIs, before or after the January 2015 changes to the NHSN’s definition of secondary BSI, were examined, and statistical significance of differences was assessed using the χ2 or Fisher’s exact test, as appropriate.
RESULTS
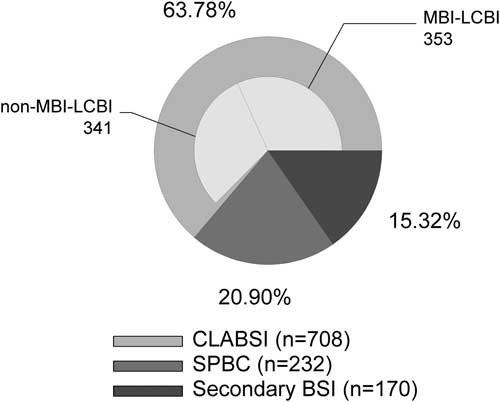
Between August 1, 2013, and September 30, 2015, 39 PHO units in the United States reported 1,110 BSIs over 371,269 central-line days. Among them, 708 BSIs (63.8%) were classified as CLABSI; 170 (15.3%) were classified as secondary BSIs, and 232 (20.9%) were classified as SPBCs (Figure 2). Of the 708 CLABSIs, an MBI-LCBI versus non-MBI-LCBI adjudication was reported for 694 CLABSIs (98%). Among them, 353 (51%) were MBI-LCBIs. For 935 of 1,110 BSIs (84%), an absolute neutrophile count (ANC) value was reported. Furthermore, 185 of 286 non-MBI-LCBIs (65%), 251 of 277 of MBI-LCBIs (91%), 123 of 150 of secondary BSIs (82%), and 157 of 209 of SPBCs (75%) occurred in patients who were profoundly neutropenic (ANC<100 cells/mL). The 2 organisms most frequently associated with SPBC were Staphylococcus species (54%; none were Staphylococcus aureus) and viridans group streptococci (22%; VGS) followed by Bacillus spp. (6%) and Streptococcus spp. (3%). The remainder of the SPBCs (<3% each) included Corynebacterium spp., Micrococcus spp., Actinomyces spp., Peptostreptococcus spp., Proprionibacterium acnes, and other gram-positive organisms not otherwise specified.
Relative proportions of subcategories of bloodstream infection (BSI). Central line–associated BSIs (CLABSI) were further subclassified as mucosal barrier injury–associated, laboratory-confirmed BSI (MBI-LCBI) or non–MBI-LCBI, secondary BSI, or single positive blood culture (SPBC) at participating PHO centers.
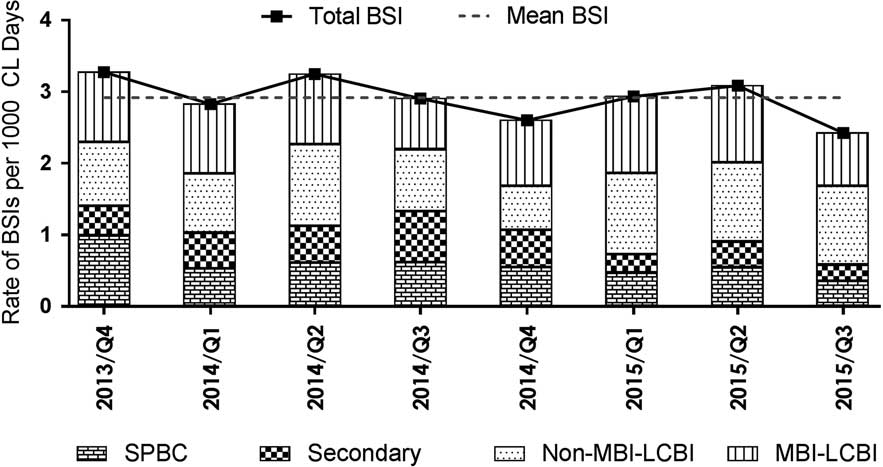
The distribution of the BSI subcategories relative to total BSI by quarters over time is displayed (Figure 3). The numbers of monthly cases reported in subcategories across centers were CLABSI (median, 27; range, 19–43; IQR, 23–30), secondary BSI (median, 7; range, 1–15; IQR, 4–11), and SPBC (median, 9; range, 3–21; IQR, 7–11). Median total central-line days reported per month were 14,480 (range, 11,664–16,338; IQR, 13,575–15,176). There were similar numbers of MBI-LCBIs versus non–MBI-LCBIs. The rate of SPBCs changed little over time; in contrast, secondary BSIs decreased and CLABSIs increased around the time when the definition of secondary BSI was changed. Comparing the periods January–October 2015 and September 2013–December 2014 and not counting the SPBCs, the proportion of BSIs that were classified as CLABSI was higher (88% vs 77%; P<.001), and that of secondary BSIs was significantly lower (12% vs 23%; P<0.001). The proportion of secondary BSIs identified before versus after January 2015 that met the definition of gastrointestinal infections increased from 36.5% to 51.5%, while the proportion of secondary BSIs that met the definition of skin or soft-tissue infections decreased (22.6% to 15.2%); these differences were not statistically significant (P=.32).
Rates of total bloodstream infections (BSIs) and the various subcategories of BSI per 1,000 central-line days plotted quarterly from October 2013 to September 2015. BSI subcategories include central-line–associated BSI (CLABSI), which was further subclassified as mucosal barrier injury–associated, laboratory-confirmed BSI (MBI-LCBI), or non–MBI-LCBI. Secondary BSI and single positive blood culture (SPBC) rates are also shown.
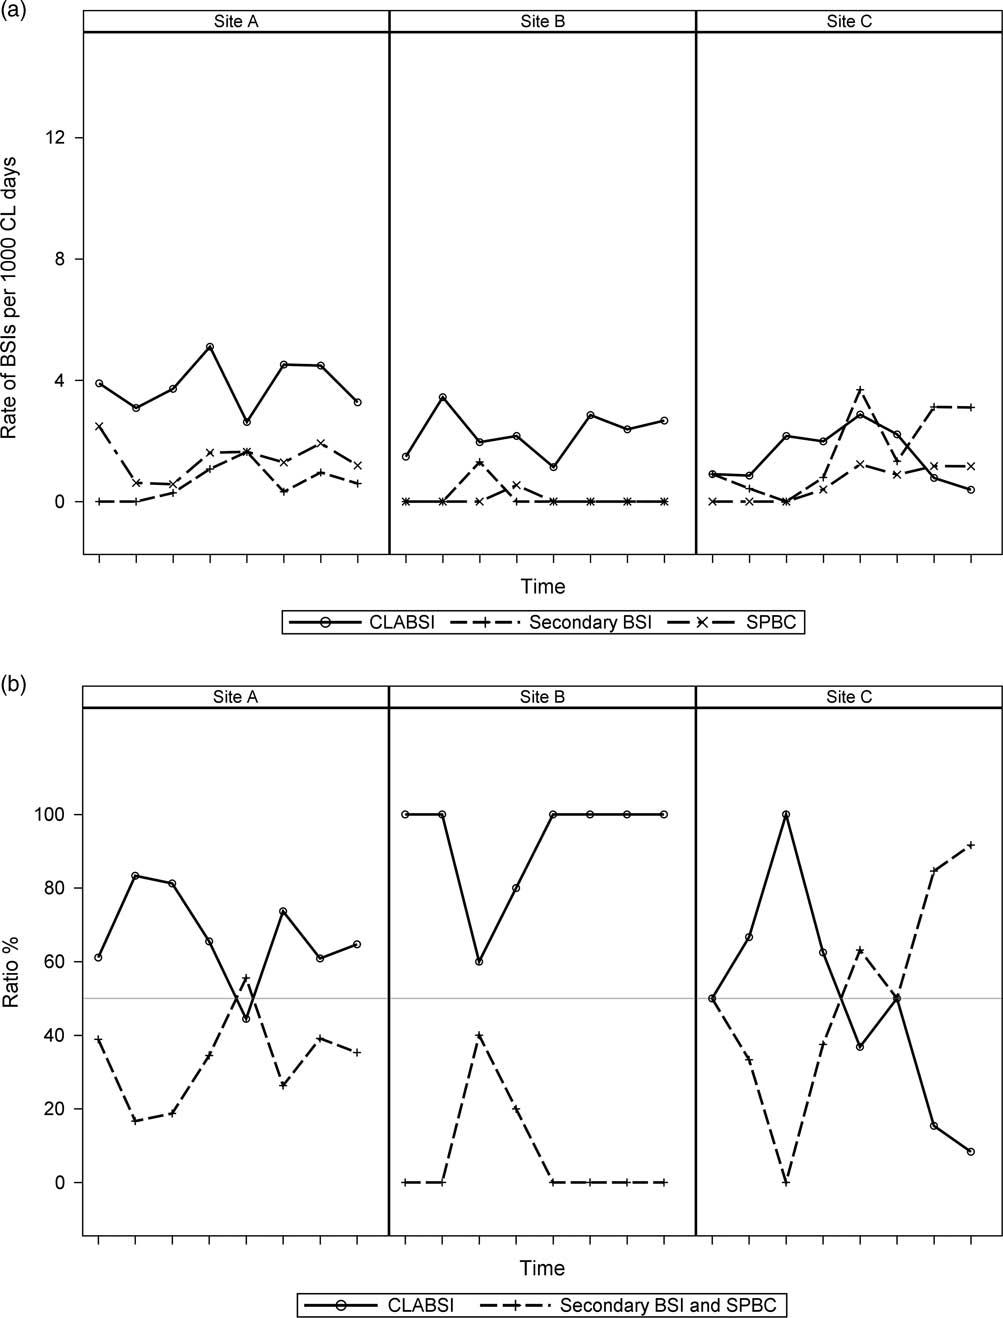
We also assessed across-center differences in trends of reported CLABSI versus secondary BSI and SPBC rates (Figure 4a) and the ratio of CLABSI to non-CLABSI (Figure 4b). Examples of these values at 3 centers were compared and are displayed to show the context that tracking non-CLABSI BSI, provides. Although the centers appeared to be similar when their CLABSI rates were compared, there was a notable difference in reported trends of the other BSI categories and the ratio of CLABSI versus non-CLABSI reports. Center A had comparable CLABSI and non-CLABSI rates, but Center B reported more CLABSI events than non-CLABSI events. In contrast, Center C had a noticeably increasing trend in reporting non-CLABSI events compared with the other 2 centers.
Examples of across-center differences among 3 PHO centers (Sites A-C) in trends of reported rates of central-line–associated bloodstream infections (CLABSIs) versus secondary bloodstream infections and single positive blood cultures (SPBCs) (Figure 4a) and the ratio of CLABSI to non-CLABSI (ie, secondary BSI and SPBC) (Figure 4b). Each notch on the x-axis represents a quarter of the year starting with the fourth quarter of 2013 (October–December) and ending with the third quarter of 2015 (July–September).
DISCUSSION
Using standardized definitions to prospectively categorize all BSIs in a cohort of PHO inpatients across the United States, we showed that the overall burden of BSIs is substantially greater than that of CLABSI alone. We described the relative rates of various subcategories of BSIs to underscore the value of this comprehensive, all–BSI-tracking approach, which allows for a more informed understanding of the factors that influence BSI, including CLABSI, reporting; the transparent, contextual observations (eg, across and within centers) of differences in CLABSI and other BSI reporting. We also evaluated the impact of changes in BSI definitions on such reporting.
From a patient-centered perspective, critically appraising each BSI category for prevention opportunities, developing interventions, and assessing their impact using consistent definitions should be a primary focus of the national discussion in PHO and other subspecialties (eg, pediatric and neonatal intensive care, gastroenterology) and not the narrow view of scrutinizing only CLABSIs.Reference Marsteller, Hsu and Weeks 2 Although CLABSIs are important and should be prevented, other BSIs constitute 37% of all BSIs, affecting clinical care of PHO patients and resulting in significant healthcare charges and unplanned extended hospital admissions, However, these cases are not visible in the public spotlight.Reference Wong Quiles, Gottsch, Thakrar, Fraile and Billett 9 Expanding from a CLABSI-centered approach to a comprehensive all-BSI approach is the first step toward addressing this important category of infections. In a recent review, Simon et alReference Simon, Furtwangler and Graf 10 proposed this approach for pediatric oncology centers, and Fraser and GordonReference Fraser and Gordon 11 previously suggested this approach for all immunocompromised patients.
The national focus on reducing healthcare-associated infections, especially CLABSI in hospitalized patients, regardless of underlying diagnosis, is apparent, appropriate, and has been influential.Reference Srinivasan, Craig and Cardo 4 CLABSIs are considered preventable and discussed as “zero events.” 12 They are considered a measure of less-than-optimal health care with consideration of making related healthcare charges nonreimbursable.Reference Pronovost, Goeschel and Wachter 3 A critical look at what gets reported as CLABSI and how CLABSI reporting relates to and is affected by the other BSI categories has not been described.
The CDC NHSN definitions of CLABSIs 5 are widely used. We and others have shown the variability in application of these definitionsReference Gaur, Miller and Gao 13 – Reference Sexton, Chen and Anderson 15 and their limitations when used to assess immunocompromised populations.Reference Fraser and Gordon 11 Such critique has prompted modifications of these definitions. The nuances and limitations of the definitions used should inform the assessment and interventions currently largely focused on CLABSI. Specifically, with the proposed all-BSI tracking approach, we do not “lose” any infections in the definition shuffle, and the total BSI endpoint provides an objective measure that is not vulnerable to misclassification.Reference Fraser and Gordon 11
The recognition that the dogma “BSIs are CL-associated unless proven otherwise” was not a good fit for specialty populations (eg, PHO patients) led to defining a new category of MBI-LCBI in January 2013Reference See, Iwamoto, Allen-Bridson, Horan, Magill and Thompson 16 and to plans for removing those infections from the CLABSI category. When MBI-LCBIs are no longer counted as CLABSIs, the CLABSI rate in PHO patients will, based on our data and similar results by others,Reference See, Iwamoto, Allen-Bridson, Horan, Magill and Thompson 16 – Reference Metzger, Rucker and Callaghan 19 drop by at least 50%. This decrease may remove CLABSIs from the spotlight, but it makes them no less clinically meaningful or important to prevent. Shelburne et alReference Shelburne, Chaftari and Jamal 20 underscored that caution is needed when using the MBI-LCBI definition. In their study, many patients with definite central-line infections according to strict, clinical, Infectious Disease Society of America criteria were classified as MBI-LCBIs.Reference Shelburne, Chaftari and Jamal 20 It will be important to continue to track, critically appraise and address MBI-LCBIs. This requires, as we propose, keeping MBI-LCBIs on the dashboard of BSIs reviewed by healthcare systems, payors, and the public.
Secondary BSIs have an alternate, NHSN-defined source of infection. We and others have previously shown the variability in identifying primary versus secondary BSIs,Reference Gaur, Miller and Gao 13 which led to updates to the definition of secondary BSI that make the criteria more objective. In this report, we showed a significant decrease in reported secondary BSIs and an increase in reported CLABSIs since the change in secondary BSI definition in January 2015. This observation underscores the point that there may be multiple factors, including a shift in categorization related to changes in definitions, influencing an institution’s CLABSI rate. A comprehensive BSI-tracking process can help better understand a real change in CLABSI rate versus a shift within BSI categories.
SPBCs in which a commensal organism is isolated are considered potential contaminants and are not tracked by NHSN. For example, VGSs are among the group of organisms considered commensals; thus, they require 2 positive, separately collected blood cultures within 2 calendar days to be considered a BSI, per NHSN definitions. 5 Although this approach is reasonable in an otherwise immunocompetent host, in an immunocompromised PHO patient, even an SPBC with VGS may be clinically meaningful and managed as a BSI. In fact, VGS, the second-most common organism category isolated in SPBC events in this study, has been noted to cause sepsis, especially in patients with AML.Reference Kurt, Flynn and Shenep 21 , Reference Okamoto, Ribeiro, Srivastava, Shenep, Pui and Razzouk 22 A center’s blood culture practice also affects whether a VGS positive culture gets reported as a BSI to NHSN. If a center routinely collects only 1 set of blood cultures from PHO patients as part of the initial evaluation of fever in patients with a single-lumen CL, then conceivably, there would be a relative underreporting of CLABSIs because SPBCs are not reportable, compared to another center that routinely collects 2 separate sets of blood cultures with each new febrile episode.Reference Simon, Furtwangler and Graf 10 The NHSN defines “separate occasion” blood draws as “collected in a manner which suggests that 2 separate blood-draw site preparations were performed.” 5 This underscores the need for standardization of blood culture practices, a process we have initiated within the CCBDN. This is another reason for including this potentially clinically meaningful (yet vulnerable to miscategorization) subcategory we call SPBC, which amounted to one-fifth of all BSIs in our comprehensive data set on the proposed dashboard of BSIs.Reference Wong Quiles, Gottsch, Thakrar, Fraile and Billett 9 , Reference Simon, Furtwangler and Graf 10
We propose that those who assess and act on CLABSI rates within or across centers also be attuned to errors or shifts in BSI categorization. For example, the displayed results show the strikingly different secular trends at Center C compared with Centers A and B. Are these differences because of a more aggressive identification of secondary sources, effective measures for decreasing CLABSI, or a change in blood culture collection and/or processing procedures such that there was a relative increase in SPBC episodes? Answers to these and related questions require a comprehensive dashboard, with tracking of all BSIs, an approach not previously described for PHO or other at-risk populations.
Hospital data sets for public access on the Medicare.gov Hospital Compare website, 23 for example, may show 2 hospitals to be comparable based on reported CLABSI rates but not their differences in reporting other BSIs. These differences potentially provide a more comprehensive risk of a BSI at those hospitals. The lack of patients’ understanding about hospital-acquired infection data has been reported,Reference Masnick, Morgan and Sorkin 24 and ways to improve their understanding have been proposed.Reference Masnick, Morgan and Macek 25 The identification of approaches to simplify visualizing not only CLABSIReference Rajwan, Barclay, Lee, Sun, Passaretti and Lehmann 26 but all BSI outcome data for all healthcare consumers and providers is essential. Therefore, displaying the “total BSI rate” alongside the CLABSI rate could be a consideration.Reference Fraser and Gordon 11
In conclusion, we submit that tracking and displaying all BSIs alongside CLABSI rates, for QI or surveillance purposes, is recommended in PHO patients. We acknowledge as a limitation of this work that the accuracy of categorization and reporting of BSI events relies on the staff at each participating center and was not audited. To our knowledge, the CCBDN is first to show how this holistic, patient-centered approach can be implemented at a multicenter level. SPBCs can be clinically relevant in the immunocompromised host, may help better explain the context of other BSIs, and should be tracked. Finally, while public reporting of CLABSIs as preventable healthcare-associated infections should continue, the messaging should include the overall context of BSIs and the limitations of the definitions used, such that an informed interpretation of the reported data can be made.
ACKNOWLEDGMENTS
The Childhood Cancer and Blood Disorders Network, results from which are presented in this manuscript, was organized by the Children’s Hospital Association and was set up as a pay-to-participate model in which each participating center contributed to the operating expenses of the network.
This work was possible only because of the collaboration and contributions of the healthcare providers at the centers participating in the CCBDN. These centers include Akron Children’s Hospital, All Children’s Hospital, Ann and Robert Lurie Children’s Hospital, Arkansas Children’s Hospital, Boston Children’s, Children’s Healthcare of Atlanta, Children’s Hospital Alabama, Children’s Hospital and Medical Center, Children’s Hospital Colorado, Children’s Hospital of The King’s Daughters, Children’s Hospital Michigan, Children’s Hospital and Clinics of Minnesota, Children’s Mercy Hospital, Children’s Hospital of San Antonio, Cincinnati Children’s Hospital Medical Center, Connecticut Children’s Medical Center, CMC Dallas, Cohen Children’s Medical Center, Helen DeVos Children’s Hospital, Johns Hopkins Children’s Center, Kaiser Permanente Oakland, Levine Children’s Hospital, Morgan Stanley Children’s Hospital, Nationwide Children’s Hospital, Primary Children’s Medical Center, Shands Children’s Hospital, St. Luke’s Children’s Hospital, St. Jude Children’s Research Hospital, St. Louis Children’s Hospital, Sutter Children’s Center, Texas Children’s Hospital, The Bristol-Myers Squibb Children’s Hospital at Robert Wood Johnson University Hospital, The Children’s Center at Renaissance University of Iowa Children’s Hospital, Upstate Golisano Children’s Hospital, and University of California, San Francisco Benioff Children’s Hospital.
The authors also acknowledge Cindi Winkle, RN (CMC Dallas), for leading the training of staff at participating centers in implementation of the central-line maintenance bundle; Megan Esporas, MPH (Children’s Hospital Association), for her leadership in coordinating the CCBDN; Troy Richardson, PhD (Children’s Hospital Association), for providing strategic statistical support; Nehali Patel, MD (St Jude Children’s Research Hospital), for manuscript review and suggestions; and Angela J. McArthur, PhD, ELS (St Jude Children’s Research Hospital) for scientific editing support.
Financial support: No financial support was provided relevant to this article.
Potential conflicts of interest: A.G., D.G.B., E.W., J.H., M.R.M., and A.B. serve or have served as faculty for the CCBDN. J.L. is a full-time employee of the Children’s Hospital Association. All authors have no other conflicts of interest relevant to this manuscript to disclose.


