


Introduction
Once fallen on the ground, snow naturally settles under gravity. Its density typically increases from 100 kg m−3 for recent snow to ~500 kg m−3 at the end of the winter season (Brun and others, Reference Brun, Martin, Simon, Gendre and Coleou1989), up to 800 kg m−3 for firn (Herron and Langway, Reference Herron and Langway1980) or even to the density of ice on glaciers and ice caps (Goujon and others, Reference Goujon, Barnola and Ritz2003). This densification is associated to changes in the 3-D arrangement of ice crystals and pores, i.e. in the microstructure of the material (Colbeck, Reference Colbeck1982). In turn, this microstructure fully controls the effective properties of the material associated to, e.g. its mechanical behavior (e.g. Theile and others, Reference Theile, Löwe, Theile and Schneebeli2011; Hagenmuller and others, Reference Hagenmuller, Chambon and Naaim2015; Srivastava and others, Reference Srivastava, Chandel, Mahajan and Pankaj2016), heat and vapor diffusion in the snowpack (e.g. Kaempfer and others, Reference Kaempfer, Schneebeli and Sokratov2005; Calonne and others, Reference Calonne, Flin, Geindreau, Lesaffre and du Roscoat2014; Fourteau and others, Reference Fourteau, Domine and Hagenmuller2021) or interaction of the snowpack with electromagnetic waves (e.g. Xiong and Shi, Reference Xiong and Shi2014; Dumont and others, Reference Dumont2021). Understanding the evolution of snow microstructure during settlement is thus critical for accurate snowpack modeling (Lehning and others, Reference Lehning, Bartelt, Brown, Fierz and Satyawali2002; Vionnet and others, Reference Vionnet2012) and for numerous applications such as forecasting the avalanche danger (Schweizer, Reference Schweizer2003), predicting the water run-off in spring (DeBeer and Pomeroy, Reference DeBeer and Pomeroy2017) or estimating the surface energy budget in polar regions (Flanner and others, Reference Flanner, Liu, Zhou, Penner and Jiao2012).
For dry seasonal snow, the settlement process is caused by two main mechanisms, namely dry snow metamorphism and deformation of the ice skeleton (e.g. Schleef and Löwe, Reference Schleef and Löwe2013). Metamorphism results from ice sublimation, vapor transport and solid condensation onto snow grains (Colbeck, Reference Colbeck1997). Under isothermal conditions, this process is controlled by the minimization of the interfacial curvature and leads to a coarsening of snow microstructure (Löwe and others, Reference Löwe, Spiegel and Schneebeli2011). Deformation of the ice skeleton is induced by the mechanical load applied to the material. Depending on the strain rate, this load-induced compaction can either be related to brittle failures of the bonds between the ice grains and granular re-arrangements (e.g. Hagenmuller and others, Reference Hagenmuller, Chambon and Naaim2015), or to visco-plastic creep of the ice matrix (e.g. Wautier and others, Reference Wautier, Geindreau and Flin2017). In this study, we focus on thermal and loading conditions where snow compaction mainly results from the interplay between isothermal metamorphism and deformation of the ice matrix. The main objective was to investigate the interactions between these two processes, and whether their signatures on snow microstructure evolution can be distinguished.
In addition to density, a metric frequently used to characterize snow microstructure is specific surface area (SSA), defined as the ratio between the area of the ice–air interface and the mass of ice. This quantity is sensitive to small-scale features of the microstructure and can be easily computed from X-ray microtomography images of snow samples at typical voxel size of 10 μm (Coléou and others, Reference Coléou, Lesaffre, Brzoska, Ludwig and Boller2001; Flin and others, Reference Flin, Brzoska, Lesaffre, Coléou and Pieritz2004; Kaempfer and Schneebeli, Reference Kaempfer and Schneebeli2007; Hagenmuller and others, Reference Hagenmuller, Matzl, Chambon and Schneebeli2016). The few existing studies that investigated the respective influence of metamorphism and load-induced compaction on the SSA led to contrasted conclusions. Microstructure coarsening induced by curvature-driven metamorphism typically leads to a reduction of the SSA over time (Legagneux and Dominé, Reference Legagneux and Dominé2005; Flanner and Zender, Reference Flanner and Zender2006; Taillandier and others, Reference Taillandier, Domine, Simpson, Sturm and Douglas2007). Schleef and Löwe (Reference Schleef and Löwe2013) showed that, for recent snow (initial SSA ~65 m2 kg−1) at a temperature of $-20^\circ$ C and over timescales of 2 d, this reduction of the SSA is influenced neither by creep-induced densification (under dead loads in the range [0, 0.3] kPa) nor by the initial sample density (in the range [100, 125] kg m−3). In contrast, Schleef and others (Reference Schleef, Löwe and Schneebeli2014a) reported a pronounced effect of compression on the SSA evolution. Their observation is based on strain-controlled compression tests on snow samples with an initial density ranging between 120 and 150 kg m−3, an initial SSA ~33 m2 kg−1, a load up to 15 kPa, and for a duration of ~2 d at a temperature of $-15^\circ$
 C. The authors explained this discrepancy with their former study by the fact that, in the latter case, applied loads were larger and therefore led to significant microstructural changes in the samples and creation of new contacts at the cost of a reduction in the air-ice surface area. Similarly, during strain-controlled compression experiments, Wang and Baker (Reference Wang and Baker2013) observed that the SSA of low-density fresh snow samples (initial SSA of ~130 m2 kg−1) evolved faster than predicted by the coarsening theory of Legagneux and Dominé (Reference Legagneux and Dominé2005), and concluded on a relevant impact of loading on the SSA evolution. Overall, these studies tend to show that SSA might not be sufficient to fully characterize the evolution of snow microstructure during load-induced compaction. The response of this quantity to an applied load appears to vary depending on the initial sample properties and the loading conditions.
In detail, mechanical strength and deformation of snow mostly result from mechanisms taking place at narrow constrictions between grains, also called bonds, where stresses tend to concentrate (Colbeck, Reference Colbeck1997). The importance of these bonds to understand snow physics has long been recognized (Ballard and Feldt, Reference Ballard and Feldt1965; Kry, Reference Kry1975). One may therefore expect the characteristics of the bonding system (e.g. bond number and bond area) to be more sensitive than the SSA to microstructure changes caused by loading. In practice, however, definition of the bonds often relies on arbitrary thresholds, which can hamper the possibility to consistently detect changes in bond topology (Hagenmuller and others, Reference Hagenmuller, Theile and Schneebeli2014b). Owing to data provided by μCT technique, it is now possible to access more objective topological metrics related to the bonding system. Hence, Wang and Baker (Reference Wang and Baker2013) measured an increase of the structure connectivity, presumably related to new bond formation, during their compression experiments. Similarly, Schleef and others (Reference Schleef, Löwe and Schneebeli2014a) observed a decrease of the Euler characteristic, which is indicative of the creation of new contacts.
Is the creation of new contacts a systematic signature of load-induced compaction? How can the concurrent evolutions of the SSA and the contact network be interpreted to disentangle the roles of metamorphism and load-induced deformation on microstructure evolution? To further investigate these issues, we conducted oedometric experiments on snow samples using dead loads up to 4.7 kPa. High-resolution μCT scans performed at a regular frequency during the tests were used to follow the evolution of sample density, SSA, as well as two independent topological metrics related to the bonding system, namely the Euler characteristic and the minimum cut surface as defined in Hagenmuller and others (Reference Hagenmuller, Theile and Schneebeli2014b). Interestingly, this latter quantity can give access not only to the bond number, but also to the average bond size.
Methods
Oedometric compression tests
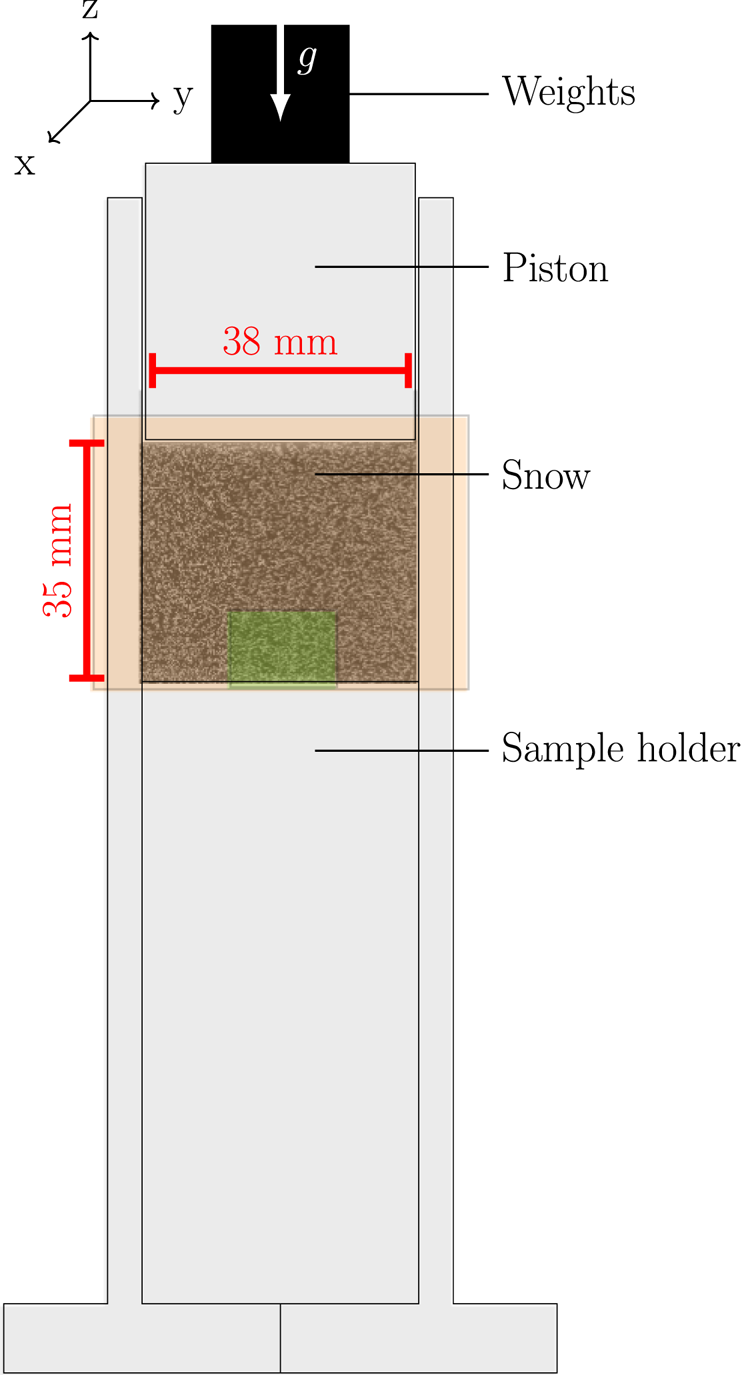
We conducted vertical confined compression tests under a constant applied dead load using a specifically designed oedometer setup made of poly(methyl methacrylate) (PMMA) (Fig. 1). The tested snow samples were cylindrical, 3.8 cm in diameter and 3.5 cm in height. The load was applied on top of the samples with calibrated weights guided by a piston. Air in the sample was free to flow through the piston and did not yield any resisting force. It was also checked that static friction between the piston and the sample holder can be neglected. The load on snow can thus be directly calculated from the weight of the piston and the additional applied weights.
Schematic diagram of the oedometer setup. Two different snow volumes were monitored by tomography: the whole sample (orange box) at low-resolution (voxel size of 30 μm), and an inner portion located near the sample base (green box) at high-resolution (voxel size of 8.5 μm).
Three different snow samples (S1, S2 and S3) were prepared as follows. Two blocks of natural snow were collected in the field and stored in a cold room at $-6^\circ$ C for several weeks, during which they evolved into Decomposing and Fragmented precipitation particles (DF). Snow particles were then sieved into the oedometer sample holder with a sieve whose mesh size was 1.6 mm. Samples S1 and S2 were prepared from the same snow block, and are characterized by an initial density of 230 kg m−3 and an initial SSA of 30 m2 kg−1 after sieving. Sample S3 was prepared from the other snow block, with an initial density of 290 kg m−3 and an initial SSA of 25 m2 kg−1 after sieving.
Different loading stages were then applied to the samples at a constant temperature of $-8\pm 0.5^\circ$ C. First, the samples were left evolving under their own weight (average stress lower than 0.1 kPa) for 25 h after sieving. During this initial stage, snow evolution is mostly driven by isothermal metamorphism, with a progressive strengthening of the structure through sintering. Then, to investigate the impact of an external stress, sample S2 was successively subjected to a load of 2.1 kPa for 120 h (5 d), and to a load of 4.7 kPa for another 120 h. Sample S3 was subjected to a load of 2.1 kPa for 90 h. Sample S1 was followed only during the sintering phase and will be used in the following as a reference for the microstructure evolution under isothermal metamorphism.
X-ray tomography
For the three samples, the evolution of the snow microstructure was monitored during the initial sintering phase and, for samples S2 and S3, during the subsequent oedometric loading stages with an X-ray tomograph (DeskTom130, RX Solutions). Four (resp. two) scans were performed during the initial sintering phase for sample S1 (resp. for samples S2 and S3). About 20 scans were then performed during each loading stages, with a higher frequency just after application of the loads. These scans, with a nominal voxel size of 8.5 μm, captured an inner portion (diameter of 15.4 mm and height of 11.2 mm) of the sample located near the bottom, where the displacements are the smallest (Fig. 1). In addition, these high-resolution scans were systematically paired with scans of the whole sample at a nominal voxel size of 30 μm, in order to capture the overall deformation of the samples. Note that the proximity to the X-ray source may induce a slight warming of the samples. On a test sample fixed close to the source, we measured a difference of 1$^\circ$ C between the closest and opposite faces to the source. To avoid temperature gradient metamorphism during the tests, the samples were kept close to the source only for the duration of the high-resolution scans (~1h30). In addition, continuous rotation of the samples during these scans prevents the establishment of a constant temperature gradient. We did not observe any pattern of grain growth characteristic of a temperature gradient metamorphism in the tomographic time series (see video in the Supplementary material).
Any significant deformation or displacement of the sample during a tomographic scan induces blurring and artifacts on the reconstructed images. Therefore, it is important that the actual displacement of the piston remains negligible during the duration of each scan. In practice, the strain rate varied with time during our tests, since the experiments were load-controlled. Typically, the strain rate is maximum just after the application of the load, and subsequently decreases. To be able to always reconstruct sharp 3-D images, the scan duration and tomographic settings were adjusted during the tests. In particular, the duration of the high-resolution scans was varied from 32 min after application of the load, up to 96 min at the end of the loading stages. The settings of the different scanning modalities are summarized in Table 1. Note that even if the nominal voxel size remained constant for a given imaged snow volume (whole sample or inner portion), the quality of the reconstructed images can be affected by these variations in scan duration (e.g. Hagenmuller and others, Reference Hagenmuller, Matzl, Chambon and Schneebeli2016). In particular, shorter-duration scans generally exhibit a lower signal-to-noise ratio.
Settings of the X-ray tomographic scans

Shorter scans correspond to scans performed immediately after load application, while medium and long scans are performed later during the loading stages (see text).
Data analysis
Image processing
Due to the unavoidable micro-metric movements of the tomograph rotation stage over long periods (sample S2 was scanned for ~2 weeks), different scans of the same evolving sample do not necessarily share the exact same coordinate system. All the images were therefore first realigned by a registration procedure, taking the sample holder as a reference. Different marks were used to automatically determine and correct the apparent displacement (three translations and three rotations) of the sample holder in the 3-D images (see e.g. Hagenmuller and others, Reference Hagenmuller2019).
The reconstructed gray-scale 3-D images represent the X-ray attenuation of the different materials in the oedometer, namely air, ice and PMMA. These images have to be segmented prior to conducting quantitative analyses. PMMA and ice attenuate X-rays similarly. However, the sample holder can be identified based on its known geometry. Air and ice were segmented based on their different attenuation coefficients, using an energy-based technique (Hagenmuller and others, Reference Hagenmuller, Chambon, Lesaffre, Flin and Naaim2013). The only parameter of this segmentation is a smoothing factor r. As explained above, the quality of our different scans was not constant, due to variations in the tomographic settings (Table 1). We chose to optimize the value of the segmentation parameter r based on the lowest quality scans (short scans in Table 1), and to subsequently apply this value to all other scans. This procedure ensures that the temporal trends derived from the tomographic data are unaffected by changes in the scan settings, but at the cost of slightly degrading the information extracted from the highest-quality scans. The sensitivity of our results to the segmentation parameters is further discussed in the Appendix (Fig. 10).
The scans of the whole sample were used to compute the macroscopic strain of the sample, and to investigate potential heterogeneities of the strain field. The macroscopic vertical strain was inferred from the piston position visible in the images. The displacement field within the sample was computed by digital image correlation (DIC) on a vertical slice extracted from the center of the sample, using the python package Spam (Stamati and others, Reference Stamati2020). Figure 2 shows the vertical displacement field in sample S2 after 120 h under a load of 2.1 kPa. Slight boundary effects, attributable to friction between snow and the sample holder, are visible (Fig. 2a). Some heterogeneities can also be noticed at the top of the sample, probably due to slight irregularities of the sample-free surface after sieving. However, in the central-bottom portion of the sample, where the high-resolution scans were performed, the vertical displacement profile increases linearly with depth and corresponds well with the profile derived from the displacement of the upper piston assuming a perfectly homogeneous deformation in the sample (Fig. 2b). In this region, the displacement of the upper piston thus represents a relevant proxy for the average strain, and the strain field is unaffected by boundary effects.
(a) Vertical displacement field on sample S2 after 120 h of compression under a load of 2.1 kPa. The displacement was computed by DIC. The green box delineates the inner portion located near the bottom of the sample, where the high-resolution scans were performed. (b) Vertical displacement profile averaged in the central part of the sample. The red dashed line represents the displacement profile computed from the macroscopic strain measured with the displacement of the piston considering a perfectly homogeneous deformation in the sample.

The high-resolution scans of the inner portion were used to derive several microstructural characteristics of the samples. To this end, these scans were cropped to cubic volumes of 9003 voxels, i.e. 7.653 mm3. During the compression tests, mass enters in these volumes from the top and may leave on the sides. However, since snow samples and strain field are homogeneous in this region, we considered that this mass flux does not affect the computed microstructural characteristics (Schleef and Löwe, Reference Schleef and Löwe2013).
Microstructural characteristics
Snow microstructure was characterized through classical descriptors, namely the density and the SSA, as well as through more advanced properties related to the bonding system of the ice matrix, namely the Euler characteristic and the minimum cut surface. Typical measurement uncertainties on these different microstructural characteristics were assessed by mean of a sensitivity study to the segmentation parameter r, and are described in the Appendix (Fig. 10). Note however that these uncertainties should be regarded as only indicative, since other sources of errors may also affect the values of the microstructural characteristics. They illustrate the robustness of the observed trends with respect to changes in the binary segmentation.
The density ρ was computed by counting the number of ice voxels and assigning them the density of ice ρ ice = 917 kg m−3. The specific surface area SSA was computed as the ratio of the ice–air surface area S divided by the mass of snow M. The area S was obtained using Crofton approach and assuming a full cubic connectivity, as described by Hagenmuller and others (Reference Hagenmuller, Matzl, Chambon and Schneebeli2016). In addition, to characterize the anisotropy of this surface, projections of the ice–air surface area along the horizontal (x and y) and vertical (z) directions were computed using a stereological method (Arakawa and others, Reference Arakawa, Izumi, Kawashima and Kawamura2009; Calonne and others, Reference Calonne, Flin, Geindreau, Lesaffre and du Roscoat2014). These quantities will be referred to as directional SSA in the following.
The Euler characteristic χ is a topological invariant of the structure, which describes its shape independently of any continuous deformation. For a closed orientable surface, the Euler characteristic can be related to the genus g as χ = 2 − 2g, where g can be interpreted as a generalized coordination number (Michelsen and others, Reference Michelsen, Raedt and Hosson2003). The Euler characteristic can thus be regarded as a metric of the bonding system of the ice matrix, and was already used as such by Schleef and others (Reference Schleef, Löwe and Schneebeli2014b) to characterize the snow microstructure evolution. Typically, formation of new bonds increases the genus g and decreases the Euler characteristic χ. In this study, χ was computed based on the algorithm described in Michelsen and others (Reference Michelsen, Raedt and Hosson2003), and normalized by the volume of ice. Prior to the computation of χ, the binary ice–air images were pre-processed with a purification algorithm in order to keep only the two largest connected components of ice and air.
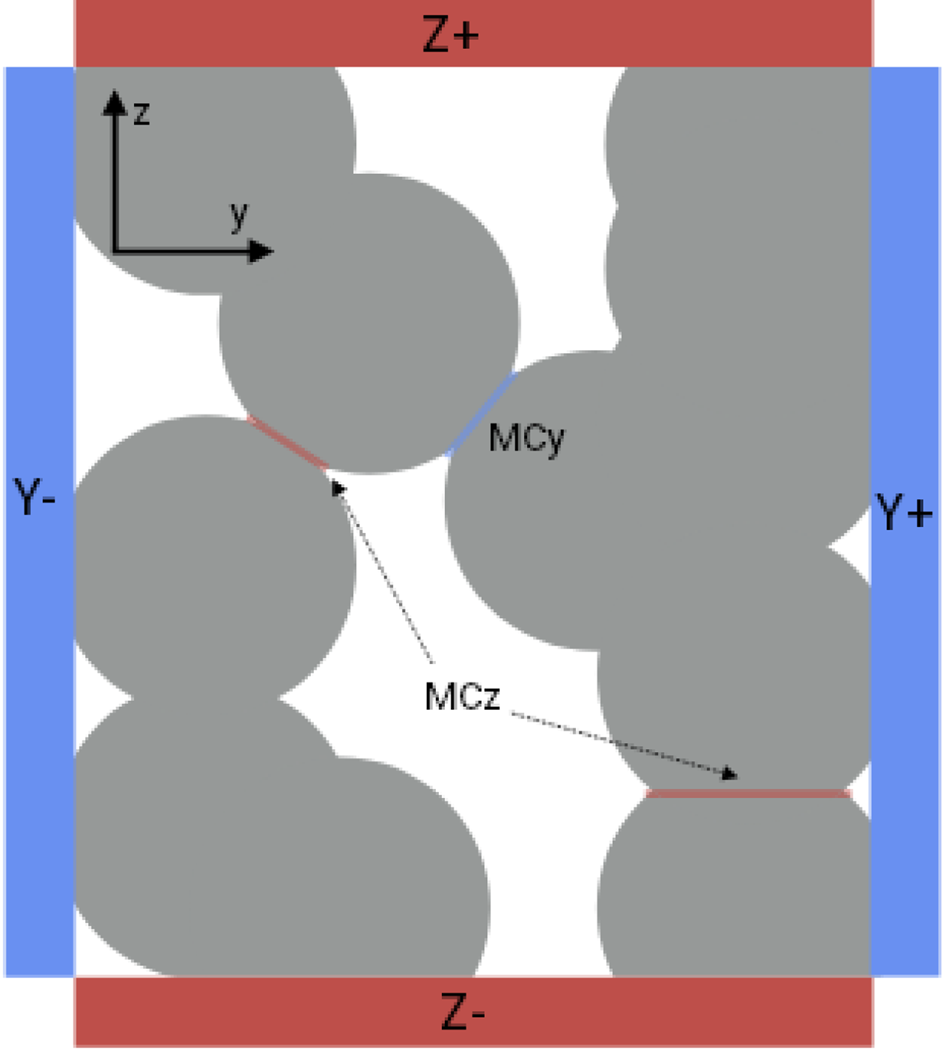
The minimum cut surface MC represents the surface of minimal area among all the surfaces that disconnect two opposite faces of a given microstructure (Fig. 3). In other words, cutting a snow sample along this surface separates the two opposite faces with the smallest amount of broken ice. This quantity is directional, since a value can be computed along each direction normal to sample faces. The minimum cut surface can thus also be used to quantify the anisotropy of the microstructure. It was introduced by Hagenmuller and others (Reference Hagenmuller2013) to characterize the snow bonding system. Here, for each Cartesian direction, we calculated the minimum cut surface area normalized by the cross section of the sample. We also computed the number of ‘broken’ bonds MC b (i.e. the connected components of the minimum cut surface, see Fig. 3) and the average bond surface area MC a.
Minimum cut surfaces on a 2-D microstructure. The minimum cut surface MC y between faces Y− and Y + is composed of a single bond (in blue), while the minimum cut surface MC z between faces Z− and Z+ is the union of two disjoint bonds (in red). Figure adapted from Hagenmuller and others (Reference Hagenmuller2013).
Lastly, for any directional quantity α (where α can be SSA, MC, MC a or MC b), we computed an anisotropy factor A α following the definition of Leinss and others (Reference Leinss2016):

where α xy is the mean of the two components in the horizontal directions x and y, and α z is the component in the vertical direction z. This definition assumes a transverse isotropy in the horizontal plane. The factor A α varies in the range ±2, with A α = 0 for a purely isotropic structure.
Results
Overall, the evolution of the microstructure captured by tomography does not show abrupt changes during the loading phases, as exemplified during the first loading stage of sample S2 in Figure 4 and the video provided in the Supplementary material. In particular, no large microstructural rearrangements are visible in the images, nor any obvious bond breakings or grain shape modifications. Hence, the densification of the samples appears to occur through a progressive reduction of the pore space caused by small, continuous deformations of the ice skeleton.
Vertical slices of segmented tomographic images for sample S2 representing the same region (a) before loading; (b) after 120 h under a dead load of 2.1 kPa. Note that most grains remain well identifiable in the two images. The volume (b) after 120 h is smaller to reflect the compaction.

The evolution of the snow density ρ, SSA, Euler characteristics χ and minimum cut surface MC before and during mechanical loading, are presented in Figures 5–8. By convention, time was reset to zero at the beginning of each loading stage. Recall that for sample S2, the loading stage at 4.7 kPa directly followed the first loading stage at 2.1 kPa. Negative time values correspond to the initial sintering phases with no applied load.
Evolution of the sample density ρ as a function of time during the sintering and loading phases. The filling of the markers (empty, half-filled, fully-filled) indicates whether the values are obtained from short, medium or long duration scans, respectively (see Table I).

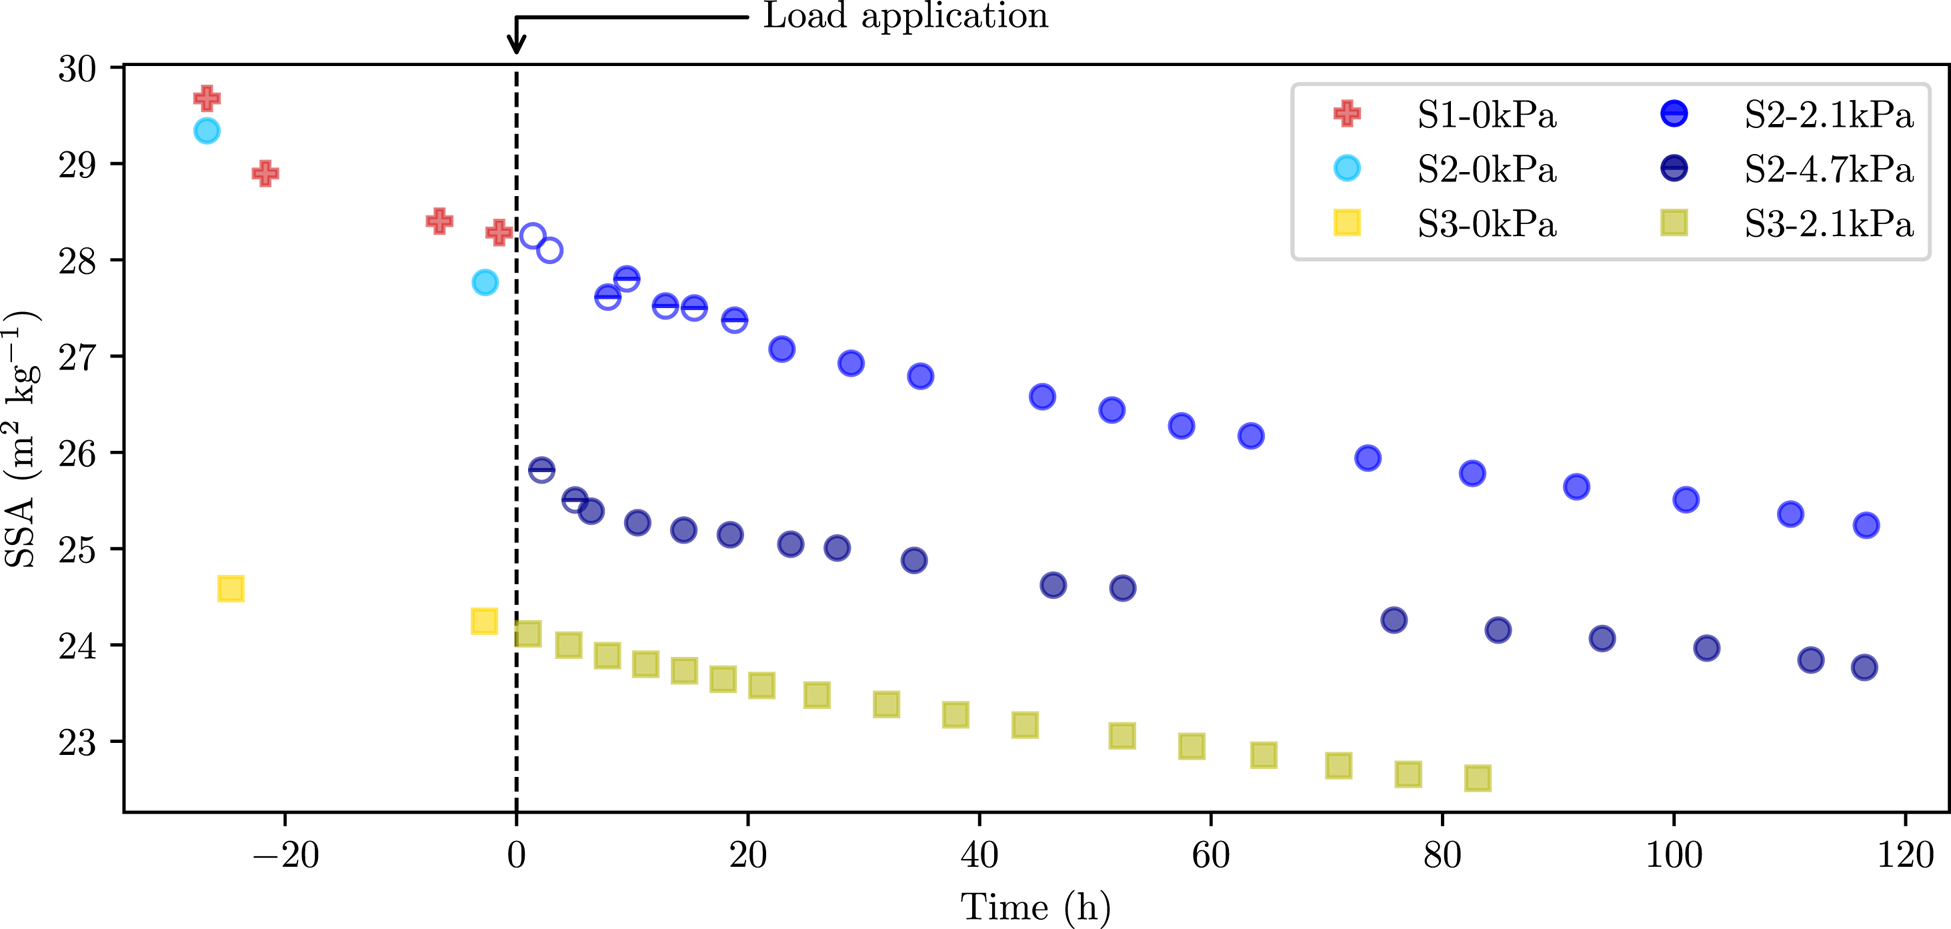
Evolution of the SSA as a function of time during the sintering and loading phases. Same legend as Fig. 5.
Evolution of the Euler characteristic χ as a function of time during the sintering and loading phases. Same legend as Fig. 5.

Evolution of the minimum cut surface MC, bond number MC b and average bond area MC a, as a function of time during the sintering and loading phases. The data points shown in these plots correspond to the average values of the minimum cut surface characteristics computed along x, y and z directions. Same legend as Fig. 5.

Density. During the initial sintering phase of all three samples, the snow density displays only negligible variations over the course of 24 h (Fig. 5). The slight increase of ρ measured for samples S1 and S2 lies within the bounds of experimental uncertainties (Appendix Fig. 10). For sample S2, application of the 2.1 kPa load results in an immediate and abrupt increase in density, whose value increases by ~18 kg m−3 during the first 50 h of loading. The densification rate then progressively diminishes, and tends to stabilize after ~50 h. A similar evolution is observed after application of the 4.7 kPa load, although the additional density increase after 50 h is only of ~12 kg m−3 in this case, due to the higher ‘initial’ density of the sample. For sample S3, with an even higher initial density, the loading at 2.1 kPa induces a density increase of only ~2.5 kg m−3 during the first 50 h.
Specific surface area. Unlike density, the SSA does not display any abrupt variations following the load application (Fig. 6). The SSA shows a decreasing trend of ~−1.5 m2 kg−1 on average per 24 h during the initial sintering phase for samples S1 and S2, and of ~−0.3 m2 kg−1 for sample S3. These trends remain essentially unchanged after the application of the 2.1 kPa load for samples S2 and S3, and the SSA decrease then tends to slow down as time progresses. Similarly, the application of the 4.7 kPa load on sample S2 does not induce any significant change in the SSA trend. Note that the slight discontinuity observed on the first few points of the two series for sample S2 immediately after changing the load is presumably attributable to larger uncertainties on these data (see the Appendix and Fig. 10).
Euler characteristic. During the initial sintering phase, the Euler characteristic χ displays an increasing trend for samples S1 and S2 (Fig. 7). Application of the 2.1 kPa load on sample S2 results in a significant decrease of χ. This decrease levels out after ~50 h, after which a mild increasing trend in χ is again observed. Similarly, application of the 4.7 kPa load induces a new decrease of χ, albeit of smaller amplitude, that levels out after ~50 h to give way to a mild increase. For sample S3, no significant variation of χ is observed during the initial sintering phase. Note however that only two data points are available, and that the first measurement of χ after the sample preparation tends to be affected by a disproportionately large uncertainty (see Fig. 10). Hence, an increasing trend similar to that observed for samples S1 and S2 during this phase cannot be excluded. It is however clear that, unlike for sample S2, the application of the load does not induce a decrease of χ for sample S3: the Euler characteristic continuously increases during loading.
Minimum cut surface. For all the samples, the evolution of the minimum cut surface MC shows an increasing trend that does not appear to be significantly influenced by the load application (Fig. 8). The increase rate regularly slows down with time. This observation can however be qualified by looking separately at the bond number MC b and the average bond area MC a. While the latter quantity also appears to be unaffected by the mechanical loading, the evolution of the bond number seems to display a sensitivity to loading despite a relatively large level of noise on the data. In the absence of load, the bond number first shows a rapid decrease during the first few hours of the initial sintering phase, and then remains essentially stable. For sample S2, application of the 2.1 kPa load is observed to induce an increase in the bond number during ~40–50 h, after which the evolution levels out again. Similarly, another increase in the bond number, over a similar duration, is observed after application of the 4.7 kPa load. For sample S3, the bond number remains essentially constant, or slightly decreases, during loading.
Anisotropy. The evolution of the anisotropy of the different directional properties is shown in Figure 9. For samples S1 and S2, the directional SSA exhibits a larger value in the vertical direction, by ~12%, compared to the horizontal directions. This anisotropy is already present at the beginning of the tests, and remains essentially constant during both the sintering and the loading phases (as observed on sample S2). Sample S3 is characterized by an isotropic SSA, which again does not show any significant evolution during the sintering or loading phases. For all samples, the anisotropy factor of the minimum cut surface A MC is generally positive, which indicates that MC is larger in the horizontal directions compared to the vertical direction. Samples S1 and S2 show no evolution of A MC during the initial sintering phase. For sample S2, application of the 2.1 kPa load leads to a rapid decrease of A MC, which varies from 0.2 during the initial sintering phase to 0.12 after 8 h of loading. After this initial decrease, A MC remains essentially constant for this sample during the two successive loading phases. For sample S3, A MC is observed to increase from −0.08 to 0.11 during the initial sintering phase. It then remains essentially constant during the loading phase. Looking separately at the contributions of the bond number $A_{MC_{\rm b}}$ and bond area $A_{MC_{\rm a}}$
 , it appears that the anisotropy observed on A MC is mainly explained by an anisotropy of the bond number, which tends to be higher in the horizontal direction. In contrast, the average bond area is essentially isotropic. Note also that bond number tends to evolve toward a more isotropic distribution during the initial sintering phase, and that the corresponding anisotropy factor $A_{MC_{\rm b}}$
 then remains almost constant during the loading phases.

Discussion
New insights on snow microstructure evolution in terms of bond size and bond number. In order to overcome the limitations of standard microstructure descriptors (density, SSA) to account for snow mechanical behavior, Schleef and others (Reference Schleef, Löwe and Schneebeli2014a) introduced the Euler characteristic χ as a proxy for the bond number. Recall that χ is expected to decrease when the bond number increases. Alternatively, Hagenmuller and others (Reference Hagenmuller, Theile and Schneebeli2014b) characterized the snow bonding system through the minimum cut surface. This quantity, defined as a flux-limiting surface, complements the information provided by the Euler characteristic in that it provides the number of bonds MC b, but also the typical size of these bonds MC a and the associated anisotropy. In this paper, these two proxies of the bonding system were investigated on the same samples (Figs 7 and 8). For sample S2, the number of bonds derived either from the Euler characteristic or from the minimum cut surface showed consistent trends: a pronounced decrease during the initial sintering phase, when no load is applied, and an increase during the first 50 h following the application of a load. For sample S3, consistent trends are also observed during loading (slightly decreasing bond number in this case). For this sample, however the signal observed during the initial sintering phase is less clear: MC b decreases, while χ remains essentially constant, but only two data points are available.
The overall agreement between the two descriptors gives confidence that χ and MC b indeed provide relevant information on the bonding system. The values of MC b (Fig. 8), however, tend to show a higher variability compared to Euler characteristic χ. This difference can be explained by the fact that χ is computed as a volume average, whereas the minimum cut surface characterizes an ‘extreme’ or limiting surface, and is thus more sensitive to spatial variability in the microstructure. Nevertheless, the complementary information provided by the minimum cut surface, namely the bonding anisotropy and the bond size, is very useful to further understand how the bonding system evolves with creep and metamorphism. In particular, we observed that the increase of bond size MC a with time seems mostly unaffected by the application of an external load.
Influence of an external stress on snow metamorphism. Our results show that, in the absence of an external load, the SSA and the number of bonds (either derived from the minimum cut surface or from the Euler characteristic) decrease with time (Figs 7 and 8), consistently with the generic coarsening of snow microstructure under isothermal metamorphism (Schleef and Löwe, Reference Schleef and Löwe2013). Application of a load leaves the SSA decreasing trend essentially unaffected (Fig. 6). In contrast, loading does affect the evolution of bond number, depending on the initial sample density. For sample S2, with a lower initial density (230 kg m−3), the number of bonds started to increase after application of the load (Figs 7 and 8). For sample S3, with the largest initial density (290 kg m−3), the bond number continues to decrease. In parallel, our results also show that the initial density of the sample plays a strong role in the snow densification rate for a given level of loading (see Fig. 5). Combining these observations, it can be concluded that the densification observed for low-density snow is reflected in the microstructure by changes in the bonding topology, but does not affect the SSA evolution. For a sufficiently large initial density, application of the load induces only negligible densification and has essentially no effect on the microstructure evolution, which remains governed by isothermal metamorphism.
In contrast, Schleef and others (Reference Schleef, Löwe and Schneebeli2014a) reported an effect of compression on both SSA and the Euler characteristic. These authors studied fresh snow samples characterized by an initial density between 55 and 110 kg m−3 and an initial SSA between 70 and 110 m2 kg−1, subjected to stress levels up to 318 Pa. They argued that the effect of compression on SSA is related to newly formed bonds at the cost of ice–air interfaces. In comparison to this former study, our results thus demonstrate that an increase in bond number under an external load is not necessarily associated to a change in the SSA evolution. As shown by the absence of large microstructural rearrangements (see video in the Supplementary material and Fig. 4), the increase in bond number in our tests is presumably related only to the slow creep of the ice matrix. In other words, the microstructural evolution caused by the applied load is sufficient to affect the bonding system, but might have been too limited to affect the SSA evolution in our case. On the contrary, we may hypothesize that larger rearrangements were involved in the tests of Schleef and others (Reference Schleef, Löwe and Schneebeli2014a), which were conducted under larger loads and lower initial densities. Globally, the evolution of SSA and bond number during densification thus appear to depend on both sample density and stress level. For very low applied stress (relative to the sample density), isothermal metamorphism is unaffected and neither of the two quantities shows a sensitivity to the load. For low applied stress (relative to the sample density), load induces additional creep of the ice matrix, which results in an increase in the bond number but has no effect on the SSA evolution. Finally, for larger applied stresses (relative to the sample density), larger microstructural rearrangements might affect both bond number and SSA, as observed by Schleef and others (Reference Schleef, Löwe and Schneebeli2014a). Let us however note that, for recent snow, Flin and others (Reference Flin2011) showed that grain contact area represents only a small fraction (⩽10%) of the total surface area of grains. One can thus wonder whether the significant evolution of SSA reported by Schleef and others (Reference Schleef, Löwe and Schneebeli2014a) can really be explained only by an evolution of the bonding system.
Finally, also interesting is the observation that, for sample S2, the increase in bond number after application of a load seems to display a characteristic time of ~50 h, and this for the two levels of load investigated (Figs 7 and 8). Hence, the creep-induced evolution of the bonding system seems to occur over a finite duration. After this characteristic time, a decreasing trend in bond number (or an increasing trend in χ) similar to that observed in the absence of load is recovered, presumably indicating that metamorphism-induced structure coarsening becomes again the dominant process. Note that this characteristic time is also visible, albeit less clearly, in the evolution of density (Fig. 5). We may hypothesize that this progressive slowdown of creep-induced compaction is related to a hardening of the material associated with the creation of new contacts (Theile and others, Reference Theile, Löwe, Theile and Schneebeli2011).
Directional creep does not induce structural or bonding anisotropy. As expected, application of an external vertical stress induces a compaction of the snow, which is more pronounced when the initial sample density is low and/or the applied stress is large. Here, for sample S2, density increased from 235 to 255 kg m−3 (i.e. 8.5%) for a load of 2.1 kPa during 5 d, and from 255 to 280 kg m−3 (i.e. 10%) for a load of 4.7 kPa during 5 additional days. For sample S3 with an initial density of 290 kg m−3, the load of 2.1 kPa did not induce any additional compaction compared to that due to isothermal metamorphism.
The application of an external stress could also have more subtle effects on snow microstructure evolution. In particular, one could expect a specific strengthening of the bonds in the loading direction, or the emergence of a local anisotropic strain pattern. Hence, Löwe and others (Reference Löwe, Spiegel and Schneebeli2011) observed a scale-dependent anisotropy of the microstructure between the direction of gravity and the horizontal directions in a snow evolving under isothermal metamorphism. This result was based on the analysis of the two-point correlation function computed from tomographic images. The anisotropy was shown to emerge at the scale of several grains, but not at smaller scales. The authors hypothesized that the origin of this large-scale anisotropy is due to gravity, since it is the only parameter that breaks the symmetry between horizontal and vertical directions in their experiments. This hypothesis was later simplified by Leinss and others (Reference Leinss2016), who assumed that all structural length scales actually inherit the macroscopically imposed strain anisotropy (see also Leinss and others, Reference Leinss, Löwe, Proksch and Kontu2020). In our results, consistent with Löwe and others (Reference Löwe, Spiegel and Schneebeli2011), the structural anisotropy at the smallest scales, captured by the anisotropy of the directional SSA (Fig. 9), did not show any evolution during compression. The initial anisotropy of this quantity (revealing more horizontal than vertical surfaces) presumably originates from the sample sieving, with the deposition of anisotropic forms (fragmented plates, needles or dendrites) that tend to align predominantly horizontally in the gravity field (Garrett and others, Reference Garrett, Fallgatter, Shkurko and Howlett2012). On the other hand, the evolution of the bonding system captured by the minimum cut surface can be used to characterize the anisotropy of the structure at larger scales. Importantly, our results did also not reveal any creation of anisotropy at this scale, since no significant evolution of the anisotropy factors on bond number and bond area could be observed during compression (Fig. 9). Accordingly, and in contrast to the hypotheses of Leinss and others (Reference Leinss, Löwe, Proksch and Kontu2020), our study does not support the existence of a generic relation between uniaxial compaction and the creation of a microstructure anisotropy. As modeled by Hagenmuller and others (Reference Hagenmuller2013), the stress and strain fields at the microscopic level can significantly deviate from the macroscopic applied stress or strain, which may explain the essentially isotropic strengthening of the microstructure in our case. However, testing a larger set of samples covering more snow types and values of initial anisotropy would certainly be needed to draw definite conclusions.
Conclusion
Oedometric compression tests were performed on snow samples with an initial density ranging between 200 and 300 kg m−3, and under two different loads of 2.1 and 4.7 kPa. The tested samples exhibited a compaction of at most 10% over the course of ~1 week. In addition, for a given load, the compaction rate was observed to be strongly dependent on the initial density of the sample. The sample with the highest density is barely affected by the application of the load, while low density snow undergoes significant densification under mechanical loading. The microstructure evolution was captured with tomographic measurements during the loading stages and the initial sintering phase. Qualitatively, and even when macroscopic vertical compaction of the samples was significant, grain arrangement appeared to remain mostly unaffected by the application of the load. More quantitatively, tomographic images were used to follow the evolution of density, SSA, as well as of more advanced descriptors of the bonding system, namely the Euler characteristic and the minimum cut surface.
Our results show that the evolution of the SSA appears to be mainly controlled by isothermal metamorphism, and does not seem to be affected by the load application. Similarly the average bond area, derived from the minimum cut surface, steadily increases and remains essentially unaffected by the applied load. In contrast, while the number of bonds decreases during the initial sintering stage, it increases after load application when compaction is observed (i.e. for low density snow). This impact of loading on the bond number remains visible during ~50 h, regardless of the applied load. After this transient period, the metamorphism-induced coarsening of the microstructure takes over again, with a slightly decreasing bond number and an increasing bond area. Finally, it was also shown that the vertical compaction does not impact the anisotropy of the microstructure in our tests. The initial anisotropy inherited from sample preparation remains unchanged during the loading phases. Accordingly, no sign of preferential bond strengthening in the loading direction could be observed.
This study provides new insights into the interplay between isothermal metamorphism and load-induced deformation in snow microstructure evolution. Overall, our results show that, for the considered thermal and loading conditions, the load-induced deformation of the ice matrix mainly results from slow creep that leads to a reduction of the pore space and an increase of the coordination number, while metamorphism mainly affects the grain and bond sizes. In particular, the SSA cannot capture the microstructure changes driven by creep in our tests. Load-induced creep occurs only for sufficiently large loads and/or sufficiently small initial density, and manifests itself through a subtle evolution of the bonding system at a scale of several grains that requires advanced topological metrics to be quantified. Let us however recall that these conclusions are based on a limited number of samples tested in specific conditions. Our results would now need to be extended to a larger range of initial density and loads, in order to better understand the effect of strain rate and strain amplitude on the microstructure evolution. The sensitivity of snow creep to the initial sample anisotropy would also need to be investigated.
Supplementary material
The supplementary material for this article can be found at https://doi.org/10.1017/jog.2022.109
Data
All materials used in this article (tomographic scans, segmented images, numerical values, numerical codes, etc.) are available on request.
Acknowledgements
This study benefited from the support of ED-IMEP2 through a PhD fellowship. The tomography apparatus (TomoCold) was funded by INSU-LEFE, Labex OSUG (Investissements d'avenir–ANR10 LABX56) and the CNRM. This work has been supported by the French National Research Agency in the framework of the ‘Investissements d'avenir’ program (ANR-15-IDEX-02). The authors thank J. Roulle for help during the experiments.
Author contributions
AB led the experimental work (press development and test campaign), performed the data treatment and participated to the data analyses and writing of the paper. PH provided a strong assistance for the data treatment and experimental procedure. PH, MM and GC all participated actively in the preparation of the experiments, the data analyses and interpretation and the writing of the paper.
APPENDIX A. Sensitivity of microstructural characteristics to the segmentation procedure
As stated before, the value of the segmentation parameter r (smoothing factor) was optimized based on the shortest-duration (i.e. lowest-quality) scans, and subsequently applied to all other scans. This procedure allowed us to achieve a similar effective resolution for all scans, thus ensuring that changes in scan settings (see Table 1) do not affect the temporal trends in the derived microstructural parameters. In practice, segmented images obtained with a smoothing factor r varying in the range 1–5 were all visually satisfying. The results presented in the paper correspond to the median value r = 3.
Figure 10 illustrates the sensitivity of microstructural characteristics to variations of r in the range 1–5 for the case of sample S2. This sensitivity is converted into typical measurement uncertainties (error bars) on the parameters. In detail, the effect of r depends on the parameter considered: e.g. a larger smoothing factor, which smooths out small features in the tomographic images, tends to lower the value of SSA but to increase the value of Euler characteristic χ. Overall, during loading stages, it is observed that the sensitivity to r tends to be slightly larger for the first few data points, which correspond to lowest-quality scans, and then to remain fairly constant for all data points derived from high-quality scans. It can also be noticed that the SSA and the parameters related to the bond number, namely χ and MC b, are affected by significantly larger error bars for the first scan of the initial sintering phase (although this scan is of high quality). This can be explained by the fact that, since this scan was performed shortly after sieving the samples, newly formed bonds are still small at this time and slight variations in smoothing parameter can thus lead to strong changes in the topology of the bonding network in the segmented images.
Sensitivity of density ρ, SSA, Euler characteristic χ, minimum cut surface MC, bond number MC b and average bond area MC a to the segmentation smoothing parameter r for the different scans performed on sample S2 during the initial sintering phase and the loading stage at 2.1 kPa. For each scan, the data point corresponds to r = 3, while the error bar reflects variations obtained for r ranging between 1 and 5. Empty, half-filled and filled markers correspond to short, medium and long duration scans, respectively.


 Open access