


INTRODUCTION
Foot-and-mouth disease (FMD) is a highly contagious viral disease of cloven-hoofed animals, affecting both domestic and wild Artiodactyla species, including deer. Deer have been infected both naturally and experimentally [Reference Forman and Gibbs1–Reference Pinto4], and deer-to-deer and deer-to-cattle transmission has been observed [Reference Gibbs2]. Experimentally infected white-tailed deer exhibited intermediate disease severity compared to susceptible livestock species (e.g. cattle, sheep, goats) and about 10% of those infected in a 1924 outbreak in California displayed typical signs of FMD infection [Reference McVicar3]. During the 2001 FMD outbreak in the UK, it was feared that a number of the deer species in the country (red, fallow) might become infected and potentially act as a reservoir for the disease [Reference Davies5, Reference Sutmoller6]. A similar concern was also expressed in The Netherlands during the 2001 FMD outbreak [Reference Sutmoller6, Reference Elbers, Dekker and Dekkers7]. However, evidence of infection in deer was not observed in either of these more recent outbreaks [Reference Elbers, Dekker and Dekkers7].
The USA has been free of FMD since a 1929 outbreak. The response to an incursion of FMD virus would be complicated if wildlife, such as deer, were infected. In areas of the USA where livestock are extensively grazed, the potential for interaction and contact with susceptible wildlife species, such as white-tailed deer, is high [Reference Ward, Laffan and Highfield8]. Deer traverse and forage in fields between farms, and enter premises containing animal feed and slurry [Reference Sutmoller6]. In addition, supplemental feeding of white-tailed deer for hunting purposes occurs, potentially leading to increased contact [Reference McVicar3, Reference Ward, Laffan and Highfield8, Reference Cooper9–Reference Hickling12]. Given the widespread distribution of wildlife species susceptible to FMD virus infection and the potential for interaction with livestock, modelling the spread of the disease in wildlife populations is an important resource in our ability to predict, respond to and recover from a foreign animal disease incursion, such as FMD.
To model the spread of FMD in a wildlife population, such as white-tailed deer, estimates of a range of disease and spatial parameters are critical. The distribution of the species of interest must be estimated spatially prior to parameterizing a disease spread model and simulating disease spread [Reference Highfield, Ward and Laffan13]. Once the population distribution has been described, disease parameters such as the latent and infectious periods must be estimated prior to modelling disease spread. In addition, the number and type of contacts both within and between species must be estimated. Although laboratory studies have been used to estimate the period of latent infection and the length of the infectiousness of some species [Reference Forman and Gibbs1–Reference McVicar3, Reference Bartoskewitz10], the values of these parameters in wildlife are usually unknown. Often parameters used are the ‘best’ estimates available, but these may not accurately capture the dynamics of the disease in the field. Given the uncertainty surrounding the parameter values, probability distributions are often used to model the parameters for disease spread. These distributions might be based on little information, such as informed ‘guesses’ of the likely minimum and maximum parameter values. Sensitivity analysis can be used to identify parameters to which the model is particularly sensitive and for which better data should be sought.
Epidemics have historically been modelled using differential equations [Reference Ahmed and Agiza14–Reference Sirakoulis, Karafyllidis and Thanailakis16]. However, differential equation models do not directly address the local character of disease spread or complex boundary conditions [Reference Sirakoulis, Karafyllidis and Thanailakis16]. Geographic automata (GA), generalizations of cellular automata models, are capable of handling non-tessellated data (e.g. points). Both cellular automata and GA provide an alternative to differential equation-based epidemic spread models. They treat time as discrete and interactions as localized [Reference Sirakoulis, Karafyllidis and Thanailakis16] and have been applied to a wide range of disease-spread problems [Reference Ahmed and Agiza14, Reference Benyoussef17–Reference Vlad, Schonfisch and Lacoursiere22]. Susceptible–latent–infected–recovered models have been built into GA to examine the spatial and temporal propagation of epidemics [Reference Sirakoulis, Karafyllidis and Thanailakis16, Reference Benyoussef17, Reference Filipe and Gibson19–Reference Rousseau21, Reference Ferguson, Donnelly and Anderson23, Reference Matsumoto and Nishimura24], but this approach has rarely been used to model the spread of infectious diseases in wildlife populations. The influence of spatial estimation techniques on the predicted spread of FMD in white-tailed deer using a GA model has been explored [Reference Highfield, Ward and Laffan13]. However, the effect of estimated disease-related parameters on model-predicted spread of FMD in white-tailed deer populations has not been evaluated.
The objectives of this study were to: apply a range of values to critical disease parameters, specifically latent and infectious periods, the number of neighbours (contacts) and local-level population density, in the GA model; describe the predicted FMD outbreak distribution that might be observed, given the various estimates used; and compare the predicted FMD outbreak distributions for each of the parameters varied.
MATERIALS AND METHODS
Study site
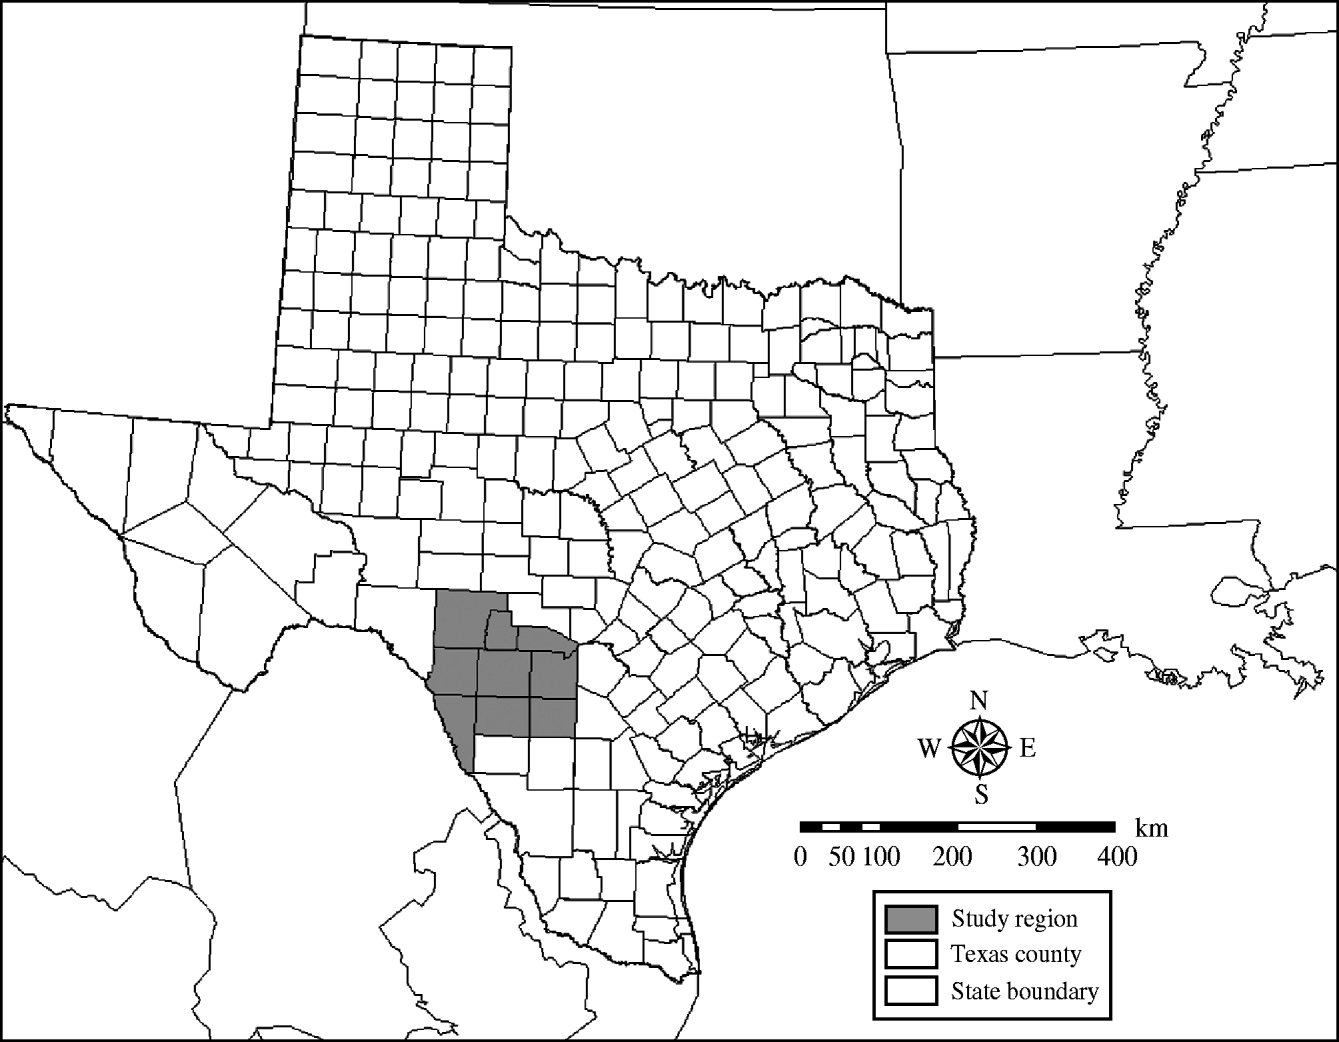
The study site, a nine-county area of southern Texas bordering Mexico (Fig. 1), has been previously described [Reference Ward, Laffan and Highfield8, Reference Highfield, Ward and Laffan13]. It consists of two ecoregions, the Edwards Plateau in the north and the South Texas Brush in the south. Seasons in the study region are characterized by hot, dry summers and mild, moist winters, with average annual rainfall ranging between 750 and 1200 mm.
The location of a nine-county area of southern Texas used to simulate the potential spread of foot-and-mouth disease through white-tailed deer populations using a geographic automata susceptible–latent–infected–recovered model.
The Edwards Plateau ecoregion is predominantly rangeland and is home to the highest concentration of deer in Texas, with an estimated 100 deer/405 ha [Texas Parks and Wildlife Department (TPWD), Wildlife district descriptions (http://www.tpwd.state.tx.us/landwater/land/habitats/cross_timbers/)].
The South Texas Brush ecoregion is considered a brush community. White-tailed deer hunting has increased in this ecoregion and the vegetation is actively managed to support hunting (TPWD, website as above). Population densities of white-tailed deer in this ecoregion are considered moderate with an estimated 29 deer/405 ha.
Data source
The estimated distribution of deer used to represent the deer population for the baseline scenario has been previously described [Reference Highfield, Ward and Laffan13]. Briefly, study area deer counts were disaggregated using suitable land cover and estimated carrying capacity derived from expert opinion. Land use categories were extracted from the 1992 national land cover dataset (NLCD) and included forest, shrub and grassland categories. The number of pixels in each land cover was multiplied by the estimated carrying capacity to create a weighting factor. The number of deer in the study region was proportionally distributed within land cover based on the weighting factor. The resulting counts of deer were aggregated to 1×1 km pixels. Deer herds were represented as points (using the centroids of each 1 km pixel) for all modelling scenarios.
Baseline scenario in the epidemic simulation model
The same herd (index case) was selected as infected to initiate the simulations of model sensitivity to the period of latency, the period of infectiousness, and the number of contact neighbours. However, two herds (index cases) – one in the northern area of the study region (a higher deer density area) and one in the southern area of the study region (a lower deer density area) – were selected to evaluate the sensitivity of the model to both global and local population density. This approach was motivated by the need to incorporate both a higher density and lower density index herd for comparison purposes. For every simulation of the model, each herd was allowed to interact with other herds within a 2000-m neighbourhood. The model was simulated for a time period representing 100 days and 100 model runs were simulated for each dataset. The median number of deer infected and median area affected (km2) were used to characterize each set of simulations at the 100th model day.
The population density, distribution, and habitat requirements of deer within the study area were explicitly incorporated in the model. As a baseline, we assumed the home ranges of deer in the study area were within a distance of 2 km and no interactions took place beyond this distance. The interaction probabilities between herds were weighted using a kernel defined by the inverse of the distance from the herd location, with the value being a fraction of a pre-specified bandwidth (1000 m). The weights were reduced when neighbours were further away than the pre-specified bandwidth, and increased when they were closer.
In the model, deer herds could pass through four disease states: from susceptible to latent, from latent to infectious, from infectious to recovered and finally back to susceptible. The unit of analysis was herd and all deer within that herd shared the same state at each time step, meaning they all transitioned (SLIR) together. Baseline parameter values for the latent, infectious and recovered periods were based on the literature, predominantly laboratory-based studies of FMD infection in deer [Reference Forman and Gibbs1–Reference Pinto4]. Dissemination is based on density of the source and contact location and the distance betweens these locations. The transition from SLIR is based on the disease state of each location in the previous time step, and on the number of contacts (weighted by distance) in the previous time step. These transitions partially determined the dissemination rate of FMD between locations [Reference Garner and Lack25]. The first transition depended on contact rates between susceptible and infected deer herds in the previous time step. The model keeps a record of each location's disease state (S, E, I or R) at the previous time step and the transition to the next state is based on its previous state. The transition from S to E is based on the number of contacts, the density and the distance between locations. Homogenous mixing was assumed to take place within but not between herds.
The probability of interaction between neighbouring herds also depended on the number of susceptible deer in the two locations, calculated as the product of their probabilities. Locations with more than a maximum threshold of deer were assigned a probability of 1·0. The remaining herds were linearly scaled into the interval 0 to 1 by dividing each herd's population size by the maximum threshold value [Reference Ward, Laffan and Highfield8]. To incorporate stochasticity into the model, interactions between a susceptible herd and an infectious neighbour occurred when a random number from a pseudo-random number generator (PRNG), specifically the Mersenne Twister mt19937 algorithm [Reference Matsumoto and Nishimura24, Reference Van Neil and Laffan26] was below the assigned probability threshold for that pair of herds [Reference Ward, Laffan and Highfield8].
Once a herd transitioned to infectious the second, third, and fourth transitions in the model depended on the length of the latent, infectious and recovered periods as assigned in the model parameterization [Reference Forman and Gibbs1–Reference Pinto4]. The specific values were assigned randomly within the corresponding parameter ranges using a uniform distribution. The following baseline model parameter values were used: latency (minimum, maximum), 3–5 days; duration of infectiousness (minimum, maximum), 3–14 days; duration of resistance to re-infection (minimum, maximum), 90–180 days; maximum number of neighbouring cells with which each infected cell can interact, 12; maximum distance of neighbouring cells within which each infected cell can interact, 2000 m; and density scaling parameters (minimum, maximum), 0–30 deer. The maximum value used to scale (30 deer/km) corresponded to the 95th percentile of estimated deer densities within the study area.
The GA model framework is particularly suited to modelling foreign animal diseases in wild animal populations. Geographic variations are explicitly modelled in a simple manner and individual-level animal census data is not required, as long as an approximate statistical distribution is available [Reference Kao27]. In addition, the model does not require complex mathematical equations, but instead relies on local relationships between spatial units [Reference Kao27]. The assumption of local spread is reasonable for white-tailed deer populations: in the absence of disturbance, deer are unlikely to move outside their local home range [Reference Ward, Laffan and Highfield8, Reference Cohen11].
Population density scenarios
The number of deer at each spatial location (centroid) was increased and decreased by 10%, respectively, resulting in two additional datasets which were simulated using the baseline model parameters specified above.
Latent period
The latent period uniform probability distribution was varied using three sets of parameter ranges: 1–5 days, 3–5 days (baseline) and 5–10 days. The actual latent period for each location (centroid) was randomly sampled from a uniform distribution using these ranges.
Infectious period
The infectious period uniform probability distribution was varied using three sets of parameter ranges: 1–14 days, 3–14 days (baseline) and 14–28 days. The actual infectious period for each location (centroid) was randomly sampled from a uniform distribution using these ranges.
Neighbours
The number of neighbours that a given infected herd was allowed to interact with at each time step was varied to represent first- to third-order neighbourhoods for each infectious herd. A 1000-m neighbourhood representing the four nearest neighbours, a 2000 m neighbourhood (baseline) representing 12 nearest neighbours and a 3000-m neighbourhood representing 28 nearest neighbours were used to simulate spread over a varying landscape area.
Reduced population density within a local neighbourhood
The impact of local population density reduction was evaluated by reducing the number of deer in herds within a 10-km distance from each of two selected initiation scenarios (higher density and lower density). Within the 10-km distance from each index herd, densities were reduced by 10–50% in 10% increments, yielding 10 additional datasets for model comparison.
Data analysis
The predicted spread of FMD was characterized for each set of parameters using the median number of deer infected, calculated by summation of the number of deer in all infected herds and the median number of herds affected, together with 5th and 95th percentiles and interquartile range (IQR). Sensitivity of the model to the parameter ranges was assessed by calculating a median ratio; a change of >10% was used to define a sensitive parameter. In addition, the predicted spatial distribution of disease spread was evaluated using spatial risk maps. Spatial risk maps were created by calculating the probability of infection across 100 iterations of the GA model for each spatial location affected.
RESULTS
The model was sensitive (>10% change compared to the baseline scenario predicted number of deer infected and herds infected) to changes in the parameter values simulated for all of the variables [latent and infectious periods, the number of neighbours (contacts) and the population density both at a global and local level] considered in this study.
Variation in the latent period affected the model-predicted spread of FMD (Table 1). A higher range of simulated latency (5–10 days) resulted in a 0·09 median ratio for the median predicted number of infected deer and a 0·11 median ratio for the median predicted number of infected herds. A lower range of simulated latency (1–5 days) resulted in a 2·06 median ratio for the median predicted number of infected deer and a 2·08 median ratio for the median predicted number of infected locations. The spatial pattern of infection was also sensitive to the latent period range simulated (Fig. 2). A shorter latent period produced a slightly larger core area of infection (>50% risk), but in a small (<20%) proportion of model runs there was a much larger area of infection. A long latent period produced a much smaller spatial distribution of infection in all risk categories (10–100% risk).
Probability of infection of each deer herd in a simulated outbreak of foot-and-mouth disease in a population of deer in southern Texas, for each of three latent periods modelled as uniform probability distributions. Results shown are from 100 simulations of a geographic automata susceptible–latent–infected–recovered model, using a baseline deer distribution surface and index case (upper left panel). Results shown represent 100 days of simulation.

Predicted number of deer and herds infected in a simulated outbreak of foot-and-mouth disease in a population of deer in southern Texas, for each of three latent periods (days) modelled as uniform probability distributions. (Results shown are from 100 simulations of a geographic automata susceptible–latent–infected–recovered model, using a baseline deer distribution surface.)
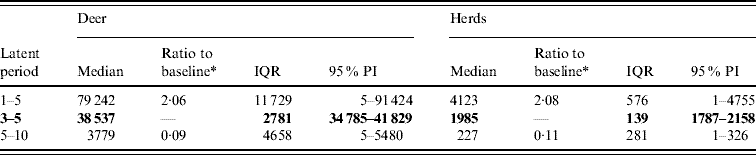
IQR, Interquartile range; PI, prediction interval.
Parameters and results in bold are from the baseline scenario.
* Median baseline vs. median scenario.
For period of infectiousness, the model was only sensitive to a lower range of simulated values: an assumed period of infectiousness of 1–14 days resulted in a 0·34 median ratio for both the median predicted number of deer infected and the median predicted number of infected herds (Table 2). A short infectious period substantially reduced the spatial risk of infection for all risk categories (10–100% risk, Fig. 3), whilst a long infectious period resulted in a slight increase in the risk of infection for the core area (>50%), particularly in the southern portion of the affected area.
Probability of infection of each deer herd in a simulated outbreak of foot-and-mouth disease in a population of deer in southern Texas, for each of three infectious periods modelled as uniform probability distributions. Results shown are from 100 simulations of a geographic automata susceptible–latent–infected–recovered model, using a baseline deer distribution surface and index case (upper left panel). Results shown represent 100 days of simulation.

Predicted number of deer and herds infected in a simulated outbreak of foot-and-mouth disease in a population of deer in southern Texas, for each of three infectious periods (days) modelled as uniform probability distributions. (Results shown are from 100 simulations of a geographic automata susceptible–latent–infected–recovered model, using a baseline deer distribution surface.)
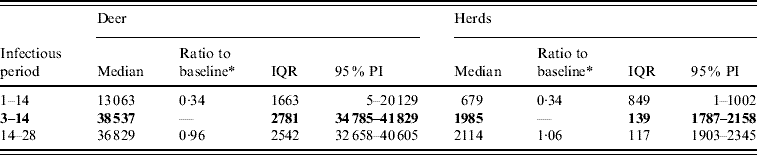
IQR, Interquartile range; PI, prediction interval.
Parameters and results in bold are from the baseline scenario.
* Median baseline vs. median scenario.
Variation in the number of neighbours (contacts) affected the model-predicted spread of FMD (Table 3, Fig. 4). A higher simulated number of neighbours (28) resulted in a median ratio of 3·11 for the median predicted spread number of deer infected and in a median ratio of 3·28 for the median predicted number of infected herds. A lower simulated number of neighbours (4) resulted in a 0·09 estimate of the median ratio for the median predicted number of infected deer and a median ratio of 0·1 for the median predicted number of infected herds.
Probability of infection of each deer herd in a simulated outbreak of foot-and-mouth disease in a population of deer in southern Texas, for each of three different numbers of neighbouring deer herds contacted. Results shown are from 100 simulations of a geographic automata susceptible–latent–infected–recovered model, using a baseline deer distribution surface and index case (upper left panel). Results shown represent 100 days of simulation.

Predicted number of deer and herds infected in a simulated outbreak of foot-and-mouth disease in a population of deer in southern Texas, for each of three different numbers of neighbouring deer herds contacted. (Results shown are from 100 simulations of a geographic automata susceptible–latent–infected–recovered model, using a baseline deer distribution surface.)
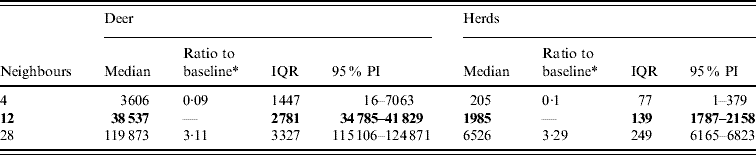
IQR, Interquartile range; PI, prediction interval.
Parameters and results in bold are from the baseline scenario.
* Median baseline vs. median scenario.
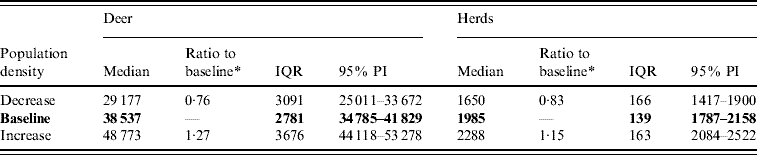
Variation in the global population density affected the predicted spread of FMD (Table 4). An assumed increase of 10% in the overall (global) population density resulted in a 1·27 median ratio for the median predicted number of deer infected and a 1·15 median ratio for the median predicted number of infected herds. An assumed decrease of 10% in the overall population density resulted in a median ratio of 0·76 for the median predicted number of infected deer and a median ratio of 0·83 for the number of infected herds. The spatial pattern of infection was also sensitive to changes in the global population density (Fig. 5). A reduced population density resulted in a smaller core area of infection (>50% risk), whilst an increased population density resulted in a larger core area of infection.
Probability of infection of each deer herd in a simulated outbreak of foot-and-mouth disease in a population of deer in southern Texas, increasing and decreasing the overall (global) population density by 10%. Results shown are from 100 simulations of a geographic automata susceptible–latent–infected–recovered model, using a baseline deer distribution surface and index case (upper left panel). Results shown represent 100 days of simulation.

Predicted number of deer and herds infected in a simulated outbreak of foot-and-mouth disease in a population of deer in southern Texas, increasing and decreasing the overall (global) population density by 10%. (Results shown are from 100 simulations of a geographic automata susceptible–latent–infected–recovered model, using a baseline deer distribution surface.)
IQR, Interquartile range; PI, prediction interval.
Parameters and results in bold are from the baseline scenario.
* Median baseline vs. median scenario.
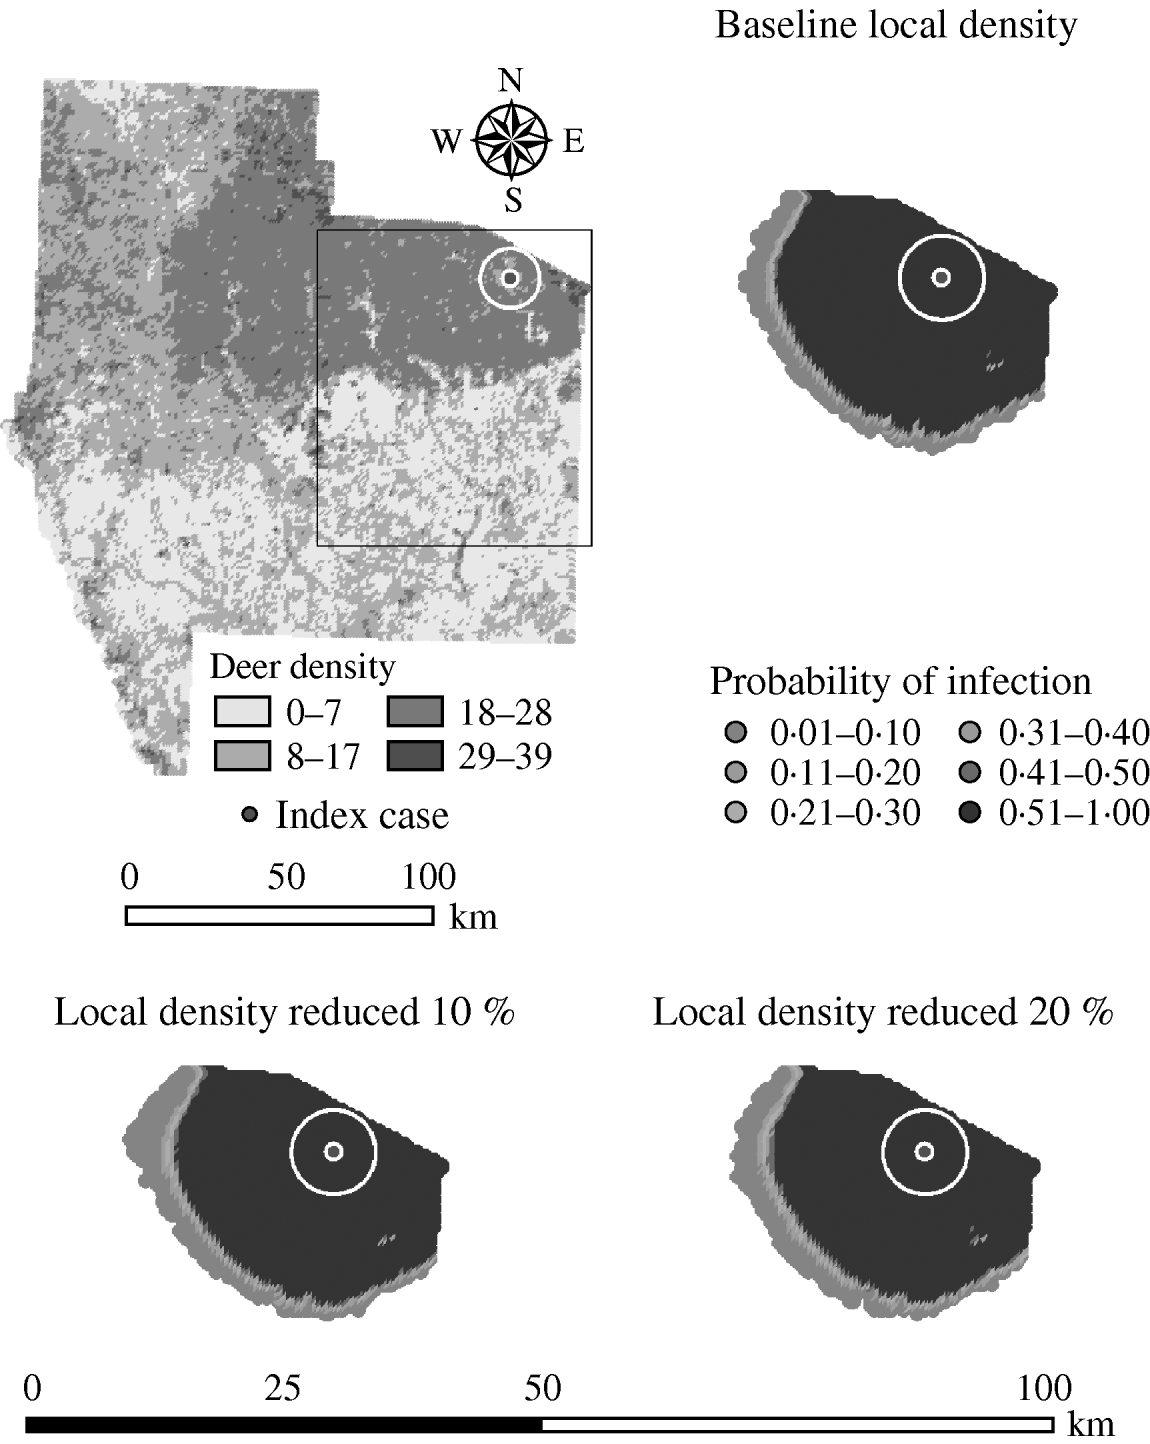
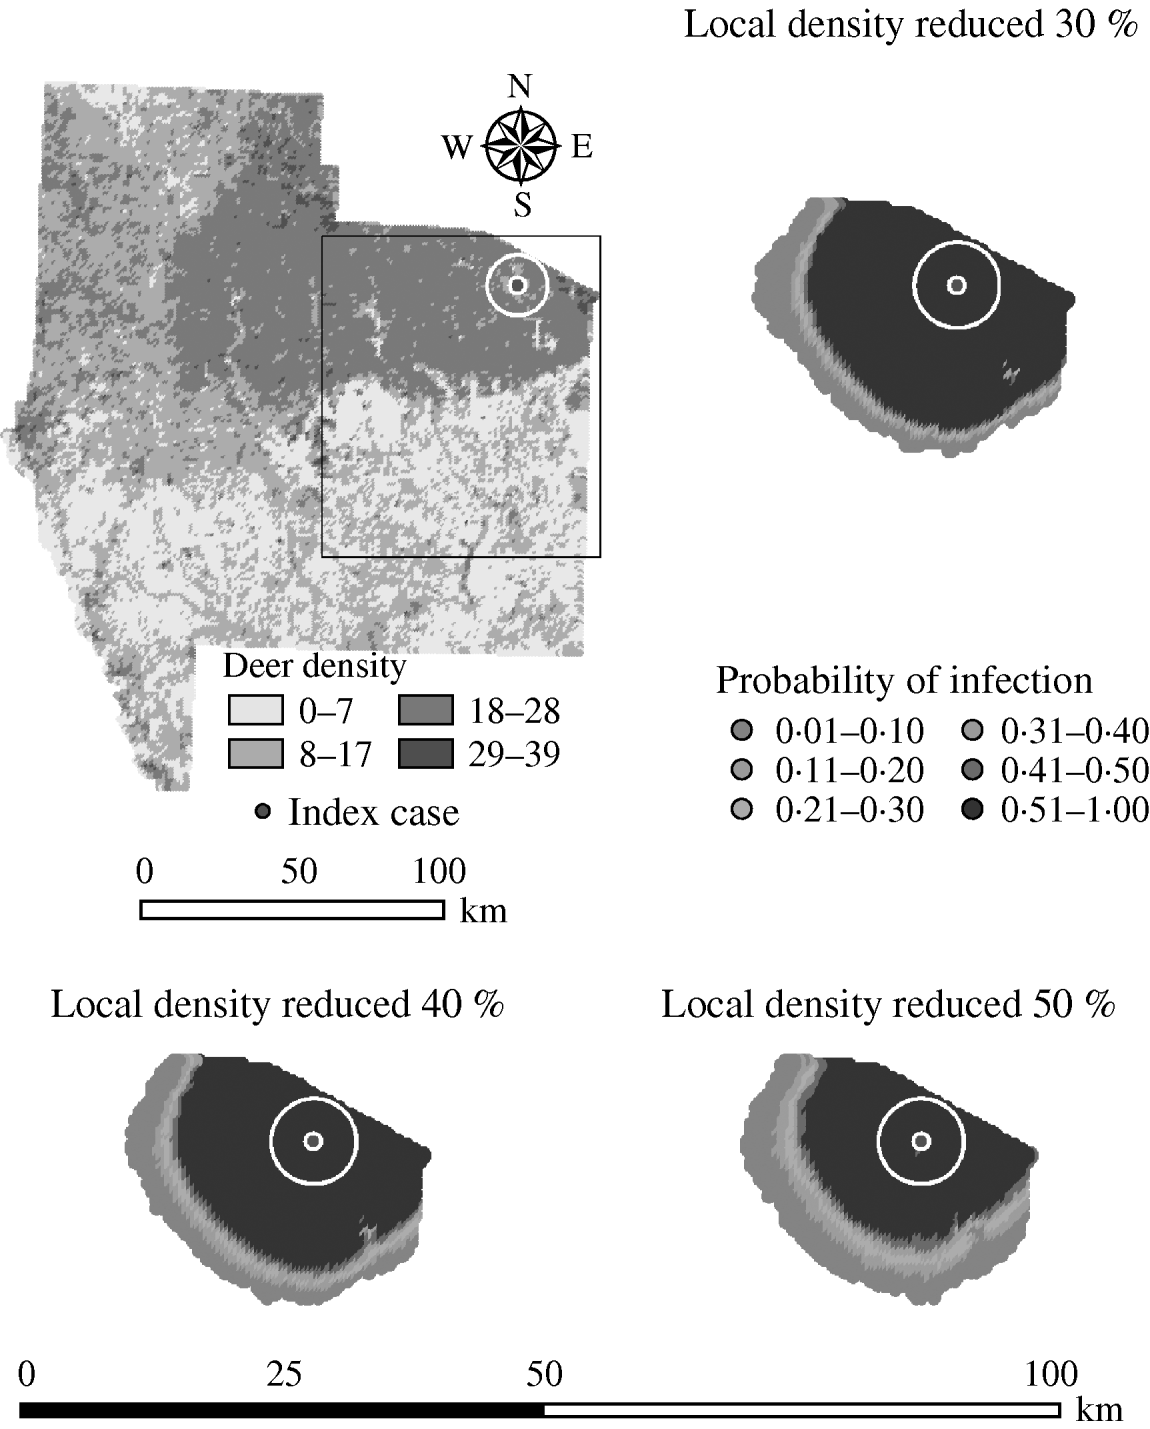
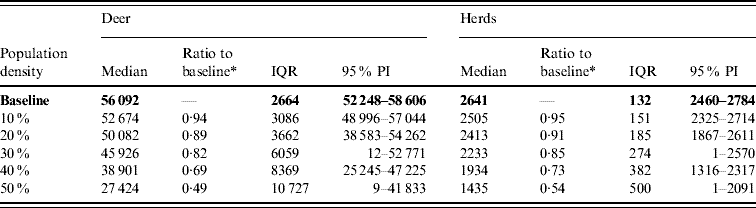
Variation in the local population density also affected the model-predicted spread in both ecoregions (Edwards Plateau and South Texas Brush) (Tables 5 and 6, respectively). Decreasing the assumed local population density (within 10 km of the higher density index case, Edwards Plateau) from 10% to 50% (in 10% increments) resulted in median ratios for the predicted number of deer infected ranging from 0·94 to 0·49, respectively, and number of infected herds from 0·95 to 0·54, respectively (Table 5). For all scenarios, disease spread was observed in 100% of the simulations. The spatial pattern of infection was also sensitive to the assumed local population density (Figs 6 and 7). An increasing reduction in the core area of infection (>50% risk) was observed for all risk categories (10–100%) of reduced local density, together with corresponding increases in the low probability categories.
Probability of infection of each deer herd in a simulated outbreak of foot-and-mouth disease in a population of deer in southern Texas. Baseline results and results decreasing the local (within a 10-km neighbourhood, indicated by a white circle on the map, of the index herd location within an area of high deer density) population density by 10% and 20% are shown. Results shown are from 100 simulations of a geographic automata susceptible–latent–infected–recovered model, using a baseline deer distribution surface and index case (upper left panel). Results shown represent 100 days of simulation.
Probability of infection of each deer herd in a simulated outbreak of foot-and-mouth disease in a population of deer in southern Texas, decreasing the local (within a 10-km neighbourhood, indicated by a white circle on the map, of the index herd location within an area of high deer density) population density by 30, 40 and 50%. Results shown are from 100 simulations of a geographic automata susceptible–latent–infected–recovered model, using a baseline deer distribution surface and index case (upper left panel). Results shown represent 100 days of simulation.
Predicted number of deer infected in a simulated outbreak of foot-and-mouth disease in a population of deer in southern Texas, decreasing the local (within a 10-km neighbourhood of the index herd location within an area of high deer density) population density by 10% increments. (Results shown are from 100 simulations of a geographic automata susceptible–latent–infected–recovered model, using a baseline deer distribution surface.)
IQR, Interquartile range; PI, prediction interval.
Parameters and results in bold are from the baseline scenario.
* Median baseline vs. median scenario.
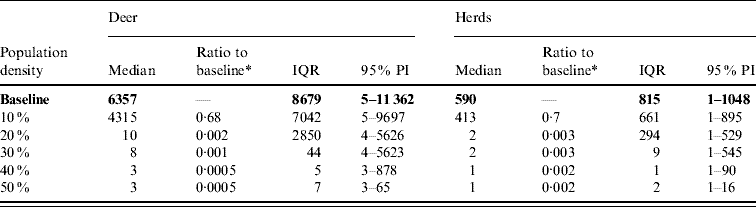
Predicted number of deer and herds infected in a simulated outbreak of foot-and-mouth disease in a population of deer in southern Texas, decreasing the local (within a 10-km neighbourhood of the index herd location within an area of low deer density) population density by 10% increments. (Results shown are from 100 simulations of a geographic automata susceptible–latent–infected–recovered model, using a baseline deer distribution surface.)
IQR, Interquartile range; PI, prediction interval.
Parameters and results in bold are from the baseline scenario.
* Median baseline vs. median scenario.
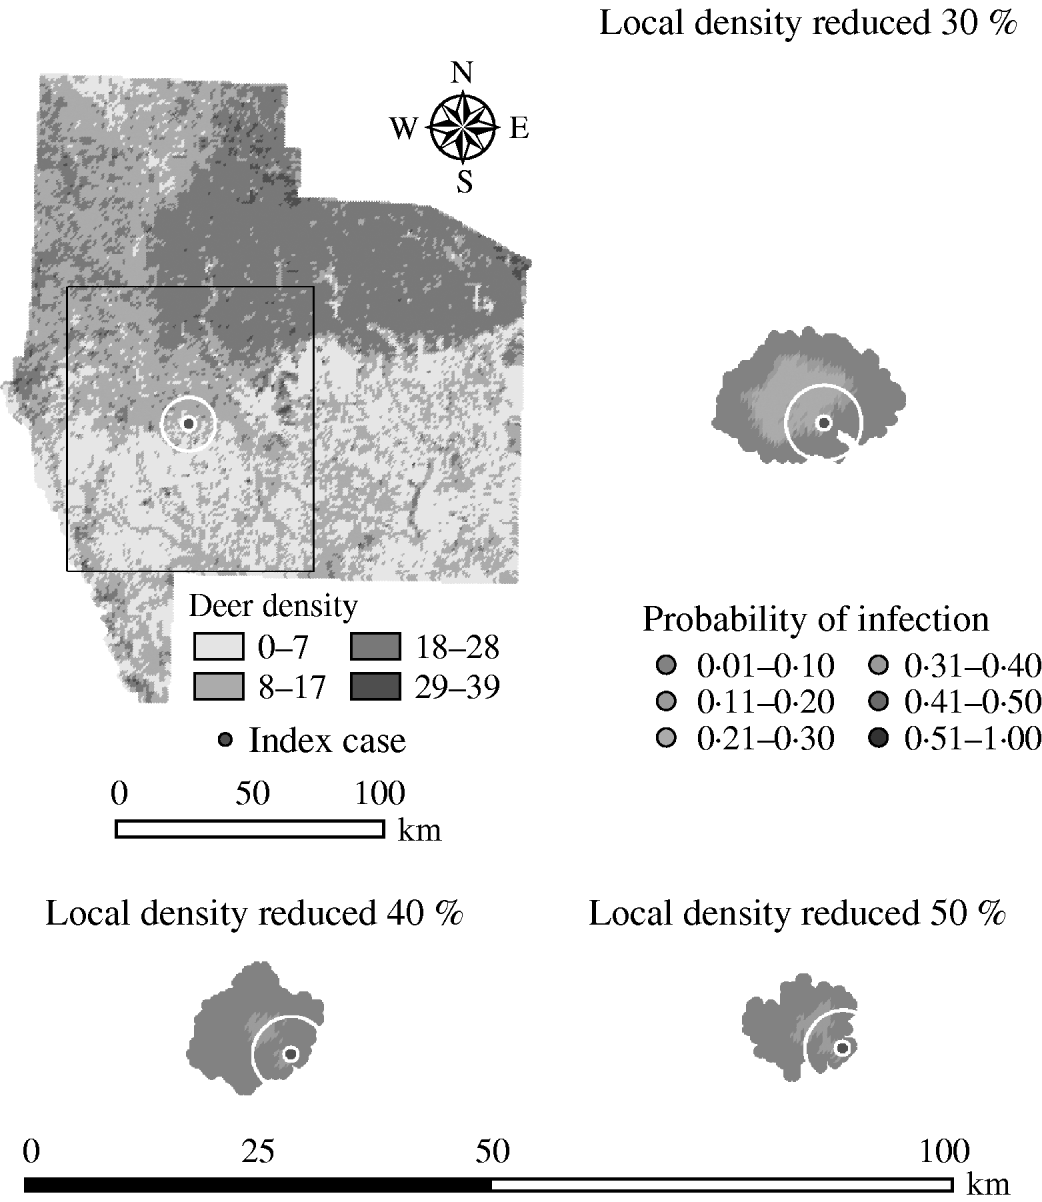
Decreasing the assumed local population density (within 10 km of the lower density index case, South Texas Brush) from 10% to 50% (in 10% increments) resulted in median ratios for the predicted number of deer infected ranging from 0·68 to 0·0005, respectively, and number of infected herds from 0·7 to 0·002, respectively (Table 6). For all scenarios, disease spread was observed in all simulations. The core area of infection (>50% risk) was almost completely absent after a 20% reduction in the local population density. The overall spatial risk of infection was also drastically reduced as the local population density decreased (Figs 8 and 9). For the 50% reduction in local population density, the risk of infection for almost all herds was reduced <20%.
Probability of infection of each deer herd in a simulated outbreak of foot-and-mouth disease in a population of deer in southern Texas. Baseline results and results decreasing the local (within a 10-km neighbourhood, indicated by a white circle on the map, of the index herd location within an area of low deer density) population density by 10% and 20% are shown. Results shown are from 100 simulations of a geographic automata susceptible–latent–infected–recovered model, using a baseline deer distribution surface and index case (upper left panel). Results shown represent 100 days of simulation.

Probability of infection of each deer herd in a simulated outbreak of foot-and-mouth disease in a population of deer in southern Texas, decreasing the local (within a 10-km neighbourhood, indicated by a white circle on the map, of the index herd location within an area of low deer density) population density by 30, 40 and 50%. Results shown are from 100 simulations of a geographic automata susceptible–latent–infected–recovered model, using a baseline deer distribution surface and index case (upper left panel). Results shown represent 100 days of simulation.
DISCUSSION
Prior to eradication of FMD virus from the USA, a series of outbreaks occurred in which wild animal populations (including deer) were affected. The current study addressed this issue by the application of a GA model to simulate FMD spread under various estimates of model parameters. This research provides critical insight into the impact that these estimated parameters have on modelling predictions. It is important because model predictions may be used to guide policy and evaluate mitigation strategies prior to an outbreak [Reference Pinto4, Reference Sutmoller6]. In addition, modelling may be used during an outbreak to inform response strategies, particularly disease mitigation strategies in wildlife populations. The habitat modelled (rangeland and brush ecosystems with high concentrations of deer as well as commercial livestock production) is representative of many parts of the USA. Thus, the study results are relevant to planning for possible future incursions of this disease.
We found that the model is sensitive to latent period, infectious period, number of neighbours, and global and local population density. A shorter latent period resulted in a 2·06 median ratio for the model-predicted number of infected deer and herds, whereas a longer latent period resulted in a 0·09 median ratio for the predicted number of infected deer and herds. The shorter latent period allowed a faster progression of the infection in the study area. Conversely, a longer latent period resulted in what appears to be a ‘burn out’ effect: the transition to infectiousness in every herd is slowed enough that many fewer generations of disease spread were observed in the 100-day time- frame simulated in this study. However, there might also be a neighbourhood effect because by the time each herd transitioned to infected status (5–10 days), most of its neighbours were already latently infected because of shared contact (within the local neighbourhood) with an infectious herd (with an infectious period of 3–14 days). The relative influence of spatial contact structure on disease spread needs to be further investigated.
A shorter infectious period reduced both the predicted median number of deer and herds infected (median ratio of 0·34 for both). A shorter infectious period resulted in a spatial pattern of infection risk different from either the baseline or longer infection periods. This indicates that the disease does not have the ability to progress over a very large spatial area if the infectious period is short: the lower range of the infectious period (1–2 days) effectively stops the spread of infection, compared to baseline (minimum 3-day infectious period). A longer infectious period had almost no effect on predicted disease spread. It is possible that in areas where deer densities are high (such as in the northern portion of the study area), all of the susceptible neighbours have been infected by the 14th day of the infectious period. Thus, increasing the period of infectiousness to 28 days has little impact on disease spread. This indicates that there might be a threshold value for the period of infectiousness, given the specific population density and size of the neighbourhood for each location (assuming the length of the infectious period is shorter than the recovered period). The effect of the infectious period and the possibility of a threshold value require further study. In the baseline scenario, each location could contact up to the 12 nearest neighbours within a distance of 2 km. If the size of the neighbourhood were increased together with the infectious period, the results would probably show increased spread. Whether such an increase is additive or multiplicative needs to be investigated in future research. In addition, future research should examine this effect for a lower density region such as the southern region of the study area.
The model is also sensitive to the number of neighbours (contacts). A higher number of neighbours approximately tripled the predicted number of infected deer and herds, whereas a lower number resulted in around a 90% decrease in the predicted number of infected deer and herds (median ratio 0·09 and 0·1, respectively). This result makes biological sense, because as the number of susceptible herds that come into contact with infected herds increase, disease spread is expected to also increase.
The model appears to be sensitive to both the global and local population density. Changes (10% increase or decrease) in the global population density resulted in around a 25% change in the median predicted number of deer infected and around a 15% change in the predicted number of herds infected (median ratio 1·27 and 1·15, respectively). This result is not surprising, considering the formulation of the model. The number of deer in a herd is used to adjust the probability of contact between a susceptible and an infectious herd; so as the herd density increases or decreases, the likelihood of contact between these herds is adjusted accordingly.
The sensitivity of the model to local population density was investigated for index herds in both higher- and lower-density areas. The effect of the change in density at the local level appeared to be greater in lower-density areas (in the current study, simulated incursions in the northern vs. southern region of the study area; Figs 6–9). For the index herd in a higher-density area, the population had to be reduced substantially more than for the index herd in a lower-density area to achieve similar levels of reduced disease spread. For the index herd in a lower-density area, the spatial pattern of disease spread was also substantially reduced as local population density was decreased. The core area of infection (>50% risk) was almost completely absent after a 20% decrease in the local population density. While the area of the core spatial spread (>50% risk) was reduced for each level of local density reduction for the index herd in a higher-density area, the overall distribution of spatial risk was relatively constant. This indicates that, in some situations, the spatial spread of disease would not be greatly different even with a 50% reduction in the local population density. This is probably because in very high deer density areas there is also a high level of spatial contiguity; therefore a reduction in the density does not have the same impact as it does in lower-density areas.
The relationship between population density and disease spread has potentially important policy implications: in areas of lower-density white-tailed deer populations, local population density reduction could be an effective strategy to reduce disease spread either prior to or during an outbreak, whereas in areas of higher density culling does not appear to be a useful strategy. In reality, culling higher-density populations might even be counter-productive. For example, an attempt to cull deer might result in family groups rapidly dispersing, effectively increasing the rate of disease spread if the population is infected. In addition, the resources needed to cull a higher-density population needs to be considered. An alternative strategy might be a combination of: (1) do not disturb a higher-density population of infected deer (and even provide feed so they do not disperse), allowing the disease to run its course (‘burn-out’); (2) impose strict area quarantine and movement control (both in and out) without disturbing the natural deer groups and habitat; and (3) commence depopulation of deer within this local area once the model suggests that FMD virus is no longer circulating. Thus, additional mitigation strategies need to be modelled to support policy development for dealing with FMD virus incursions in which wild animal populations are infected. Further research on local population density reduction as a potential mitigation strategy to prevent disease spread in white-tailed deer is needed. The assumed biological relationship between density and contact also needs to be better characterized in wildlife species that might act as reservoirs of FMD disease.
The model used in this study has been used previously to investigate wildlife–domestic species interactions between feral pigs and cattle [Reference Ward, Laffan and Highfield8, Reference Doran and Laffan28], between wild deer and cattle [Reference Ward, Laffan and Highfield8] and to evaluate the impact of spatial estimates of deer distribution [Reference Highfield, Ward and Laffan13]. In the current study, our focus was on the potential spread of FMD in wild deer populations. As in previous studies [Reference Ward, Laffan and Highfield8, Reference Highfield, Ward and Laffan13] we focused on the initial stages of disease spread (<100 days). This time-frame allowed us to make comparisons without needing to consider the complexities of seasonal variation [Reference Highfield29]. We assumed that all deer within a herd transitioned (SLIR) at one time step. We believe that given the highly infectious nature of FMD and the small herd size (compared to cattle, for example) that this is a reasonable assumption. Deer within a herd share very close contact (both direct and indirect – shared grazing and water sources). The duration of resistance to FMD virus re-infection was assumed to be 90–180 days. Although this assumption may be unrealistically low, it probably had little impact on the study results because of the focus on the initial stages of disease spread. Caution should be exercised when using the same epidemiological parameters in different spatial landscapes. This is even more problematic when epidemiological parameters are estimated from a disease outbreak that occurs within a given spatial landscape. Given that FMD has not occurred in the USA since 1929, it is virtually impossible to estimate valid epidemiological parameters, should FMD virus be introduced into the deer population. We selected parameter ranges for the latent and infectious periods based on the limited available data [Reference McVicar3]. Using latent period as the example, we elected to model shorter time ranges in the first two ranges (1–5, 3–5 days) because these parameter ranges were seen more frequently in the infected deer in laboratory studies, while the third range (5–10 days) is larger with less overlap to encompass the lower probability ranges that were observed. Laboratory data was collected on individual animals [Reference McVicar3]. We applied that data to the herd level by using the range of reported values from individually tested animals [Reference McVicar3]. We realize that this may not cover the possible range of values, but it is the only data available regarding these parameters in white-tailed deer.
However, the model system does incorporate uncertainty by using parameter ranges [Reference Ward, Laffan and Highfield8]. The model is robust even in the absence of detailed spatial heterogeneity parameter estimates: spatial heterogeneity has been implicitly included in the model by the use of herd size (density) to adjust disease transmission. Furthermore, by using landscape variability via key habitat features in the distribution methodologies and density to control interaction in the simulation model, heterogeneity of transmission has been incorporated via a ‘self-adjusting’ model that varies across the landscape. Variation in both the distribution of susceptible herds and contact rates over the landscape has been captured: this is the primary underlying cause of the differences between model results.
CONCLUSIONS
This is the first study to define the range and distribution of estimates of outbreak magnitude generated by various estimates of critical model parameters (both aspatial and spatial) for FMD spread in white-tailed deer. The information generated can be used to assist in the development of a decision-support system to plan for potential FMD incursions in which white-tailed deer might form a disease reservoir.
ACKNOWLEDGEMENTS
Partial funding for this study was provided by the Foreign Animal and Zoonotic Disease Defense Center, a Department of Homeland Security National Center of Excellence at Texas A&M University.
DECLARATION OF INTEREST
None.



