


Variables
Δβ, isothermal compressibility; ΔC p, constant pressure heat capacity; ΔG, standard Gibbs energy of binding (equivalent to ΔG°); ΔG int, intrinsic standard Gibbs energy change on binding; ΔG obs, observed standard Gibbs energy change on binding; ΔG pr,CA, standard Gibbs energy change on protonation of CA–ZnII-bound hydroxide; ΔG pr,SA, standard Gibbs energy change on protonation of deprotonated sulfonamide amino group; ΔH, standard enthalpy change on binding (equivalent to ΔH°); ΔH int, intrinsic standard enthalpy change on binding; ΔH obs, observed standard enthalpy change on binding; ΔH pr,buf, standard enthalpy change on buffer protonation; ΔH pr,CA, standard enthalpy change on CA–ZnII-bound hydroxide protonation; ΔH pr,SA, standard enthalpy change on protonation of deprotonated sulfonamide amino group; IC 50, inhibitor concentration that inhibits 50% of enzymatic activity; k a, association rate constant; k a,int, intrinsic association rate constant; K b, equilibrium binding constant; K b,int, intrinsic equilibrium binding constant; K b,obs, observed equilibrium binding constant; K d, equilibrium dissociation constant; K D, equilibrium dissociation constant (used in kinetics (SPR), equivalent to K d); K d,int, intrinsic equilibrium dissociation constant; K d,obs, observed equilibrium dissociation constant; K d, dissociation rate constant; K d,int, intrinsic dissociation rate constant; K i, inhibition of enzymatic activity constant; K M, Michaelis constant of an enzyme; pK a, negative logarithm of the dissociation constant of acid protons; pK a,CA, negative logarithm of the dissociation constant of acid protons from CA–ZnII-bound water molecule; pK a,SA, negative logarithm of the dissociation constant of acid protons from the protonated sulfonamide amino group; P t, total protein concentration; ΔS, standard entropy change on binding (equivalent to ΔS°); ΔS pr,CA, standard entropy change on protonation of CA–ZnII-bound hydroxide; ΔS pr,SA, standard entropy change of protonation of deprotonated sulfonamide amino group; T m, melting (unfolding, denaturation) temperature of a protein; ΔV, the standard change on binding of the volume of the protein–solvent–ligand system.
Introduction
The quantification of binding of low molecular weight chemical compounds to proteins is a field of great importance in biomedical sciences, especially in drug design. It has been proposed that the optimization of the thermodynamic and kinetic parameters of ligand binding to proteins should lead to compounds with improved interaction characteristics and increased possibilities to become drugs. Despite great efforts, it has become increasingly clear recently that it is difficult to correlate small changes in the thermodynamic parameters of binding with the structure of the chemical compound. As suggested by Krimmer and Klebe (Reference Krimmer and Klebe2015), such correlations usually only work for closely related compounds. The limited extent of correlation is exemplified by enthalpy changes upon binding which are strongly influenced by solute effects and/or structural flexibility (Geschwindner et al., Reference Geschwindner, Ulander and Johansson2015). There are at least four types of correlations that are of interest here for drug design, namely, the correlations between compound chemical structure and it's protein-binding thermodynamic and kinetic parameters, and the correlations between the crystallographic structure of the compound-protein complex and it's binding thermodynamic and kinetic parameters.
It is not yet possible to use computational methods to design chemical compounds that interact with a particular binding site on a target protein with a predictable affinity and other binding parameters. There is a need of significantly larger experimental data collections together with improved theoretical models that would explain the correlations between both compound and protein structures and the binding energetics. In the direction towards this goal, we see a need for the following experimental datasets (databases) that need to be assembled or significantly enlarged:
1. Large database of thermodynamic binding data of chemically diverse, but also closely related, e.g., through a pharmacophoric group, chemical compound library to a target protein;
2. Thermodynamic and kinetic databases of chemical compound binding should be assembled for a series of closely related proteins that possess similar structural fold and similar binding sites (e.g., isoforms of the same enzyme, or mutants);
3. All thermodynamic parameters of binding that are possible to measure should be accumulated, not only the affinity (ΔG), but also the changes in the standard enthalpy (ΔH), entropy (ΔS), heat capacity (ΔC p), and even volume (ΔV) and compressibility (Δβ) upon binding;
4. Kinetic parameters of binding, the association rate (k a) and the dissociation rate (k d, residence time, residence half period) should be accumulated;
5. All the above-listed thermodynamic and kinetic parameters should be intrinsic, where as many as possible of the undesired contributions are subtracted (e.g., linked protonation, buffer, salt, protein, and ligand conformation changes, etc.) to enable the correlation of binding energies with the structures;
6. Structural characterization (e.g., by X-ray crystallography or NMR) of the unliganded apo-protein and protein-compound complexes, desirably for each binding reaction.
Significant efforts have been devoted to the assembly and curation of protein–ligand binding data and the following databases have been assembled to address each of these goals.
The BindingDB (Gilson et al., Reference Gilson, Liu, Baitaluk, Nicola, Hwang and Chong2016) (http://www.bindingdb.org/bind/index.jsp) is a public web database of 1 427 022 measured binding affinities between 7026 potential target proteins and 639 152 chemical compounds (as of January, 2018) that were experimentally determined by various techniques including enzyme inhibition and kinetics, isothermal titration calorimetry, NMR, radioligand and competition, and numerous other assays.
The ChEMBL (Liu et al., Reference Liu, Li, Liu, Liu, Nie, Han, Li and Wang2015) (https://www.ebi.ac.uk/chembl/) database contains chemical compound bioactivity data against drug targets. The 2018-01-11 version contains 2 101 843 compounds, 14 675 320 activities, 1 302 147 assays, and 11 538 targets. This database of bioactive drug-like small molecules contains compound chemical structures, calculated properties (e.g., log P, Molecular Weight, Lipinski parameters, etc.) and bioactivities (e.g., binding constants, pharmacology, and ADMET data). Clinical progress data are currently being integrated into the database.
The DrugBank (Wishart et al., Reference Wishart, Knox, Guo, Shrivastava, Hassanali, Stothard, Chang and Woolsey2006) (https://www.drugbank.ca/) is a bioinformatics and cheminformatics resource that combines drug chemical, pharmacological, and pharmaceutical data with drug target sequence, structure, and pathway information. The latest release of DrugBank (version 5.0.11, released 2017-12-20) contained 10 917 drug entries including 2352 FDA-approved small molecule drugs, 926 FDA-approved biotech (protein/peptide) drugs, 108 nutraceuticals, and 5069 experimental drugs.
PDBbind database (Liu et al., Reference Liu, Li, Liu, Liu, Nie, Han, Li and Wang2015) (http://www.pdbbind.org.cn/) provides a comprehensive collection of the experimentally measured binding affinity data for complexes deposited in the Protein Data Bank (PDB). The 2017 release provides binding data of a total of 17 900 biomolecular complexes, including protein–ligand (14 761), nucleic acid–ligand (121), protein–nucleic acid (837), and protein–protein complexes (2181), the largest collection of this kind. It connects the energetic and structural information of these complexes, helpful for computational studies on molecular recognition in biological systems.
Binding MOAD (Ahmed et al., Reference Ahmed, Smith, Clark, Dunbar and Carlson2015) (http://bindingmoad.org/) is focused on well-resolved protein crystal structures with a resolution better than 2.5 Å with clearly identified biologically relevant ligands annotated with experimentally determined binding data. The latest database update in 2014 included 25 769 protein–ligand structural complexes from the PDB, 12 440 non-covalently bound ligands, and 9142 binding data.
The Affinity Database AffinDB (Block, Reference Block2006) (http://pc1664.pharmazie.uni-marburg.de/affinity/) contains affinity data for protein–ligand complexes of the PDB. Its purpose is to provide direct and free access to the experimental affinity of a given complex structure. As of January 11th, 2018, AffinDB contained 748 affinity values covering 474 different PDB complexes.
The SCORPIO database (Olsson et al., Reference Olsson, Williams, Pitt and Ladbury2008) (http://scorpio2.biophysics.ismb.lon.ac.uk/) is a free online repository of protein–ligand interaction enthalpies measured by ITC. It holds 31 different proteins, 173 ligands, approximately 400 ITC datasets, 118 crystal structures, and approximately 90 unique protein–ligand complexes with both thermodynamic and structural data. However, no significant correlations have been observed that would enable a deeper understanding of the recognition phenomenon despite the attempts to select only intrinsic binding data.
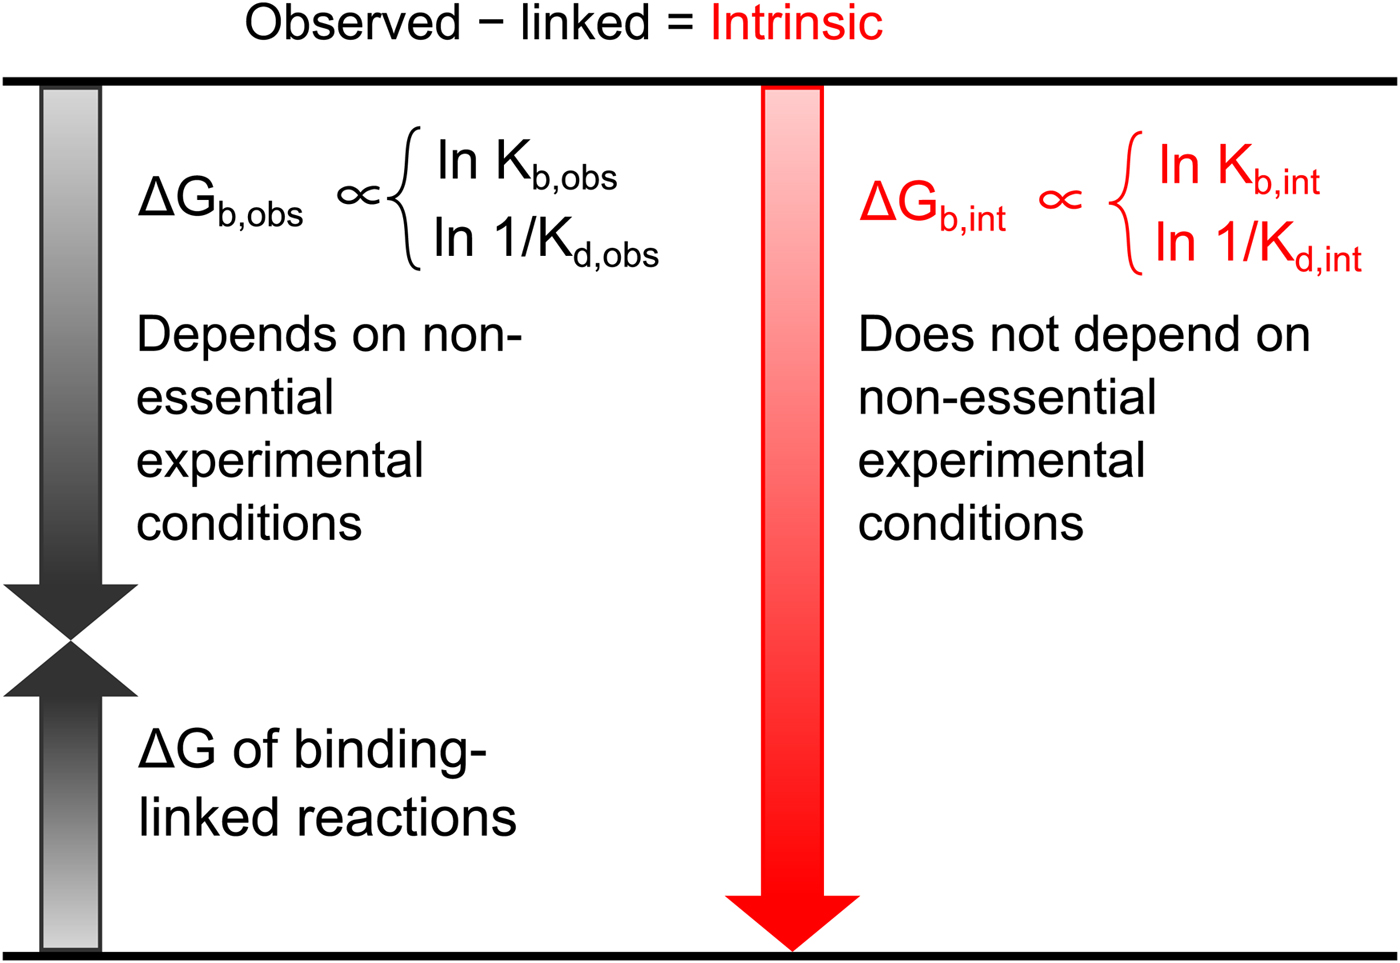
All these databases (Inhester and Rarey, Reference Inhester and Rarey2014) have been of great importance but since most data were presented without a significant selection of intrinsic data, it is difficult to observe systematic correlations that would help to understand the protein–ligand recognition energetics. Figure 1 shows a general illustration of the intrinsic thermodynamic parameters.
General illustration of the term intrinsic. The standard observed Gibbs energy of a protein–ligand binding depends on various non-essential experimental conditions if there are binding-linked reactions that require energy consumption in order for the binding reaction to occur. The standard intrinsic Gibbs energy of binding is obtained by summation of the energies from those linked reactions. The intrinsic energy is thus always greater than the observed and the intrinsic affinity is greater than the observed. The same argument applies to all thermodynamic and kinetic parameters as will be demonstrated below for the case of CA where the binding-linked reactions are protonation reactions of the protein, the ligand, and the compensation by the buffer.
In an effort to investigate the correlations between compound structure and the energetics of interaction with the target proteins, we have chosen a system of human carbonic anhydrases (CAs) and their well-known inhibitors, aromatic primary sulfonamides. The system is convenient both from the chemical compound and the protein side thus allowing a large set of data to be accumulated. There are 12 catalytically active isoforms (isozymes) of CAs in the human body. Every isoform contains ZnII in the active site of the enzyme where the amino group of the sulfonamide inhibitor binds via a coordination bond. This pharmacophoric group orients the compounds to bind specifically to the active site and the anchor-like interaction with the ZnII significantly increases the affinity of the inhibitor to the CA. Synthetic variations of the aromatic sulfonamide are quite easy to prepare and thus a large library of aromatic sulfonamide compounds was synthesized by varying the substituents on the aromatic ring. Furthermore, a large set of sulfonamide compounds has already been clinically used as human drugs for several decades. Intrinsic thermodynamic and kinetic parameters of these inhibitors were determined by biochemical enzyme inhibition methods and biophysical direct interaction assays described below. A large collection of X-ray crystal structures have also been determined by a number of laboratories.
Overview of CA isoforms in the human body
The enzyme that catalyzes liberation of the body's CO2 from  ${\rm HCO}_3^- $ from blood in the lung was discovered in 1932–33 by Norman U. Meldrum and Francis J. W. Roughton in Cambridge and William C. Stadie and Helen O'Brien at the University of Pennsylvania (Meldrum and Roughton, Reference Meldrum and Roughton1932, Reference Meldrum and Roughton1933a, Reference Meldrum and Roughton1933b; Stadie and O'Brien, Reference Stadie and O'Brien1933a, Reference Stadie and O'Brien1933b; Chegwidden et al., Reference Chegwidden, Carter and Edwards2000; Forster, Reference Forster2000).
There are several evolutionarily unrelated CA gene families (Dodgson et al., Reference Dodgson, Tashian, Gros and Carter1991). However, only the enzymes of the alpha family are expressed in humans, of which there are 15 isoforms (isozymes). Twelve of these isoforms are catalytically active, while three are inactive because they lack ZnII in the active site due to mutations of His residues that bind the ZnII. As schematically shown in Fig. 2, human CA isoforms exhibit different cellular localization and multimerization patterns. There are a number of books and reviews that describe CAs from human and other organisms in great detail (Dodgson et al., Reference Dodgson, Tashian, Gros and Carter1991; Chegwidden et al., Reference Chegwidden, Carter and Edwards2000; Supuran et al., Reference Supuran, Scozzafava and Conway2004; Frost and McKenna, Reference Frost and McKenna2014).
Localization and multimerization of catalytically active 12 human CA isoforms in the cell. Isoforms CA I, CA II, CA III, CA VII, and CA XIII are cytosolic, CA VA and CA VB are found in mitochondria, CA VI is excreted in human saliva and milk, CA IV is anchored to the membrane via a covalently attached lipid moiety, and CA IX, CA XII, and CA XIV are membrane-bound via a single transmembrane alpha helix with the catalytic domain being outside of the cell. The remaining three isoforms (named CARP – CA-related protein), CA VIII, CA X, and CA XI are catalytically inactive and not shown in the figure. The CA VI, CA IX, and CA XII are dimers while the rest are monomers. The CA IX bears a proteoglycan-like (PG) domain – a unique feature of CA IX.

In this work, we limit the set of proteins to the 12 catalytically active human CA isoforms because a potential drug would have to demonstrate selectivity towards one target isoform and not exhibit a toxic effect by inhibiting other vital non-target isoforms.
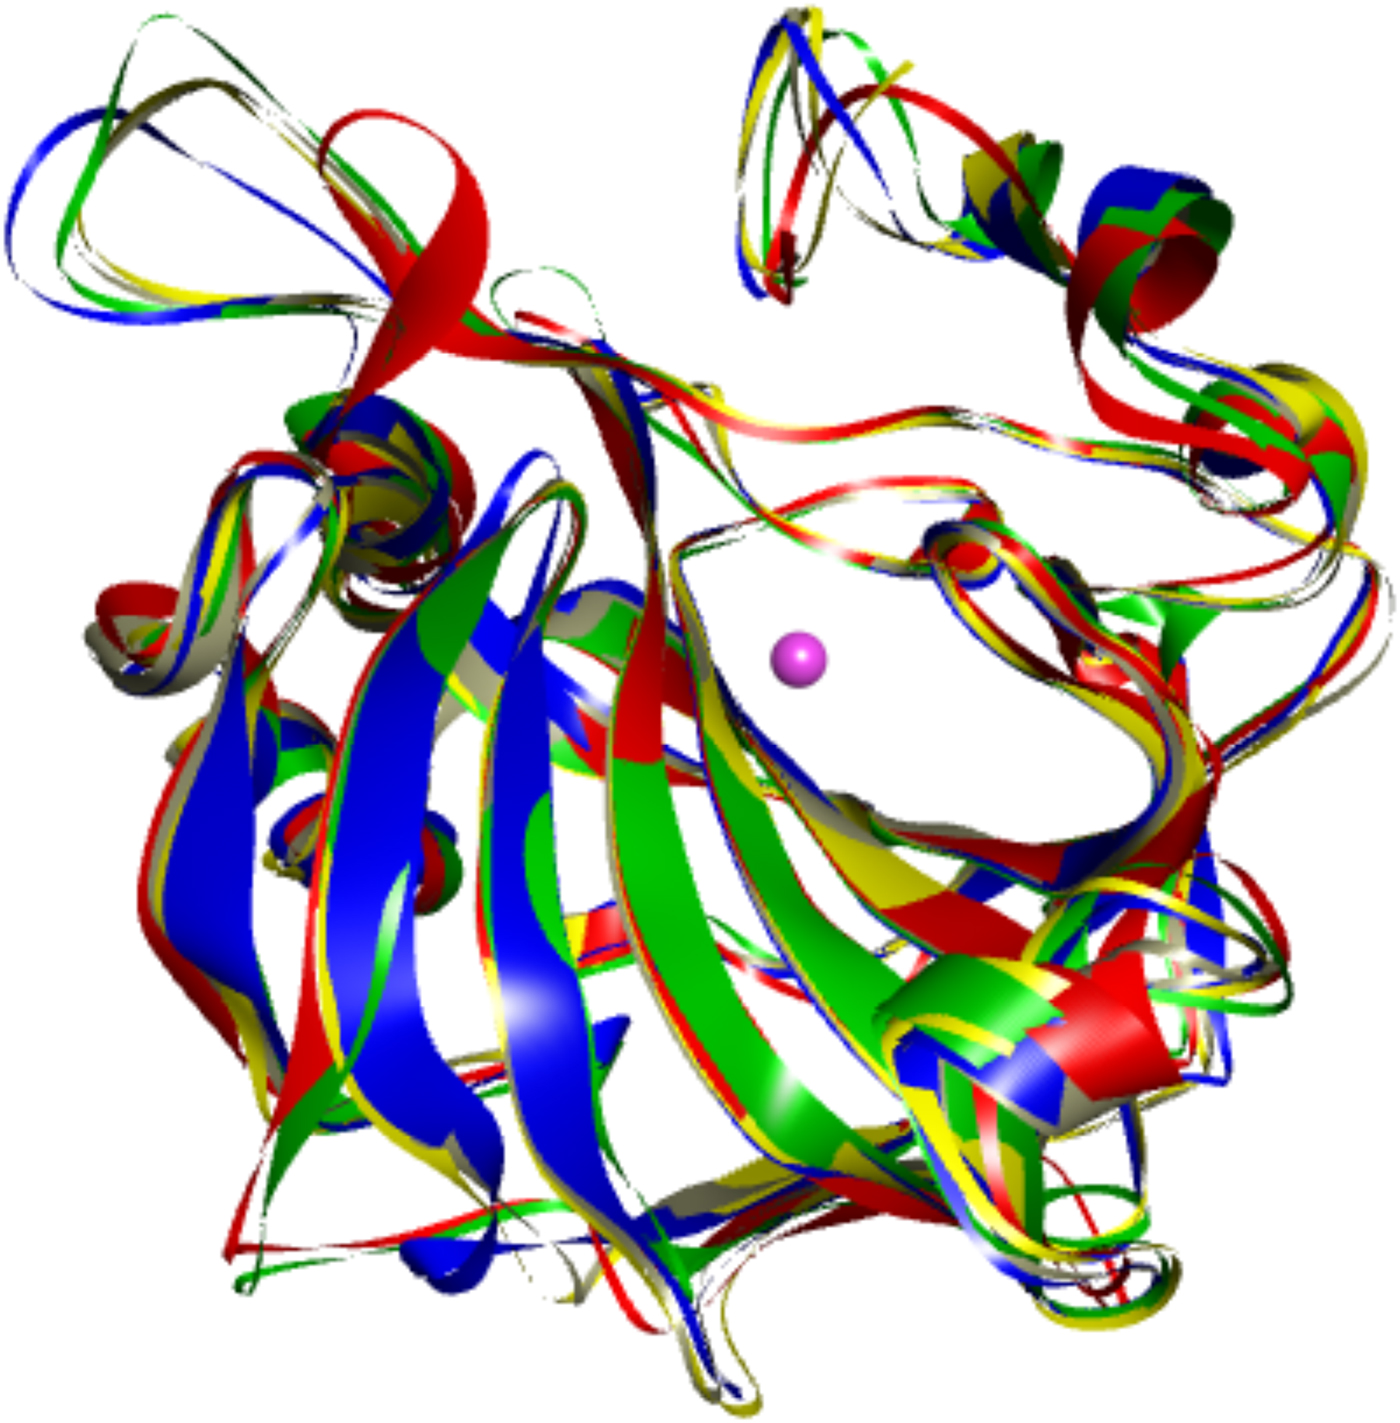
The first X-ray crystal structure of a carbonic anhydrase was solved by Liljas et al. (Reference Liljas, Kannan, Bergsten, Waara, Fridborg, Strandberg, Carlbom, Jarup, Lovgren and Petef1972). It showed that CA is primarily a beta-sheet-structured protein. Later structures of other CA isoforms showed that the proteins have not only highly homologous sequences, but also highly similar 3D structures (as shown in Fig. 3 where five human CA isoforms have been superimposed).
Overlay of the backbones of five human CA isoforms shown in different colors (CA I – blue, CA II – grey, CA VII – yellow, CA IX – red, and CA XII – green). Their backbones superimpose essentially identically.
The CAs catalyze the reversible CO2 hydration reaction:
 $${\rm CO}_2 + {\rm H}_2{\rm O}\rightleftharpoons {\rm HCO}_3^- + {\rm H}^ + $$
This reaction is spontaneous but the enzyme may accelerate the achievement of equilibrium by up to approximately a million fold. Human CA isoforms possess different specific enzymatic activities. Isoforms CA II and CA IX are considered to be the most active (Hilvo et al., Reference Hilvo, Baranauskiene, Salzano, Scaloni, Matulis, Innocenti, Scozzafava, Monti, Di Fiore, De Simone, Lindfors, Janis, Valjakka, Pastorekova, Pastorek, Kulomaa, Nordlund, Supuran and Parkkila2008) while isoform CA III is the least active isoform. Catalytic activities of recombinant CAs and the catalytic mechanism have previously been described (Krishnamurthy et al., Reference Krishnamurthy, Kaufman, Urbach, Gitlin, Gudiksen, Weibel and Whitesides2008; Supuran, Reference Supuran2008).
The CAs are implicated in numerous diseases. For example, CA IX is scarcely expressed in healthy human tissue (stomach/duodenum, gallbladder, and body cavity linings), but highly overexpressed in numerous solid hypoxic tumors (Pastorekova et al., Reference Pastorekova, Kopacek and Pastorek2007). This makes CA IX an attractive anticancer target. Indeed, inhibitors that possess high affinity and selectivity towards CA IX over other CA isoforms are currently the focus of anticancer drug development programs.
Overview of CA inhibitors
According to Davenport (Reference Davenport1984), the history of CA inhibitors begins with David Keilin who discovered that sulfonamides inhibit CAs. Schwartz tried sulfanilamide as a diuretic in 1940 while Roblin and Clapp at the American Cyanamid Company synthesized acetazolamide in 1949. Later, thiazides and furosemide-type drugs were extensively used for the treatment of hypertension and edema. These and other primary sulfonamides (R—SO2NH2) are now classical inhibitors of CAs, many of them are still used in the clinic.
The sulfonamide amino group of the inhibitor makes a coordination bond with the catalytic ZnII thus preventing CO2 or  ${\rm HCO}_3^- $ from binding and competitively inhibiting the CO2 hydration reaction. The primary sulfonamides may be considered transition state analogs with respect to their mode of active site binding (Fig. 4).
Comparison between interactions of primary aromatic sulfonamide, and bicarbonate with the CA.

Some clinically used CA inhibitors are not only sulfonamide derivatives, but also sulfamates (R—O—SO2NH2) (Supuran et al., Reference Supuran, Scozzafava and Casini2003; Smith and Jones, Reference Smith and Jones2008; Carta et al., Reference Carta, Supuran and Scozzafava2014). These drugs are used to treat various diseases such as glaucoma (Masini et al., Reference Masini, Carta, Scozzafava and Supuran2013), potentially obesity (Scozzafava et al., Reference Scozzafava, Supuran and Carta2013), epilepsy (Aggarwal et al., Reference Aggarwal, Kondeti and McKenna2013), or act as diuretics (Supuran, Reference Supuran2008). Numerous new sulfonamide derivatives have been reported in published patents and articles describing the development of novel compounds (Carta et al., Reference Carta, Aggarwal, Maresca, Scozzafava, McKenna and Supuran2012a; Lomelino and McKenna, Reference Lomelino and McKenna2016). Their binding affinity and selectivity depend on the aromatic/heterocyclic scaffold of sulfonamide and the functional groups linked to this scaffold. One of them is in clinical trials for the treatment of hypoxic, metastatic tumors (Lou et al., Reference Lou, McDonald, Oloumi, Chia, Ostlund, Ahmadi, Kyle, auf dem Keller, Leung, Huntsman, Clarke, Sutherland, Waterhouse, Bally, Roskelley, Overall, Minchinton, Pacchiano, Carta, Scozzafava, Touisni, Winum, Supuran and Dedhar2011; Supuran, Reference Supuran2017).
Several new classes of CA inhibitors have been developed, and their inhibitory activity and the binding mechanism extensively reviewed (De Simone et al., Reference De Simone, Alterio and Supuran2013; McKenna and Supuran, Reference McKenna and Supuran2014; Lomelino and McKenna, Reference Lomelino and McKenna2016; Supuran, Reference Supuran2017). Like sulfonamides, various compounds were found to bind directly to the ZnII in the active site i.e. dithio-/monothiocarbamates (Carta et al., Reference Carta, Aggarwal, Maresca, Scozzafava, McKenna and Supuran2012a), xanthanes (Carta et al., Reference Carta, Akdemir, Scozzafava, Masini and Supuran2013; Abellán-Flos et al., Reference Abellán-Flos, Tanç, Supuran and Vincent2015), hydroxamates (Di Fiore et al., Reference Di Fiore, Maresca, Supuran and De Simone2012), boronic acids and borols (Chazalette et al., Reference Chazalette, Riviere-Baudet, Scozzafava, Abbate, Ben Maarouf and Supuran2001; Winum et al., Reference Winum, Innocenti, Scozzafava, Montero and Supuran2009). Among the inhibitors that anchor to the metal ion coordinated water are phenols (Innocenti et al., Reference Innocenti, Beyza Oztürk Sarikaya, Gülçin and Supuran2010; Maresca et al., Reference Maresca, Akyuz, Osman, AlOthman and Supuran2015; Karioti et al., Reference Karioti, Carta and Supuran2016), polyamines (Carta et al., Reference Carta, Temperini, Innocenti, Scozzafava, Kaila and Supuran2010; Davis et al., Reference Davis, Vullo, Supuran and Poulsen2014), sulfocoumarins (Tanc et al., Reference Tanc, Carta, Bozdag, Scozzafava and Supuran2013; Tars et al., Reference Tars, Vullo, Kazaks, Leitans, Lends, Grandane, Zalubovskis, Scozzafava and Supuran2013), thioxocoumarin (Ferraroni et al., Reference Ferraroni, Carta, Scozzafava and Supuran2016), and carboxylic acids (Martin and Cohen, Reference Martin and Cohen2012). It was found that carboxylic acids can also bind outside of the active site (D'Ambrosio et al., Reference D'Ambrosio, Carradori, Monti, Buonanno, Secci, Vullo, Supuran and De Simone2015). Another large group of CA inhibitors is coumarins which on hydrolysis bind at the entrance to the active site (Maresca et al., Reference Maresca, Temperini, Vu, Pham, Poulsen, Scozzafava, Quinn and Supuran2009; Touisni et al., Reference Touisni, Maresca, McDonald, Lou, Scozzafava, Dedhar, Winum and Supuran2011). The same binding mechanism is proposed for fullerenes binding to CA (Innocenti et al., Reference Innocenti, Durdagi, Doostdar, Strom, Barron and Supuran2010a). Saccharin and its derivatives were identified as CA inhibitors. However, their binding mechanism has not been determined (Köhler et al., Reference Köhler, Hillebrecht, Schulze Wischeler, Innocenti, Heine, Supuran and Klebe2007; D'Ascenzio et al., Reference D'Ascenzio, Carradori, De Monte, Secci, Ceruso and Supuran2014) and there are inconsistencies regarding their affinity measurements derived from different methods (Morkūnaitė et al., Reference Morkūnaitė, Baranauskienė, Zubrienė, Kairys, Ivanova, Trapencieris and Matulis2014). It was shown that secondary and tertiary sulfonamides inhibit CA activity (Alp et al., Reference Alp, Maresca, Alp, Gültekin, Ekinci, Scozzafava and Supuran2013).
As seen from the above list, there are many chemical compounds that are inhibitors of CA. The newest ones are mostly not sulfonamides. They have been reviewed elsewhere and are not subject of this paper. We limited this work to the primary sulfonamides that have a well-established 1 : 1 molecular binding mechanism and are thus convenient for a detailed structure–thermodynamics analysis. Furthermore, as will be discussed below, it is essential to correlate the intrinsic binding parameters with the structures and not the observed parameters that are usually listed in the literature on CA inhibitors. We included in this paper only the compounds where the intrinsic binding data has been determined and thermodynamic/kinetic parameters confirmed by several techniques.
Assays to determine small molecule inhibitor interaction with CA
There are many assays of protein–ligand interactions that have been applied to study CA inhibitors. These multiple methods have been extensively reviewed by Krishnamurthy et al. (Reference Krishnamurthy, Kaufman, Urbach, Gitlin, Gudiksen, Weibel and Whitesides2008). Here we describe and compare five biochemical and biophysical techniques. The methods are not only convenient but also necessary and sufficient for the characterization of CA–sulfonamide interactions:
• SFA – the stopped-flow kinetic assay of inhibition of CA enzymatic activity, hydration of CO2 to ${\rm HCO}_3^- $ and H+,
• ITC – isothermal titration calorimetry, a technique that determines the affinity, enthalpy, entropy, and heat capacity of interaction,
• FTSA – the fluorescent (fluorescence-based) thermal shift assay (commonly termed ThermoFluor or differential scanning fluorimetry (DSF)), an assay that determines the affinity of interaction by following the thermal stabilization of the protein,
• SPR – surface plasmon resonance, an assay that determines the kinetics of interaction including the rates of association and dissociation,
• FPSA – fluorescent pressure shift assay (also known as PressureFluor), a rarely used assay that determines the volume change of the system upon interaction.

We have concluded that at least two assays should be used to confirm novel inhibitors and all of these assays have drawbacks and limitations and contribute a different kind of information as will be discussed below.
Stopped-flow assay of the inhibition of CA enzymatic activity (SFA)
Inhibitors of proteins that possess enzymatic activity and thus are enzymes are often discovered by performing biochemical assays that determine the inhibition of enzymatic activity. Such assays must be developed individually for each enzyme and are often quite tedious and material and time-consuming. The CA activity is often determined by the stopped-flow spectrophotometric method by following the decrease in absorbance of a pH indicator (e.g., phenol red) because of the drop in pH due to the protons appearing from the CO2 hydration reaction catalyzed by the CA, Eq. (1). The assay is well-described elsewhere (Khalifah et al., Reference Khalifah, Strader, Bryant and Gibson1977; Smirnovienė et al., Reference Smirnovienė, Smirnovas and Matulis2017) and its limitations will be discussed below.
Isothermal titration calorimetry (ITC)
ITC is one of the most commonly used techniques to determine protein–ligand interactions (Chaires, Reference Chaires2008; Krimmer and Klebe, Reference Krimmer and Klebe2015; Callies and Daranas, Reference Callies and Daranas2016; Falconer, Reference Falconer2016; Renaud et al., Reference Renaud, Chung, Danielson, Egner, Hennig, Hubbard and Nar2016; Vega et al., Reference Vega, Abian and Velazquez-Campoy2016). However, the technique requires a relatively large amount of pure protein and compound. The technique is isothermal and thus can be fully performed at a physiological temperature, e.g., resembling the conditions in the human body. The reaction is performed by titrating the protein with the compound in the calorimeter cell that measures the heat evolved by the interaction of known quantities of binding partners. The heat is a universal observable in any reaction. Method development is dictated solely by the components of titration and hence straightforward. However, it is not always straightforward to interpret the data obtained. The heat of reaction determined by the calorimeter is equal to the thermodynamic parameter enthalpy, under two conditions that there is no work performed and the pressure is constant. Thus ITC provides a direct route to a determination of the enthalpy of interaction. The experiment is performed in such a way that the ligand is injected in aliquots and thus the evolved heats are proportional to the fraction of ligand bound to the protein. From the direct determination of ligand-bound fraction, one can calculate the equilibrium binding/dissociation constant (and hence affinity) for the interaction. Knowledge of the equilibrium constant permits the calculation of the change in Gibbs energy of binding:
 $$\Delta G = -RT\,{\rm ln}(K_b)$$
The standard entropy change upon interaction can also be determined from the same experiment by subtracting the Gibbs energy from enthalpy:
 $$\Delta S = \lpar {\Delta H-\Delta G} \rpar /T$$
The binding of 1 (EZA, all compound structures are shown in Supplementary Table 1) to the catalytic domains of catalytically active human recombinant CAs as determined by ITC is shown in Fig. 5. It is clear that, for example, 1 bound CA I significantly weaker than CA II under the assay conditions. Furthermore, the observed enthalpy of interaction was significantly more exothermic (more negative) for CA II than for CA I. For every reaction, the molar ratio necessary to reach the midpoint of titration was approximately 1.0. Thus, essentially all 100% of the protein was able to bind the ligand to achieve saturation. This indicates that both the protein and compound preparations were highly pure.
Examples of ITC data of 1 binding to catalytically active recombinant human CA isoforms at pH 8, 25 °C as determined using the VP-ITC calorimeter. Insets show the raw curves with unflattened baselines, without user-biased interference. Experiments were performed in 50 mM sodium phosphate buffer containing 100 mM NaCl and 2% DMSO as previously described in: CA I and CA II (Morkūnaitė et al., Reference Morkūnaitė, Gylytė, Zubrienė, Baranauskienė, Kišonaitė, Michailovienė, Juozapaitienė, Todd and Matulis2015), CA IV (Mickevičiūtė et al., Reference Mickevičiūtė, Timm, Gedgaudas, Linkuvienė, Chen, Waheed, Michailovienė, Zubrienė, Smirnov, Čapkauskaitė, Baranauskienė, Jachno, Revuckienė, Manakova, Gražulis, Matulienė, Di Cera, Sly and Matulis2017), CA VB (Kasiliauskaitė et al., Reference Kasiliauskaitė, Časaitė, Juozapaitienė, Zubrienė, Michailovienė, Revuckienė, Baranauskienė, Meškys and Matulis2016), CA VI (Kazokaitė et al., Reference Kazokaitė, Milinavičiūtė, Smirnovienė, Matulienė and Matulis2015), CA VII (Pilipuitytė and Matulis, Reference Pilipuitytė and Matulis2015), CA IX (Linkuvienė et al., Reference Linkuvienė, Matulienė, Juozapaitienė, Michailovienė, Jachno and Matulis2016b), CA XII (Jogaitė et al., Reference Čapkauskaitė, Zubrienė, Smirnov, Torresan, Kišonaitė, Kazokaitė, Gylytė, Michailovienė, Jogaitė, Manakova, Gražulis, Tumkevičius and Matulis2013), and CA XIII (Baranauskienė and Matulis, Reference Baranauskienė and Matulis2012). All panels are drawn at the same scale to help visualize the differences both in enthalpies and affinities of binding. No data have been determined at comparable conditions for CA III, CA VA, and CA XIV.
Fluorescent thermal shift assay
FTSA, also commonly termed DSF, or ThermoFluor (when performed in a high-throughput plate format) is the assay that determines the melting (unfolding or denaturation) temperature T m of the protein in the absence and the presence of increasing concentrations of a ligand. The T m may be determined by fluorescence or by differential scanning calorimetry (DSC) (Brandts and Lin, Reference Brandts and Lin1990). The assay may follow the intrinsic protein fluorescence of tryptophan or tyrosine residues as the protein unfolds and the environment of these residues changes. Alternatively, the fluorescence of a solvatochromic probe such as ANS (1,8-anilinonaphthalene sulfonate) (Anderson and Weber, Reference Anderson and Weber1969; Slavik, Reference Slavik1982; Matulis and Lovrien, Reference Matulis and Lovrien1998; Matulis et al., Reference Matulis, Baumann, Bloomfield and Lovrien1999; Cimmperman and Matulis, Reference Cimmperman and Matulis2011) or Sypro Orange (Lo et al., Reference Lo, Aulabaugh, Jin, Cowling, Bard, Malamas and Ellestad2004; Niesen et al., Reference Niesen, Berglund and Vedadi2007) can be followed as the probe binds to the exposed hydrophobic residues upon protein unfolding. FTSA is a less-widely used technique than ITC, but its use has significantly increased when compound libraries are screened to determine the best binders to target proteins (Pantoliano et al., Reference Pantoliano, Petrella, Kwasnoski, Lobanov, Myslik, Graf, Carver, Asel, Springer, Lane and Salemme2001; Yanchunas et al., Reference Yanchunas, Langley, Tao, Rose, Friborg, Colonno and Doyle2005; McDonnell et al., Reference McDonnell, Yanchunas, Newitt, Tao, Kiefer, Ortega, Kut, Burford, Goldfarb, Duke, Shen, Metzler, Doyle, Chen, Tarby, Borzilleri, Vaccaro, Gottardis, Lu, Crews, Kim, Lombardo and Roussel2009). The assay is relatively easy and robust and does not require assay development for a particular protein–ligand system. However, data interpretation sometimes may not be fully straightforward (Cimmperman et al., Reference Cimmperman, Baranauskienė, Jachimovičiūtė, Jachno, Torresan, Michailovienė, Matulienė, Sereikaitė, Bumelis and Matulis2008; Cimmperman and Matulis, Reference Cimmperman and Matulis2011).
In the assay, a series of wells with the constant protein concentration are prepared and various compound concentrations are added. The mixture is heated and the melting curves at all compound concentrations are recorded simultaneously in approximately 1 hour. The melting curves are fit to the 2-state (native-unfolded) model (Matulis et al., Reference Matulis, Kranz, Salemme and Todd2005; Cimmperman et al., Reference Cimmperman, Baranauskienė, Jachimovičiūtė, Jachno, Torresan, Michailovienė, Matulienė, Sereikaitė, Bumelis and Matulis2008) providing the T ms at various compound concentrations. These T m dependencies on compound concentration are fit to the model that includes the thermodynamic parameters of protein unfolding and ligand binding (Cimmperman et al., Reference Cimmperman, Baranauskienė, Jachimovičiūtė, Jachno, Torresan, Michailovienė, Matulienė, Sereikaitė, Bumelis and Matulis2008) yielding the affinity of the interaction (the dissociation constant K d).
The binding affinities of 1 to all 12 catalytically active human CA isoforms determined by FTSA are shown in Fig. 6. The plots show the 1 dosing curves (where the compound concentration is on a logarithmic scale), while the insets show the melting curves with various added inhibitor concentrations. Compound 1 stabilized each CA isoform to a different extent. For example, CA III was stabilized by only several degrees, thus showing that this isoform binds the ligand weakly. However, CA IX was stabilized by more than 10° indicating strong interaction. In addition, the assay yielded stabilities of all CA isoforms in the absence of ligand at these assay conditions. It should be kept in mind that direct comparison between the ΔT ms is usually valid only when the proteins are of similar molecular mass.
Example of FTSA data of 1 binding to all 12 catalytically active recombinant human CA isoforms at pH 6. The insets show raw melting curves obtained by following ANS fluorescence. The experiments were performed at pH 6 in universal buffer made of 50 mM sodium phosphate, 50 mM sodium acetate, and 25 mM sodium borate containing 100 mM NaCl and up to 2% DMSO and 50 µM ANS as previously described: CA I and CA II (Morkūnaitė et al., Reference Morkūnaitė, Gylytė, Zubrienė, Baranauskienė, Kišonaitė, Michailovienė, Juozapaitienė, Todd and Matulis2015), CA IV (Mickevičiūtė et al., Reference Mickevičiūtė, Timm, Gedgaudas, Linkuvienė, Chen, Waheed, Michailovienė, Zubrienė, Smirnov, Čapkauskaitė, Baranauskienė, Jachno, Revuckienė, Manakova, Gražulis, Matulienė, Di Cera, Sly and Matulis2017), CA VB (Kasiliauskaitė et al., Reference Kasiliauskaitė, Časaitė, Juozapaitienė, Zubrienė, Michailovienė, Revuckienė, Baranauskienė, Meškys and Matulis2016), CA VI (Kazokaitė et al., Reference Kazokaitė, Milinavičiūtė, Smirnovienė, Matulienė and Matulis2015), CA VII (Pilipuitytė and Matulis, Reference Pilipuitytė and Matulis2015), CA IX (Linkuvienė et al., Reference Linkuvienė, Matulienė, Juozapaitienė, Michailovienė, Jachno and Matulis2016b), CA XII (Jogaitė et al., Reference Jogaitė, Zubrienė, Michailovienė, Gylytė, Morkūnaitė and Matulis2013), CA XIII (Baranauskienė and Matulis, Reference Baranauskienė and Matulis2012), and CA XIV (Juozapaitienė et al., Reference Juozapaitienė, Bartkutė, Michailovienė, Zakšauskas, Baranauskienė, Satkūnė and Matulis2016).

Surface plasmon resonance
SPR is also a commonly used technique to determine protein–ligand interactions and has been extensively reviewed (Myszka and Rich, Reference Myszka and Rich2000; Patching, Reference Patching2014; Olaru et al., Reference Olaru, Bala, Jaffrezic-Renault and Aboul-Enein2015; Renaud et al., Reference Renaud, Chung, Danielson, Egner, Hennig, Hubbard and Nar2016). The technique determines the protein–ligand association and dissociation rates. Therefore, it is often used to determine the kinetics of interactions. The inverse of the dissociation rate is equal to the residence time, a commonly used characteristic of the drug lead–protein pair. We will go in more detail on the assay in the section on sulfonamide–CA interaction kinetics.
Advantages and limitations of SFA, FTSA, and ITC
Here we emphasize that for the most complete picture of a studied binding reaction a multi-technique-based approach is recommended. We use all of the above-described assays for many CA inhibitors. Each technique has numerous advantages and disadvantages (Renaud et al., Reference Renaud, Chung, Danielson, Egner, Hennig, Hubbard and Nar2016). However, due to limitations in time and material, and the necessity to test as many chemical compounds as possible, some techniques may be more suited than others.
In Fig. 7, we compare the advantages and limitations of SFA, FTSA, and ITC. Panels on the left show simulated data while examples of observed data are shown on the right. The main limitation of SFA is that the IC 50 may only be determined down to about P t/2 (half of the protein concentration) (Copeland, Reference Copeland2005). Despite being one of the fastest known enzymes, the concentration of any CA isoform cannot be reduced below 10 nM even for the most active CA II and CA IX and, therefore, the IC 50 cannot be determined below approximately 5 nM. The dotted and solid curves in Fig. 7a show the position of the dosing curves if the protein concentration was 10 nM. The lines almost completely coincide with each other and, therefore, the compounds with picomolar affinities cannot be distinguished from nanomolar ones. In order to distinguish the curves, one would need to significantly reduce the protein concentration. This cannot be done in most cases and thus the K i of CA inhibitors cannot be determined below approximately 2 nM.
Comparison of SFA, FTSA, and ITC techniques, their advantages and limitations. Panels on the left show simulated curves, while on the right – the examples of measured data. The figure is adapted from Smirnovienė et al. (Reference Smirnovienė, Smirnovas and Matulis2017). (a) The application of Hill equation at protein concentration P t = 10nM and various values of apparent IC 50. The assay would not distinguish between 1 nM and 1 pM compounds because P t cannot be reduced to less than 1 nM or 1 pM to obtain distinguishable dosing curves of nanomolar (solid line) or picomolar (dotted line) affinity. (b) Experimental data of an interaction between CA II-307 at several compound concentrations. Data points were fitted according to the Hill equation with varied Hill coefficient. The inset shows the raw absorbance curves at several compound concentrations. (c) The simulated FTSA dosing curves for different binding affinities (K d from 1 pM to 1 mM) are shown. These curves were generated using the following set of parameters: T = 37 °C, P t = 10 µM, enthalpy of CA II unfolding is 690 kJ mol−1, heat capacity of unfolding is 17 kJ mol−1 K−1, enthalpy of binding is −42 kJ mol−1, heat capacity of binding is −0.8 kJ mol−1 K−1 , and the melting temperature T m without added ligand is 60 °C. (d) Experimental FTSA data of CA I-323 (squares), CA II-10 (circles), and CA XIII-310 (triangles). The insets show raw melting curves at 0 and 200 µM inhibitor concentrations. (e) Simulated ITC curves using a single binding site model of different binding affinities at P t = 10 µM. (f) Experimental ITC curves of the same binding interactions as in panel D. Affinity of CA I-323 is too strong to be determined by ITC but FTSA assay provides accurate K d.
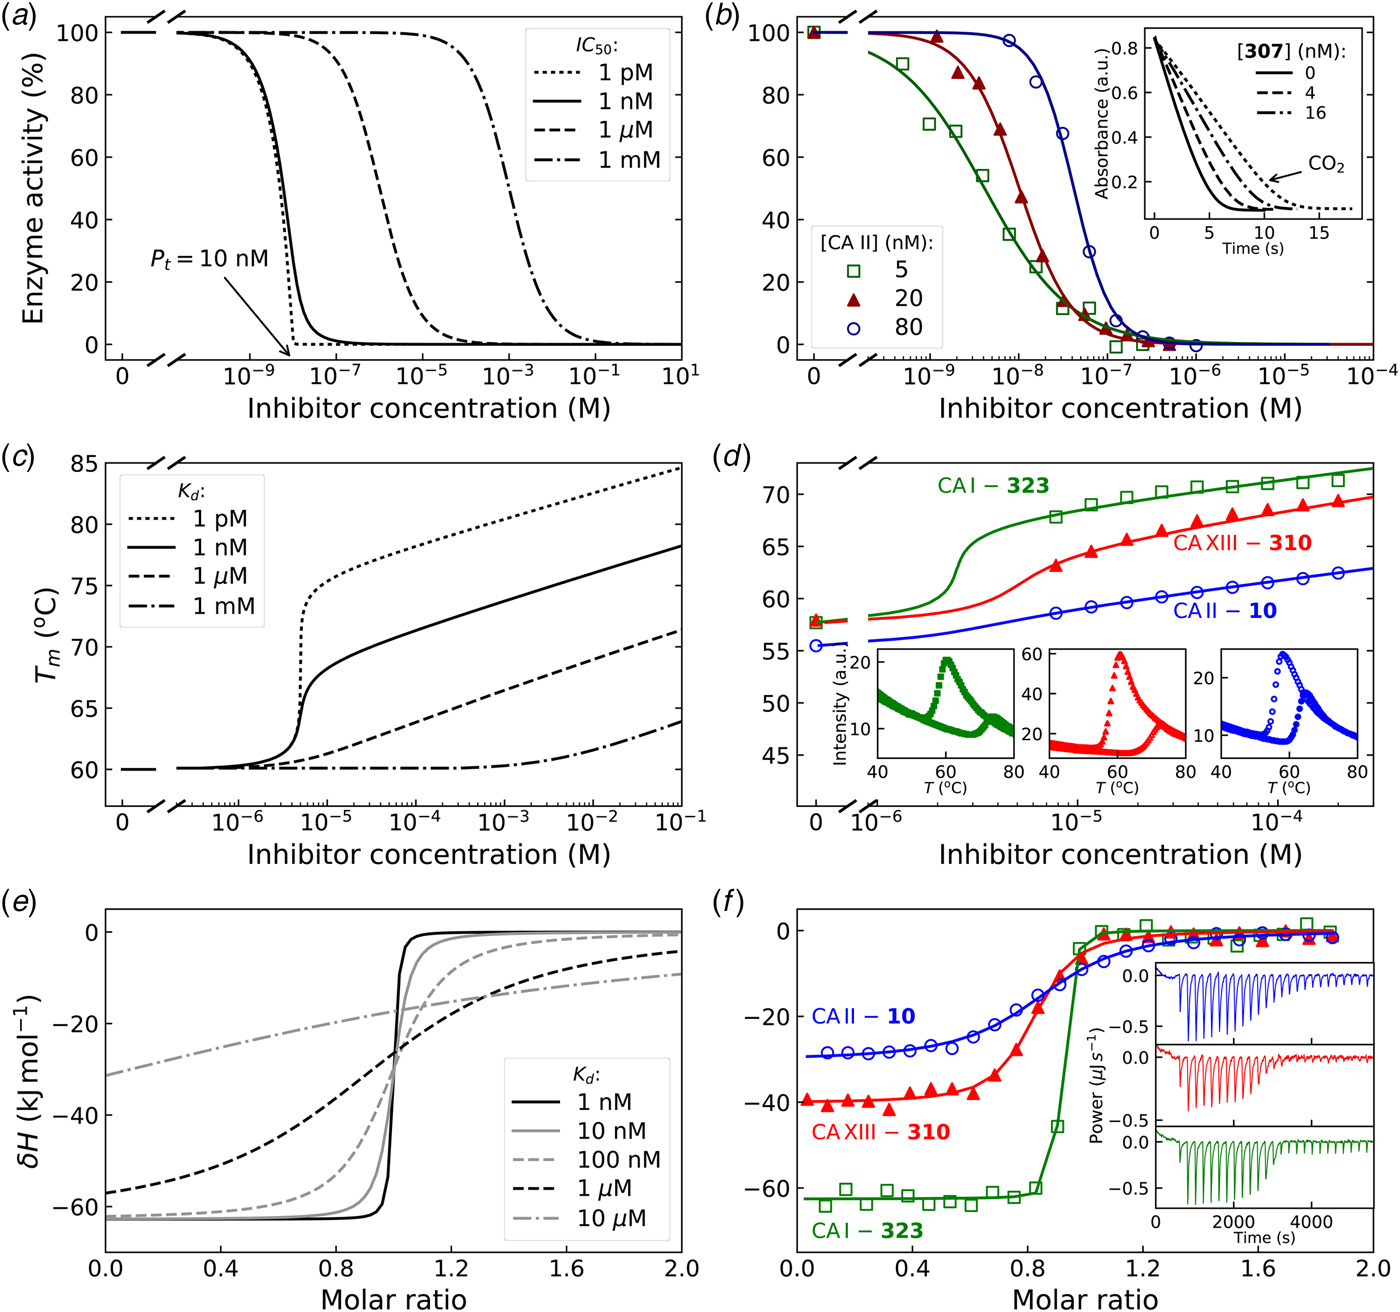
Furthermore, some isoforms possess significantly lower specific enzymatic activity and thus their concentration in the assay must be increased. For example CA I is approximately 10-times less active than CA II. Therefore, the lowest K i that can be determined for inhibitors of CA I at the same conditions is approximately 20 nM. This may lead to incorrect assignment of inhibitor selectivity towards CA II over CA I based on SFA alone.
Another significant disadvantage of SFA is that, as shown in Fig. 7b, if the protein concentration is varied, the dosing curves also shift and thus the K i could appear to vary dependent on the concentration used in the assay. If the experiment is performed at a single CA concentration, the obtained values may be inaccurate. Therefore, SFA should be used with care keeping in mind the applied protein concentration in the assay that limits the K i reachable in the assay.
In FTSA (Fig. 7c), there are essentially no limitations in affinity determination, thus picomolar and millimolar compounds may be easily distinguished in the same assay. At the simulated conditions, the picomolar compound would shift the temperature by over 20 °C, while the millimolar compound – by only 1° or 2° dependent on the added concentration. In order to detect millimolar compounds, it would be necessary to add a 10 mM compound. Figure 7d shows examples of the observed data. The limitation of FTSA is that the assay cannot be used for highly stable proteins that melt at temperatures over 90 °C. However, CAs denature around 55–65 °C. Thus, FTSA has a significant advantage over SFA because strongly-interacting picomolar compound K ds may be determined correctly by FTSA and not by SFA.
The main disadvantage of FTSA compared with SFA is that it does not determine whether the compound is actually an inhibitor of the enzyme or just a binder. Ligands potentially may bind to various sites on CA surface, stabilize the protein, and be erroneously assigned to be an inhibitor of CA. Therefore, the SFA is a necessary confirmatory technique to demonstrate that the compound is actually an inhibitor of enzymatic activity. However, the affinity of an inhibitor will still be determined more accurately by FTSA than SFA. Since primary sulfonamides bind to the active site in a well-established way, both techniques yield the same K d or K i when the assays are properly performed.
The simulated curves of the third assay, ITC, are shown in Fig. 7e. The assay has optimal accuracy when the curve is of sigmoidal shape, such as the dashed curves (K d = 100 − 1000 nM). If the compound binds weakly, for example in the micromolar range, the curve becomes too flat and may be indistinguishable from the curve of compound dilution, thus potentially leading to erroneous assignment of the observed data to a binding reaction. In such a situation the protein concentration must be raised, if the solubility of both components permits, expanding the window of affinity determination. On the other hand, if the compound has a K d of 1 nM or tighter, the curve is too steep and the K d again cannot be determined. It may be stated that ‘the binding is 10 nM or tighter’, but the actual affinity cannot be determined. In such a situation, the protein solution may be diluted as long as the signal remains sufficiently above the noise level.
The main advantage of ITC is that it is the only assay that may be used to directly determine the enthalpy of protein–ligand binding. It is also the most accurate technique to obtain the entropy and heat capacity of interaction. The change in enthalpy is most accurately determined when the binding is tight, i.e. nanomolar or tighter. It is nearly impossible to determine the change in enthalpy of weakly binding compounds by direct ITC titration (displacement titration may be sometimes used instead). Raising the protein concentration increases the range, but may not be practical in some cases.
Due to the above-described limitations, it is good to combine FTSA-determined K d and the enthalpy determined by ITC. It is not possible to accurately determine subnanomolar K d values from ITC without applying displacement ITC techniques that are not discussed here in detail, but have been introduced and reviewed previously (Krainer et al., Reference Krainer, Broecker, Vargas, Fanghänel and Keller2012; Krainer and Keller, Reference Krainer and Keller2015).
Comparison of the observed K d,obs values obtained by the above-described four techniques is shown in Fig. 8. The FTSA is the most robust technique in our opinion, there is essentially no substrate (CO2) present (concentration of CO2 from the air is significantly below the K M of any CA), and the assay is practically without limits of the range (accessing K d,obss from at least pM to mM or greater). Therefore all compound interaction with CA isoforms has been determined by FTSA. Only a fraction of the compound affinities has been determined by the other three techniques.
Comparison of the experimentally determined K d,obs obtained by four techniques: fluorescent thermal shift assay (FTSA), isothermal titration calorimetry (ITC), stopped-flow assay of the inhibition of CA enzymatic activity, CO2 hydration (SFA), and the surface plasmon resonance (SPR). All K ds have been determined by FTSA as the most robust and reliable technique and compared with the results obtained for a portion of compounds by ITC, SFA, and SPR. The FTSA practically does not have limits or range of reliable determinations, the compound K ds may be determined from pM to mM affinity range in a single experiment, while the other three techniques have limitations of the range where reliable determinations may be made, shown with arrows and shaded in grey.
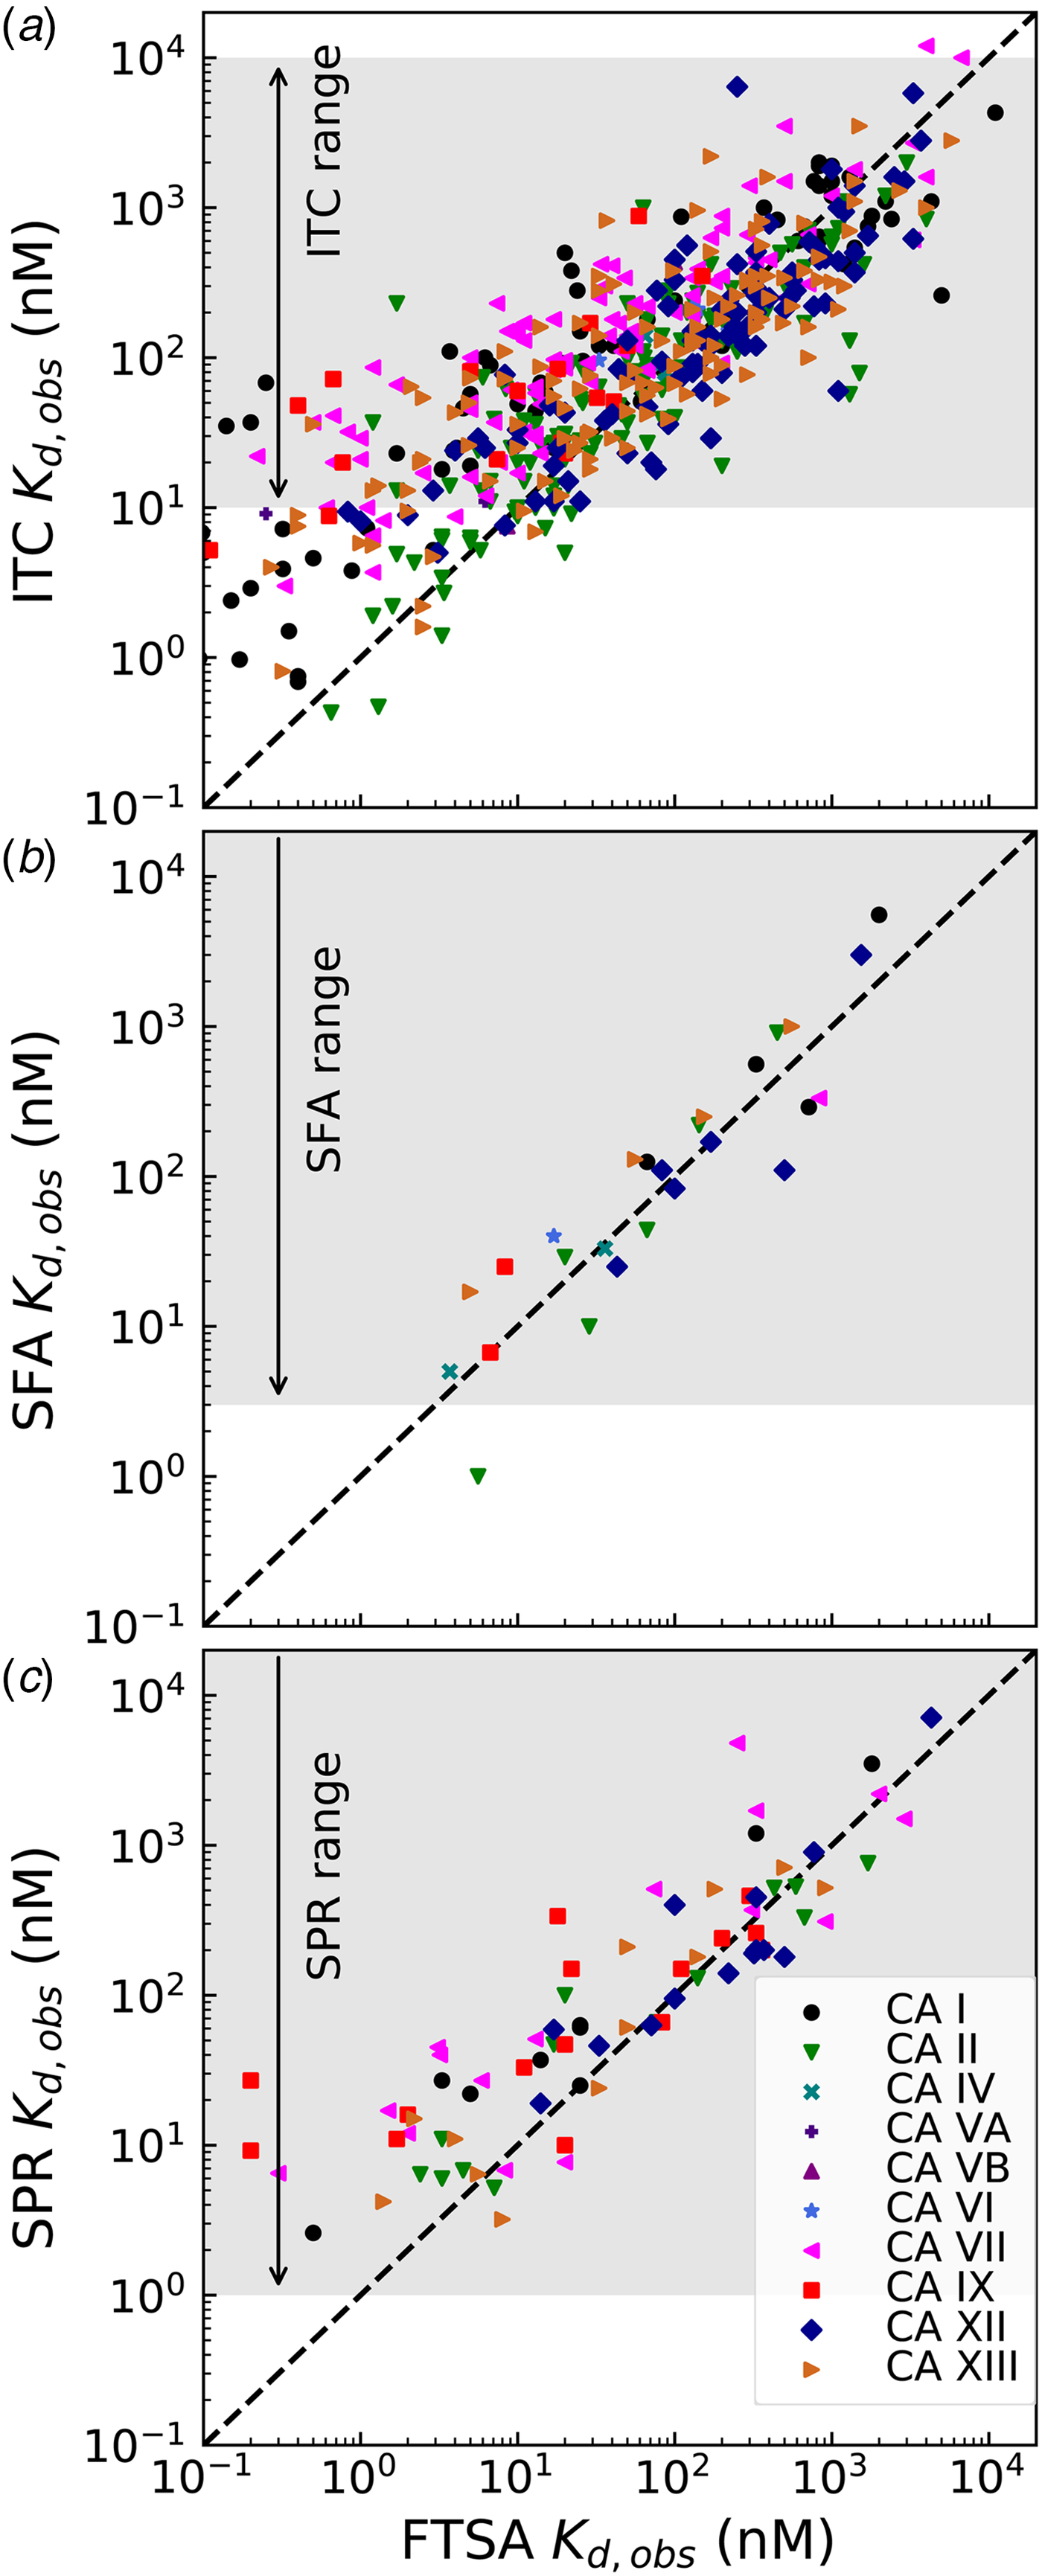
ITC cannot accurately determine the K d below 1 nM if we keep the protein concentration around 10 μM because the Wiseman c factor, equal to the product of the K b and protein molar concentration for 1 : 1 binding reactions, which shows the steepness of the titration curve (see Fig. 7 and should be in the range of approximately 5–500), (Wiseman et al., Reference Wiseman, Williston, Brandts and Lin1989) reaches 1000. Some increase of the accessible range may be achieved by reducing the protein concentration. Here we see (Fig. 8a) that there is a decent correlation between the affinities determined by FTSA and ITC in the 100 nM K d range, but the ITC-determined values tend to show reduced affinities relative to FTSA in the 1–10 nM range. ITC thus tends to underestimate the single-digit nanomolar affinities. It is also important that the spread of data may reach up to 10-fold in affinity when comparing ITC with FTSA.
There was a quite good correlation between the affinities determined by FTSA and SFA (Fig. 8b). As discussed above, it is important to use SFA to confirm that the compounds are inhibitors of the enzymatic activity. In the case of CA inhibitors, because all compounds, reviewed in this paper, are primary sulfonamides with a well-described mode of binding by a number of techniques, we do not perform the SFA for all compounds due to several reasons. First, the assay cannot determine the IC 50s below the protein concentration, which is approximately 10 nM (Smirnovienė et al., Reference Smirnovienė, Smirnovas and Matulis2017). Second, the assay is significantly more costly both in time and materials to justify its performance for all studied compounds.
The bottom panel (Fig. 8c) compares the affinities obtained by FTSA and SPR. The SPR technique is commonly used to determine both the affinity and the kinetics of compound association and dissociation from CA (Redhead et al., Reference Redhead, Satchell, Morkūnaitė, Swift, Petrauskas, Golding, Onions, Matulis and Unitt2015; Talibov et al., Reference Talibov, Linkuvienė, Matulis and Danielson2016). Similarly to the other three techniques, the spread or uncertainty of the data is quite similar.
Table 1 lists and provides some examples of K d,obs and K i values obtained by SFA, FTSA, ITC, and SPR (Smirnovienė et al., Reference Smirnovienė, Smirnovas and Matulis2017). In cases, where the four techniques yielded different values, the bold numbers show the correct determination of the affinities. For some ligands of average affinity, all four techniques yielded the same value. For example, the binding and inhibition constants of 187 interactions with CA I, CA II, CA VII, CA XII, and CA XIII were essentially the same by all techniques. However, for example, the binding affinities of 323 to CA I, and of compounds 369 and 341 to CA IX could be correctly determined only by FTSA. The remaining three assays, SFA, ITC, and SPR, confirmed that the interaction is very strong, but could not reach the actual affinity value due to above-described limitations.
Comparison of binding and inhibition constants of CA I, CA II, CA VI, CA VII, CA IX, CA XII, and CA XIII obtained by SFA (pH 7.0–7.5, 25 °C), FTSA, ITC (pH 7.0, 37 °C), and SPR (pH 7.0–7.4, 25 °C). SFA. The used K M values were, for CA I – 1.4 mM, CA II – 4.7 mM, CA VI – 6.9 mM, CA VII – 11.4 mM, CA IX – 6.9 mM, CA XII – 12 mM, and CA XIII – 13.8 mM, taken from Supuran (Reference Supuran2008). The IC 50 is the 50% inhibition concentration of enzymatic activity obtained by Hill fit of the data. K i is the inhibition constant obtained after application of the Cheng–Prusoff equation to the IC 50. The K d,obs is the dissociation constant obtained via Morrison equation. FTSA. The K d,obs is the observed dissociation constant obtained by FTSA at the CA concentration 5 to 10 µM. ITC. The K d,obs is the observed dissociation constant obtained by ITC at the CA concentration of 4 to 10 µM. SPR. The K d,obs is the observed dissociation constant obtained by SPR at the CA concentration for immobilization of 75 µg ml−1 for CA I, 100 µg ml−1 for CA II, 25 µg ml−1 for CA VII, 100 µg ml−1 for CA IX, 25 µg ml−1 for CA XII, 75μg ml−1 for CA XIII as described by Talibov et al. (Reference Talibov, Linkuvienė, Matulis and Danielson2016). Values are shown in the regular font when the results match among three methods within an approximate error of ±2 fold. Values are shown in bold to point the most reliable value when results are significantly different among the methods. Values are in italic to emphasize unreliable results when the methods should not be used due to their limitations (for SFA – concentration of the enzyme above the concentration of inhibitor, for ITC – Wiseman c-factor outside the required range). SFA, FTSA, and ITC data are taken from the references indicated next to the compound number. The standard error of K d measurements is ±2 times (Petrauskas et al., Reference Petrauskas, Baranauskienė, Zubrienė and Matulis2016; Linkuvienė et al., Reference Linkuvienė, Krainer, Chen and Matulis2016a)
Volume change upon protein–ligand binding
The above-described assays provide means to determine inhibition and inhibitor binding thermodynamic and kinetic parameters. However, the picture of protein–ligand interaction can be significantly enhanced by the determination of volumetric properties of the interactions. Unfortunately, the majority of studies are limited to the techniques, which exploit only the temperature as a thermodynamic variable and avoid studying pressure effects because such techniques are much more laborious.
There are several techniques that are capable of determining the volume of protein–ligand binding: the fluorescent pressure shift assay (PressureFluor, FPSA) (Toleikis et al., Reference Toleikis, Cimmperman, Petrauskas and Matulis2011, Reference Toleikis, Sirotkin, Skvarnavičius, Smirnovienė, Roumestand, Matulis and Petrauskas2016; Skvarnavičius et al., Reference Skvarnavičius, Toleikis, Grigaliūnas, Smirnovienė, Norvaišas, Cimmperman, Matulis and Petrauskas2017), vibrating tube densitometry(Barbosa et al., Reference Barbosa, Taboada and Mosquera2003; Son et al., Reference Son, Shek, Dubins and Chalikian2012; Toleikis et al., Reference Toleikis, Sirotkin, Skvarnavičius, Smirnovienė, Roumestand, Matulis and Petrauskas2016), and the high-pressure NMR (Wilton et al., Reference Wilton, Kitahara, Akasaka, Pandya and Williamson2009; Roche et al., Reference Roche, Caro, Norberto, Barthe, Roumestand, Schlessman, Garcia, García-Moreno and Royer2012; Toleikis et al., Reference Toleikis, Sirotkin, Skvarnavičius, Smirnovienė, Roumestand, Matulis and Petrauskas2016). They can determine the change of system volume and compressibility caused by the bound ligand. The volumetric assays have been described previously by Carey et al. (Reference Carey, Knowles and Gibson1977); Barbosa et al. (Reference Barbosa, Taboada and Mosquera2003); Chalikian and Filfil (Reference Chalikian and Filfil2003); Wilton et al. (Reference Wilton, Kitahara, Akasaka, Pandya and Williamson2009); Toleikis et al. (Reference Toleikis, Cimmperman, Petrauskas and Matulis2011, Reference Toleikis, Cimmperman, Petrauskas and Matulis2012, Reference Toleikis, Sirotkin, Skvarnavičius, Smirnovienė, Roumestand, Matulis and Petrauskas2016); Roche et al. (Reference Roche, Caro, Norberto, Barthe, Roumestand, Schlessman, Garcia, García-Moreno and Royer2012); Petrauskas et al. (Reference Petrauskas, Gylytė, Toleikis, Cimmperman and Matulis2013); Voloshin et al. (Reference Voloshin, Medvedev, Smolin, Geiger and Winter2015); Skvarnavičius et al. (Reference Skvarnavičius, Toleikis, Grigaliūnas, Smirnovienė, Norvaišas, Cimmperman, Matulis and Petrauskas2017). However, there is relatively little data available in the literature on any protein–ligand system, not mentioning the CA, and it is difficult to judge yet if these approaches will be useful in the design of ligands with desired binding properties.
Observed versus intrinsic thermodynamic binding parameters
Intrinsic affinity of binding
Sulfonamides are by far the largest class of compounds that are inhibitors of CAs. However, despite the long history and importance of sulfonamides as CA inhibitors, there still remains uncertainty in their binding mechanism. As first identified by Taylor et al. (Reference Taylor, King and Burgen1970), the binding kinetics of sulfonamide inhibitor to CA II is dependent on pH and the dependence has a U-shape, interaction is fastest near neutral pH and slows down towards acidic and alkaline regions. Application of FTSA, ITC, and SPR techniques also showed that the binding affinity is strongest near neutral pH and decreases both in the acidic and alkaline regions. The affinity decreases exactly tenfold with one pH unit both in the acidic and alkaline regions. This indicates that the CA-sulfonamide binding reaction is coupled to at least two protonation–deprotonation reactions. As pointed by Taylor et al. (Reference Taylor, King and Burgen1970), there are four possible ways for the sulfonamide compound to bind the CA, shown in Eqs. (4)–(7).
 $$\eqalign{{{\rm CA} &- {\rm Zn}^{{\rm II}}{\rm - OH}^-+ {\rm RSO}_2{\rm NH}_2}\cr & {\rightleftharpoons {\rm CA} - {\rm Zn}^{{\rm II}} - {\rm NH}_2{\rm SO}_2{\rm R} + {\rm OH}^-$$}}
 $$\eqalign{{{\rm CA} &- {\rm Zn}^{{\rm II}}{\rm - OH}^- + {\rm RSO}_2{\rm NH}^-}\cr & {\rightleftharpoons {\rm CA} - {\rm Zn}^{{\rm II}} - {\rm NH} - {\rm SO}_2{\rm R + O}{\rm H}^- }}$$
 $$\eqalign{{{\rm CA} &- {\rm Zn}^{{\rm II}} - {\rm H}_2{\rm O + RS}{\rm O}_2{\rm NH}_2}\cr & {&\rightleftharpoons {\rm CA} - {\rm Zn}^{{\rm II}} - {\rm NH}_2{\rm SO}_2{\rm R} + {\rm H}_2{\rm O}}} $$
 $$\eqalign{{\rm CA - Z}n^{{\rm II}}{\rm -} {\rm H}_2{\rm O\ +\ RS}{\rm O}_2{\rm N}{\rm H}^-}\cr &\quad\rightleftharpoons {\rm CA - Z}{\rm n}^{{\rm II}}{\rm - NH - S}{\rm O}_2{\rm R\ +} {\rm H}_2{\rm O\;} $$
The first possibility is that the electrostatically neutral (protonated) sulfonamide replaces the OH− bound to the ZnII in the active site of CA (Eq. (4)). Second, that the negatively charged sulfonamide replaces the OH− (Eq. (5)), third, that neutral sulfonamide displaces neutral water molecule (Eq. (6)), and the fourth, that the deprotonated sulfonamide (negatively charged SO2NH−) replaces the H2O molecule coordinated by the ZnII in the active site of CA (Eq. (7)). The second and third reactions have been already shown by the authors to be inconsistent with the U-shape dependence on pH. However, both the first and the fourth reactions seemed plausible and were difficult to distinguish.
We are now convinced that the fourth reaction (Eq. (7)) is the only or at least a dominant reaction that takes place when sulfonamides bind to a CA, meaning that the intrinsic binding reaction is between the negatively charged sulfonamide to such form of CA where the fourth ligand bound to the ZnII in the active site is electrostatically neutral water molecule. The first indication that the fourth reaction occurs was the spectral evidence on Co-containing CA enzyme (Engberg and Lindskog, Reference Engberg and Lindskog1984; Tu and Silverman, Reference Tu and Silverman1986). However, a more recent neutron-diffraction crystal structure of acetazolamide bound to CA II from McKenna laboratory (Fisher et al., Reference Fisher, Boone, Biswas, Venkatakrishnan, Aggarwal, Tu, Agbandje-McKenna, Silverman and McKenna2012b) directly showed that the sulfonamide amino group possesses only one proton and thus the group is deprotonated and negatively charged when bound to the CA II. Our data are consistent with this conclusion. However, it is difficult to distinguish the fourth possibility from the first using thermodynamic methods alone.
At neutral pH 7, most sulfonamides are almost fully protonated since their pK as are usually around 9 or 10, in the form that is unable to bind. However, a small fraction is deprotonated and binds to CA. When the deprotonated form is depleted, additional sulfonamide deprotonates to keep the fraction unchanged. This additional sulfonamide also binds to CA and so on until the enzyme is fully saturated with the inhibitor.
Similarly, only a part of the ZnII-coordinated molecules are in H2O form because the pK as of most human CAs is approximately 7. Thus, approximately half of CA fraction is deprotonated and must undergo protonation in order to bind the sulfonamide anion. When these linked reactions (Eq. (8)) occur, the proton must be uptaken from the buffer or released to the buffer (Fig. 9).
 $$\eqalign{&{\rm Intrinsic:\;\ CA - Z}{\rm n}^{{\rm II}}{\rm -} {\rm H}_2{\rm O} + {\rm RS}{\rm O}_2{\rm N}{\rm H}^-\cr &\quad\quad\quad\quad\quad\rightleftharpoons {\rm CA - Z}{\rm n}^{{\rm II}}{\rm - NH - S}{\rm O}_2{\rm R} + {\rm H}_2{\rm O}$$
 $${\rm Ligand}:{\rm RS}{\rm O}_2{\rm N}{\rm H}^- + {\rm \;} {\rm H}^ + {\rm \;} \rightleftharpoons {\rm \;\ RS}{\rm O}_2{\rm N}{\rm H}_2$$
 $${\rm Protein}:{\rm CA - Z}{\rm n}^{{\rm II}}{\rm - O}{\rm H}^- + {\rm H}^ + \rightleftharpoons {\rm \;\ CA - Z}{\rm n}^{{\rm II}}{\rm -} {\rm H}_2{\rm O}$$
 $${\rm Buffer}:{\rm Buf} + {\rm H}^ + \rightleftharpoons {\rm Buf}{\rm H}^ + {\rm \;} $$
 $${\rm Observed:}\,{\rm Intrinsic\ +\ Ligand\ +\ Protein\ +\ Buffer}$$
The model of the linked reactions (also shown as Eq. (8)), occurring upon sulfonamide ligand binding to CA. A sum of several binding-linked reactions occur that we observe by any experimental technique, but the Quantitative Structure–Activity Relationship (QSAR)-type analysis requires that we analyze only the intrinsic reaction and correlate the intrinsic affinity and other intrinsic parameters with the structure of the ligand and the ligand–protein complex. The linked contributing reactions must be subtracted from the observed ones to obtain the intrinsic reaction.

The fraction of deprotonated sulfonamide is dependent on the sulfonamide amino group pK a,SA and can be calculated using Eq. (9):
 $$f_{{\rm RS}{\rm O}_2{\rm N}{\rm H}^-} = \displaystyle{{{10}^{{\rm pH}-{\rm p}K_{a,{\rm SA}}}} \over {1 + {10}^{{\rm pH}-{\rm p}K_{a{\rm, SA}}}}}$$
Similarly, the fraction of binding-ready CA depends on pH and the pK a,CA of the water molecule in the active site and can be calculated using Eq. (10):
 $$f_{{\rm CAZn}{\rm H}_2{\rm O}} = \displaystyle{{{10}^{\,pK_{a,{\rm CA}}-{\rm pH}}} \over {1 + {10}^{\,pK_{a,{\rm CA}}-{\rm pH}}}}$$
The affinity of interaction will be reduced by the amount how much the fractions are reduced. In other words, the observed binding constant K b,obs indicates us a diminished K b,int due to reduced fractions. The intrinsic K b,int can be calculated using Eq. (11):
 $$K_{b,int} = \displaystyle{{K_{b,obs}} \over {\,f_{{\rm CAZn}{\rm H}_2{\rm O}} \times f_{{\rm RS}{\rm O}_2{\rm N}{\rm H}^-}}}$$
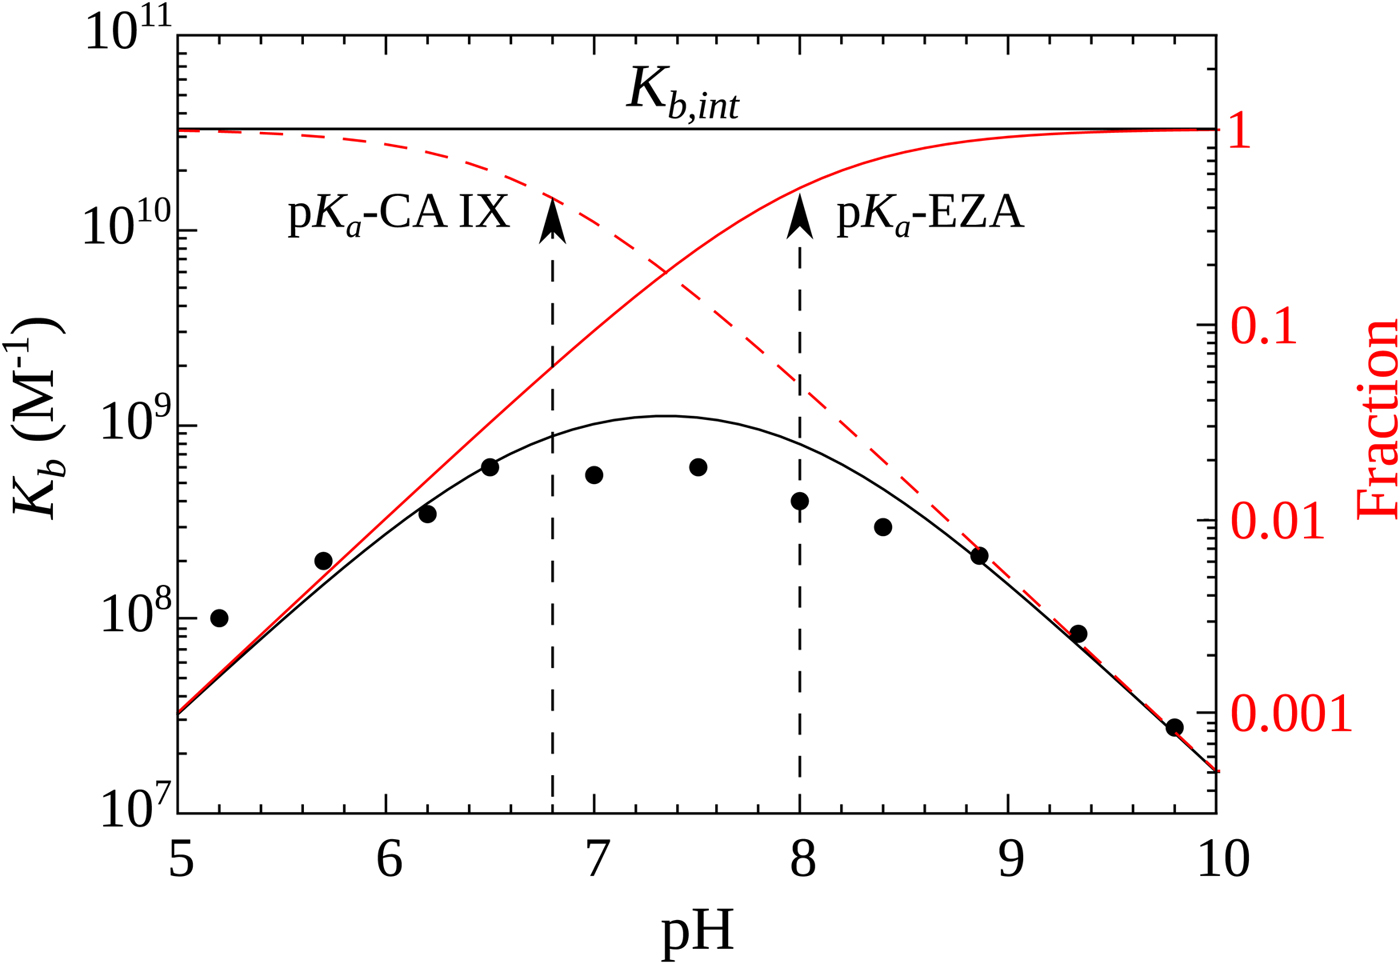
Figure 10 shows the relationship between the intrinsic and observed affinities and the dependence of the latter on pH. The intrinsic affinity is independent of pH, but because there are a reduced fraction of both interacting components at both acidic and alkaline pHs, there is energy needed to overcome this linked reaction and therefore the observed affinity is reduced
Relationship between the intrinsic (independent of pH, shown as horizontal line) and observed affinities (filled circles fit by the solid line of overturned U-shape) of 1 binding to CA IX. The observed affinity is reduced both at acidic and alkaline pHs due to reduced fractions of available binding-ready species (negatively charged sulfonamide, shown as solid red line, and CA, bearing the neutral water molecule, shown as a dashed red line).
In turn, the intrinsic Gibbs energy of binding can be calculated using Eq. (12):
 $$\Delta G_{int} = -RT\,{\rm ln}(K_{b,int})$$
The change in the standard Gibbs energy of ligand binding dependence on pH has a U-shape, similar to the K d, but upside down as K b. Figure 11 shows that the U-shapes are obtained for all catalytically active human CAs. All experimental techniques discussed in this paper (FTSA, SFA, ITC, and SPR), yield the U-shape inhibitor binding Gibbs energy dependence on pH. In all cases, the affinity is strongest in near-neutral pH range and decreases in both directions. The observed affinity comes closest to the intrinsic value at near-neutral pH, but usually does not reach it and thus is almost never observed experimentally.
The dependence of ΔG obs on pH determined by FTSA (filled circles) and ITC (open circles) methods at 25 °C. Circles show the binding of 1 and squares of 303 (to CA III and CA VA). Solid curve is a fit of the model, solid line is intrinsic Gibbs energy of binding, dashed line is a fraction of ligand, dotted line is a fraction of protein. Experiments were performed in universal buffer made of 50 mM sodium phosphate, 50 mM sodium acetate, and 25 mM sodium borate containing 100 mM NaCl and up to 2% DMSO as previously described in: CA I and CA II (Morkūnaitė et al., Reference Morkūnaitė, Gylytė, Zubrienė, Baranauskienė, Kišonaitė, Michailovienė, Juozapaitienė, Todd and Matulis2015), CA IV (Mickevičiūtė et al., Reference Mickevičiūtė, Timm, Gedgaudas, Linkuvienė, Chen, Waheed, Michailovienė, Zubrienė, Smirnov, Čapkauskaitė, Baranauskienė, Jachno, Revuckienė, Manakova, Gražulis, Matulienė, Di Cera, Sly and Matulis2017), CA VB (Kasiliauskaitė et al., Reference Kasiliauskaitė, Časaitė, Juozapaitienė, Zubrienė, Michailovienė, Revuckienė, Baranauskienė, Meškys and Matulis2016), CA VI (Kazokaitė et al., Reference Kazokaitė, Milinavičiūtė, Smirnovienė, Matulienė and Matulis2015), CA VII (Pilipuitytė and Matulis, Reference Pilipuitytė and Matulis2015), CA IX (Linkuvienė et al., Reference Linkuvienė, Matulienė, Juozapaitienė, Michailovienė, Jachno and Matulis2016b), CA XII (Jogaitė et al., Reference Čapkauskaitė, Zubrienė, Smirnov, Torresan, Kišonaitė, Kazokaitė, Gylytė, Michailovienė, Jogaitė, Manakova, Gražulis, Tumkevičius and Matulis2013), CA XIII (Baranauskienė and Matulis, Reference Baranauskienė and Matulis2012), and CA XIV (Juozapaitienė et al., Reference Juozapaitienė, Bartkutė, Michailovienė, Zakšauskas, Baranauskienė, Satkūnė and Matulis2016). All panels are drawn at the same scale to help visualize the differences in affinities of binding.
Intrinsic enthalpy of binding
The change in the observed enthalpy on the binding, similarly to ΔG, also has contributions from all linked processes, including inhibitor deprotonation, protonation of the CA-bound hydroxide, and the compensating buffer effects. Therefore, to get the change in the intrinsic enthalpy on binding it is necessary to subtract all linked processes as shown in Eq. (13):
 $$\Delta H_{int} = \Delta H_{obs}-n_{{\rm SA}}\Delta H_{\,pr,{\rm SA}}-n_{{\rm CA}}\Delta H_{\,pr,{\rm CA}} + n_{buf}\Delta H_{\,pr,buf}$$
where ΔH obs – the observed enthalpy of binding obtained by direct ITC titration, ΔH pr,SA – the enthalpy of protonation of deprotonated inhibitor, ΔH pr,CA – the enthalpy of protonation of the CA-bound OH−, and ΔH pr,buf – the enthalpy of buffer protonation. The ns denote the numbers of protons uptaken or released:
 $$n_{{\rm SA}} = f_{{\rm RS}{\rm O}_2{\rm N}{\rm H}^-}-1$$
is the number of protons released from the inhibitor to buffer (n inh = −1 to 0),
 $$n_{{\rm CA}} = 1-f_{{\rm CAZn}{\rm H}_2{\rm O}}$$
is the number of protons uptaken by the CA-bound OH− (n CA = 0 to 1),
 $$n_{buf} = n_{{\rm SA}} + n_{{\rm CA}}$$
is the net sum of protons uptaken by the buffer both from the ligand and protein or released by the buffer to the ligand or protein (n buf = −1 to 1).
The enthalpy of protonation of TRIS base is −47.45 kJ mol−1 and of  ${\rm HPO}_4^{2-} $ is −5.1 kJ mol−1 at 25 °C (Goldberg et al., Reference Goldberg, Kishore and Lennen2002).
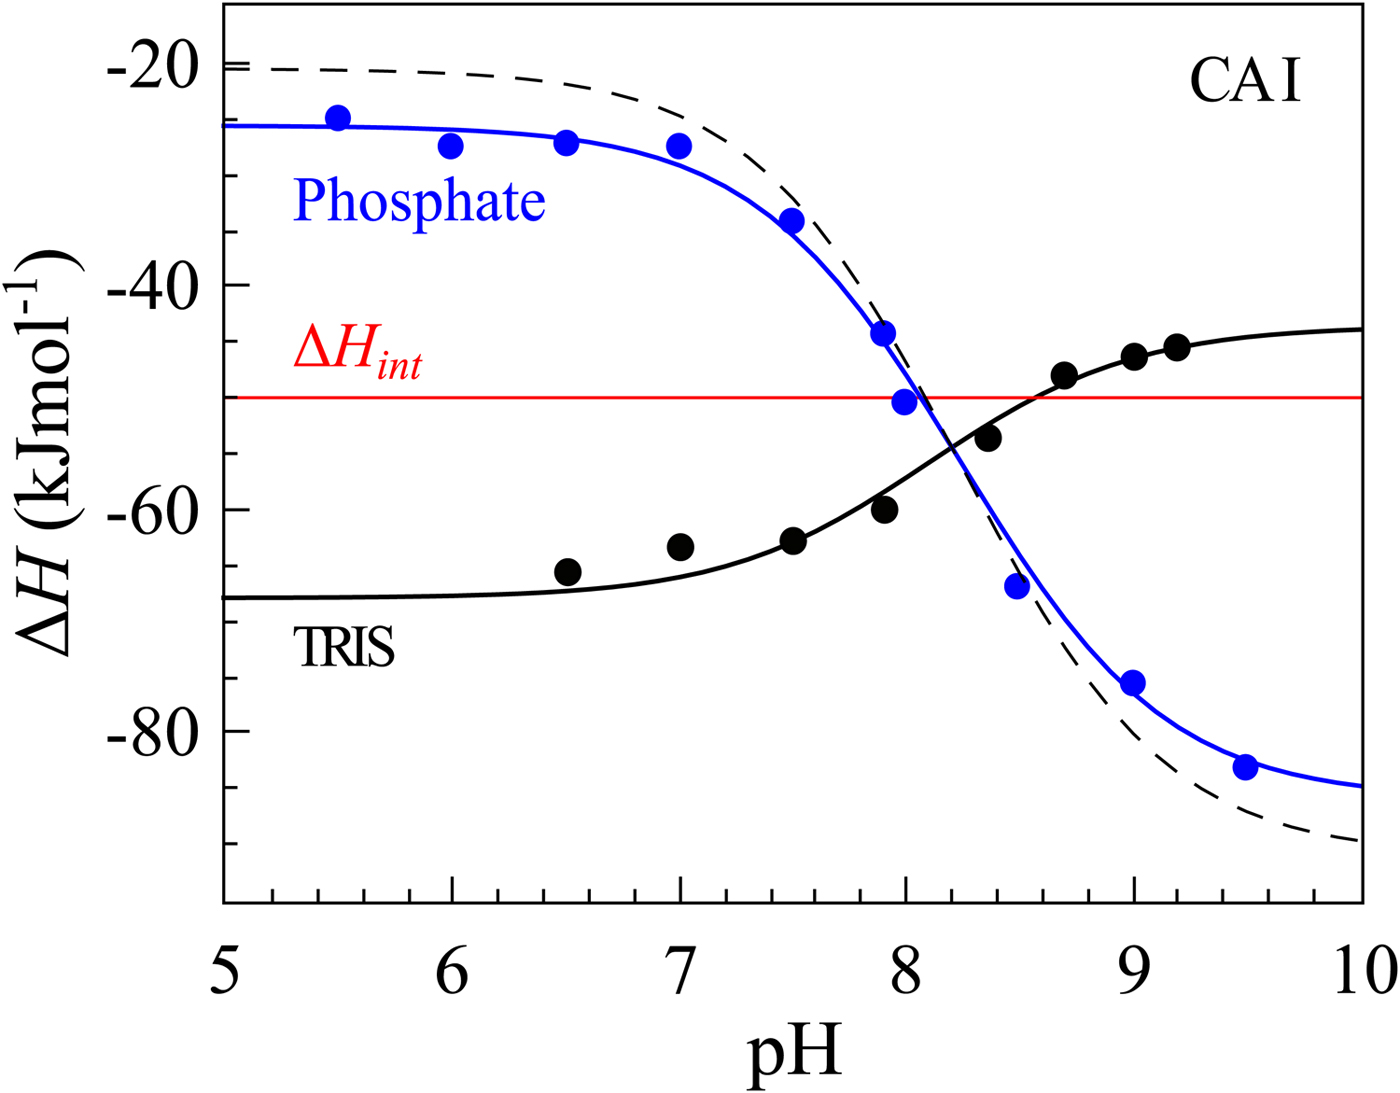
If we perform sulfonamide–CA ITC titrations in various buffers at various pHs as shown in Fig. 12, an X-shape dependence is observed as shown in Fig. 13. At low pH, the observed enthalpies (ΔH obs) in phosphate buffer are low in magnitude, while in TRIS – significantly more exothermic. The difference between the observed enthalpies is equal to the difference between the enthalpies of protonation of the two buffers. In alkaline region, the situation is reversed – the enthalpies in phosphate became much more exothermic, while in TRIS – less exothermic. The red solid line shows the position of the intrinsic enthalpy (ΔH int) of 1 binding to CA I. The intrinsic enthalpy is independent of pH. The dashed line shows a hypothetical situation for the observed enthalpy dependence on pH if the buffer had exactly zero enthalpy of protonation (ΔH pr,buf = 0). The difference between the dashed line and the intrinsic enthalpy in the acidic region is equal to the enthalpy of inhibitor protonation (ΔH pr,SA), while in the alkaline region – to the enthalpy of protonation of the CA-bound OH− (ΔH pr,CA).
ITC data of 1 binding to CA IX in two buffers at several pHs at 25 °C. The observed enthalpies depended both on the buffer and on the pH used in the experiment. In such cases, it is necessary to obtain the intrinsic enthalpy to perform any meaningful Structure–Activity Relationship (SAR)-type study. The inset shows a typical ITC raw data curve.
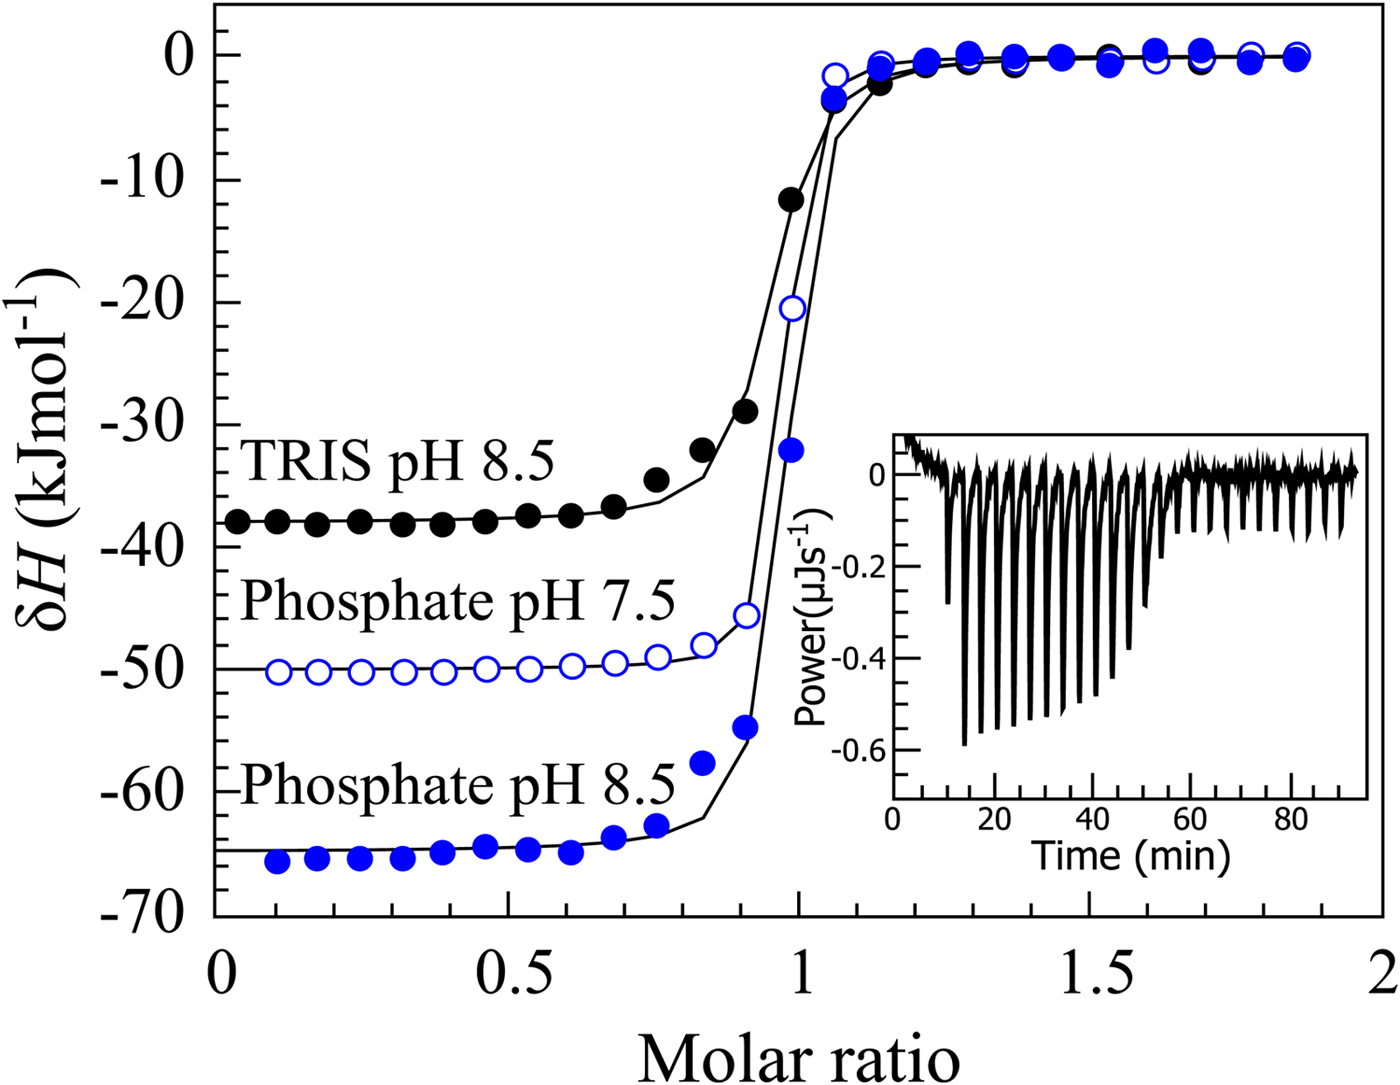
The observed enthalpies obtained by ITC of 1 binding to CA I in sodium phosphate or TRIS chloride buffer as a function of pH at 25 °C. Blue datapoints show the ΔH obs in phosphate buffer, while black – in TRIS. Solid black and blue lines are global fits to the above-described model (fit in the way where the pK as are consistent with the FTSA data for each isoform) yielding the intrinsic enthalpy of binding (ΔH int, red line) that is independent of pH. Dashed line shows a hypothetical situation how the observed enthalpy dependence should look like if the enthalpy of buffer protonation was equal to zero.
The same procedure has been performed with every purified CA isoform and the data is shown in Fig. 14. All of the nine isoforms where the data has been obtained exhibited similar X-shaped curves, but since the protein pK as were slightly different and the intrinsic enthalpies of binding were also different among isoforms, they yielded slightly different curves. It should be noted that the precision of the enthalpies is really high, but there still were some discrepancies between the observed data and the model curves, especially at the acidic and alkaline pH. We assume that these discrepancies are due to protein destabilization. However, an attempt was made to determine many more data points for one isoform in one buffer. The data for CA XIII in phosphate buffer are shown in Fig. 15.
ITC data of 1 binding to CA isoforms at 25 °C. Filled circles – ΔH obs determined in sodium phosphate buffer, open circles – ΔH obs determined in TRIS buffer, dotted line shows value of ΔH int of 1 binding, solid curves are fits of experimental data, while the dashed curve is a fit of a hypothetical situation if there were no buffer or the enthalpy of buffer protonation (ΔH pr,buf) was equal to zero. The fits were global with the FTSA U-shapes keeping the sulfonamide and CA pK as the same. Experiments were performed in either 50 mM sodium phosphate or 50 mM TRIS chloride buffer containing 100 mM NaCl and up to 2% DMSO as previously described in: CA I and CA II (Morkūnaitė et al., Reference Morkūnaitė, Gylytė, Zubrienė, Baranauskienė, Kišonaitė, Michailovienė, Juozapaitienė, Todd and Matulis2015), CA IV (Mickevičiūtė et al., Reference Mickevičiūtė, Timm, Gedgaudas, Linkuvienė, Chen, Waheed, Michailovienė, Zubrienė, Smirnov, Čapkauskaitė, Baranauskienė, Jachno, Revuckienė, Manakova, Gražulis, Matulienė, Di Cera, Sly and Matulis2017), CA VB (Kasiliauskaitė et al., Reference Kasiliauskaitė, Časaitė, Juozapaitienė, Zubrienė, Michailovienė, Revuckienė, Baranauskienė, Meškys and Matulis2016), CA VI (Kazokaitė et al., Reference Kazokaitė, Milinavičiūtė, Smirnovienė, Matulienė and Matulis2015), CA VII (Pilipuitytė and Matulis, Reference Pilipuitytė and Matulis2015), CA IX (Linkuvienė et al., Reference Linkuvienė, Matulienė, Juozapaitienė, Michailovienė, Jachno and Matulis2016b), CA XII (Jogaitė et al., Reference Čapkauskaitė, Zubrienė, Smirnov, Torresan, Kišonaitė, Kazokaitė, Gylytė, Michailovienė, Jogaitė, Manakova, Gražulis, Tumkevičius and Matulis2013), CA XIII (Baranauskienė and Matulis, Reference Baranauskienė and Matulis2012). All panels are drawn at the same scale to help visualize the differences in enthalpies of binding. No data has been determined at comparable conditions for CA III, CA VA, and CA XIV. The overall pattern of the X-shapes is similar, but details are different due to different pK a,CA and ΔH int for each isoform.
The enthalpy changes upon compound 303 binding to CA XIII at various pHs. The curve was fit using the following parameters: pK a,SA = 6.25, pK a,CA = 8.3, ΔH int = −37 kJ mol−1 , ΔH pr,SA = −28 kJ mol−1 , ΔH pr,CA = −40 kJ mol−1. The open and closed symbols show the data obtained by two independent researchers. The solid curve matched the data resembling all bends in the curve except the discrepancy in the alkaline region. Possibly the protein is slightly destabilized in this region. The horizontal straight line shows the change in the intrinsic enthalpy upon binding if we assume that the reaction occurs according to Eq. (7). However, the same indistinguishable curve would be obtained for Eq. (4) and Eq. (7). The intrinsic enthalpy would then be different. The thermodynamic data alone cannot distinguish the models and we base our decision that Eq. (7) is correct based on crystallographic data.
Most researchers have based the choosing of the lead compound for development on the observed parameters, observed affinity or observed enthalpy. From the first glance, it may seem that it is sufficient to experimentally determine the physiologically relevant compound affinities. Thus, one may be interested in the affinities observed at the pH 7.4. It seems that it is most relevant to correlate the compound chemical structures with the binding data obtained at such pH. However, this is only partially true and may lead to erroneous conclusions. For example, if the binding affinities of two compounds are compared where the compounds have highly different pK as (e.g., 8 and 11), then if the compound with the pK a 8 is 1000-fold stronger binder than the compound with pK a 11, one may assume that the first compound is better attached to the CA. This conclusion is incorrect because the higher affinity is entirely explained by the difference in the pK a and both compounds would recognize the protein surface with identical affinity.
As shown in this section, the observed enthalpies are not really informative, instead, it is the intrinsic enthalpy change that describes the interaction. The buffer, ligand, and protein contributions may be so large that they may overwhelm the enthalpy data and the compounds would thus be ranked in a completely wrong order. Therefore, it is essential to determine the mechanism and calculate intrinsic enthalpies to be able to rank compounds in the order of increasingly exothermic enthalpy.
In this work, we attempted to determine intrinsic thermodynamic parameters of a series of sulfonamide compounds to the 12 catalytically active human CA isoforms. Intrinsic affinities and intrinsic enthalpies were obtained for the structure–thermodynamics correlations.
Protonation p K a and enthalpy of CA–ZnII-bound water molecule of all 12 human CA isoforms
It is not straightforward to determine the pK a and the enthalpy of protonation of the ZnII-bound hydroxide/water molecule. Differently, from the compounds, it is not possible to pH-titrate the protein and record with spectrophotometer or titration calorimeter. Instead, in order to determine the pK a researchers have determined the pH dependence of inhibition of enzymatic activity or replaced Zn with Co that exhibited visible spectral changes upon the change in pH. However, it is disputable to which extent such non-natural CA represents the native CA.
In addition, we have determined the pK as of most CA isoforms by fitting the inhibitor affinities at various pHs as explained earlier in the discussion of U-shaped dependencies. The enthalpies of protonation were determined via the global fit of the X-shaped curves obtained by ITC titration of an inhibitor in two buffers. Both the pK a and the enthalpy of protonation had to be obtained only once with one inhibitor and then can be applied for other inhibitors to obtain the intrinsic energetics of binding to a CA.
These data are summarized in Table 2 which shows the thermodynamic parameters of protonation of the hydroxide anion bound to catalytically active CA isoforms. The pK as of human CAs have been determined previously by using numerous techniques, see the references in Table 2. Their values span between approximately 6 and 8.5. The values determined by FTSA and ITC were close to the values previously determined by other techniques. However, there were several outliers of up to 1 pK a unit. It seems that CA I and CA XIII have rather high pK as, above 8.0. Remaining ones are essentially the same as determined previously. The standard deviation of combined FTSA and ITC determinations in the pH dependencies described above do not exceed 0.2 pH or pK a units. This accuracy is highly dependent on the correct calibration of the pH-meters and standard buffer preparations. The Gibbs energy changes upon protonation were recalculated according to Eq. (12). The enthalpies were the result of the global fit of ITC titrations of each CA isoform with 1 at a series of pH as explained above. The entropies were obtained by subtracting the Gibbs energy changes from enthalpies (Eq. (3)). The entropy values carry a largest standard deviation, a sum of deviations of the enthalpy and Gibbs energy.
Thermodynamic parameters of protonation of CA-ZnII-bound hydroxide anion (Eq. (8), third reaction) for all 12 catalytically active CA isoforms. The pK a values determined by various methods and taken from the earlier literature are listed in the second column together with the references. Other values were determined by FTSA and ITC with the references listed in the first column next to the CA isoforms. The uncertainty of the pK a values determined by FTSA and ITC is approximately 0.2 pH units, while for the change in Gibbs energies and enthalpies it is approximately 2 kJ mol−1

Determination of the pK a and the change of enthalpy of protonation of the sulfonamide inhibitor amino group
Sulfonamide inhibitor amino group deprotonates with a pK a between approximately 6 and 11. The actual value depends on the chemical structure of the compound, the presence of electron-withdrawing and donating groups, the size of the aromatic conjugated system and other factors. In order to calculate the intrinsic parameters of these sulfonamide inhibitor binding to CAs, it was necessary to determine the pK as and enthalpies of their protonation.
The sulfonamide amino group pK a may be roughly estimated from the proton NMR spectrum. The spectrum is determined for every newly synthesized compound thus the information is readily available. The chemical shift of the amino group protons correlates approximately linearly with the spectrophotometrically measured pK a (Fig. 16).
Correlation between the pK as of sulfonamide amino group (determined spectrophotometrically) and the chemical shift of the sulfonamide amino group protons as determined by NMR in deuterated DMSO solvent. Three series of compounds are distinguished in three colors and symbol shapes, VD series are mostly fluorinated benzenesulfonamides, EA and E series are mostly chlorinated compounds. The correlation is approximately linear. The plot may be used to obtain an estimate of the amino group pK a from proton NMR data when characterizing newly synthesized primary sulfonamides.
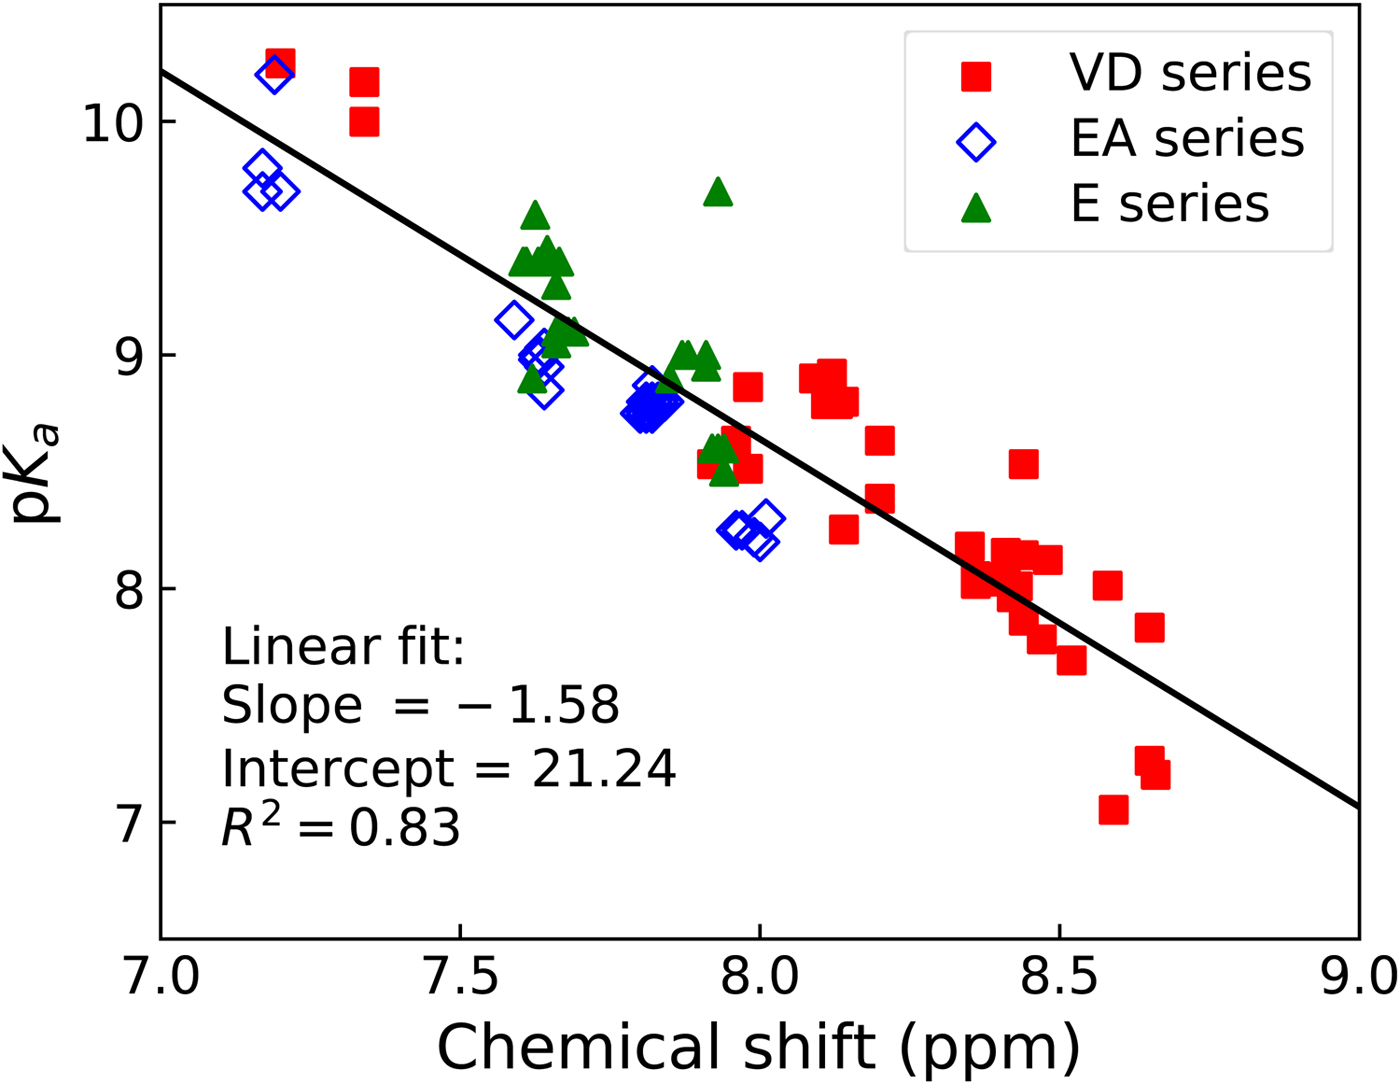
To determine the pK a of the sulfonamide, the compound solution may be pH-titrated and the midpoint pH of the titration would correspond to the pK a, as shown in Fig. 17 (Ladbury and Doyle, Reference Ladbury and Doyle2004; Morkūnaitė et al., Reference Morkūnaitė, Gylytė, Zubrienė, Baranauskienė, Kišonaitė, Michailovienė, Juozapaitienė, Todd and Matulis2015). However, as shown by the Whitesides group (Snyder et al., Reference Snyder, Mecinović, Moustakas, Thomas, Harder, Mack, Lockett, Héroux, Sherman and Whitesides2011), it is easier to determine the pK a by preparing the solution of the compound in a series of buffers, made at 0.5 pH unit, and recording the UV spectrum of the solution at each pH. The spectrum changes around the pK a and it is easy to find the wavelengths of the largest change. The absorbance values at those pH are then used and plotted as a function of pH and normalized to the unit as shown in Fig. 17a and c.
Determination of the pK a and enthalpy of protonation (ΔH pr,SA) of the sulfonamide amino group. Left panels (a), (c), and (e) show the spectrophotometric, while right panels (b), (d), and (f) show the ITC data. (a) UV-Vis spectra of the compound solution in buffers of various pH. (c) The normalized absorbance change at a chosen wavelength or ratio of two wavelengths. (e) Determination of the ΔH pr,SA via van't Hoff relationship, the dependence of the pK a on temperature. (b) ITC raw data of titrating a base-neutralized (with 1.5 equiv.) sulfonamide with HNO3. (d) Integrated ITC curves of the sulfonamide titration with acid. (f) Determination of the heat capacity of protonation by performing the ITC titrations at various temperatures. The ΔC p values for 310 and 369 were equal to 107 J mol−1 K−1 and 88 J mol−1 K−1, respectively.
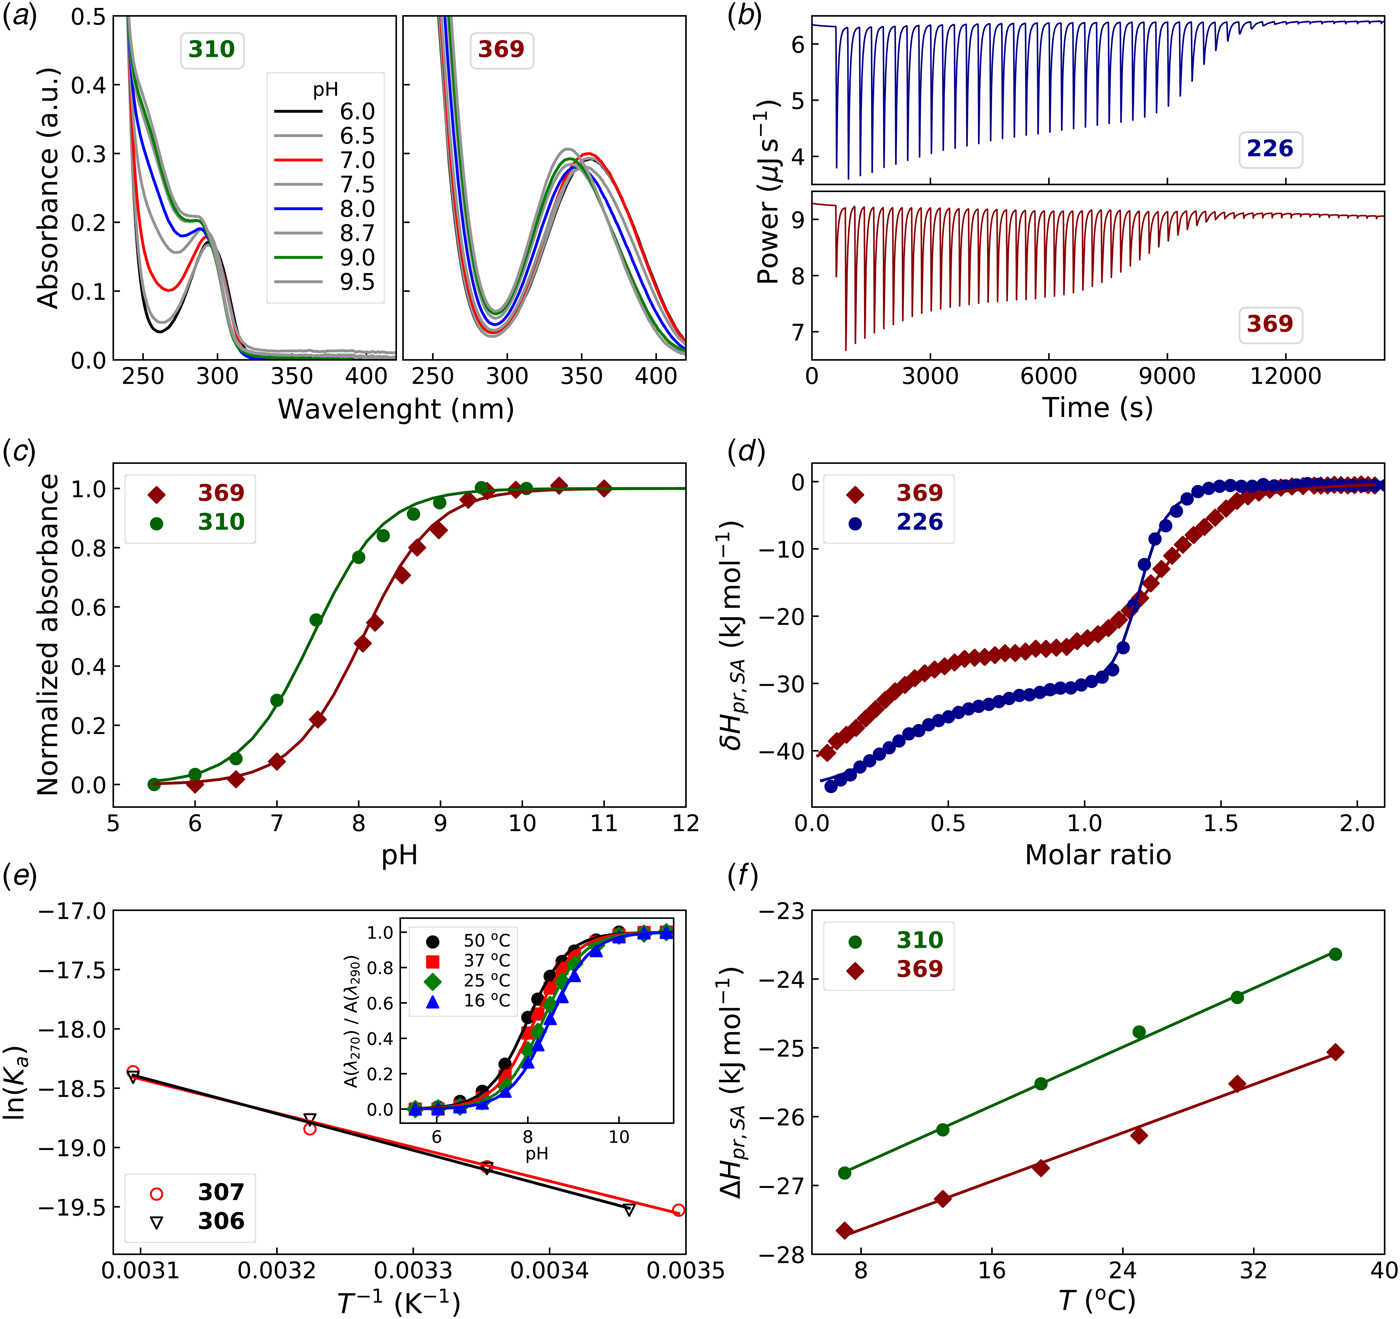
The enthalpies of sulfonamide amino group protonation may be determined by titrating the compound solution with an acid in an ITC calorimeter at a constant temperature. The compound in a solid pure form exists as a protonated electrostatically neutral sulfonamide. Therefore, it must be deprotonated by applying a sufficient amount of base to achieve the pH sufficiently above the pK a for accurate determination. We usually apply 50% surplus of the base and therefore the resultant ITC curves appear as two-step ITC reactions. Titration of such solution with a strong acid provides a direct measurement of the enthalpy of protonation as shown in Fig. 17d.
Alternatively, the enthalpy of protonation may be determined by applying the van't Hoff relationship and performing the pK a determination at several temperatures as shown in Fig. 17e. However, such determination is not as accurate as ITC because it is assumed here that the enthalpy of protonation is independent of temperature in the studied temperature range. To some extent this assumption is correct, but the enthalpy is temperature-dependent as seen from the ITC determinations at various temperatures (Fig. 17f). There is a non-zero heat capacity associated with the protonation process. The heat capacity change upon protonation is positive (Matulis and Todd, Reference Matulis, Todd, Ladbury and Doyle2004; Morkūnaitė et al., Reference Morkūnaitė, Gylytė, Zubrienė, Baranauskienė, Kišonaitė, Michailovienė, Juozapaitienė, Todd and Matulis2015) as usually is the case of ionic binding reactions.
Why intrinsic data is necessary for making compound structure–thermodynamics correlations
It is often thought that it is sufficient to make a SAR-type analysis based on the observed data. This may be true to some extent when the compounds are very similar and there is no need to make explanations why one or another compound binds stronger or weaker to a particular protein. However, if we would like to understand the physico-chemical reasons behind the observed thermodynamic parameters, e.g., determine the contributions of particular atoms to the binding energetics, it is necessary to operate with the intrinsic parameters.
Figure 18 shows the observed and intrinsic K ds for a series of compound binding to human CA VI. The compounds were arranged in the order of decreasing intrinsic affinity. It is clear that the intrinsic and observed affinities do not correlate for these compounds. The observed K d for the first and last compound in the figure are almost the same, but the intrinsic affinities differ by more than 300 fold. Not knowing the intrinsic values would yield completely wrong conclusions about the structural determinants of the compounds that cause the affinity to be greater or smaller.
The observed and intrinsic K d of a series of sulfonamide compound interaction with CA VI (Kazokaitė et al., Reference Kazokaitė, Milinavičiūtė, Smirnovienė, Matulienė and Matulis2015). There is clearly no correlation between the observed and intrinsic binding affinities.

Another example (Fig. 19) shows a different situation when the observed binding constants are quite different, but the intrinsic ones are nearly the same. If only the observed data were available, one could make an erroneous conclusion that fluorines substantially increase the affinity of the compound towards CA I due to the contacts between fluorines and the protein. However, in actuality, fluorines increase the affinity by only 1.5-fold (equal to the ratio of the intrinsic binding constants) due to direct contacts and the remaining 100-fold increase in the observed affinity arises simply due to the reduction of the pK a of the sulfonamide amino group by electron-withdrawing capabilities of the fluorine atoms.
The observed and intrinsic K d of two sulfonamide compound interaction with CA I. The compounds are para-substituted benzenesulfonamides, one of them with four fluorines on the benzene ring. The observed affinity showed that the F-bearing compound bound CA I significantly stronger than the non-fluorinated compound. The intrinsic K ds were practically equal for both compounds, but the observed ones differed by 150-fold mostly due to the reduction of the pK a of the fluorinated compound and not direct recognition between the F atoms and the protein surface.

Intrinsic kinetics of sulfonamide inhibitor interaction with the CAs
It has been shown that sulfonamide inhibitors bind CAs with an unusually slow association kinetics, too slow to be explained by a diffusion-limited association (Linkuvienė et al., Reference Linkuvienė, Matulienė, Juozapaitienė, Michailovienė, Jachno and Matulis2016b). We have performed the kinetic measurements as a function of pH and showed that the apparent discrepancy may be explained by the application of the same model that was applied to determine the intrinsic thermodynamic parameters of binding (Linkuvienė et al., Reference Linkuvienė, Talibov, Danielson and Matulis2018). After the correction of the association rates by the available fractions of the binding-ready deprotonated sulfonamides, the rates appeared to be much more consistent with the diffusion-limited single-step kinetics.
The kinetics of sulfonamide association was determined by SPR. Typical data are shown in Fig. 20. The dependence of the association rates on pH (Fig. 21) shows that the rates exhibit an upside U-shape and may be explained by the fractions of available deprotonated sulfonamide and protonated CA. The intrinsic association rate k a,int is pH-independent but almost never observed experimentally because the fractions are much lower than 1. Contrary, the dissociation rates k d,int appear to be independent of pH as expected for a simple 1 : 1 binding case. Therefore, the intrinsic dissociation rates could be observed experimentally directly by SPR.
An example of raw SPR data. Interaction of 368 with CA II at pH 8.0 as described by Linkuvienė et al. (Reference Linkuvienė, Talibov, Danielson and Matulis2018). The data are shown in black while the globally fitted curves – in red. Each consecutive curve was obtained at a half concentration of the compound as compared with the previous one.
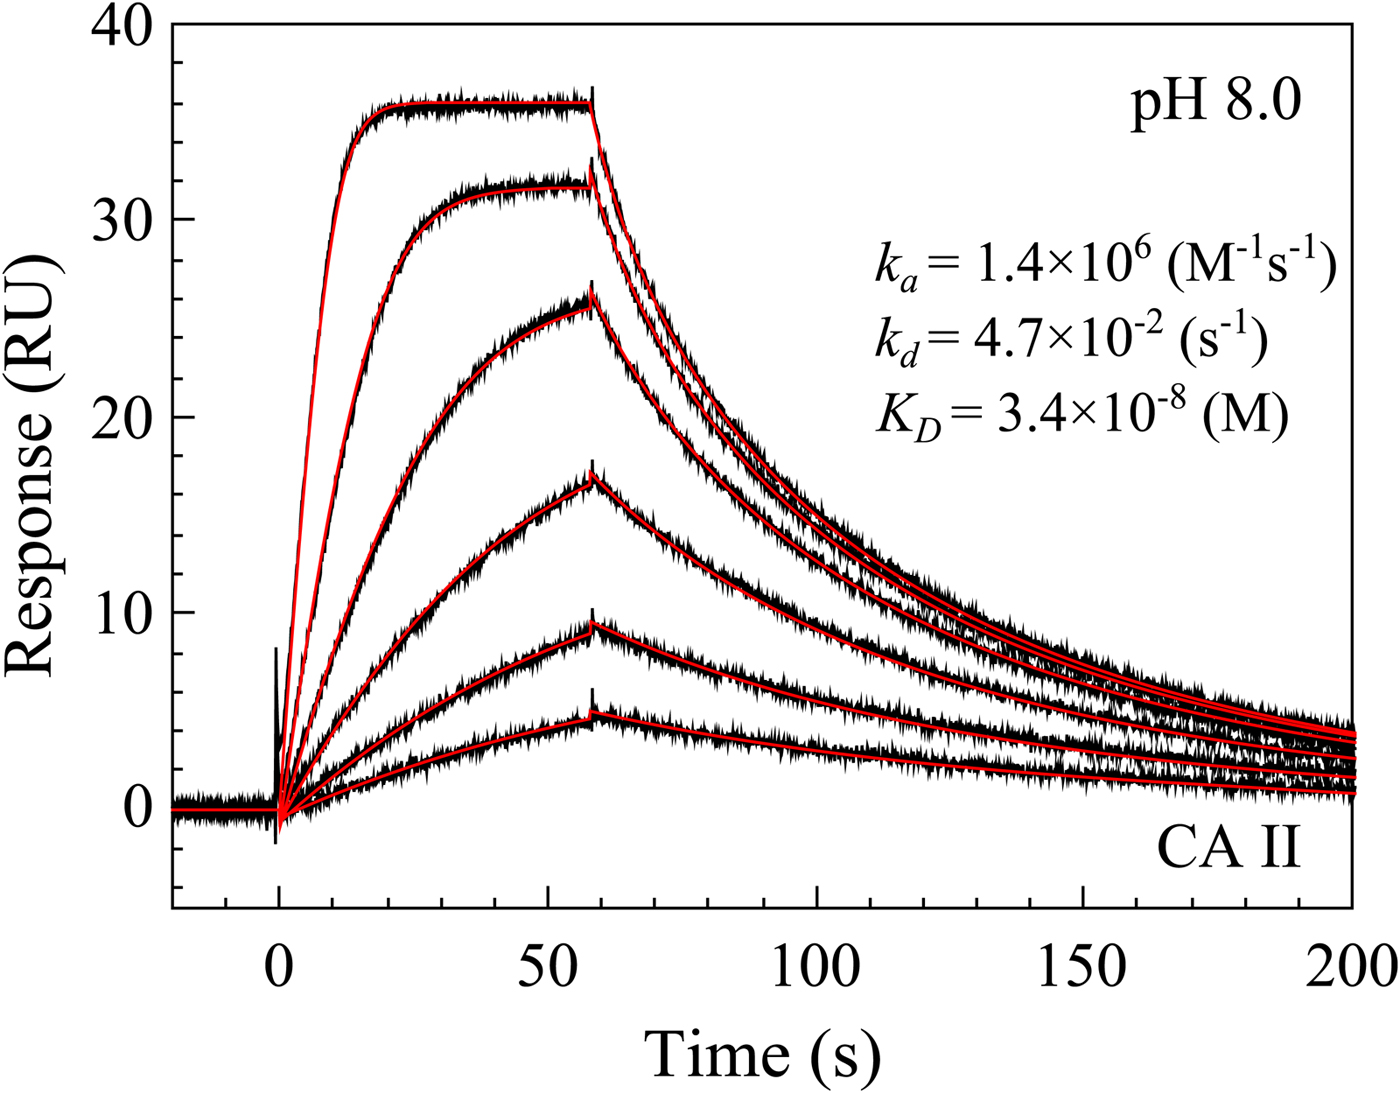
The dependence of observed k a (left graph) and observed k d (right graph) on pH at 25 °C. It is obvious, as previously observed by Taylor et al. (Reference Taylor, King and Burgen1970), that the on-rate k a depends on pH in a similar fashion as the thermodynamic K D. However, the dissociation rate k d is independent of pH as shown on the right graph drawn at the same scale as the left one.

The model explaining the pH kinetic data is presented in Fig. 22. The linked protonation-deprotonation reactions explain the apparently slow interaction kinetics. Figure 23 shows two association rates for the same compound, but one dissociation rate. The two association rates are connected by a vertical line. The upper point represents an intrinsic association rate that would be observed under such hypothetical conditions when the fractions of both interacting species are equal to 1. The lower point is the experimentally observed association rate.
The model of linked reactions, similar to the model explaining the intrinsic thermodynamics described above, that explains the pH dependence of the association rate. The observed association rate depends on pH while the observed dissociation rate is independent of pH and thus is equal to the intrinsic dissociation rate. The intrinsic association rates may be calculated applying the same equations describing the fractions of binding-ready species as in the thermodynamic calculations above.
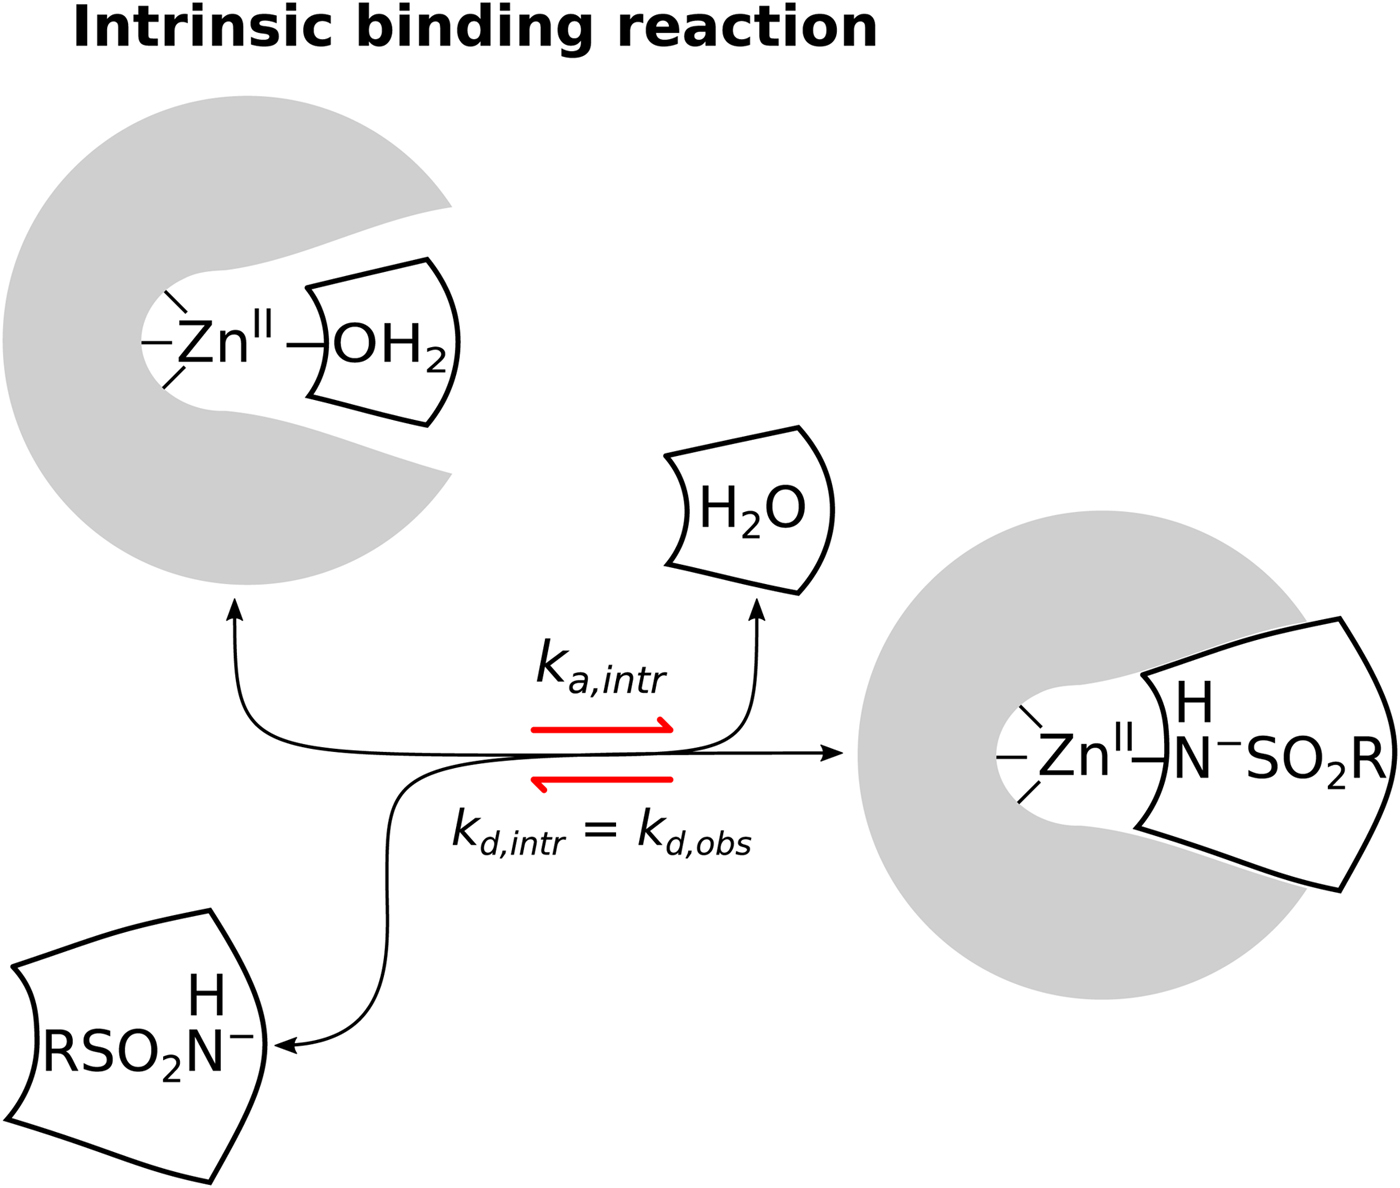
Association-dissociation rates for a series of compound interaction with several CA isoforms. Each compound-CA interaction is described by two points connected by a vertical line. The upper point describes the intrinsic k a and the lower point describes the observed k a. The dissociation rate k d is the same, observed or intrinsic, therefore there is only one point on the horizontal axis. Observed k a and k d values in the right side of the graph were obtained using SPR, while k ds in the grey-shaded area could not be determined with the desired precision by SPR and thus were calculated using K D obtained by FTSA and k a obtained by SPR. The leftmost three compounds exhibit extremely slow dissociation and their residence times are in the order of several hours. Dashed diagonal lines represent isoaffinity lines with the thermodynamic K d values listed above and on the right side of the graph. Different colors and symbol shapes represent compound binding kinetic parameters to several CA isoforms.
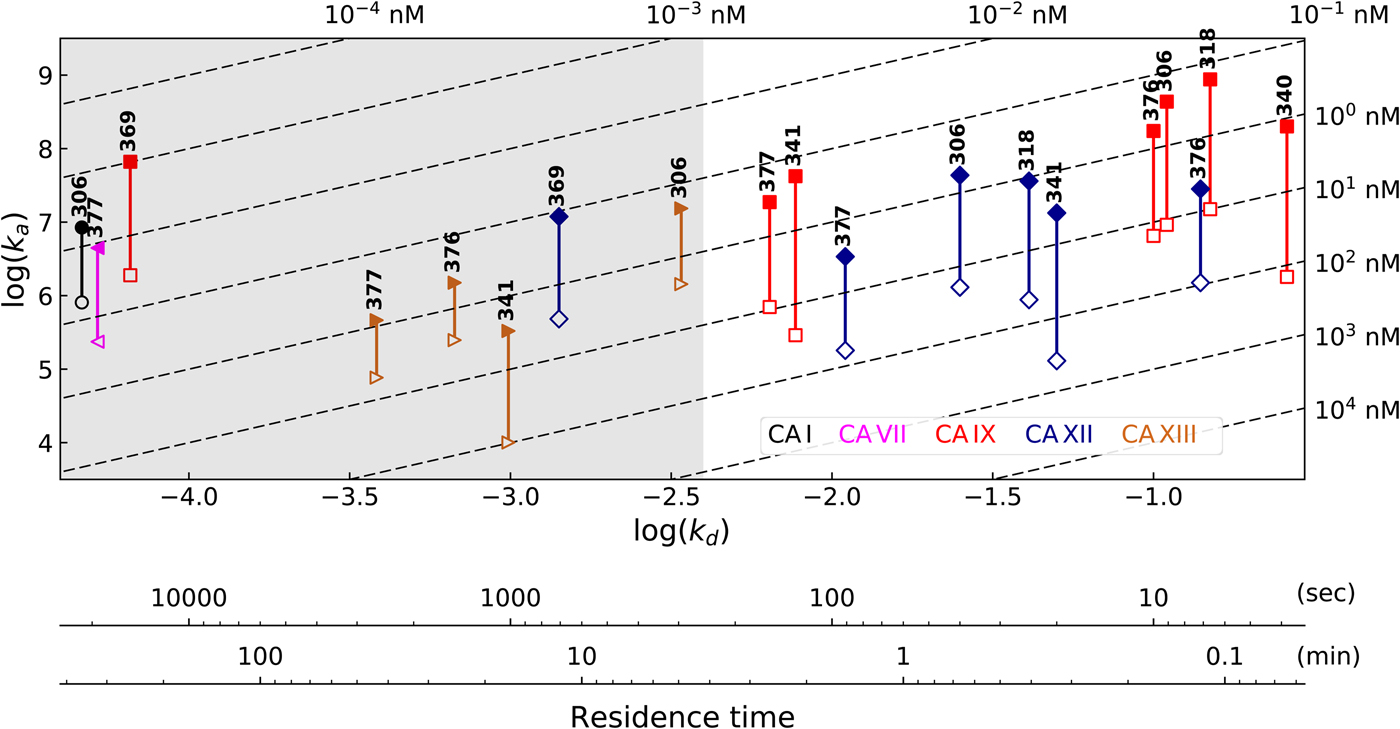
The most interesting, strongest-binding compounds were very slow-dissociating ones. Their residence times were approximately equal to several hours and could not be directly determined by SPR. However, they could be estimated from the association rates and the thermodynamic binding constant, available from the equilibrium measurements by FTSA. The position of such compounds is shown in the shaded gray area on the left side of Fig. 23. The residence times of the lead binding compounds for several CA isoforms appear to be in the order of 3–6 h.
The kinetic measurements have further confirmed the mechanism of sulfonamide inhibitor binding to CAs and further validated the necessity to determine the intrinsic binding data, not only observed.
A database of intrinsic affinities of sulfonamide inhibitor binding to all 12 catalytically active human CAs
In Supplementary Table 1, we have assembled a database of 402 primary sulfonamide compounds binding to the 12 catalytically active human CA isoforms. There is limited data in the literature where the intrinsic parameters of interaction have been considered. Major efforts to assemble and analyze sulfonamide–CA interaction intrinsic data have been made by the G. Whitesides laboratory (Krishnamurthy et al., Reference Krishnamurthy, Kaufman, Urbach, Gitlin, Gudiksen, Weibel and Whitesides2008), however, only for one CA isoform, CA II, and thus did not provide information on compound isoform-selectivity. The synthesis, purification, and characterization of chemical compounds 9–402, except 303, presented in Supplementary Table 1 have been previously described by Dudutiene et al. (Reference Dudutiene, Baranauskiene and Matulis2007); Baranauskienė et al. (Reference Baranauskienė, Hilvo, Matulienė, Golovenko, Manakova, Dudutienė, Michailovienė, Torresan, Jachno, Parkkila, Maresca, Supuran, Gražulis and Matulis2010); Čapkauskaitė et al. (Reference Čapkauskaitė, Baranauskienė, Golovenko, Manakova, Gražulis, Tumkevičius and Matulis2010, Reference Čapkauskaitė, Zubrienė, Baranauskienė, Tamulaitienė, Manakova, Kairys, Gražulis, Tumkevičius and Matulis2012, Reference Čapkauskaitė, Zubrienė, Smirnov, Torresan, Kišonaitė, Kazokaitė, Gylytė, Michailovienė, Jogaitė, Manakova, Gražulis, Tumkevičius and Matulis2013, Reference Čapkauskaitė, Linkuvienė, Smirnov, Milinavičiūtė, Timm, Kasiliauskaitė, Manakova, Gražulis and Matulis2017); Sūdžius et al. (Reference Sūdžius, Baranauskienė, Golovenko, Matulienė, Michailovienė, Torresan, Jachno, Sukackaitė, Manakova, Gražulis, Tumkevičius and Matulis2010); Dudutienė et al. (Reference Dudutienė, Zubrienė, Smirnov, Gylytė, Timm, Manakova, Gražulis and Matulis2013, Reference Dudutienė, Matulienė, Smirnov, Timm, Zubrienė, Baranauskienė, Morkūnaite, Smirnovienė, Michailovienė, Juozapaitienė, Mickevičiūtė, Kazokaitė, Bakšytė, Kasiliauskaitė and Jachno2014, Reference Dudutienė, Zubrienė, Smirnov, Timm, Smirnovienė, Kazokaitė, Michailovienė, Zakšauskas, Manakova, Gražulis and Matulis2015); Kišonaitė et al. (Reference Kišonaitė, Zubrienė, Čapkauskaitė, Smirnov, Smirnovienė, Kairys, Michailovienė, Manakova, Gražulis and Matulis2014); Morkūnaitė et al. (Reference Morkūnaitė, Baranauskienė, Zubrienė, Kairys, Ivanova, Trapencieris and Matulis2014, Reference Morkūnaitė, Gylytė, Zubrienė, Baranauskienė, Kišonaitė, Michailovienė, Juozapaitienė, Todd and Matulis2015); Rutkauskas et al. (Reference Rutkauskas, Zubrienė, Tumosienė, Kantminienė, Kažemėkaitė, Smirnov, Kazokaitė, Morkūnaitė, Čapkauskaitė, Manakova, Gražulis, Beresnevičius and Matulis2014, Reference Rutkauskas, Zubrienė, Tumosienė, Kantminienė, Mickevičius and Matulis2017); Zubrienė et al. (Reference Zubrienė, Čapkauskaitė, Gylytė, Kišonaitė, Tumkevičius and Matulis2014, Reference Zubrienė, Smirnovienė, Smirnov, Morkūnaitė, Michailovienė, Jachno, Juozapaitienė, Norvaišas, Manakova, Gražulis and Matulis2015, Reference Zubrienė, Smirnov, Dudutienė, Timm, Matulienė, Michailovienė, Zakšauskas, Manakova, Gražulis and Matulis2017); Kazokaitė et al. (Reference Kazokaitė, Milinavičiūtė, Smirnovienė, Matulienė and Matulis2015); Pilipuitytė and Matulis (Reference Pilipuitytė and Matulis2015); Juozapaitienė et al. (Reference Juozapaitienė, Bartkutė, Michailovienė, Zakšauskas, Baranauskienė, Satkūnė and Matulis2016); Kasiliauskaitė et al. (Reference Kasiliauskaitė, Časaitė, Juozapaitienė, Zubrienė, Michailovienė, Revuckienė, Baranauskienė, Meškys and Matulis2016); Linkuvienė et al. (Reference Linkuvienė, Matulienė, Juozapaitienė, Michailovienė, Jachno and Matulis2016b); Mickevičiūtė et al. (Reference Mickevičiūtė, Timm, Gedgaudas, Linkuvienė, Chen, Waheed, Michailovienė, Zubrienė, Smirnov, Čapkauskaitė, Baranauskienė, Jachno, Revuckienė, Manakova, Gražulis, Matulienė, Di Cera, Sly and Matulis2017); Vaškevičienė et al. (Reference Vaškevičienė, Paketurytė, Zubrienė, Kantminienė, Mickevičius and Matulis2017). The other compounds were purchased from Sigma-Aldrich Chemical Co. and used without further purification.
Instant JChem was used for structure database management, search and prediction, Instant JChem 6.1.3, 2013, ChemAxon (http://www.chemaxon.com).
A database of intrinsic enthalpies and entropies of sulfonamide inhibitor binding to all 12 catalytically active human CAs
In Supplementary Table 2, we put together available data on the intrinsic enthalpies and entropies of primary sulfonamide binding to human CAs. The table lists the intrinsic Gibbs energies, enthalpies, and entropies of binding together with the experimentally determined (or estimated) pK as of the sulfonamide amino group of the compounds. These listed pK as were used to calculate the intrinsic parameters of binding as explained in the previous sections.
The observed and intrinsic binding affinity data in Supplementary Table 1 and the intrinsic enthalpy–entropy data in Supplementary Table 2 needs detailed analysis and we hope that it will be useful for computational chemists who are designing in silico binding models that would enable prediction of binding thermodynamic parameters.
Some analysis of the compound affinity and selectivity towards each CA isoform has been provided in the references. However, the much deeper analysis may be performed. Here, we concentrate on the most general observations and structure–thermodynamics correlations.
The intrinsic enthalpies and entropies were plotted on a so-called enthalpy–entropy compensation plot (Chodera and Mobley, Reference Chodera and Mobley2013; Ahmad et al., Reference Ahmad, Helms, Lengauer and Kalinina2015; Dragan et al., Reference Dragan, Read and Crane-Robinson2017) and shown in Fig. 24. The plot is drawn as a square with the same enthalpy and entropy scale spreading from compounds that exhibit high exothermic enthalpy to compounds that are fully entropy-driven. Diagonal lines represent isoaffinity areas. Most compounds in this study are bound with an intrinsic affinity (k d,int) between 10 µM and 1 pM. The intrinsic Gibbs energies of binding spread from approximately −40 kJ mol−1 to −70 kJ mol−1. However, the ranges of enthalpies and entropies were significantly larger. The enthalpies spread from −90 kJ mol−1 to 10 kJ mol−1 while entropies – from −50 kJ mol−1 to 20 kJ mol−1.
The enthalpy–entropy compensation plot for all inhibitors listed in Supplementary Table 2. Different colors and symbol shapes represent binding data to various CA isoforms. Most compounds bound to CAs both due to favorable enthalpies and favorable entropy contributions. However, there were few that bound with enthalpy-opposed and entropy-opposed thermodynamics. Note that despite significant differences in compound chemical structures, the values grouped according to CA isoform: CA I binders were mostly on the top-left corner while CA IX – on the right-lower part of the plot.
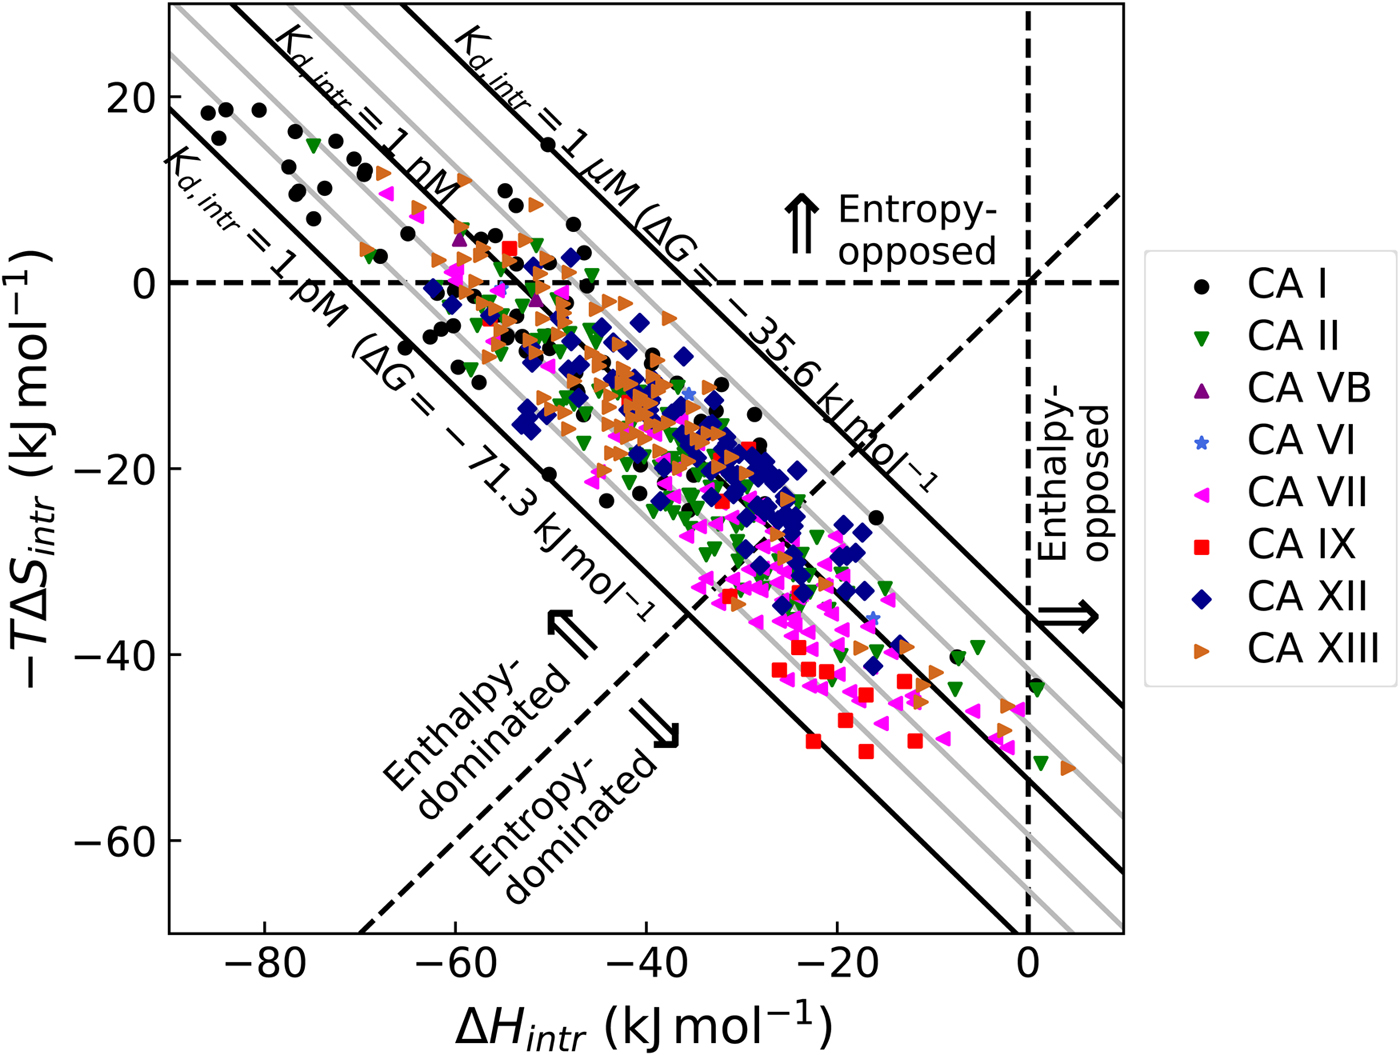
The thermodynamic parameters to various CA isoforms tended to assemble in groups. For example, CA I bound ligands with highly exothermic enthalpy and near-zero entropy, while CA IX bound compounds with only slightly exothermic enthalpy and a significant positive entropy contribution. Thus CA I bound ligands due to primarily enthalpic reasons, while CA IX binding was dominated by the positive entropy contribution. This effect is puzzling and the exact values most likely depend on exact positions of water molecules at the protein–ligand surface prior and post-binding.
We took great care to ensure as high precision of the data as possible. The standard deviation, uncertainty, repeatability, and precision of FTSA measurements have been discussed in Cimmperman and Matulis (Reference Cimmperman and Matulis2011) and ITC (Linkuvienė et al., Reference Linkuvienė, Krainer, Chen and Matulis2016a). Several orthogonal methods have been used where possible to ensure as precise data as possible. However, the standard deviation of all methods for all thermodynamic parameters, including Gibbs energies, enthalpies, and entropies, essentially cannot be reduced below approximately ± 1 kJ mol−1. Therefore, the precision of the data should not be overstated. For example, if the affinities (K d) of two compounds differ by 2-fold it means that the values are within the error margin and it is insufficient data to reliably conclude which compound is a stronger binder. Similar precision could be applied for enthalpies and entropies.
Recombinant preparation and characterization of the human CAs
The quality of prepared CA proteins
All 12 catalytically active human CA isoforms have been prepared in our laboratory. There was always of a concern how pure those preparations are and whether the preparations exhibit a specific activity that is comparable with the proteins described in the literature.
The proteins have been confirmed by such standard techniques and SDS-PAGE and high-resolution mass spectrometry. They were of correct molecular weight on resolving gels and exhibited a mass that was within a single Da from the mass predicted from the amino acid sequence. However, we think that in addition, it is of most importance to demonstrate that the entire protein preparation is catalytically active by titrating it with an inhibitor and thus demonstrate that the entire preparation of the protein is catalytically active and it is not contaminated by non-active fraction of the same protein that may be indistinguishable by other techniques.
Figure 25 shows the activity titration of CA XIV. First, it is necessary to titrate the active fraction of the protein. The known large concentration of CA XIV, 500 nM, was added to the solution and various concentrations of a strongly-binding inhibitor 1 were added. Two straight lines should intersect at exactly 500 nM as was experimentally observed (Fig. 25) if the inhibitor is of sufficient binding affinity.
Determination of the catalytically active fraction of the preparation of CA XIV as previously described by Juozapaitienė et al. (Reference Juozapaitienė, Bartkutė, Michailovienė, Zakšauskas, Baranauskienė, Satkūnė and Matulis2016), performed according to Copeland (Reference Copeland2005). Two straight lines intersected at exactly 500 nM concentration equal to the added concentration of CA XIV thus confirming that the entire preparation of CA XIV was enzymatically active. The inset shows the decrease in absorbance lines at various inhibitor concentrations (steep blue lines – no inhibitor, shallow red lines – largest inhibitor concentration added). The red CO2 curve shows spontaneous hydration of CO2 in the absence of enzyme.
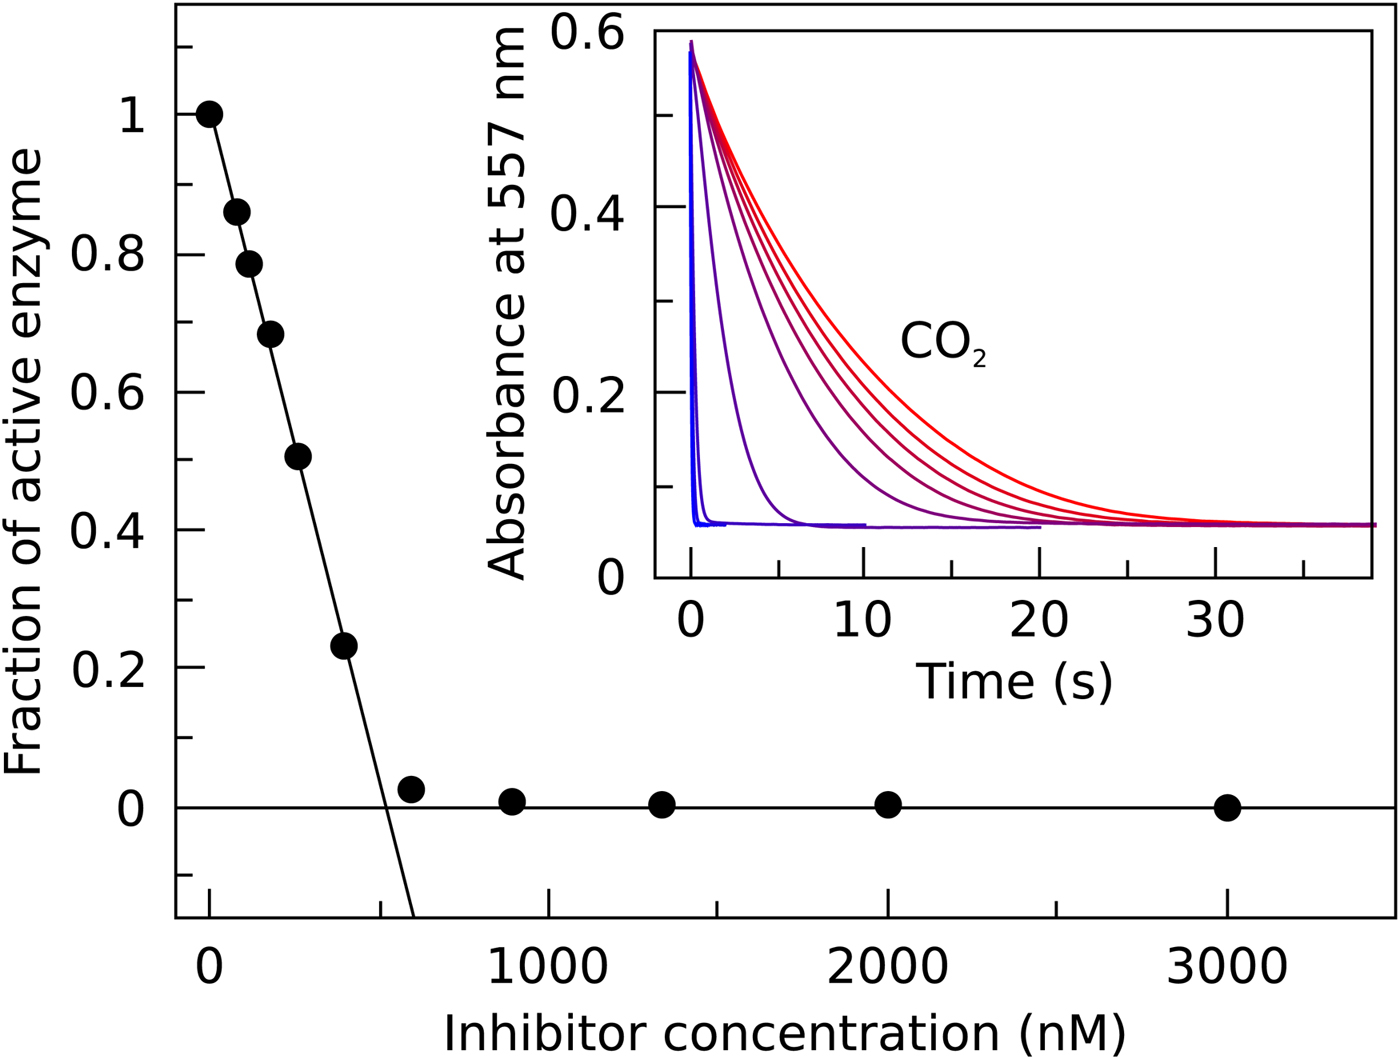
Protein purity can be further confirmed by demonstrating inhibition by several known inhibitors. Then, it is useful to demonstrate using a strong inhibitor that the compound binding stoichiometry by ITC is near 1. Determination of the protein stability in various buffers and various compounds that are known binders is also useful. Finally, X-ray crystallographic structural characterization of the protein is one of the most widely accepted techniques to show that the protein is of high purity. All these techniques are orthogonal and complementary and add to the overall picture that we need in order to understand the structure–thermodynamics of protein–ligand binding.
The recombinant CAs may not be fully representative of their behavior in live human cells. First, here we produced only the catalytic domains of isoforms that contain transmembrane domains (CA IX, CA XII, and CA XIV). The dimerization of these and other isoforms may also be affected thus changing the compound affinities. Furthermore, different isoforms may be posttranslationally modified in human and not represented in bacterial preparations. Therefore, despite the recombinant proteins being the best models representing proteins in the human body, it should be used with some caution.
However, for several monomeric isoforms that were produced in bacteria in full length and where no glycosylation or other posttranslational modifications are known, the bacterial recombinant isoforms are an excellent model to represent their binding of a potential drug in the human body.
The most interesting and compelling case is of CA VI which can be affinity-purified from human volunteer saliva. We have demonstrated that the CA VI preparations from human saliva and the protein recombinantly prepared from mammalian cells, as previously described by Kazokaitė et al. (Reference Kazokaitė, Milinavičiūtė, Smirnovienė, Matulienė and Matulis2015), exhibited essentially the same affinity towards a large series of sulfonamide compounds (Fig. 26).
Correlation between observed inhibitor binding affinities to CA VI produced by three different paths (Kazokaitė et al., Reference Kazokaitė, Milinavičiūtė, Smirnovienė, Matulienė and Matulis2015). Human recombinant CA VI was prepared in bacterial and mammalian cell cultures. The native human CA VI was also affinity-purified from human volunteer saliva. Comparing the affinities of the compounds to the three kinds of CA VI we see that affinities are highly similar and identical within an error margin with the exception of bacterial preparation that bound the compounds with systematically higher affinity by approximately 2–3 fold. This difference could be caused by the different dimerization pattern of various CA VI preparations.

Thermal stability of CA isoforms
Figure 27 shows the thermal stabilities of all 12 catalytically active CA isoforms in various buffers as a function of pH. The stability profiles are quite similar among the isoforms, with stability maximal and minimal pH dependence between pH 6 and 9. Isoform CA VI is somewhat exceptional with the pH stability maximum between pH 5 and 6. The most stable isoform is CA IX, the next is CA IV, while CA VII and CA XII are the least stable isoforms. It should be kept in mind that these are stabilities of catalytic domains and may not fully represent native CAs that contain transmembrane parts.
Characterization of CA isoform stability in various buffers at various pHs. The isoform stability profiles look similar with the greatest stability near pH 7, but there are several notable exceptions, especially CA VI that exhibits stability maximum around slightly acidic pH 5. Note that citrate buffer is destabilizing all CAs because it is complexating ZnII and thus destabilizing the native conformation of CA. Experiments were performed in 100 mM buffer containing 2 mM NaCl and 0.5% DMSO as previously described in: CA I and CA II (Morkūnaitė et al., Reference Morkūnaitė, Gylytė, Zubrienė, Baranauskienė, Kišonaitė, Michailovienė, Juozapaitienė, Todd and Matulis2015), CA IV (Mickevičiūtė et al., Reference Mickevičiūtė, Timm, Gedgaudas, Linkuvienė, Chen, Waheed, Michailovienė, Zubrienė, Smirnov, Čapkauskaitė, Baranauskienė, Jachno, Revuckienė, Manakova, Gražulis, Matulienė, Di Cera, Sly and Matulis2017), CA VB (Kasiliauskaitė et al., Reference Kasiliauskaitė, Časaitė, Juozapaitienė, Zubrienė, Michailovienė, Revuckienė, Baranauskienė, Meškys and Matulis2016), CA VI (Kazokaitė et al., Reference Kazokaitė, Milinavičiūtė, Smirnovienė, Matulienė and Matulis2015), CA VII (Pilipuitytė and Matulis, Reference Pilipuitytė and Matulis2015), CA IX (Linkuvienė et al., Reference Linkuvienė, Matulienė, Juozapaitienė, Michailovienė, Jachno and Matulis2016b), CA XII (Jogaitė et al., Reference Čapkauskaitė, Zubrienė, Smirnov, Torresan, Kišonaitė, Kazokaitė, Gylytė, Michailovienė, Jogaitė, Manakova, Gražulis, Tumkevičius and Matulis2013), CA XIII (Baranauskienė and Matulis, Reference Baranauskienė and Matulis2012), and CA XIV (Juozapaitienė et al., Reference Juozapaitienė, Bartkutė, Michailovienė, Zakšauskas, Baranauskienė, Satkūnė and Matulis2016). All panels are drawn at the same scale to help visualize the differences in stabilities among CA isoforms.

Interestingly, the citrate buffer exhibits a strong destabilizing effect on most CA isoforms, most likely because citrate binds ZnII and thus destabilizes CAs by pulling the metal cation from the active site.
X-Ray crystallographic studies of human CA isoforms
In this section, the X-ray and neutron crystallographic structures of human recombinant unliganded CA isoforms and with bound ligands in the active site are reviewed that were deposited to the PDB up to the Fall of 2017. First, we concentrate on the apo-protein and later review the ligand binding studies.
CA I
The very first crystal structure of CA reported as the human erythrocyte CA form B, was the structure of CA I (Kannan et al., Reference Kannan, Notstrand, Fridborg, Lovgren, Ohlsson and Petef1975). The crystallization report appeared earlier (Kannan et al., Reference Kannan, Fridborg, Bergsten, Liljas, Lovgren, Petef, Strandberg, Waara, Adler, Falkbring, Göthe and Nyman1972a) and the structure was revisited and refined to the resolution of 2 Å (Kannan et al., Reference Kannan, Ramanadham and Jones1984). The bicarbonate in CA I was found as a monodentate ligand in the tetrahedral coordination sphere of Zn ligands (Kumar and Kannan, Reference Kumar and Kannan1994). This position differs from that in the crystal structure of CA II-Co- ${\rm HCO}_3^- $ complex, where cobalt substitutes for the zinc (Haakansson and Wehnert, Reference Haakansson and Wehnert1992). In this structure, the bidentate binding of ${\rm HCO}_3^- $ was found. Further crystal structures of CA I with anionic inhibitors (Kumar et al., Reference Kumar, Kannan and Sathyamurthi1994) revealed differences in the binding of two anions: iodide replaced the Zn-bound water, whereas gold cyanide did not bind to the zinc directly. One of CN− atoms made H-bond with the Zn-bound water. Thus, Au(CN)2− can inhibit CA I because it occupies a substrate binding site, whereas I− directly binds to Zn.
An interesting naturally occurring genetic variant of CA I, Michigan 1(Ferraroni et al., Reference Ferraroni, Tilli, Briganti, Chegwidden, Supuran, Wiebauer, Tashian and Scozzafava2002), where His67 residue is replaced with Arg, could bind an additional zinc ion. An additional Zn-binding site was formed by His64, His200 and Arg67 side chains. Coordination of ZnII by arginine side chain is rare.
CA II
Crystallographic studies of CA II play a very important role in the field of human CAs. First CA II structure was described in 1972 (Kannan et al., Reference Kannan, Liljas, Waara, Bergsten, Lovgren, Strandberg, Bengtsson, Carlbom, Fridborg, Jarup and Petef1972b; Liljas et al., Reference Liljas, Kannan, Bergsten, Waara, Fridborg, Strandberg, Carlbom, Jarup, Lovgren and Petef1972) as the human erythrocyte CA form C. First CA II crystal structures of limited resolution 2 Å were obtained by Liljas et al. (Reference Liljas, Kannan, Bergsten, Waara, Fridborg, Strandberg, Carlbom, Jarup, Lovgren and Petef1972) as early as in 1972 (Liljas et al., Reference Liljas, Kannan, Bergsten, Waara, Fridborg, Strandberg, Carlbom, Jarup, Lovgren and Petef1972), then revisited and refined in 1988 (Eriksson et al., Reference Eriksson, Jones and Liljas1988a). Additional restrained refinement allowed to identify water molecules in the active site, one of them bound to the ZnII. The structure helped to elucidate the reaction mechanism. High-resolution crystal structures of CA II appeared later and helped to understand the water network in the active site (Fisher et al., Reference Fisher, Maupin, Budayova-Spano, Govindasamy, Tu, Agbandje-McKenna, Silverman, Voth and McKenna2007a; Avvaru et al., Reference Avvaru, Kim, Sippel, Gruner, Agbandje-McKenna, Silverman and McKenna2010b). There was also some variability in crystal forms of CA II, first mentioned by Robbins et al. (Reference Robbins, Domsic, Agbandje-McKenna and McKenna2010).
Coordination of Zn
Numerous mutational studies were attempted in order to modify the tetrahedral coordination sphere of ZnII that in α-class CAs is formed by three histidine side chains and a water molecule as a fourth ligand. The crystal structure of Zn-free CA II was first described in 1992 (Haakansson et al., Reference Haakansson, Carlsson, Svensson and Liljas1992), the water network was compared with CA II at different pH with inorganic ligands. Removal of ZnII has an influence on the protein stability and flexibility as shown by Avvaru et al. (Reference Avvaru, Busby, Chalmers, Griffin, Venkatakrishnan, Agbandje-McKenna, Silverman and McKenna2009), but not much effect was observed on substrate binding (Domsic et al., Reference Domsic, Avvaru, Kim, Gruner, Agbandje-McKenna, Silverman and McKenna2008).
The mutation of Zn-binding histidine (His94) to aspartate side chain (Kiefer et al., Reference Kiefer, Ippolito, Fierke and Christianson1993) reduced the affinity to the metal and the catalytic activity of CA II. When the same residue His94 was replaced by cysteine side chain (Alexander et al., Reference Alexander, Kiefer, Fierke and Christianson1993), no zinc was found in the crystal structure of the mutant. On the other hand, replacement of two Zn-coordinating residues His94 and His119 by asparagine and glutamine side chains (Lesburg et al., Reference Lesburg, Huang, Christianson and Fierke1997) resulted in an active enzyme, albeit the crystal structures of these mutants revealed the distorted geometry of ZnII ligands. The effects of Zn-binding histidine replacements by cysteine and aspartate side chains were described by Ippolito and Christianson (Reference Ippolito and Christianson1994), though the crystal structures are of limited resolution (2.2–2.4 Å).
Mutation of Thr199 side chain to cysteine was performed as an attempt to modify the metal-binding site (Ippolito and Christianson, Reference Ippolito and Christianson1993). The measured affinity to ZnII was increased, cysteine side chain displaced Zn-bound water, reducing the catalytic activity of the mutant. The mutation of Thr199 to hydrophobic valine (Krebs et al., Reference Krebs, Ippolito, Christianson and Fierke1993) led to the conclusion that Thr199 is important in the formation of H-bond to the transition state and van der Waals contacts with  ${\rm HCO}_3^- $. Femtomolar affinity to zinc was achieved by Thr199 replacement with aspartate (Ippolito et al., Reference Ippolito, Baird, McGee, Christianson and Fierke1995). Mutational studies of residues Thr199 and Glu106 (Xue et al., Reference Xue, Liljas, Jonsson and Lindskog1993a) revealed the dependence of the catalytic activity on the direction of H-bond between residues 199 and 106.
The effect of Zn replacement by other metals was also studied in detail (Haakansson and Wehnert, Reference Haakansson and Wehnert1992; Haakansson et al., Reference Haakansson, Wehnert and Liljas1994b). A study could be mentioned, where Co-CA II was used for the enhancement of the pH effect on the visible spectra (Avvaru et al., Reference Avvaru, Arenas, Tu, Tanner, McKenna and Silverman2010a). The effect of high ionic strength and especially of citrate anion used in crystallization was discussed and the crystal structures revealed changes in the coordination sphere of Co due to pH variation.
The ‘secondary coordination sphere’ of zinc has an effect on the stability of the Zn-binding by histidines (Lesburg and Christianson, Reference Lesburg and Christianson1995; Huang et al., Reference Huang, Lesburg, Kiefer, Fierke and Christianson1996). Mutations in the ‘secondary coordination sphere’ do not distort significantly the protein conformation, but changing of H-bond network around Zn-binding histidines has an effect on the affinity to metal (Q117E mutant has higher affinity to ZnII) and on the ‘fine tuning’ of the pK a of the Zn-bound water. A comprehensive mutational study (Cox et al., Reference Cox, Hunt, Compher, Fierke and Christianson2000) where mutations of several hydrophobic residues forming the ‘secondary coordination sphere’ influenced the affinity of CA II to metal ions has demonstrated that the protein can accommodate large changes in the hydrophobic core, but the optimized geometry of ZnII ligation is distorted by these mutations.
The importance of the metal coordinating residues was summarized in the review (Martin et al., Reference Martin, Hann and Cohen2013). Mutants H94C and H94D were compared with the WT enzyme while screening small molecule inhibitors. The crystal structures of the mutants soaked with benzenesulfonamide and 1-hydroxy-2-sulfanylpyridinium that represents another metal-binding group are compared.
Proton transfer
After noticing the flexible conformation of the His64 side chain (Krebs et al., Reference Krebs, Fierke, Alexander and Christianson1991; Nair and Christianson, Reference Nair and Christianson1991) at different pH, the proton transfer pathway was proposed and confirmed analyzing numerous mutants of CA II by McKenna and Christianson groups (Nair and Christianson, Reference Nair and Christianson1991; Scolnick and Christianson, Reference Scolnick and Christianson1996; Tu et al., Reference Tu, Qian, An, Wadhwa, Duda, Yoshioka, Pathak, McKenna, Laipis and Silverman2002; Bhatt et al., Reference Bhatt, Tu, Fisher, Prada, McKenna and Silverman2005, Fisher et al., Reference Fisher, Prada, Tu, Duda, Yoshioka, An, Govindasamy, Silverman and McKenna2005; Zheng et al., Reference Zheng, Avvaru, Tu, McKenna and Silverman2008; Domsic et al., Reference Domsic, Williams, Fisher, Tu, Agbandje-McKenna, Silverman and McKenna2010; Mikulski et al., Reference Mikulski, Avvaru, Tu, Case, McKenna and Silverman2011a, Reference Mikulski, Domsic, Ling, Tu, Robbins, Silverman and McKenna2011b, Reference Mikulski, West, Sippel, Avvaru, Aggarwal, Tu, McKenna and Silverman2013).
Proton transfer pathway studies were greatly enhanced by neutron diffraction crystallography that can visualize deuterium. In the case of CA II, very large crystals of a very good quality could be grown, that made it possible to collect neutron diffraction datasets. Crystals were also stable enough to survive soaking in D2O-based solution in order to exchange labile protons for deuterium (Budayova-Spano et al., Reference Budayova-Spano, Fisher, Dauvergne, Agbandje-McKenna, Silverman, Myles and McKenna2006). Results from McKenna group involved in this study shed more light on the protonation state of the catalytically important residues (Fisher et al., Reference Fisher, Kovalevsky, Domsic, Mustyakimov, McKenna, Silverman and Langan2010, Reference Fisher, Kovalevsky, Mustyakimov, Silverman, McKenna and Langan2011, Reference Fisher, Aggarwal, Kovalevsky, Silverman and McKenna2012a; Michalczyk et al., Reference Michalczyk, Unkefer, Bacik, Schrader, Ostermann, Kovalevsky, McKenna and Fisher2015).
Substrate binding
The binding of  ${\rm HCO}_3^- $ was for the first time observed in the T200H mutant of CA II (Xue et al., Reference Xue, Vidgren, Svensson, Liljas, Jonsson and Lindskog1993b). The bicarbonate was bound as a bidentate ligand in the active site of this mutant, that has an increased affinity for ${\rm HCO}_3^- $. Bicarbonate ion was found also in several crystal structures of CA I (Kumar and Kannan, Reference Kumar and Kannan1994) and CA II (Haakansson and Wehnert, Reference Haakansson and Wehnert1992; Xue et al., Reference Xue, Liljas, Jonsson and Lindskog1993a, Reference Xue, Vidgren, Svensson, Liljas, Jonsson and Lindskog1993b; Huang et al., Reference Huang, Sjoblom, Sauer-Eriksson and Jonsson2002), whereas the binding of CO2 at the active site of CA II (WT and Zn-free) was described in the crystals pressured with CO2 (Domsic et al., Reference Domsic, Avvaru, Kim, Gruner, Agbandje-McKenna, Silverman and McKenna2008). The interconversion of CO2 into bicarbonate was also directly observed at 100 K (Sjöblom et al., Reference Sjöblom, Polentarutti and Djinović-Carugo2009).
The comparison of acetate binding by CA II, WT as well as Q106E mutant, helped to understand the H-bond network Glu106-Thr199 (Haakansson et al., Reference Haakansson, Briand, Zaitsev, Xue and Liljas1994a). The role of hydrophobic residues in substrate binding site was elucidated by the mutational analysis of CA II residues Val121 (Nair et al., Reference Nair, Calderone, Christianson and Fierke1991) and Val143 (Alexander et al., Reference Alexander, Nair and Christianson1991). In order to clarify the role of the main chain amino group of Thr199, the crystal structures of the double mutant T199P/C206S with small ligands were analyzed (Huang et al., Reference Huang, Sjoblom, Sauer-Eriksson and Jonsson2002). Substitutions of the Leu198 side chain had an effect on substrate binding and catalytic activity (Nair and Christianson, Reference Nair and Christianson1993; Nair et al., Reference Nair, Krebs, Christianson and Fierke1995). Mutations of residues Asp75 and Gln74 were also investigated (Kannan, Reference Kannan1981).
CA III
The structural studies of CA III isoform were begun, most probably, by the crystallization of the reduced bovine CA III from red muscle (Eriksson and Liljas, Reference Eriksson and Liljas1993). The S-glutathionated form of the rat liver enzyme was also described (Mallis et al., Reference Mallis, Poland, Chatterjee, Fisher, Darmawan, Honzatko and Thomas2000). Two surface cysteines, Cys183 and Cys188, were modified and the significance of this modification in the oxidative stress was discussed.
The mechanism of proton transfer by human CA III was elucidated in mutational and structural studies (Duda et al., Reference Duda, Yoshioka, Govindasamy, An, Tu, Silverman and McKenna2002, Reference Duda, Tu, Fisher, An, Yoshioka, Govindasamy, Laipis, Agbandje-McKenna, Silverman and McKenna2005). The replacement of Phe198 side chain by leucine has increased the catalytic activity of CA III. An interesting feature of the CA III crystal structures is the ordered C-terminal His-tag that is bound in the active site cavity of the crystallographic symmetry-related subunit. In the WT enzyme, there is a stacking between one of the Zn-coordinating histidines and the phenyl group of Phe198. The possible mechanism of proton donor activation is discussed (Duda et al., Reference Duda, Tu, Fisher, An, Yoshioka, Govindasamy, Laipis, Agbandje-McKenna, Silverman and McKenna2005). The role of Lys64 and Arg67 side chains, which are the structural analogs of CA II His64 and Asn67, respectively, in the proton transfer was attempted to clarify (Elder et al., Reference Elder, Fisher, Laipis, Tu, McKenna and Silverman2007).
CA IV
The first crystal structure of the membrane-associated CA IV was reported by Stams et al. (Reference Stams, Nair, Okuyama, Waheed, Sly and Christianson1996). The soluble secreted mutant of CA IV with the C-terminal deletion was crystallized with a limited resolution. The conformation of the N-terminal domain was stabilized by two disulfide bonds: Cys6–Cys11 and Cys23–Cys203. The crystal structures of murine CA IV (also a truncated form) were solved by the same group later and compared with CA II (Stams et al., Reference Stams, Chen, Boriack-Sjodin, Hurt, Liao, May, Dean, Laipis, Silverman and Christianson1998). The protein contains intramolecular disulfide bond typical for trans-membrane and secreted CAs (Cys23–Cys203 in CA I) (Stams et al., Reference Stams, Nair, Okuyama, Waheed, Sly and Christianson1996). The N-terminal insertion of 5 amino acids in the murine CA IV was compared with other CAs (Stams et al., Reference Stams, Nair, Okuyama, Waheed, Sly and Christianson1996, Reference Stams, Chen, Boriack-Sjodin, Hurt, Liao, May, Dean, Laipis, Silverman and Christianson1998).
CA VI
In the only published crystal structure of the catalytic domain of CA VI (Pilka et al., Reference Pilka, Kochan, Oppermann and Yue2012) the intramolecular disulfide bond (Cys42–Cys224) was also found. Such disulfide bonds are typical in membrane-bound CA IV, CA XII, and CA XIV. It is interesting that the octahedrally coordinated MgII was found in the active site instead of ZnII. The NCS dimer was found in the crystal structure and both active sites face each other, differently from CA IX and CA XII. His85 in this structure is a good candidate for the proton shuttle.
CA VII
There are two crystal structures of CA VII found in the PDB database: the unpublished complex with ethoxzolamide 1 (PDB ID: 3MDZ) and the complex with acetazolamide 2 (Fiore et al., Reference Fiore, Truppo, Supuran, Alterio, Dathan, Bootorabi, Parkkila, Monti and De Simone2010a). The mutant with two cysteine residues replaced with serine side chains was used in the crystallization. Intramolecular disulfide bond was found in the crystal (Cys54–Cys178), but authors argued that it is an artifact, because no conserved homologous disulfide was found and such bonds are rare in the cytosolic proteins. 2 makes H-bonds with the protein main chain atoms, water molecules, Gln92 side chain, and van der Waals contacts with the Phe131 side chain.
CA VIII (Carbonic Anhydrase Related Protein, CARP)
The crystal structure of the only structurally characterized CARP, CA VIII, was solved in 2009 (Picaud et al., Reference Picaud, Muniz, Kramm, Pilka, Kochan, Oppermann and Yue2009). The CARP proteins lost their catalytic activity because Zn-coordinating residue His94 (CA II numbering) is replaced by Arg116. The N-terminal Glutamine-rich loop (residues 24–36), a peculiar feature of CA VIII, is partially resolved in the structure. This loop forms contacts with another unique feature of CA VIII, an α3 − β15 loop. Both structural elements contribute to the relatively negatively charged surface of the protein. Two bulky residues restrain a cavity near the active site (Arg116 and Ile224) (homologous to Thr200 of CA II). The residue Glu114 replaces in CA VIII the CA II residue Gln92. Substitutions of the active site residues by more bulky side chains probably preclude the binding of CO2. Chloride anion is modeled in the crystal structure instead of zinc.
CA IX
The structure of Fab fragment of anti-CA IX mAb M75 with the peptide representing epitope, the proteoglycan-like (PG) segment of CA IX was described (Kral et al., Reference Kral, Mader, Collard, Fabry, Horejsi, Rezacova, Kozisek, Zavada, Sedlacek, Rulisek and Brynda2008) and the problems of epitope recognition by the antibody are discussed. The first crystal structure of the catalytic domain of CA IX with bound AZM drug appeared in Alterio et al. (Reference Alterio, Hilvo, Di Fiore, Supuran, Pan, Parkkila, Scaloni, Pastorek, Pastorekova, Pedone, Scozzafava, Monti and De Simone2009). The protein was produced using the Baculovirus expression system. The residue Cys41, responsible for intermolecular disulfide bond, that stabilizes a dimer, was replaced by serine. The dimerization interface differs from that of CA XII. Active sites of monomers are located on the same side of the dimer. AZM makes several H-bonds with side chains Thr199-200 and Gln92.
Crystallization of CA IX even with a published structure in view, was not an easy task, but finally, it was solved (Leitans et al., Reference Leitans, Kazaks, Balode, Ivanova, Zalubovskis, Supuran and Tars2015). The protein was expressed in yeast and the binding of a series of 2-thiophene-sulfonamide compounds to CA IX was characterized structurally. Binding of one ligand by CA IX was compared with CA II (Leitans et al., Reference Leitans, Sprudza, Tanc, Vozny, Zalubovskis, Tars and Supuran2013). The tail part of thiophenes interacts with the side chain of Phe131 in CA II, that corresponds to the Val130 in CA IX. The presence of phenylalanine in CA II is the main reason for the differences in the binding mode.
CA XII
The first crystal structures of CA XII and CA XII-AZM complex were reported in 2001 (Whittington et al., Reference Whittington, Waheed, Ulmasov, Shah, Grubb, Sly and Christianson2001). In the first structure, acetate ion is present as the fifth ligand of zinc. Its position mimics the binding of bicarbonate. AZM is bound in the other structure of CA XII. As in CA II, AZM interacts with a Phe131 side chain, that is absent in CA XII, the position of ligand differs between two isoforms. CA XII was used for the comparison of binding of various compounds with different human CA isoforms in the search of isoform-specific inhibitors (Čapkauskaitė et al., Reference Čapkauskaitė, Zubrienė, Smirnov, Torresan, Kišonaitė, Kazokaitė, Gylytė, Michailovienė, Jogaitė, Manakova, Gražulis, Tumkevičius and Matulis2013; Dudutienė et al., Reference Dudutienė, Zubrienė, Smirnov, Gylytė, Timm, Manakova, Gražulis and Matulis2013, Reference Dudutienė, Matulienė, Smirnov, Timm, Zubrienė, Baranauskienė, Morkūnaite, Smirnovienė, Michailovienė, Juozapaitienė, Mickevičiūtė, Kazokaitė, Bakšytė, Kasiliauskaitė and Jachno2014, Reference Dudutienė, Zubrienė, Smirnov, Timm, Smirnovienė, Kazokaitė, Michailovienė, Zakšauskas, Manakova, Gražulis and Matulis2015; Zubrienė et al., Reference Zubrienė, Smirnovienė, Smirnov, Morkūnaitė, Michailovienė, Jachno, Juozapaitienė, Norvaišas, Manakova, Gražulis and Matulis2015).
CA XIII
The first published structures of CA XIII contained acetate and AZM bound in the active site (Fiore et al., Reference Fiore, Monti, Hilvo, Parkkila, Romano, Scaloni, Pedone, Scozzafava, Supuran and Simone2009). In the structure with acetate, the zinc is penta-coordinated (with acetate and water molecule). The other structure contains 2. No H-bonds with 2 were evident in the structure. Recently several series of benzenesulfonamide-based inhibitors were analyzed bound in CA XIII in the search for isoform-specific ligands (Čapkauskaitė et al., Reference Čapkauskaitė, Zubrienė, Smirnov, Torresan, Kišonaitė, Kazokaitė, Gylytė, Michailovienė, Jogaitė, Manakova, Gražulis, Tumkevičius and Matulis2013; Dudutienė et al., Reference Dudutienė, Zubrienė, Smirnov, Gylytė, Timm, Manakova, Gražulis and Matulis2013, Reference Dudutienė, Zubrienė, Smirnov, Timm, Smirnovienė, Kazokaitė, Michailovienė, Zakšauskas, Manakova, Gražulis and Matulis2015; Kišonaitė et al., Reference Kišonaitė, Zubrienė, Čapkauskaitė, Smirnov, Smirnovienė, Kairys, Michailovienė, Manakova, Gražulis and Matulis2014).
CA XIV
The structural characterization of mammalian CA XIV was started by the crystal structures of the extracellular catalytic domain of murine CA XIV (Whittington et al., Reference Whittington, Grubb, Waheed, Shah, Sly and Christianson2004). The S–S bond characteristic for other membrane-bound CA (Cys23–Cys203) is found in the murine enzyme. The N-glycosylation is detected at the residue Asn195. Murine CA XIV in the crystal structure is monomeric. In the structure of the CA XIV complex with 2, H-bonds are detected between 2 and Thr199-200. The human CA XIV was first characterized by the crystal structure of its extracellular domain in complex with 2 (Alterio et al., Reference Alterio, Pan, Parkkila, Buonanno, Supuran, Monti and De Simone2013). The H-bonds of 2 with water are found besides H-bonds to Thr199–200.
Summary of the X-ray crystallographic structures of unliganded human CA isoforms
The X-ray crystallographic structures of the 10 out of 12 catalytically active human CA isoforms that are available in the PDB are shown in the Supplementary Fig. 1. There are no structures of CA VA and CA VB available in the PDB. Seven of the 10 structures are monomers, while CA VI, CA IX, and CA XII are dimers.
Studies of CA stability and mimicking the active site of another isoform
Improving the stability of CA II
CAs are some of the most efficient enzymes that make them a good choice for industrial applications. One of the proposed applications could be a large-scale fixation of greenhouse gases. Reaction conditions used in modern technology are rather rigorous, so it makes sense to try to improve the performance of CAs by mutations using all the wealth of the structural information available. A lot of crystallographic studies were performed in order to improve the thermostability (Fisher et al., Reference Fisher, Boone, Biswas, Venkatakrishnan, Aggarwal, Tu, Agbandje-McKenna, Silverman and McKenna2012b; Boone et al., Reference Boone, Habibzadegan, Tu, Silverman and McKenna2013b, Reference Boone, Rasi, Tu and McKenna2015) of human CAs, by introducing mutations as proposed by thermostable CA structures (Fiore et al., Reference Fiore, Capasso, Luca, Monti, Carginale, Supuran, Scozzafava, Pedone, Rossi and Simone2013; Diaz-Torres et al., Reference Diaz-Torres, Mahon, Boone, Pinard, Tu, Ng, Agbandje-McKenna, Silverman, Scott and McKenna2015; Simone et al., Reference Simone, Monti, Alterio, Buonanno, Luca, Rossi, Carginale, Supuran, Capasso and Fiore2015).
The role of cis-Pro202 in CA II was accessed by mutation to alanine (Tweedy et al., Reference Tweedy, Nair, Paterno, Fierke and Christianson1993), the catalytic activity of the mutant remained unchanged, but its stability was reduced. Interesting to note, that the cis-peptidyl conformation remained in the crystal structure of the mutant. Mutational analysis of the aromatic residues clustered around Phe226 (Boone et al., Reference Boone, Gill, Tu, Silverman and McKenna2013a) revealed its importance for the stability of the protein, with no effect on the activity.
There were also studies (Monnard et al., Reference Monnard, Nogueira, Heinisch, Schirmer and Ward2013; Heinisch et al., Reference Heinisch, Pellizzoni, Dürrenberger, Tinberg, Köhler, Klehr, Häussinger, Baker and Ward2015) aimed to create an artificial transfer hydrogenase.
Mimicking of the active site of CA IX in CA II
The high similarity of α-class CAs and the difficulties with the crystallization of recombinant CA IX prior to 2015 prompted the construction of CA II point mutants-chimeras that were intended to mimic the CA IX active site. All these studies were used in the search of CA IX-specific inhibitors that have low affinity to CA I and CA II.
The crystallographic study of chimeric CA IX was started by McKenna group with two mutations: S65A, Q67N (Genis et al., Reference Genis, Sippel, Case, Cao, Avvaru, Tartaglia, Govindasamy, Tu, Agbandje-McKenna, Silverman, Rosser and McKenna2009; Sippel et al., Reference Sippel, Stander, Tu, Venkatakrishnan, Robbins, Agbandje-McKenna, Fourie, Joubert and McKenna2011; Tars et al., Reference Tars, Vullo, Kazaks, Leitans, Lends, Grandane, Zalubovskis, Scozzafava and Supuran2013). In the next version of CA IX chimera, 8 mutations was introduced: A9K, S65A, Q67N, T69E, L91I, V131F, E170K, A204L (Pinard et al., Reference Pinard, Boone, Rife, Supuran and McKenna2013). Chimeric CA IX containing 6 mutations (S65A, Q67N, L91I, V130F, L134V, A203L) was also designed by our group and its interaction with the fluorinated benzenesulfonamides was compared with other human CAs (Dudutienė et al., Reference Dudutienė, Matulienė, Smirnov, Timm, Zubrienė, Baranauskienė, Morkūnaite, Smirnovienė, Michailovienė, Juozapaitienė, Mickevičiūtė, Kazokaitė, Bakšytė, Kasiliauskaitė and Jachno2014). Slightly different set of seven mutations (S65A, Q67N, T69E, L91I, V130F, E169K, A203L) was also designed (Moeker et al., Reference Moeker, Mahon, Bornaghi, Vullo, Supuran, McKenna and Poulsen2014a; Mahon et al., Reference Mahon, Hendon, Driscoll, Rankin, Poulsen, Supuran and McKenna2015a; Pinard et al., Reference Pinard, Aggarwal, Mahon, Tu and McKenna2015) and an additional mutation (Q214E) was added to this set (Mahon et al., Reference Mahon, Lomelino, Ladwig, Rankin, Driscoll, Salguero, Pinard, Vullo, Supuran, Poulsen and McKenna2015b).
The crystal structures of CA IX purified by Tars group from yeast (Leitans et al., Reference Leitans, Kazaks, Balode, Ivanova, Zalubovskis, Supuran and Tars2015) which could be easily co-crystallized with ligands of interest seem to make this direction in human CA research less important.
Mimicking of the active site of CA XII in CA II
Our group also reported the crystal structure of CA II mimicking CA XII (chimeric CA XII) with mutations S65A, K67N, T91I, A130F, S134V, N203L (Dudutienė et al., Reference Dudutienė, Matulienė, Smirnov, Timm, Zubrienė, Baranauskienė, Morkūnaite, Smirnovienė, Michailovienė, Juozapaitienė, Mickevičiūtė, Kazokaitė, Bakšytė, Kasiliauskaitė and Jachno2014). The purpose of this construct was to illustrate the suitability and relevance of the chimeric CAs for inhibition studies. The chimeric CA XII both structurally and thermodynamically bound ligands like a real CA XII in a manner that significantly differed from CA II thus proving the approach to be highly suitable for the testing of compound selectivity.
X-Ray crystallographic studies of human CA complexes with inhibitors
The main purpose of crystallographic studies is to design isoform-selective compounds that could be used for the treatment of various human disorders in which CAs are involved.
Sulfonamides
The relatively small compound trifluoromethane sulfonamide (TFS) binds to CAs very effectively due to its low pK a (5.9–6.2) and its complex with CA II was crystallized (Haakansson and Liljas, Reference Haakansson and Liljas1994). The position of the ligand was compared with the crystal structure of CA II-2 complex (Vidgren et al., Reference Vidgren, Liljas and Walker1990). It is interesting that the oxygen atoms of sulfonamide in CF3SO2NH2 were directed opposite to oxygen atoms in 2. CF3 fits into the hydrophobic cleft, whereas the aromatic inhibitor must be oriented outwards. Another small molecule, N-hydroxysulfonamide, is bound in the crystal structure of CA II (Temperini et al., Reference Temperini, Winum, Montero, Scozzafava and Supuran2007c).
Benzene non-primary sulfonamides
Two crystal structures of benzenesulfonamide with OH or methoxy substitution at N of sulfonamide in CA II are presented by Fiore et al. (Reference Fiore, Maresca, Alterio, Supuran and Simone2011).
para-Benzenesulfonamides
Bio-sensors and fluorescent labels
The binding of benzenesulfonamide with various attached fluorophores and other compounds was tested with CA II as a component of various bio-sensors.
In the crystal structure of fluorophore dansylamide (5-dimethylamino-1-naphthalene sulfonamide) when bound to CA II, the unusual orientation of the naphtyl ring towards the hydrophobic pocket of the active site requires conformational shift of Leu198 (Nair et al., Reference Nair, Elbaum and Christianson1996). The use of fluorescent sulfonamide compounds in CA II-based zinc bio-sensors is discussed.
In addition to dansylamide fluorophore (Nair et al., Reference Nair, Elbaum and Christianson1996), fluorescein-derivatized arylsulfonamide was tested as a part of zinc bio-sensor based on benzenesulfonamide–CA II interaction (Elbaum et al., Reference Elbaum, Nair, Patchan, Thompson and Christianson1996). The fluorescein-containing compound and its precursor bound to CA II via benzenesulfonamide, but the fluorescein moiety was not resolved in the crystal. The similar compound was used for the development of hypoxic tumor imaging system, but the linker connecting the benzenesulfonamide and fluorescein moieties was shorter (Alterio et al., Reference Alterio, Vitale, Monti, Pedone, Scozzafava, Cecchi, Simone and Supuran2006). Fluorescein is clearly visible in the structure and exposed out of the active site cavity and interacts with the helix 130–135.
The high affinity of benzenesulfonamides for CA II was used in an unusual way for the structural visualization of the Xe-caging agent cryptophane (Aaron et al., Reference Aaron, Chambers, Jude, Costanzo, Dmochowski and Christianson2008). The cryptophane with caged Xe atom was fairly visible in the CA II crystal pressured with Xe.
CA II binding with benzenesulfonamides was also used in the development of specific protein detection strategy using TFG (two-faced guest) approach. TFG is a bifunctional compound that binds cucurbit[6]uril. When TFG is captured by the enzyme, unreacted cucurbit[6]uril binds Xe in solution for quantification by NMR (Wang et al., Reference Wang, Roose, Philbin, Doman and Dmochowski2016). The binding of three TFG candidate compounds to CA II was compared. All of them were bound in the active site hydrophobically.
Model systems
CA II is also used as a model system for purely biophysical research: a crystallographer has a good chance to see in the crystal structure various small molecules as well as sulfonamides with various substituents.
Benzenesulfonamides with aliphatic and fluorinated hydrocarbon tails were used in the study of the hydrophobic effect (Mecinović et al., Reference Mecinović, Snyder, Mirica, Bai, Mack, Kwant, Moustakas, Héroux and Whitesides2011). It was found that fluorocarbons are indistinguishable from hydrocarbons when bound to CA II, and all the differences in binding affinities are explained by hydrophobic surface changing between ligands. Similar research was performed with tricycled sulfonamides (Snyder et al., Reference Snyder, Mecinović, Moustakas, Thomas, Harder, Mack, Lockett, Héroux, Sherman and Whitesides2011; Lockett et al., Reference Lockett, Lange, Breiten, Heroux, Sherman, Rappoport, Yau, Snyder and Whitesides2013).
Another direction of the research was the use of CA II as a tool for investigation of Hoffmeister series ions (Fox et al., Reference Fox, Kang, Sherman, Héroux, Sastry, Baghbanzadeh, Lockett and Whitesides2015). Four structures presented in this study were analyzed with respect to water network changes upon the binding of anions and interaction of anions with the protein surface. Anions are known to be weak inhibitors of CAs. Br−, I−, SCN−, and  ${\rm Cl}{\rm O}_4^- $ have different hydration abilities. For example, I− and Br− were found associated with hydrophobic parts of the active site cavity and significantly changed the water network.
The effect of fluorination on the interaction with CA II Phe131 was also investigated in detail using crystal structures of CA II with series of N-(4-Sulfamylbenzoyl)-benzylamines (Kim et al., Reference Kim, Chang, Doyon, Baird, Fierke, Jain and Christianson2000, Reference Kim, Chandra, Jain and Christianson2001). N-(4-Sulfamylbenzoyl)-benzylamines were produced systematically introducing fluorine atoms into the second benzene ring that in the WT enzyme forms edge-to-face interaction with Phe131. Crystal structures of WT CA II were compared with structures of the F131V mutant with the same inhibitors. So the CA II-benzenesulfonamide ligand system was used successfully to study weak interactions. Comparing binding of ligands with varied degree of fluorination, the authors observed the different variants of aromatic interactions in mutant CA II.
CA II interaction with benzenesulfonamide was used in order to verify the computational approach for drug design (Combinatorial small molecule growth algorithm) (Grzybowski et al., Reference Grzybowski, Ishchenko, Kim, Topalov, Chapman, Christianson, Whitesides and Shakhnovich2002). Two molecules were predicted to bind to CA II in a different way and structures presented in the study confirmed the predictions.
A tethered azide/alkyl cycloaddition reaction was performed using target-guided synthesis in the active site of CA II mutant H64C (Wischeler et al., Reference Wischeler, Sun, Sandner, Linne, Heine, Koert and Klebe2011). CA II was used as a model system in the click chemistry. Azide component was attached to the Cys64 by a disulfide bond and alkyl was coordinated at zinc via benzenesulfonamide. Crystal structures of reactants and product in CA II are presented. The reaction was stereo-selective and no Cu(I) was added.
Recognition of protein surfaces by synthetic foldamers was studied using CA II (Buratto et al., Reference Buratto, Colombo, Stupfel, Dawson, Dolain, d'Estaintot, Fischer, Granier, Laguerre, Gallois and Huc2014). Foldamers were functionalized by benzenesulfonamide in order to keep at the protein surface. Interestingly, foldamers bound to two protein chains dimerized through the stacking interactions of two helices. Foldamers are additionally fixed at the surface of the protein by coordination of zinc located at the secondary Zn-binding site
The crystal structure of CA II–benzenesulfonamide with a bulky thiophene-containing tail was described as a part of the purely crystallographic analysis of high-resolution structures of CA II (Behnke et al., Reference Behnke, Le Trong, Godden, Merritt, Teller, Bajorath and Stenkamp2010). The crystal structure was compared with 13 high-resolution structures of CA II and refined to the resolution of 0.9 Å. Benzenesulfonamide moiety has a good electron density, whereas the tail is rather flexible, as seen from the poor density and highly anisotropic B-factors. The paper discusses the variable parts of the protein by comparison of 14 high-resolution structures. The inhibitor was chosen just to fill up most of the active site.
Inhibitors of CA II
A series of homologous benzenesulfonamides having ethylene glycol tail with attached amino acids in para-position of the benzene ring was investigated as CA II inhibitors (Boriack et al., Reference Boriack, Christianson, Kingery-Wood and Whitesides1995). Ethylene glycol tails were bound in the active site hydrophobically, amino acids were protruded from the active site cavity and were disordered in the crystals.
A new class of ‘two-prong’ inhibitors of CAs was proposed, which carry the cupric iminodiacetate that can bind solvent-exposed histidines besides benzenesulfonamide moiety that binds to ZnII (Jude et al., Reference Jude, Banerjee, Haldar, Manokaran, Roy, Mallik, Srivastava and Christianson2006). Structures demonstrated the binding of the inhibitors to His64 in CA II and His200 in CA I. All compounds were bound also at the secondary binding site near the N-terminus of the protein.
Inhibitor based on benzenesulfonamide with glycosyl moiety was tested as a promising antiglaucoma agent (Fiore et al., Reference Fiore, Scozzafava, Winum, Montero, Pedone, Supuran and Simone2007). The compound bound to CA II with the glycosyl moiety oriented towards a hydrophilic part of the active site cavity. This study paralleled the research, where sugars were directly derivatized by sulfonamide (Lopez et al., Reference Lopez, Paul, Hofmann, Morizzi, Wu, Charman, Innocenti, Vullo, Supuran and Poulsen2009), and mono-saccharides containing sulfamate as a zinc-binding group (Lopez et al., Reference Lopez, Vu, Wang, Wolf, Groenhof, Innocenti, Supuran and Poulsen2011; Moeker et al., Reference Moeker, Mahon, Bornaghi, Vullo, Supuran, McKenna and Poulsen2014a; Mahon et al., Reference Mahon, Lomelino, Ladwig, Rankin, Driscoll, Salguero, Pinard, Vullo, Supuran, Poulsen and McKenna2015b, Reference Mahon, Lomelino, Salguero, Driscoll, Pinard and McKenna2015c). Crystal structures of 4-substituted-ureidobenzenesulfonamides demonstrated variable hydrophobic interaction in the active site (Pacchiano et al., Reference Pacchiano, Aggarwal, Avvaru, Robbins, Scozzafava, McKenna and Supuran2010).
Ferrocene and ruthenocenes were co-crystallized with CA II as benzenesulfonamide derivatives (Salmon et al., Reference Salmon, Williams, Hofmann and Poulsen2012). The idea was to occupy more fully the hydrophobic part of the active site using bulky hydrophobic organometallics. Complexes fit well, the hydrophilic part is occupied with glycerol or solvent. Yet another exotic CA II inhibitor is the hexamethylcyclohexane at ruthenium in the piano stool-Ru complex (Monnard et al., Reference Monnard, Heinisch, Nogueira, Schirmer and Ward2011). The complex makes π-aromatic interaction with Phe131. Yet another crystal structure of the different piano-stool complex with rhenium was also presented with the view of inhibition of cancer-relevant CAs and its technetium analog could be useful in tumor imaging (Can et al., Reference Can, Spingler, Schmutz, Mendes, Raposinho, Fernandes, Carta, Innocenti, Santos, Supuran and Alberto2012).
4-Sulfamoylphenyl-ω-aminoalkyl ethers with varied linkers were tested as antiglaucoma agents. Structures of one of them and its Boc-protected variant were solved when bound in CA II (Bozdag et al., Reference Bozdag, Pinard, Carta, Masini, Scozzafava, McKenna and Supuran2014b), both ligands bound in the same way, between Phe131 and Pro202. In crystal structures of benzenesulfonamide containing lipophilic 4-alkoxy- and 4-aryloxy moieties, the compounds coincide perfectly in the active site and are bound hydrophobically (Carta et al., Reference Carta, Di Cesare Mannelli, Pinard, Ghelardini, Scozzafava, McKenna and Supuran2015). The pain modulating activity of one of the ligands was demonstrated in vivo. The crystal structure of photochromic azobenzene benzenesulfonamide with various electron-donating or withdrawing groups (Runtsch et al., Reference Runtsch, Barber, Mayer, Groll, Trauner and Broichhagen2015) have demonstrated that azo-group is not perfectly planar and second benzene ring is located between Pro202 and Phe131.
Inhibitors discriminating CA I and CA II
A significant problem of selectivity between the active sites of CA I and CA II was approached with a series of simple benzenesulfonamide containing para-substituents of a variable charge (Srivastava et al., Reference Srivastava, Jude, Banerjee, Haldar, Manokaran, Kooren, Mallik and Christianson2007). Positive charges are less tolerated in CA I, whereas negatively charged compounds bind equally well in both isoforms. Three crystal structures of CA I with compounds of interest were provided.
Anticonvulsant 4-aminobenzenesulfonamides with branched-alkylamide moieties were tested as inhibitors of CA I, CA II, CA VII, and CA XIV, expressed in the brain. Three compounds were co-crystallyzed in CA II and showed a similar binding mode, mostly by hydrophobic interactions (Hen et al., Reference Hen, Bialer, Yagen, Maresca, Aggarwal, Robbins, McKenna, Scozzafava and Supuran2011).
Seven crystal structures of 4-[N-(substituted-4-pyrimidinyl)-amino]-benzene-sulfonamides were presented in a crystallographic and binding thermodynamic study of several human CA isoforms (CA I, CA II, CA VII, and CA XIII) (Sūdžius et al., Reference Sūdžius, Baranauskienė, Golovenko, Matulienė, Michailovienė, Torresan, Jachno, Sukackaitė, Manakova, Gražulis, Tumkevičius and Matulis2010). Electron-withdrawing groups were introduced in order to enhance the interaction of ligands with the hydrophilic part of the active site and the linker length was varied.
The ligand combining two Zn-binding groups was developed as the possible isoform-selective inhibitor (D'Ambrosio et al., Reference D'Ambrosio, Smaine, Carta, De Simone, Winum and Supuran2012). In the presented crystal structure benzenesulfonamide is bound to zinc via sulfonamide, whereas sulfamide moiety made H-bonds with water in the active site. Interestingly, a secondary molecule of the ligand was found at the entrance of the active site in the crystal structure.
A series of N-aryl-β-alanine derivatives and diazobenzenesulfonamides were synthesized and their binding affinities towards several CAs were investigated (Rutkauskas et al., Reference Rutkauskas, Zubrienė, Tumosienė, Kantminienė, Kažemėkaitė, Smirnov, Kazokaitė, Morkūnaitė, Čapkauskaitė, Manakova, Gražulis, Beresnevičius and Matulis2014). In the crystal structures of two compounds, the first benzene ring is positioned in the same way, second rings are bound similarly between Pro202 and Phe131.
Inhibitory activity of 1,1′-biphenylsulfonamides was tested against CA I, CA II, CA IX, CA XII and CA XIV (La Regina et al., Reference La Regina, Coluccia, Famiglini, Pelliccia, Monti, Vullo, Nuti, Alterio, De Simone, Monti, Pan, Parkkila, Supuran, Rossello and Silvestri2015). These larger compounds were aimed towards interaction with residues 127–136 which differ in CA II and CA XIV. Compound with the highest K i for CA XIV was crystallized in CA II and CA XIV. First rings of the compounds were positioned similarly in both isoforms, second rings differed, whereas the third rings were resolved poorly. H-bond is found between Ser132 in CA XIV and the carbonyl group of the linker.
Isoform-selective inhibitors of CA IX
Many binding, inhibition and structural studies of human CAs were devoted to the design of inhibitors of CA IX and CA XII, the targets against certain types of cancer (Pastorekova et al., Reference Pastorekova, Zatovicova and Pastorek2008). Such inhibitors should be isoform-specific in order not to interfere with the ubiquitous CA I and CA II.
One of the candidate compounds was benzenesulfonamide with the positively charged trimethylpyridinium para-substituent. The compound was tested for anti-tumor activity and crystallized in CA II (Menchise et al., Reference Menchise, Simone, Alterio, Fiore, Pedone, Scozzafava and Supuran2005). The charge made the compound membrane-impermeant. The pyridinium moiety made a face-to-face stacking with Phe131 and was bound at the hydrophilic part of the active site.
Another interesting approach for creating CA IX-selective inhibitors is based on the design of hypoxia-activated inhibitors containing mercapto-group. Benzenesulfonamide containing 3,3′-dithiodipropionamide- or 2,2′-dithiodibenzamido- moieties were tested and one of the compounds was crystallized in the reduced (thiolic) form with CA II (De Simone et al., Reference De Simone, Vitale, Di Fiore, Pedone, Scozzafava, Montero, Winum and Supuran2006).
Two selective arylsulfonamide inhibitors of CA VII, CA IX, and CA XIV were crystallized bound to CA II (Gitto et al., Reference Gitto, Damiano, Mader, De Luca, Ferro, Supuran, Vullo, Brynda, Rezacova and Chimirri2012). The second rings of both compounds have alternate positions in the active site. Heteroaryl-benzenesulfonamides were tested as isoform-specific inhibitors with several CA isoforms and their binding to CA II was analyzed in five crystal structures (Buemi et al., Reference Buemi, De Luca, Ferro, Bruno, Ceruso, Supuran, Pospíšilová, Brynda, Řezáčová and Gitto2015). Ligands in all five structures coincided well and were bound hydrophobically.
The adamantyl-containing benzenesulfonamide (Biswas et al., Reference Biswas, Carta, Scozzafava, McKenna and Supuran2013a) was compared as an isoform-selective compound with its thiadiazole-counterpart (Avvaru et al., Reference Avvaru, Wagner, Maresca, Scozzafava, Robbins, Supuran and McKenna2010c). The replacement of the tricyclic ring with benzene improved the inhibition profile. On the other hand, the first ring of ligands in superimposed structures occupies the same position, but the adamantyl groups are positioned on different sides of the Phe131.
Another example of aryl-benzenesulfonamide (Güzel-Akdemir et al., Reference Güzel-Akdemir, Biswas, Lastra, McKenna and Supuran2013) ligand was compared with several other aryl-benzenesulfonamides (De Simone et al., Reference De Simone, Vitale, Di Fiore, Pedone, Scozzafava, Montero, Winum and Supuran2006; Pacchiano et al., Reference Pacchiano, Aggarwal, Avvaru, Robbins, Scozzafava, McKenna and Supuran2010; Carta et al., Reference Carta, Garaj, Maresca, Wagner, Avvaru, Robbins, Scozzafava, McKenna and Supuran2011; Hen et al., Reference Hen, Bialer, Yagen, Maresca, Aggarwal, Robbins, McKenna, Scozzafava and Supuran2011). Inhibitor bound at the hydrophobic part of the active site between the side chains of Phe131 and Pro202.
Coumarinyl-substituted benzenesulfonamides were tested against several human CA isoforms (Wagner et al., Reference Wagner, Avvaru, Robbins, Scozzafava, Supuran and McKenna2010). The crystal structure of one ligand in CA II was described. Coumarinyl group attached to benzenesulfonamide interacted with the active site like any other benzenesulfonamide in contrast to coumarins lacking the sulfonamide group. The stacking interaction was found between coumarine ring and phenyl group of Phe131.
1,3,5-Triazinyl-substituted benzenesulfonamides discussed as potential inhibitors of human CA and β-class bacterial CAs (Carta et al., Reference Carta, Garaj, Maresca, Wagner, Avvaru, Robbins, Scozzafava, McKenna and Supuran2011) were crystallized in CA II. Triazine ring was found stacked with the side chain of Phe131. Two compounds were located in the CA II active site in a very similar way.
The crystal structure of an anticancer drug E7070, which is a para-substituted benzenesulfonamide was reported, but not found in the PDB database (Abbate et al., Reference Abbate, Casini, Owa, Scozzafava and Supuran2004a).
para -meta-Benzenesulfonamides
Inhibitors of CA II
One of the earliest crystallographic studies of inhibitors bound to CA II was the 4-aminobenzenesulfonamide with mercury at the 3rd position of the benzene ring (Eriksson et al., Reference Eriksson, Kylsten, Jones and Liljas1988b).
Two human CA inhibitors that differ only by the fluorine at meta-position of the benzene ring showed different conformations of the second ring in the complex with CA II (Biswas et al., Reference Biswas, Aggarwal, Güzel, Scozzafava, McKenna and Supuran2011). The interaction of inhibitors with CA II was designed by a new strategy of ‘virtual screening’ as an alternative to the high-throughput screening (Grüneberg et al., Reference Grüneberg, Stubbs and Klebe2002). The method was based on the analysis and docking of known structures. Two predicted compounds were analyzed structurally.
Isoform-selective inhibitors
1-N-Alkylated-6-sulfamoyl saccharin derivative that was unintentionally hydrolyzed during X-ray experiment was further developed into the inhibitor showing selectivity between CA isoforms (Ivanova et al., Reference Ivanova, Leitans, Tanc, Kazaks, Zalubovskis, Supuran and Tars2015).
Benzenesulfonamides containing TEMPO (2,2,6,6-tetramethylpiperidine-1-oxyl) moiety in the para- or meta-positions and Cl in the meta-position showed inhibition of human CAs (Ciani et al., Reference Ciani, Cecchi, Temperini, Supuran and Ristori2009). Such compounds could be used for spin-labeling studies. ESR (electron spin resonance) spectra differed between isoforms. The TEMPO moiety was slightly disordered in the crystal structure.
The crystal structure of sulpiride, an anti-psychotic drug, bound to CA II is reported, but not found in the PDB database (Abbate et al., Reference Abbate, Coetzee, Casini, Ciattini, Scozzafava and Supuran2004b).
ortho-Benzenesulfonamides
The binding of halogenated benzenesulfonamide was characterized thermodynamically and crystallographically (Scott et al., Reference Scott, Phillips, Alex, Flocco, Bent, Randall, O'Brien, Damian and Jones2009). Both 2-substituted benzenesulfonamides showed very different binding profiles and positions in the active site of CA II. Whereas the position of benzenesulfonamide ring was the same in both structures, the orientation of the thiophene tails differed.
Fluorinated para-benzenesulfonamides
A detailed binding and crystallographic study of fluorinated para-substituted benzenesulfonamides were supplemented by three crystal structures of the compounds bound to CA II, CA XII, and CA XIII (Dudutienė et al., Reference Dudutienė, Zubrienė, Smirnov, Gylytė, Timm, Manakova, Gražulis and Matulis2013). Fluorination of the benzene ring especially enhanced the binding to CA I. Two possible orientations of benzene ring were revealed in the crystal structures of CA XII and CA XIII with ligands.
The studies of fluorinated para-substituted benzenesulfonamides were continued further (Zubrienė et al., Reference Zubrienė, Smirnovienė, Smirnov, Morkūnaitė, Michailovienė, Jachno, Juozapaitienė, Norvaišas, Manakova, Gražulis and Matulis2015). These compounds showed exceptionally strong binding to CA I because the fluorination increased the fraction of deprotonated ligand. Three crystal structures of CA I and the structures of CA II and CA XII in complex with four ligands were described and compared with related compounds (Dudutienė et al., Reference Dudutienė, Zubrienė, Smirnov, Gylytė, Timm, Manakova, Gražulis and Matulis2013). The study revealed variation in the positions of the first ring of inhibitors in CA II and CA I.
Fluorinated para-meta-benzenesulfonamides
Structural and thermodynamic investigations of fluorinated benzenesulfonamides were continued with crystal structures of three compounds containing substituents in meta- and para-positions bound in CA II, CA XII, and CA XIII (Dudutienė et al., Reference Dudutienė, Zubrienė, Smirnov, Timm, Smirnovienė, Kazokaitė, Michailovienė, Zakšauskas, Manakova, Gražulis and Matulis2015). In CA XIII, fluorinated benzene ring was found only in a single position, whereas in CA II and CA XII the position of the benzene ring could vary.
Chlorinated meta-benzenesulfonamides
Compound 5-nitro-2-Cl-benzenesulfonamide as a precursor of the series of ligands could be reduced, thus aiming towards the hypoxia-inducible CA IX (D'Ambrosio et al., Reference D'Ambrosio, Vitale, Dogné, Masereel, Innocenti, Scozzafava, De Simone and Supuran2008a). The crystal structure supplemented the inhibition studies.
A face-to-face stacking interaction with Phe131 was found in the crystal structure of sulfonamide-based diuretic drug indapamide (Temperini et al., Reference Temperini, Cecchi, Scozzafava and Supuran2008b). The comparison with the crystal structure of other diuretic drug chlorthalidone bound to CA II (Temperini et al., Reference Temperini, Cecchi, Scozzafava and Supuran2009) showed the different binding mode of the drug in its enol form, making H-bonds with waters ordered in the active site and the side chain of Asn67.
The series of indapamide-like N-alkylated benzimidazoles was compared with S-alkylated benzimidazole derivatives thermodynamically and structurally in crystal structures with CA II (Čapkauskaitė et al., Reference Čapkauskaitė, Baranauskienė, Golovenko, Manakova, Gražulis, Tumkevičius and Matulis2010). The position of the Cl-benzene ring in all crystal structures was determined by Cl atom bound to the hydrophobic pocket of the active site, and tails were directed in the same way as indapamide itself making H-bonds with the residue Asn62 by linker atoms. Analysis of the thermodynamic parameters of binding showed that S-alkylated compounds were more effective CA inhibitors, probably due to better H-bond pattern and larger hydrophobic area.
Chlorinated para -meta-benzenesulfonamides
Four crystal structures of para-meta-substituted chlorinated benzenesulfonamides were presented in the comprehensive research trying to connect the intrinsic thermodynamic parameters of ligand binding to several CA isoforms with the structural information (Kišonaitė et al., Reference Kišonaitė, Zubrienė, Čapkauskaitė, Smirnov, Smirnovienė, Kairys, Michailovienė, Manakova, Gražulis and Matulis2014). The influence of chlorine in ortho-position and positions of the four different tails on the thermodynamic parameters of binding was analyzed.
The binding of two series of inhibitors, namely, [(2-pyrimidinyl-thio)-acetyl]benzenesulfonamides, that contained Cl at the position 2 of the benzene ring and tail at the meta-position and Cl-free ligands substituted at para-position of the benzene ring, were compared thermodynamically and structurally (Čapkauskaitė et al., Reference Čapkauskaitė, Zubrienė, Baranauskienė, Tamulaitienė, Manakova, Kairys, Gražulis, Tumkevičius and Matulis2012). Chlorine atom determined the positioning of the first ring and analysis of the binding thermodynamic parameters showed better selectivity of the first group of compounds towards CA I, CA II, CA VII, and CA XIII. Cl-free ligands showed better binding but lower selectivity. These studies were continued further (Čapkauskaitė et al., Reference Čapkauskaitė, Zubrienė, Smirnov, Torresan, Kišonaitė, Kazokaitė, Gylytė, Michailovienė, Jogaitė, Manakova, Gražulis, Tumkevičius and Matulis2013). Two series of ligands described already (Čapkauskaitė et al., Reference Čapkauskaitė, Zubrienė, Baranauskienė, Tamulaitienė, Manakova, Kairys, Gražulis, Tumkevičius and Matulis2012) were complemented with meta-benzenesulfonamide without Cl and para-benzenesulfonamide with Cl. Crystal structures of three compounds with CA II, CA XII, and CA XIII were described in this work. In common, the binding affinities of para-substituted compounds were higher. One of the compounds was the selective nanomolar inhibitor of CA I.
di-Benzenesulfonamides
Crystal structures of three benzene-1,3-disulfonamide derivatives bound in CA II demonstrated that the sulfonamide group in meta-position is directed towards the hydrophilic part of the active site and made H-bonds with residues His64, Asn67, Gln92, and Thr200 (Alterio et al., Reference Alterio, De Simone, Monti, Scozzafava and Supuran2007). The benzene ring was found in the position, that was relatively rare in known structures of benzenesulfonamide inhibitors bound to CA II.
Heterocycles
Thiophenes and thiazines
Three crystal structures of thiophenesulfonamides with substituents of varied length at the 4-amino group were analyzed (Smith et al., Reference Smith, Alexander, Christianson, McKeever, Ponticello, Springer, Randall, Baldwin and Habecker1994). One of these compounds was the dorzolamide drug. The only difference in the binding of these ligands in CA II was the displacement by the dorzolamide of the proton shuttle residue of CA II–His64.
Inhibitors based on the structure of the topical antiglaucoma drug brinzolamide were compared as inhibitors of CA II and CA IV (Kim et al., Reference Kim, Whittington, Chang, Liao, May and Christianson2002). These compounds are nanomolar inhibitors of CA II. Morpholino group and the hydrophobic tail were located at the residue Val135. Positions of the heterocyclic ring depended on the second substituent.
The binding of bicyclic thienothiazene-6-sulfonamide-1,1-dioxide nanomolar inhibitors to CA II was structurally compared with monocyclic 2,5-thiophenedisulfonamides (Boriack-Sjodin et al., Reference Boriack-Sjodin, Zeitlin, Chen, Crenshaw, Gross, Dantanarayana, Delgado, May, Dean and Christianson1998). The second sulfonamide group served for the introduction of substituents that interact mostly with the hydrophobic pocket of CA II active site. These structures helped to understand the mechanism of action of the perspective antiglaucoma drug brinzolamide (Stams et al., Reference Stams, Chen, Boriack-Sjodin, Hurt, Liao, May, Dean, Laipis, Silverman and Christianson1998).
The crystal structure of CA II with another variation of the dorzolamide scaffold was presented (Steele et al., Reference Steele, Benedini, Biondi, Borghi, Carzaniga, Impagnatiello, Miglietta, Chong, Rajapakse, Cecchi, Temperini and Supuran2009), where the nitric oxide donating moiety is combined with the drug with the aim to develop a dual action antiglaucoma drug.
The crystal structure of thiophenesulfonamide with naphtalene substituted triazole ring represents a group of inhibitors, that were synthesized by click-chemistry (Leitans et al., Reference Leitans, Sprudza, Tanc, Vozny, Zalubovskis, Tars and Supuran2013). These compounds were micromolar inhibitors of CA I and nanomolar – of CA II. Bulky substituents at triazole were proposed to mediate the selectivity towards CA II. Their tails were differently located in crystals.
Thiazoles and thiadiazoles
The use of thiadiazole-based ligands in human CA inhibition studies represented a further development of acetazolamide drug that is in a clinical use for decades.
The linker between sulfonamide group and thiadiazole ring can influence the binding mode of the inhibitor in CA II as was demonstrated in several studies (Fisher et al., Reference Fisher, Govindasamy, Boyle, Agbandje-McKenna, Silverman, Blackburn and McKenna2006; Temperini et al., Reference Temperini, Cecchi, Boyle, Scozzafava, Cabeza, Wentworth, Blackburn and Supuran2008a). Two crystal structures of CA II complexed with thiadiazolesulfonamide with halogenated benzene tail were compared (Menchise et al., Reference Menchise, Simone, Fiore, Scozzafava and Supuran2006). One of them was found in the structure lacking any substituent, probably due to the hydrolysis. The crystal structure of thiadiazolesulfonamide with a very long tail of nitrooxybutylbenzoate in CA II (Mincione et al., Reference Mincione, Benedini, Biondi, Cecchi, Temperini, Formicola, Pacileo, Scozzafava, Masini and Supuran2011) illustrated the inhibition studies of a series of nitric oxide-donating CA inhibitors that could be antiglaucoma drugs. This study paralleled a research of imidazolesulfamides containing the nitro group (Rami et al., Reference Rami, Dubois, Parvathaneni, Alterio, van Kuijk, Monti, Lambin, De Simone, Supuran and Winum2013).
Sugars
Mono- and disaccharides derivatized by sulfonamide were studied as putative isoform-selective CA inhibitors and their binding to CA II was compared with the sulfamate Zn-binding group containing drug topiramate (Lopez et al., Reference Lopez, Paul, Hofmann, Morizzi, Wu, Charman, Innocenti, Vullo, Supuran and Poulsen2009). The hydrophilic sugar moiety has low membrane permeability. Therefore, it is thought to provide in vivo selectivity towards transmembrane CA IX and CA XII.
Other heterocycles
A crystal structure of a tricyclic sulfonamide (benzimidazo[1,2-c][1,2,3]thiadiazole-7-sulfonamide) bound to CA II was described (Baranauskienė et al., Reference Baranauskienė, Hilvo, Matulienė, Golovenko, Manakova, Dudutienė, Michailovienė, Torresan, Jachno, Parkkila, Maresca, Supuran, Gražulis and Matulis2010). This relatively rigid compound is fixed by van der Waals interactions within the active site.
A crystallographic analysis of a series of homologous heterocyclic compounds with sulfonamide group bound in CA II was used in the studies of the hydrophobic effect (Snyder et al., Reference Snyder, Mecinović, Moustakas, Thomas, Harder, Mack, Lockett, Héroux, Sherman and Whitesides2011). Crystal structures illustrated regular changes in the binding thermodynamic parameters of homologous ligands. Heterocyclic sulfonamides based on furan, imidazole, thiazole, and thiophene were also extended with the benzene ring in order to increase the hydrophobic surface. The conclusion was that the distortion of structured water was the main driving force of binding. This study was continued with a series of fluorinated heterocyclic compounds (Lockett et al., Reference Lockett, Lange, Breiten, Heroux, Sherman, Rappoport, Yau, Snyder and Whitesides2013), and the crystal structure of CA II with fluorinated benzothiazole was described and compared with the previous study. No influence of fluorination on binding was detected.
Indanesulfonamide-based series of human CA inhibitors was analyzed (D'Ambrosio et al., Reference D'Ambrosio, Masereel, Thiry, Scozzafava, Supuran and De Simone2008b) with two crystal structures of CA II. Indane rings oriented differently in these structures due to the different substituents. In the crystal structure of CA II with indolesulfonamide-based ligand, a nanomolar inhibitor of CA I and CA II (Güzel et al., Reference Güzel, Temperini, Innocenti, Scozzafava, Salman and Supuran2008), the indole ring was accommodated at the hydrophilic side of the active site and made H-bonds with Asn62 and Asn67 side chains as well as with water molecules.
In the crystal structure illustrating an inhibition study of a series of 1-(cyclo)alkylisoquinolinesulfonamides against human CA isoforms (Gitto et al., Reference Gitto, Agnello, Ferro, De Luca, Vullo, Brynda, Mader, Supuran and Chimirri2010), isoquinoline ring was fixed in the active site by van der Waals interactions. In the crystal structure of a related compound that differs from the previous study only by the methyl group (Mader et al., Reference Mader, Brynda, Gitto, Agnello, Pachl, Supuran, Chimirri and Řezáčová2011), the ring was located in a different way. The observation that very small structural differences could result in relatively large variations of inhibitory profiles was further illustrated by a comparison of two compounds: pyridinesulfonamide and benzenesulfonamide (Bozdag et al., Reference Bozdag, Ferraroni, Nuti, Vullo, Rossello, Carta, Scozzafava and Supuran2014a). Compounds have the same tails but were bound very differently in the active site of CA II, and pyridinylsulfonamide had a steric clash with hydroxyl group of Thr200.
Sulfamides
One of the simplest inhibitors structurally characterized was N-hydroxysulfamide (Temperini et al., Reference Temperini, Winum, Montero, Scozzafava and Supuran2007c), that is the more effective inhibitor of CA I and CA II than sulfamide. The compound is bound to zinc like all other sulfonamides by the nitrogen atom, but not by the hydroxyl group.
Sulfamides comprise yet another variant of the Zn-binding group and are widely represented in CA crystallography. The positioning of these ligands has an additional degree of flexibility with respect to benzenesulfonamides (or other heterocyclesulfonamides, because of the additional rotation around the nitrogen atom).
The borolane-containing benzenesulfamide was co-crystallized with CA II due to its possible use in boron neutron capture in the anticancer therapy (Fiore et al., Reference Fiore, Monti, Innocenti, Winum, Simone and Supuran2010b). Carboranes bound through a flexible linker to the sulfamide (Brynda et al., Reference Brynda, Mader, Sicha, Fabry, Poncova, Bakardiev, Gruner, Cigler and Rezacova2013) also can be effectively bound by CAs and therefore, considered to have pharmaceutical perspectives. The length of linkers was chosen in order to fill the active site by the icosahedral carborane in an optimal way. Crystal structures confirmed the predicted binding position of ligands by van der Waals interactions with the protein side chains. This study was continued further (Mader et al., Reference Mader, Pecina, Cígler, Lepšík, Šícha, Hobza, Grüner, Fanfrlík, Brynda and Řezáčová2014). Here, high-resolution structure of carboranesulfamide bound in CA II was described and used for the modeling of the interaction with CA IX.
A series of nitroimidazole derivatives with sulfamide, sulfonamide, and sulfamate groups for anchoring to CA were discussed in numerous studies. Crystal structure with one of nitroimidazolesulfamides confirmed the inhibition studies (Rami et al., Reference Rami, Dubois, Parvathaneni, Alterio, van Kuijk, Monti, Lambin, De Simone, Supuran and Winum2013). These compounds were chosen as possible chemo- or radiosensitizing agents in an anticancer therapy. The electron density was good and H-bonds of the nitro group with Thr200 and His64 were found.
The other research (De Simone et al., Reference De Simone, Pizika, Monti, Di Fiore, Ivanova, Vozny, Trapencieris, Zalubovskis, Supuran and Alterio2014) described inhibitory properties of other series of compounds: phenylmethylsulfamide with substituents optimized to make interactions in the active site. But-2-yn-1-yloxy tail was found to provide strong interactions with CA II active site.
Sulfamates
Sulfamates like sulfamides are derivatives of the sulfamic acid where the substituent is bound via one of three oxygen atoms at sulfur atom. Most of the sulfamate inhibitors studied are perspective anticancer steroid or non-steroid drugs or their homologs.
Many non-steroid drugs initially designed for other targets possess sulfamate Zn-binding group. One of the examples is the anti-convulsant drug RWJ- 37 497, an analog of topiramate crystallized bound to CA II (Recacha et al., Reference Recacha, Costanzo, Maryanoff and Chattopadhyay2002). The interaction of topiramate that belongs to this group of compounds with CA II is also described (Lopez et al., Reference Lopez, Paul, Hofmann, Morizzi, Wu, Charman, Innocenti, Vullo, Supuran and Poulsen2009) as well as its sulfamide analog (Winum et al., Reference Winum, Temperini, Cheikh, Innocenti, Vullo, Ciattini, Montero, Scozzafava and Supuran2006). The crystal structure of 667-coumate, a potent non-steroidal inhibitor of steroid sulfatase (anticancer drug) based on a coumarine ring bound to CA II was reported and the mechanism of the drug stability in vivo due to its sequestration by CA II in blood was proposed. The tricyclic coumarine was proposed to mimic steroid structure. The electron density of the 7-membered ring was not very good due to flexibility (Lloyd et al., Reference Lloyd, Pederick, Natesh, Woo, Purohit, Reed, Acharya and Potter2005a). In the structures of CA II with aromatase-steroid sulfatase inhibitor analogs possessing sulfamate Zn-binding group (Lloyd et al., Reference Lloyd, Thiyagarajan, Ho, Woo, Sutcliffe, Purohit, Reed, Acharya and Potter2005b), the sulfamate-containing rings in both cases nearly coincided, but the para-substituents differ in binding to the protein. Steroid sulfatase inhibitors were sequestered in blood by binding to CA II via sulfamate moiety. This interaction is favorable from the pharmacokinetics point of view and several structures of CA II complexes with similar ligands were reported (Leese et al., Reference Leese, Leblond, Smith, Newman, Di Fiore, De Simone, Supuran, Purohit, Reed and Potter2006; Woo et al., Reference Woo, Fischer, Sharland, Trusselle, Foster, Chander, Fiore, Supuran, Simone, Purohit, Reed and Potter2008, Reference Woo, Jackson, Putey, Cozier, Leonard, Acharya, Chander, Purohit, Reed and Potter2010; Cozier et al., Reference Cozier, Leese, Lloyd, Baker, Thiyagarajan, Acharya and Potter2010).
Microtubule disruptor crystal structure in complex with CA II (Leese et al., Reference Leese, Jourdan, Gaukroger, Mahon, Newman, Foster, Stengel, Regis-Lydi, Ferrandis, Fiore, Simone, Supuran, Purohit, Reed and Potter2008, Reference Leese, Jourdan, Kimberley, Cozier, Thiyagarajan, Stengel, Regis-Lydi, Foster, Newman, Acharya, Ferrandis, Purohit, Reed and Potter2010) was yet another example of the anticancer drug which bioavailability was increased by interaction with CA. Antiproliferative bis-sulfamates and steroid sulfatase inhibitor-CA II structure (Leese et al., Reference Leese, Leblond, Smith, Newman, Di Fiore, De Simone, Supuran, Purohit, Reed and Potter2006) revealed the binding of two molecules in the active site. One molecule was coordinated at zinc by sulfamate in an unusual way, the other filled the rest of the cavity. The binding of estradiol-sulfamate compounds in CA II and its double mutant, mimic of CA IX, were compared (Sippel et al., Reference Sippel, Stander, Tu, Venkatakrishnan, Robbins, Agbandje-McKenna, Fourie, Joubert and McKenna2011). These compounds could have an antiproliferative effect, and the aim of the study was to find a CA IX-specific inhibitor that binds stronger to CA IX, but still could be sequestered by CA II.
Rather an unusual set of aliphatic mono- and bis-sulfamates were studied in the search of isoform-specific inhibitors (Vitale et al., Reference Vitale, Alterio, Innocenti, Winum, Monti, De Simone and Supuran2009). Four compounds were bound in a similar way in CA II. The second sulfamate was exposed out of the cavity and was mobile as could be judged from the increased B-factors.
Monosaccharides with one of the hydrophilic groups derivatized to sulfamate described as inhibitors of human CAs (Lopez et al., Reference Lopez, Vu, Wang, Wolf, Groenhof, Innocenti, Supuran and Poulsen2011) were also subject to CA II esterase activity. The loss of acyl groups was observed as well as an inversion of stereochemistry. Carbohydrates carrying sulfamate as a Zn-binding group containing various linkers were studied with the goal of designing CA IX-specific compounds (Moeker et al., Reference Moeker, Mahon, Bornaghi, Vullo, Supuran, McKenna and Poulsen2014a). Binding of two compounds with CA II and CA IX mimic (Pinard et al., Reference Pinard, Boone, Rife, Supuran and McKenna2015) was studied crystallographically. Carbohydrate moiety as a tail group was chosen due to its lower membrane permeability. The topic hydrocarbonate-based sulfamates as isoform-selective human CA inhibitors were developed further (Mahon et al., Reference Mahon, Lomelino, Ladwig, Rankin, Driscoll, Salguero, Pinard, Vullo, Supuran, Poulsen and McKenna2015b, Reference Mahon, Lomelino, Salguero, Driscoll, Pinard and McKenna2015c). Together with the analysis of the ligand binding in CA II and CA IX mimic, the artifact of acetylation of the surface lysine and its effect on the protein stability was discussed (Mahon et al., Reference Mahon, Lomelino, Salguero, Driscoll, Pinard and McKenna2015c).
Abbate et al. (Reference Abbate, Winum, Potter, Casini, Montero, Scozzafava and Supuran2004c) reported the crystal structure of antiendocrine drug showing both CA and estrone sulfatase inhibition activity: EMATE-sulfamate complex with CA II.
Natural products: alternative metal-binding groups and products of hydrolysis
Small organic Zn-binding groups
Small organic compounds often bind to zinc in a position similar to bicarbonate substrate. One of the examples is acetate. Acetate mimics the binding of substrate (Haakansson et al., Reference Haakansson, Briand, Zaitsev, Xue and Liljas1994a), but the latter different position of acetate in the CA active site was also found (Mazumdar et al., Reference Mazumdar, Kumaran, Swaminathan and Das2008). Azide and bromide have an affinity to zinc and were also co-crystallized with CA II (Jonsson et al., Reference Jonsson, Hakansson and Liljas1993). Sulfide and nitrate in CA II were bound at zinc forming a trigonal bipyramide coordination sphere (Mangani and Hakansson, Reference Mangani and Hakansson1992). In the complex of CA II with SCN− at pH 8.5 (Eriksson et al., Reference Eriksson, Kylsten, Jones and Liljas1988b) sulfur displaced the deep water. Zn-bound water remained in this structure and zinc was pentacoordinated (Eriksson et al., Reference Eriksson, Kylsten, Jones and Liljas1988b). Bisulfite and formate complexes in CA II were crystallized at neutral pH (Haakansson et al., Reference Haakansson, Carlsson, Svensson and Liljas1992). Bisulfite was bound to zinc by an oxygen atom, replacing the Zn-bound water. Formate, lacking a hydroxyl group, bound in a similar position and made H-bond with the main chain nitrogen of Thr199 between the zinc ion and the hydrophobic part of the active site.
Cyanate was reported to bind in a CO2 binding site, where Zn-bound water kept the position as a metal ligand (Lindahl, et al., Reference Lindahl, Svensson and Liljas1993). Different ways of cyanate binding were found in the structures of WT CA II and V207I mutant with cyanate (West et al., Reference West, Pinard, Tu, Silverman and McKenna2014). The anion was bound directly to Zn finishing a tetrahedral coordination sphere.
The positioning of  ${\rm CS}_3^{2-} $ Zn-binding group was investigated by solving the structure of CA II with trithiocarbonate (Temperini et al., Reference Temperini, Scozzafava and Supuran2010). The trithiocarbonate was bound in a monodentate way to zinc and its position was the same as that of bicarbonate but differed by orientation from urea (Briganti et al., Reference Briganti, Mangani, Scozzafava, Vernaglione and Supuran1999), which made two H-bonds with the main chain nitrogen of Thr199 and its hydroxyl group and with two water molecules.
1,2,4-triazole bound in CA II also replaced Zn-bound water, formed H-bonds with Thr199–200 and filled the proposed position of the substrate (Mangani and Liljas, Reference Mangani and Liljas1993). Dithiocarbamates investigated as potential inhibitors of human CAs were bound to zinc in a monodentate way by sulfur atom and made interactions with active site residues (Carta et al., Reference Carta, Aggarwal, Maresca, Scozzafava, McKenna and Supuran2012a, Reference Carta, Aggarwal, Maresca, Scozzafava, McKenna, Masini and Supuran2012b).
Crystal structures of several inhibitors based on hydroxybenzoic acid and phenol bound to CA II were determined (Martin and Cohen, Reference Martin and Cohen2012). Phenol and benzoic acid derivatives made a H-bond with the Zn-bound water. Some of them formed H-bonds with water molecules and active site residues as well.
Polyamines as a Zn-binding group were also studied (Carta et al., Reference Carta, Temperini, Innocenti, Scozzafava, Kaila and Supuran2010). Spermine was not coordinated directly to zinc, the terminal aminogroup formed an H-bond with the Zn-bound water and Thr199. Other aminogroups also formed H-bonds with Thr200-Pro201 and had a clash with the side chain of Gln92.
Hydroxamates
Several compounds previously characterized to inhibit other metalloenzymes but were found to influence the activity of CA as well. Example of such ligand was acetohydroxamic and trifluoroacetohydroxamic acid (Scolnick et al., Reference Scolnick, Clements, Liao, Crenshaw, Hellberg, May, Dean and Christianson1997). The monodentate binding of the compound through its nitrogen atom (deprotonated) is similar to bicarbonate. N-Hydroxyurea differs from the acetohydroxamic acid by CH3 replaced with NH2. N-Hydroxyurea representing yet another Zn-binding group was bound to zinc in a bidentate way by nitrogen and oxygen atoms (Temperini et al., Reference Temperini, Innocenti, Scozzafava and Supuran2006b). Hydroxamates were investigated further with the crystal structure of benzhydroxamic acid bound in the active site of CA II (Di Fiore et al., Reference Di Fiore, Maresca, Supuran and De Simone2012).
Cyanamides were hydrolyzed by CA II (Briganti et al., Reference Briganti, Mangani, Scozzafava, Vernaglione and Supuran1999; Guerri et al., Reference Guerri, Briganti, Scozzafava, Supuran and Mangani2000). After incubation of CA II with cyanamide, urea was found in the crystal structure. Cyanamide is isoelectronic with CO2 and subject to hydrolysis by CA II (Briganti et al., Reference Briganti, Mangani, Scozzafava, Vernaglione and Supuran1999). Ureate was bound to zinc as a monodentate ligand and made H-bond with hydroxyl of Thr199 and several H-bonds with water molecules.
Thioxolone: hydrolysis products
The antipsoriatic drug thioxolone was shown to be hydrolyzed by CA II (Barrese et al., Reference Barrese, Genis, Fisher, Orwenyo, Kumara, Dutta, Phillips, Kiddle, Tu, Silverman, Govindasamy, Agbandje-McKenna, McKenna and Tripp2008). The resulting compound 4-mercaptobenzene-1,3-diol or 2-mercaptophenol remained bound to zinc as a fourth ligand by the thiol group. The intermediate compound S-(2,4-thiophenyl)hydrogen thiocarbonate was located in the structure at the entrance to the active site. An interesting case of oxidation of the thioxolone hydrolysis product by X-ray generated radicals bound to CA II was published (Sippel et al., Reference Sippel, Genis, Govindasamy, Agbandje-McKenna, Kiddle, Tripp and McKenna2010). The resulting compound was bound to zinc via the hydroxyl group.
Other metal-binding groups were explored: 1-hydroxy-2-sulfanylpyridinium was studied crystallographically with the aim to find alternative metal-binding groups that would bind zinc in a bidentate way (Wischeler et al., Reference Wischeler, Innocenti, Vullo, Agrawal, Cohen, Heine, Supuran and Klebe2010). Indeed it was found in the crystal structure of CA II that zinc coordinated sulfur and hydroxyl. The compound is a part of the H-bond network involving several water molecules.
A series of compounds based on the similar Zn-binding group, but having different heterocycle, namely allothiomaltol and thiomaltol, was also studied (Martin et al., Reference Martin, Blachly, Marts, Woodruff, de Oliveira, McCammon, Tierney and Cohen2014a). Compounds differ only by the methyl group position. Both ligands were bound directly to zinc but in a different way. Thiomaltol was bound in monodentate mode by sulfur and two conformations were modeled, whereas allothiomaltol was in the crystal structure as a bidentate ligand. The binding of thiomaltol would be expected to be similar to 2-mercaptophenol (Barrese et al., Reference Barrese, Genis, Fisher, Orwenyo, Kumara, Dutta, Phillips, Kiddle, Tu, Silverman, Govindasamy, Agbandje-McKenna, McKenna and Tripp2008). Allothiomaltol nearly coincided with 1-hydroxy-2-sulfanylpyridinium (Wischeler et al., Reference Wischeler, Innocenti, Vullo, Agrawal, Cohen, Heine, Supuran and Klebe2010). Its methyl group fitted well into the hydrophobic cavity in the active site. It is an interesting study trying to show that interaction with local protein active site environment may influence the metal binding with rather significant effects.
A comprehensive crystallographic study of pharmacophores related to 1-hydroxy-2-sulfanylpyridinium was undertaken by systematically varying the position of the methyl group in relatively small compounds (Martin et al., Reference Martin, Blachly, McCammon and Cohen2014b). Small structural differences between ligands resulted in dramatic changes in the position of ligands due to the interaction with highly ordered water network in the active site. The mono- or bidentate binding was ruled mostly by the local interaction of the substituents with protein and correlated with the inhibitor efficiency.
Coumarins: products of hydrolysis
An interesting example of the inhibition by hydrolysis product was described in an attempt to get crystal structure of coumarin derivative with CA II (Maresca et al., Reference Maresca, Temperini, Vu, Pham, Poulsen, Scozzafava, Quinn and Supuran2009, Reference Maresca, Temperini, Pochet, Masereel, Scozzafava and Supuran2010). The product of hydrolysis, a derivative of cis-2-hydroxycinnamic acid was found in the structure. Surprisingly, no interaction with zinc was found, but the compound blocked the entrance to the active site (Maresca et al., Reference Maresca, Temperini, Vu, Pham, Poulsen, Scozzafava, Quinn and Supuran2009). The structure of CA II with the product of hydrolysis of unsubstituted coumarin was also discussed (Maresca et al., Reference Maresca, Temperini, Pochet, Masereel, Scozzafava and Supuran2010). The compound also did not contact with zinc but formed H-bonds to the side chains of His64, Gln92, and Asn62.
Phenols
The library of phenol-based natural products was analyzed with respect to inhibition of β-class CAs from human pathogens and CA I/CA II (Davis et al., Reference Davis, Hofmann, Osman, Hall, Mühlschlegel, Vullo, Innocenti, Supuran and Poulsen2011). Phenols were chosen because in the published crystal structure of CA II phenol was bound to the Zn-bound water by its hydroxyl group (Nair, et al., Reference Nair, Ludwig and Christianson1994). The similar binding mode was found in the structure of CA II with one of the compounds from the library. The structure of benzenesulfonamide-derivative of this compound in CA II was also solved for comparison.
Saccharines
As saccharines were found to be inhibitors of CAs, it was very natural to try to crystallize CAs with them (Köhler et al., Reference Köhler, Hillebrecht, Schulze Wischeler, Innocenti, Heine, Supuran and Klebe2007). Compounds were bound to zinc with the nitrogen atom and one of sulfanyl oxygen atoms and made the fifth ligand of zinc, with a rather distorted geometry. Two structures were presented with the similar binding of a ligand, and the secondary binding site of saccharine was found in one of the structures. The perspectives of the saccharine analogs as isoform-selective inhibitors were further investigated in Moeker et al. (Reference Moeker, Peat, Bornaghi, Vullo, Supuran and Poulsen2014b). A relatively long tail was added to the benzene moiety through triazole. A crystal structure of this saccharine derivative was presented when bound to CA II. The tail was completely unresolved in the electron density probably due to multiple conformations.
Saccharine modified by sulfonamide moiety was found in CA II bound to zinc by sulfonamide, as all other sulfonamide compounds (Alterio et al., Reference Alterio, Tanc, Ivanova, Zalubovskis, Vozny, Monti, Fiore, Simone and Supuran2015). A crystal structure of saccharine modified with carboxymethyl as Zn-binding group in CA II was also published (Langella et al., Reference Langella, D'Ambrosio, D'Ascenzio, Carradori, Monti, Supuran and Simone2015), thus representing a new Zn-binding group. Carboxylate was bound to zinc as a monodentate ligand.
Cholines
Cholic acid is a naturally occurring inhibitor of human CAs in the gastroenteric tract, therefore it was interesting to determine its crystal structure in complex with CA II (Boone et al., Reference Boone, Chingkuang Tu and McKenna2014). Bidentate binding of cholate carboxyl to zinc displaced the Zn-bound water and shifted the deep water. Hydroxyl groups made a lot of water-mediated H-bonds with the protein side chains in the active site, but no direct H-bonds were found. The changes on the ordered water network were discussed.
Sulfonamides as drugs
CA I
Protein interaction of CA I with clinically used drugs was studied rather intensively. There were not many structures of CA I with inhibitors as a part of drug design studies, probably due to the relatively low catalytic activity of CA I compared with ubiquitous CA II, which was a subject of intensive inhibitor search.
Three crystal structures of CA I with commercial drugs were reported (Chakravarty and Kannan, Reference Chakravarty and Kannan1994). The 2, 3 and benzenesulfonamide-Hg compounds were bound to zinc, but sulfonamide group was differently oriented. 3 disrupts the H-bond network. Antiviral drug foscarnet was crystallized bound to CA I (Temperini et al., Reference Temperini, Innocenti, Guerri, Scozzafava, Rusconi and Supuran2007a). The drug is interesting because of an unusual Zn-binding phosphonate group. Foscarnet had some activator activity on CA I, whereas it is a weak inhibitor of several other isoforms as revealed by kinetics measurements (Rusconi et al., Reference Rusconi, Innocenti, Vullo, Mastrolorenzo, Scozzafava and Supuran2004). The drug bound to zinc in the inhibitor-like manner that contradicted the kinetics data. The crystal structure of CA I with topiramate (Alterio et al., Reference Alterio, Monti, Truppo, Pedone, Supuran and Simone2010) showed the rearrangement of the active site compared with CA II, that means conformations of side chains of Trp5, His67, and His200 differed between the native CA I and the complex.
CA II
Nonsteroidal anti-inflammatory drugs, inhibitors of the inducible cyclooxygenase COX-2 were described as inhibitors of several human CAs (Weber et al., Reference Weber, Casini, Heine, Kuhn, Supuran, Scozzafava and Klebe2004). A crystal structure of CA II with celecoxib drug was presented. The affinity for CA II could be expected, as the drug bears the sulfonamide group. Trifluoromethyl moiety was bound to the hydrophobic wall of the active site, methylbenzene made contacts with Asn62, Glu69, and Gln92. The related drug valdecoxib was also crystallized bound to CA II (Fiore et al., Reference Fiore, Pedone, D'Ambrosio, Scozzafava, Simone and Supuran2006). It bounds in a different way, making stacking interaction with Phe131.
The high-resolution crystal structure of 2 in CA II was presented (Sippel et al., Reference Sippel, Robbins, Domsic, Genis, Agbandje-McKenna and McKenna2009). Three 2 molecules were found in the structure. Acetazolamide is used usually as a reference compound in various inhibitor studies or in order to check the effects of mutations. In crystal structures of L198 CA II mutants in the unliganded form and with 2 were compared in order to elucidate the role of this side chain in substrate binding (Nair and Christianson, Reference Nair and Christianson1993; Nair et al., Reference Nair, Krebs, Christianson and Fierke1995). One of the mutations, L198F, was a variant that was present in CA III, and significant conformational changes of Phe side chain occurred upon binding of inhibitor. A binding of a modified version of 2, which is more selective towards CA II was presented (Biswas et al., Reference Biswas, McKenna and Supuran2013b). Further modifications of 2 scaffold producing dual-tail inhibitors were described (Tanpure et al., Reference Tanpure, Ren, Peat, Bornaghi, Vullo, Supuran and Poulsen2015), where the hydrophilic glucosyl-tail and hydrophobic phenyl-tail were found in the corresponding parts of the active site. Crystal structure of 1, a compound preceding the dorzolamide and brinzolamide drugs bound to CA II was also described (Di Fiore et al., Reference Di Fiore, Pedone, Antel, Waldeck, Witte, Wurl, Scozzafava, Supuran and De Simone2008).
Interaction of an antiepileptic drug topiramate (4) and its sulfamate and sulfamide analogs was intensively studied (Recacha et al., Reference Recacha, Costanzo, Maryanoff and Chattopadhyay2002; Winum et al., Reference Winum, Temperini, Cheikh, Innocenti, Vullo, Ciattini, Montero, Scozzafava and Supuran2006; Lopez et al., Reference Lopez, Paul, Hofmann, Morizzi, Wu, Charman, Innocenti, Vullo, Supuran and Poulsen2009). Another antiepileptic drug lacozamide has no traditional Zn-binding groups and nevertheless, it was an inhibitor of human CAs. The complex of the drug with CA II was crystallized and showed that the binding mode is similar to the products of hydrolysis of coumarin (Temperini et al., Reference Temperini, Scozzafava and Supuran2010). It makes no contacts with zinc. There was another example of the antimetastatic drug not contacting zinc in CA II, the Ru (III) complex compound NAMI-A [tetrachloro(DMSO)(imidazole)-ruthenate(III)] (Casini et al., Reference Casini, Temperini, Gabbiani, Supuran and Messori2010). The complex compound was disrupted in the protein, imidazole was found at ZnII and RuIII was located far away in the entrance as well as DMSO.
Antihelmint drug thiabendazole was modified with sulfonamide and its activity was checked against human CAs and Caenorhabditis elegans α-CAH-4b (Crocetti et al., Reference Crocetti, Maresca, Temperini, Hall, Scozzafava, Muhlschlegel and Supuran2009). The crystal structure of CA II with this compound was presented and discussed in view of human parasite CA inhibition and probably with clinical perspectives for some human CA isoforms.
CA IV
The structure of murine CA IV (Stams et al., Reference Stams, Chen, Boriack-Sjodin, Hurt, Liao, May, Dean, Laipis, Silverman and Christianson1998) and also truncated version was compared with human CA IV (Stams et al., Reference Stams, Nair, Okuyama, Waheed, Sly and Christianson1996). Murine CA IV was crystallized in complex with brinzolamide and compared with CA II (Stams et al., Reference Stams, Chen, Boriack-Sjodin, Hurt, Liao, May, Dean, Laipis, Silverman and Christianson1998). The affinity of binding differed significantly between two proteins, structural differences were discussed: the position of the drug was very similar, but in murine CA IV there were fewer contacts with the inhibitor than in CA II. There was interaction with Phe131, H-bond with water in CA IV, and tail of the ligand was disordered in the murine enzyme. An attempt to optimize the dorzolamide with respect to the binding to CA IV and solubility was reported (Vernier et al., Reference Vernier, Chong, Rewolinski, Greasley, Pauly, Shaw, Dinh, Ferre, Nukui, Ornelas and Reyner2010). Resulting compounds were para-meta-substituted pyrimidinesulfonamides.
Activators
Activator molecules bind mostly at the entrance of the active site and participate in the proton transfer pathway. Activator compounds include amino acids, peptides, and amines that may be easily protonated.
CA I
The first reported case of an activator molecule in the active site of CA I was the crystal structure of the complex with histidine (Temperini et al., Reference Temperini, Scozzafava and Supuran2006a). The activation effect of histidine was explained by the binding to the imidazole ring of His 200 and involvement to the water network. The binding differed from that in CA II-His structure (Temperini et al., Reference Temperini, Scozzafava, Puccetti and Supuran2005).
The antiviral drug foscarnet, a weak inhibitor of human CAs, acted as an activator of CA I (Temperini et al., Reference Temperini, Innocenti, Guerri, Scozzafava, Rusconi and Supuran2007a). The compound was coordinated to zinc by phosphonate moiety. The phosphonate made a weak H-bond with imidazole ring of His200 in CA I active site. The presence of His200 (corresponds to Thr200 in CA II) made the CA I active site more narrow compared with other CAs and unusual orientation of foscarnet in CA I could be the reason for its role as an activator.
CA II
The first crystallographically characterized activator of CA II was histamine (Briganti et al., Reference Briganti, Mangani, Orioli, Scozzafava, Vernaglione and Supuran1997). The activator bound at the entrance of the active site cavity and the imidazole moiety was connected through water network to the proton shuttle residue His64. The molecule 1-[2-(1H-imidazol-4-yl)-ethyl]-2,4,6-trimethylpyridinium resulted from an optimization of histamine (Dave et al., Reference Dave, Ilies, Scozzafava, Temperini, Vullo and Supuran2011). Unexpectedly, in the crystal structure with CA II, the compound was found with the pyridinyl moiety directed to zinc and making contacts with Phe131 and Pro202.
Imidazole ring of L-histidine was involved in H-bonds with His64 (and other amino acids), and water molecules connected the activator to the Zn-bound water (Temperini et al., Reference Temperini, Scozzafava, Puccetti and Supuran2005). The binding of the stereoisomer D-histidine also made a H-bond with His64, but otherwise, contacts were different. D-histidine in the crystal structure was also connected through water molecules with the Zn-bound water (Temperini et al., Reference Temperini, Scozzafava, Vullo and Supuran2006d).
The D- and L-tryptophans were investigated as activators of various human CA isoforms (Temperini et al., Reference Temperini, Innocenti, Scozzafava and Supuran2008c). In the crystal structure of D-tryptophan in CA II, the activator was bound in an unusual way as compared with other structurally characterized activators. The amino acid was bound at the edge of the active site and contacted to a symmetry-related protein molecule. The binding of tryptophans was compared with the crystal structure of CA II with L-adrenaline (Temperini et al., Reference Temperini, Innocenti, Scozzafava, Mastrolorenzo and Supuran2007b).
L- and D-phenylalanine, another pair of stereoisomers whose binding to CA II could be compared structurally. The position of both ligands differed. Both made H-bond to the His64 residue by carboxylate (D-phenylalanine) and by an amino group (L-phenylalanine) (Temperini et al., Reference Temperini, Scozzafava, Vullo and Supuran2006c).
Addition of the exogenous donor/acceptor of protons could rescue the proton transfer in H64A mutant of CA II (Duda et al., Reference Duda, Tu, Qian, Laipis, Agbandje-McKenna, Silverman and McKenna2001, Reference Duda, Govindasamy, Agbandje-McKenna, Tu, Silverman and McKenna2003). In this case, 4-methylimidazole was used as an activator. The water network that could help understand the mechanism of rescue was visualized in the crystal structures. The same small molecule. 4-Methylimidazole was used for the rescue of another CA II double mutant H64W, W5A (Bhatt et al., Reference Bhatt, Fisher, Tu, McKenna and Silverman2007). 4-Methylimidazole made a π-interaction with Trp64. A regular crystallographic study of catalytic activity rescue of CA II mutant H64A described the binding of four imidazole derivatives (Aggarwal et al., Reference Aggarwal, Kondeti, Tu, Maupin, Silverman and McKenna2014). Imidazoles were found in multiple binding sites.
In search for correlations between the X-ray crystallographic structures of inhibitor-CA complexes and the intrinsic thermodynamic parameters of their interaction
Crystallographic studies of CA inhibitors that was reviewed in the preceding sections provided the structural modes of various compounds binding in the active site of CA. However, crystallographic investigations can provide only the structural information and do not provide the energetic picture of binders. Weakly binding and weakly inhibiting millimolar compounds that do not have potential to be developed as drugs would be indistinguishable in the crystallographic structures from nanomolar or picomolar compounds that have potential to be developed as drugs. In the process of crystal growth in the presence of a binding compound or crystal soaking with an inhibitor, the concentration of the compound used in the experiment usually is in the millimolar range. The electron density of the bound compounds can be clearly visible both for weak and tight binders.
Therefore, as discussed above, it is important to use biochemical and biophysical methods together and accurately determine the affinities of compounds. The primary sulfonamides stand-out among various inhibitors as ones that bind to CAs specifically and significantly stronger than other reviewed compounds. Therefore, in the search for the 3D (crystallographic complex) structure – energetics correlations, the primary sulfonamides is the focus, similarly to 2D (chemical structure) – energetics correlations described in previous sections. In this section, all CA crystal structures available in the PDB that have sulfonamide compounds bound and the intrinsic binding information is available, are reviewed by listing the structures next to the intrinsic thermodynamic parameters of binding. Such correlations may describe the physical reasons behind the affinities and could lead to rational design of compounds with desired binding properties to any protein target, not limited to CA. The goal is to search for correlations that would be of general importance for any compound interaction with its target protein.
Figures 1–9 in supplementary figures file show the Pymol renderings of compounds bound to human CAs. The CA crystal structures from the PDB are shown next to the compound chemical structure together with the intrinsic binding data. Each figure arranges the structures of inhibitors bound to one CA isoform. The crystal structures are shown in the same orientation to visualize the entrance of the compound. Hydrophobic residue surface area is colored yellow, while the charged and polar amino acid surface is blue.
The crystal structure–thermodynamic parameter correlations show that the compounds span many orders of magnitude in affinity, from mM to pM, and small structural changes may lead to large changes in the binding energetics that are not fully understood. It seems that not only the positions of each atom at the protein–ligand interface are important, but probably also the water molecules that are being displaced by the bound ligand from the protein and ligand surface. All these contributions are not clear and therefore it is not yet possible to predict the affinities, enthalpies, and entropies from the structural arrangement of the ligand and vice versa – the structural arrangement from the thermodynamic parameters.
Quite a few observations and conclusions may be made based on a comparison of compounds with similar chemical structure. When a large collection of crystal structures confirms that all studied primary sulfonamide compounds bind to CAs via a coordination bond between the amino nitrogen and ZnII, we can draw the structure–thermodynamics maps showing the functional group contributions to the binding energies and extend the maps to compounds whose crystal structures are not available. The sulfonamide groups will always be oriented towards the ZnII in the active site and the remaining tail part of the compound would extend towards the entrance of the protein or bind to the surface areas nearby which may differ in each isoform, being hydrophobic or hydrophilic.
The development of compounds of VD series containing fluorine atoms in the benzenesulfonamide ring that led to the discovery of CA IX inhibitors of pM affinity and significant selectivity over other CA isoforms is shown in Fig. 28. This compound comparison map shows the intrinsic Gibbs energies of binding to each CA isoform and the differences in the energies between two adjacent compounds. The adjacent compounds in the map have small structural differences that lead to energetic changes of binding. It could be helpful to remember that the gain of −6 kJ mol−1 of Gibbs energy is equivalent to a 10-fold gain in K d. Starting with benzenesulfonamide on the left upper corner of the map, it is clear that this compound exhibits strong affinity towards CA IX and is slightly selective over other isoforms. Addition of four fluorines did not improve the intrinsic binding (though improved the observed affinities). Further addition of para tail practically did not have an effect on affinity towards CA IX. The main gain in both the affinity and selectivity was achieved by an addition of para or meta bulky substituents that were designed to bind in the hydrophobic pocket on CA IX, based on the chimeric CA IX structure (Dudutienė et al., Reference Dudutienė, Matulienė, Smirnov, Timm, Zubrienė, Baranauskienė, Morkūnaite, Smirnovienė, Michailovienė, Juozapaitienė, Mickevičiūtė, Kazokaitė, Bakšytė, Kasiliauskaitė and Jachno2014). Furthermore, the addition of these substituents significantly diminished the binding of these compounds to CA I, thus reducing an undesired side effect in a possible anticancer therapy targeting CA IX.
Binding Gibbs energy contributions of compound functional groups in the search of fluorinated compounds that would selectively bind and inhibit CA IX. The map shows a series of compounds connected by arrows beginning with benzenesulfonamide as the weakest inhibitor and ending with the best inhibitors on the right. Numbers next to the structures show the intrinsic Gibbs energies of compound binding to each recombinant human CA isoform. Numbers at the arrows show the differences between the affinities to two connected isoforms. Larger differences are depicted in larger font size to emphasize the largest energy gains upon chemical modifications of the compounds.
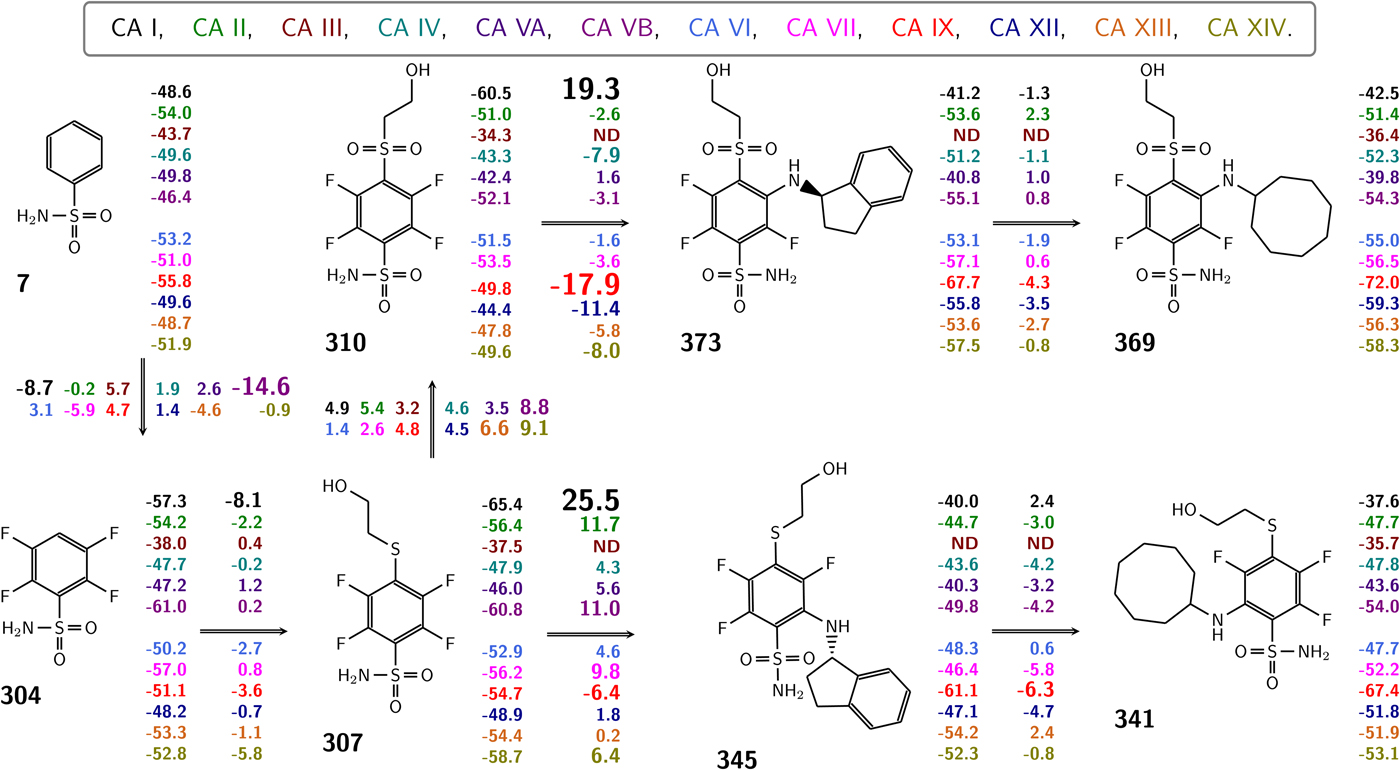
Development of another series, the chlorinated EA compounds towards CA XII is shown in Supplementary Fig. 11. At the end of this series is a compound that exhibits subnanomolar affinity and significant selectivity towards CA XII, another anticancer target. The logic of the development is the same – the search of functional groups that would selectively bind to the desired isoform but would not bind as strongly to non-desired isoforms.
The enthalpies of binding are still poorly understood, but they should provide information on the contacts between the ligand and protein. The larger negative exothermic enthalpy would indicate that the compound makes better contacts with the protein and the binding is more specific. Enthalpic development of high-affinity CA IX inhibitors of VD series is shown in Supplementary Fig. 12. The enthalpies of binding of the best compounds actually were not the most exothermic. However, the dissection of enthalpic and entropic contributions helped to provide the directions of compound design.
Correlations between the buried surface areas and the changes in enthalpies and entropies of binding of several compounds are shown in Fig. 29. The compounds were arranged in structurally similar pairs where there is an increase in the hydrophobic surface area when comparing them. In the case of similar binders, there was a tendency to observe a less exothermic enthalpy change and increased the entropy of binding. However, in the case of dissimilar binders, there was an opposite tendency observed. Significantly more data would be needed to ensure that such observations are of general use for the rational design of ligands that would bind the desired protein.
Comparison of the binding thermodynamic parameters in structurally-related compound pairs arranged according to the buried and accessible surface areas (BSA + ASA) which were calculated from the crystal structures as described by Smirnov et al. (Reference Smirnov, Zubrienė, Manakova, Gražulis and Matulis2018). Panels (a) and (b) show the Gibbs energies of binding, (c) and (d) the intrinsic enthalpies of binding, and (e) and (f) – the entropies multiplied by the absolute temperature. Panels on the left show the pairs that are called similar, meaning that the sulfonamide benzene ring is positioned identically in both crystal structures, while the panels on the right show dissimilar binders, where the position of the benzene ring is different in the pair. In the similar binders, there is a significant loss of exothermic enthalpy observed upon addition of a hydrophobic group on a compound. However, in dissimilar binders, the opposite tendency is observed – the enthalpy is gained upon the addition of a hydrophobic surface. The bottom two panels G and H show the crystallographic positions of the similar (G) and dissimilar (H) pairs of binders.
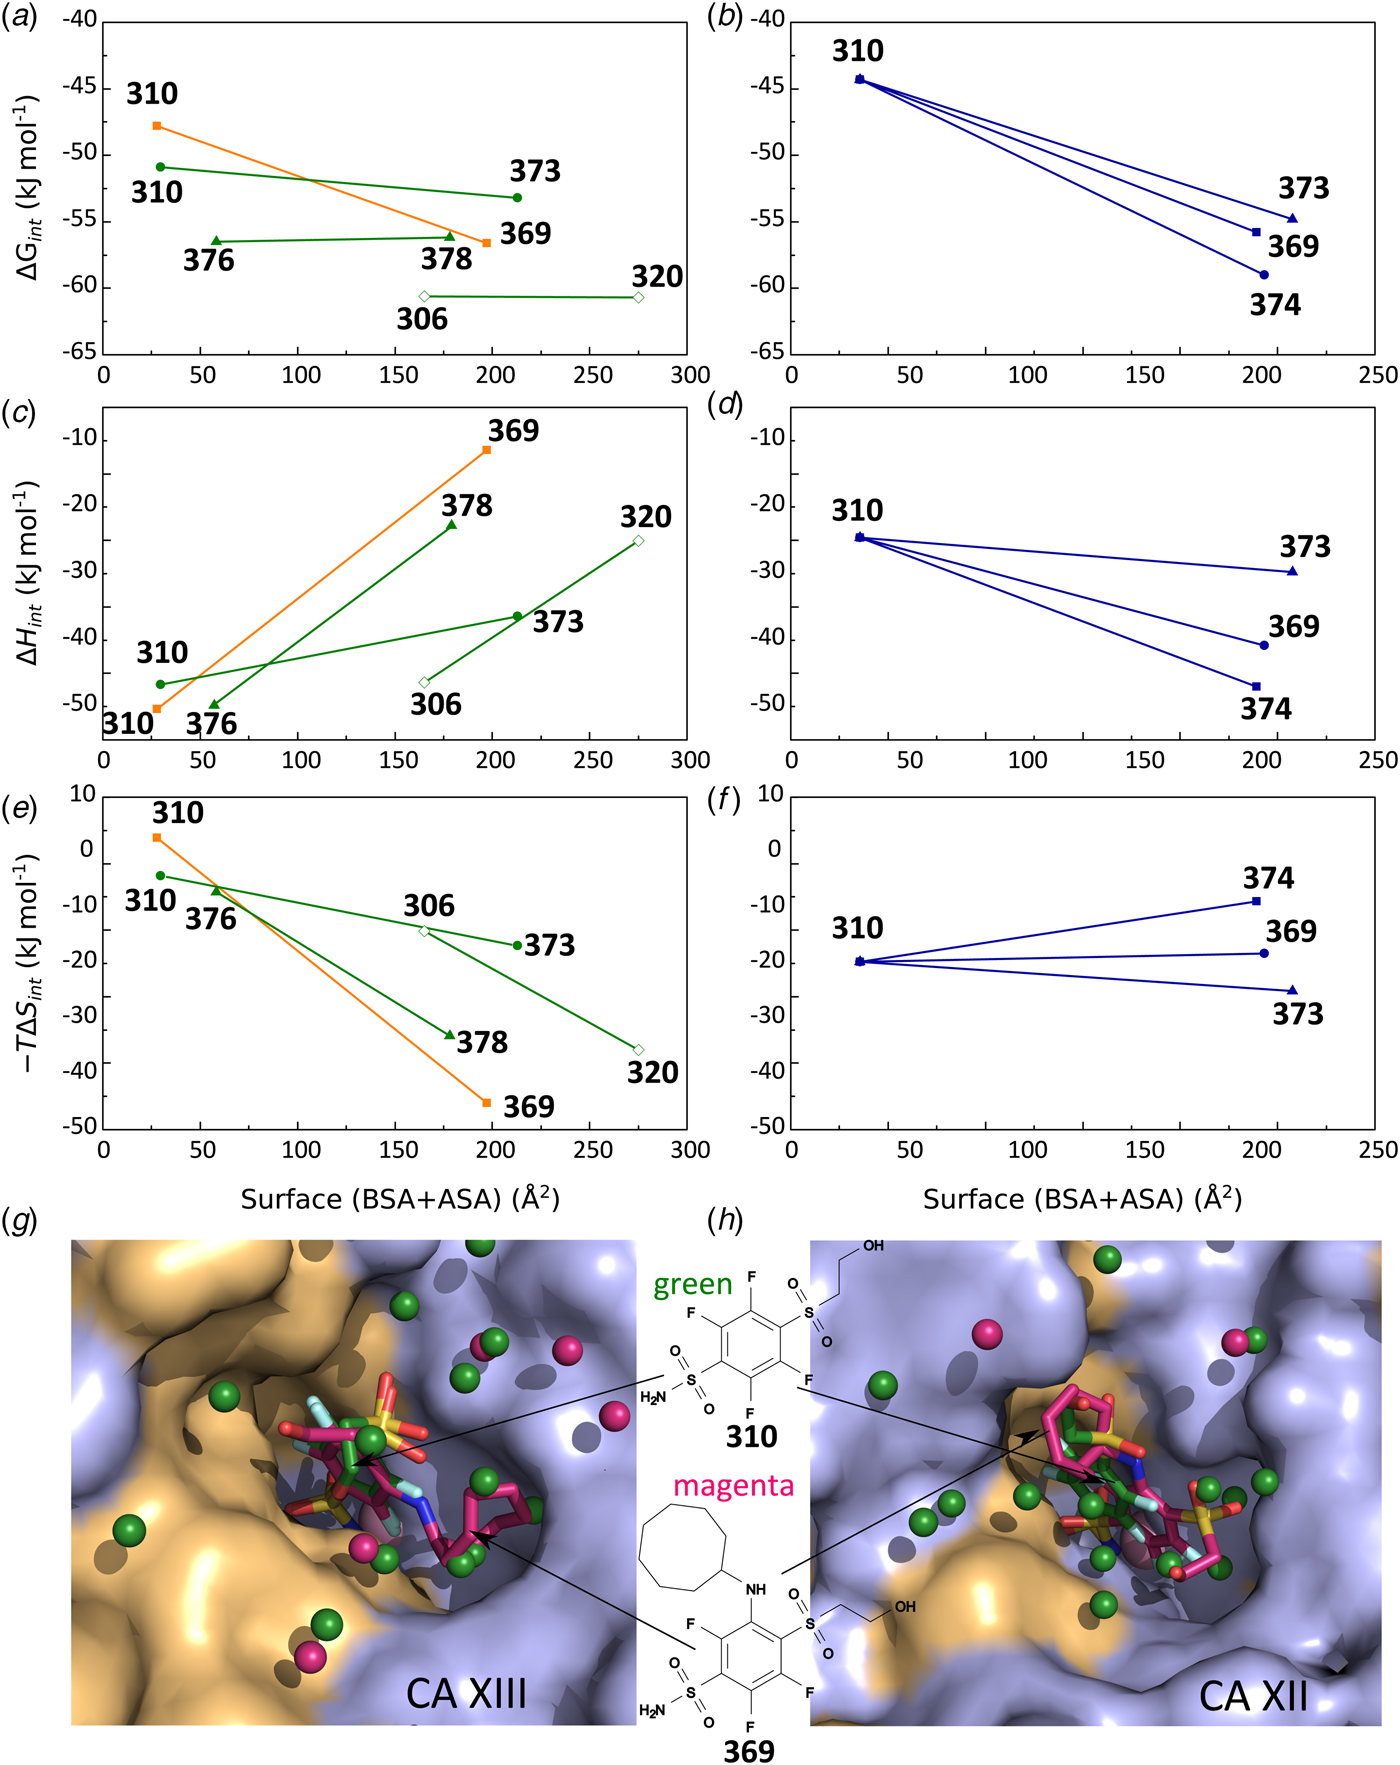
High-affinity and selective inhibitors of CA isoforms
One of the main practically-useful outcomes of this structure-activity correlation study of CAs is a series of compounds that were designed and exhibited high affinity for one CA isoform and thousand-fold selectivity over most or all remaining human CA isoforms, especially CA I and CA II. The structures of five such compounds are shown in Fig. 30 together with the observed K ds towards a particular CA isoform and compared with the affinities for CA I and CA II. Note that here we chose to list the observed affinities in addition to the intrinsic ones because for a pharmaceutical developer of lead structures it is important to know what is the potency/affinity of the compound under physiological conditions such as pH 7.0. The affinities of our best compounds towards CA I and CA IX reached from 10 to 100 pM, while for CA IV, CA VA, and CA XII – around 1nM. These compounds have a potential to be further developed as pharmaceuticals.
Several compounds that exhibit high affinity towards one CA isoform and significant selectivity over CA I and CA II. The observed and intrinsic K ds of the compounds to the most important CAs are shown below.
Conclusions
In this paper, we have reviewed and provided our opinion on the state-of-the-art in the design of small molecule inhibitors of human CAs. Among the techniques that are most often used and are of most importance in the experimental assessment of compound interaction with CAs and inhibition of their enzymatic activity are stopped-flow assay of the inhibition of CA enzymatic activity, isothermal titration calorimetry, fluorescent thermal shift assay, and SPR. Every one of these methods has advantages and disadvantages and it is advised to obtain data by several orthogonal techniques that complement each other and increase our knowledge in various aspects of interaction. For example, FTSA has the widest affinity range, SFA is the only method that directly determines the inhibition of enzymatic activity, ITC is the only method that directly determines the enthalpy of interaction, and SPR is the only technique from this list that determines the kinetic parameters of binding.
The interaction between the best-known inhibitors of CAs, primary sulfonamides, is hindered by the binding-linked reactions, such as deprotonation of the sulfonamide amino group or protonation of the CA-Zn(II)-bound hydroxide. It seems that in many cases a non-dominant form of the compound or protein is binding and, therefore, the binding is strongly influenced by buffer or pH. It is important to subtract all such binding-linked reactions in order to obtain the intrinsic thermodynamic and kinetic binding parameters. Such parameters are necessary to obtain correlations between compound chemical structures and binding efficiency. It is not fully correct to develop compound structures based only on the observed binding parameters.
The 85 X-ray crystallographic structures of 60 compounds bound to six CA isoforms together with a database of 400 primary sulfonamide compound binding to 12 recombinant human catalytically active CAs provided insight in the chemical structural features that strengthen compound binding and in some cases make the compounds more selective towards a particular CA isoform that is a potential drug target. The data should also be of use for computational modelers that build approaches to design novel compounds in silico. Compounds that reached pM to nM affinity towards CA I, CA IV, CA VA, CA IX, and CA XII and exhibited thousands of fold selectivity towards these isoforms were proposed as compounds suitable for further development as drugs targeting these isoforms.
Supplementary material
The supplementary material for this article can be found at https://doi.org/10.1017/S0033583518000082
Acknowledgements
This research was funded by a grant from the Research Council of Lithuania (S-MIP-17-87). The authors thank the local contacts at the EMBL beamlines Dr. G. Bourenkov and Dr. M. Cianci for the help with P13 and P14 EMBL beamline operations at PETRA III storage ring (DESY, Hamburg). Instant JChem was used for structure database management, search and prediction, Instant JChem 6.1.3, 2013, ChemAxon (http://www.chemaxon.com). Authors acknowledge Povilas Norvaišas for maintaining and supporting the Instant JChem database. The authors thank Audronė Rukšėnaitė, Vytautas Smirnovas, and Zita Liutkevičiūtė for performing HRMS experiments on part of the compounds and proteins.


 Open access