



INTRODUCTION
Despite the existence of an effective vaccine, measles remains a major cause of childhood morbidity and mortality in many parts of the world. In 2015, more than 134 000 measles-related deaths occurred globally [1]. Most measles-related deaths can be attributed to complications such as encephalitis (which causes brain swelling), severe diarrhoea, or respiratory infections such as pneumonia, all of which are more common in children under the age of 5, or adults over the age of 20 [1].
Estimates of the case-fatality rate (CFR) for measles, an important component of disease burden, have varied widely from one study to another. The CFR is defined as the proportion of cases that results in death that is attributable to the disease. For acute infections, such as measles, the CFR provides a measure of the risk of death due to the disease (it is the per capita probability of dying as a result of infection) and also allows estimation of the mortality burden of a disease from case report data. Estimates of measles CFR have varied across space and time and even for the same geographic area over time and across studies [Reference Wolfson, Grais, Luquero, Birmingham and Strebel2]. A comprehensive review of community-based studies, published between 1980 and 2008, found that estimated CFRs have ranged from 0 to 0·40, with a median CFR of 0·0391 across studies [Reference Wolfson, Grais, Luquero, Birmingham and Strebel2].
There is evidence to suggest that malnutrition (typically measured as being low on anthropometric indicators such as weight-for-age or weight-for-height) is often an underlying cause of childhood deaths from infectious diseases in developing countries [Reference Rice, Sacco, Hyder and Black3]. While this association has been consistently documented for diarrheal and acute respiratory infections, the evidence for deaths due to measles has been less consistent across studies [Reference Rice, Sacco, Hyder and Black3]. Most community-based studies have found no evidence for an association between measles mortality and nutritional status [Reference Aaby4, Reference Koster, Curlin, Aziz and Haque5], while many hospital-based studies [Reference Mahamud, Burton, Hassan, Ahmed, Wagacha, Spiegel, Haskew, Eidex, Shetty, Cookson, Navarro-Colorado and Goodson6, Reference Hutasoit, Dj, Daulay, Lubis and Siregar7] have shown an association [Reference Wolfson, Grais, Luquero, Birmingham and Strebel2, Reference Rice, Sacco, Hyder and Black3]. However, the majority of these studies, both hospital and community-based, are unable to examine the association of measles mortality with nutritional status prior to infection with measles.
While the evidence is generally mixed, amongst populations that have experienced a famine or armed conflict, malnutrition and measles mortality have been shown to be strongly associated [Reference Mahamud, Burton, Hassan, Ahmed, Wagacha, Spiegel, Haskew, Eidex, Shetty, Cookson, Navarro-Colorado and Goodson6, Reference Shears, Berry, Murphy and Nabil8, Reference Moore, Marfin, Quenemoen, Gessner, Miller, Toole, Ayub and Sullivan9]. Further, a growing body of evidence suggests that exposure to malnutrition or other adverse environments in the fetal period and early childhood exerts a lasting effect on health [Reference Barker10–Reference Chen and Zhou12]. In particular, previous studies have documented the long-term health consequences for birth cohorts that were in-utero or born during a famine [Reference Roseboom, de Rooij and Painter11–Reference Huang, Li, Wang and Martorell13].
Here, we use historical measles mortality data, to estimate the CFR of measles in the Matlab region of Bangladesh. Matlab, like the rest of the country, suffered from two major disruptive events in the 1970s – civil war in 1971 and famine in 1974. The death rate in Matlab climbed from around 15 per thousand to 21 per thousand during the 1971 war and then declined to the pre-war level by the end of the year [Reference Chen and Chowdhury14]. The effect of the 1974 famine on mortality was more prolonged than the effect of the war – the death rate increased to 20 per thousand in 1974 and remained high until June 1976 [Reference Chen and Chowdhury14, Reference Razzaque, Alam, Wai and Foster15]. Among children under five, the most common assigned causes of death were (in order of importance) diarrhea, tetanus, fever, respiratory infections, oedema and measles [Reference Chen, Rahman and Sarder16]. Deaths due to diarrheal diseases were particularly high during the famine period, while deaths from measles and respiratory infections were significantly higher in the few years following the famine compared with non-famine years [Reference Razzaque, Alam, Wai and Foster15].
The majority of studies on famine mortality have focused on refugee populations, largely due to lack of reliable vital registration data [Reference Young and Jaspars17]. The availability of detailed death reports from Matlab over a long time period, thus, provides a unique opportunity to explore the impact of famine and conflict on measles mortality. We fit a mechanistic model of measles transmission to the mortality time series data to estimate the CFR. We first demonstrate the ability of this model to recover the CFR in the absence of incidence data, using simulated mortality data and compare our CFR estimates with those from studies based on surveillance data in the same region. We then use this method to quantify the combination of transmission and CFR that resulted in a large number of deaths during a measles outbreak in the region in 1976.
METHODS
Data
Matlab is a rural area in Bangladesh, located about 40 miles south of the capital city. The Matlab research site consists of several hundred densely populated villages located in a riverine area. The area experiences three distinct seasons: hot and dry (March–June); hot and wet during the monsoon season (July – October); and cool and dry (November–February) and is often flooded as a result of heavy monsoon rain. Historically, rice cultivation, followed by fishing, have been the most common occupations. Literacy and schooling rates were historically quite low in the region [Reference Becker18, Reference Becker and Weng19]. Matlab, like the rest of the country, suffered from two major disruptive events in the 1970s that resulted in well-documented demographic changes [Reference Curlin, Chen and Hussain20, Reference Chowdhury and Chen21]. First, the Bangladesh war of independence occurred between March and December of 1971. Second, unusually heavy monsoon rains in 1974 destroyed much of the rice crop. The political instability following the war and the destruction of the rice crop in 1974, in combination with many other factors, led to widespread famine and a period of mass starvation in 1974 [Reference Curlin, Chen and Hussain20, Reference Chowdhury and Chen21], particularly in rural areas [Reference Rahaman22]. Food shortages during the war and the famine greatly increased the proportion of malnourished children leading to increased mortality and morbidity rates [Reference Curlin, Chen and Hussain20]. The war also led to migration that may have had important consequences for infectious disease transmission. First, urban workers in Bangladesh returned to their village homes at the start of the conflict. Second, the war led to a massive short-term migration, as refugees from Bangladesh first fled to India in 1971 and then returned to Bangladesh by early 1972.
Since 1966, the International Center for Diarrheal Disease Research, Bangladesh has maintained a registration system for births, deaths and migration in the Matlab area. The continuous surveillance of vital events began with about 111 000 persons in 132 villages in 1966. The study area was expanded in the late 1960s to include an additional 101 villages (this is reflected in the data from 1971 onwards). The definition of the demographic surveillance area was changed again in 1978 and was reduced to 149 villages with a population of about 176 000 people. Trained field workers visited households on a weekly basis in the early years and later fortnightly basis, to collect information on vital events.
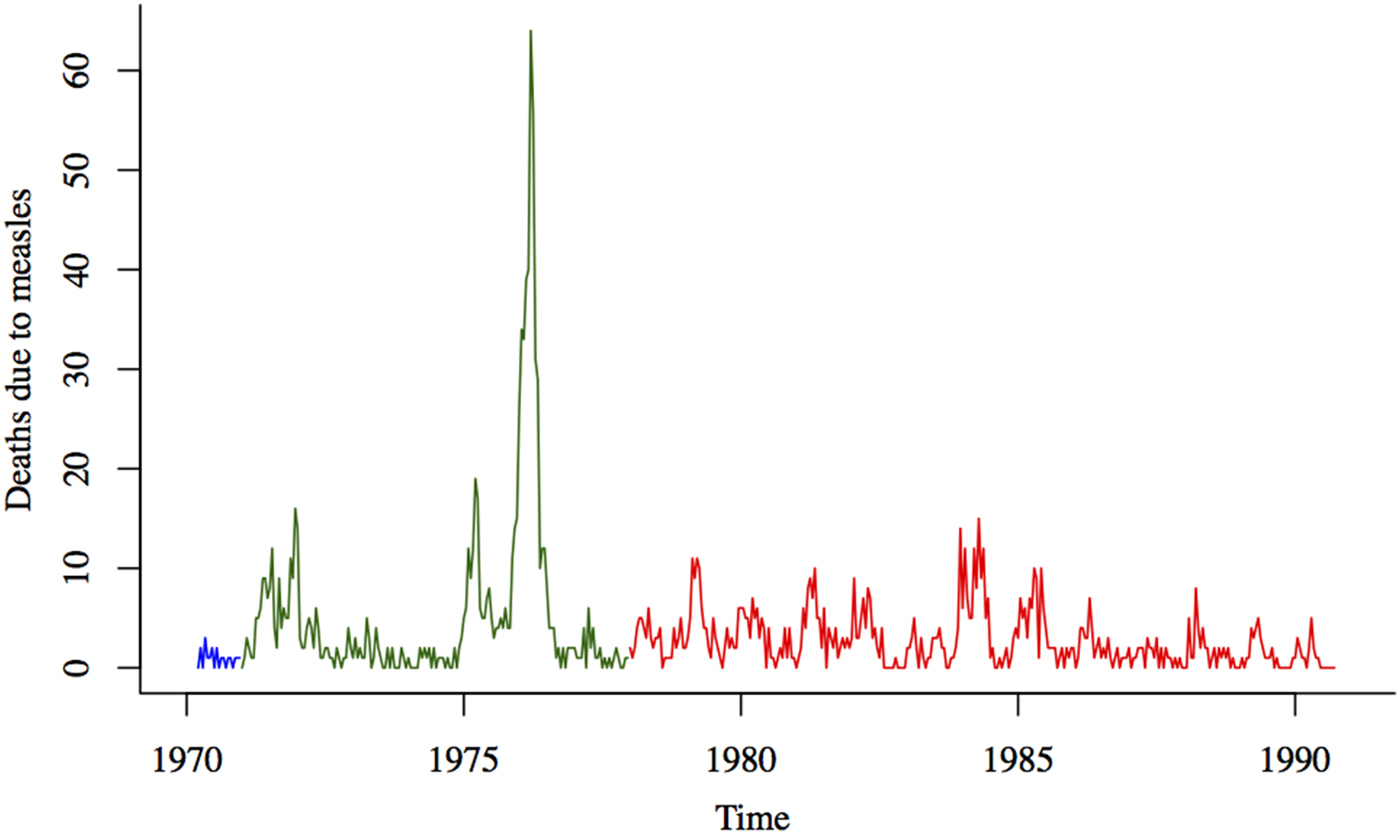
In this study, we use the death reports collected in the Matlab area between January 1970 and September 1991 (Fig. 1). The death reports contain information on the date of death, age at death and the cause of death. The cause of death was assigned by non-medical personnel who received training on the signs and symptoms of common diseases. After 1986, the cause of death was determined by medically trained staff based on the description provided by relatives during the interview. Because of the frequency of visits and the well-known symptoms of measles, under-reporting of deaths directly due to measles is likely to be low. Surveillance continued even during the war, as many female field workers remained in the villages and continued to record vital events [Reference Curlin, Chen and Hussain20]. A post-war census and enumeration effort revealed that only 2·7% of births and 4·9% of deaths were not registered during the war [Reference Curlin, Chen and Hussain20]. Measles vaccination was slowly phased into the Matlab region, under an experimental maternal and child health program, between 1982 and 1986 [Reference Koenig, Khan, Wojtyniak, Clemens, Chakraborty, Fauveau, Phillips, Akbar and Barua23].
Deaths due to measles (aggregated to the biweekly level) from January 1970 to September 1991. The three colors represent the three different data collection efforts over this time period (with varying numbers of villages under surveillance).
Estimating CFR using the time series Susceptible-Infected-Recovered (TSIR) framework
We use a modification of the TSIR model developed by [Reference Finkenstädt and Grenfell24]. The TSIR is an autoregressive model, that describes the dynamics of the infected and susceptible populations over time as a set of difference equations. The number infected at each time step is described by:
 $$\matrix{ {E\left[ {I_{t + 1}} \right] = \displaystyle{{\beta _s I_t^\alpha S_t} \over {N_t}} \;} \cr} $$
where E[I t+1] is the expected number of infected individuals, I t and S t are the numbers infected and susceptible at time, t, respectively, N t is the total population size at time, t; β s is the seasonal transmission factor; and α captures heterogeneities in mixing and the effects of discretizing a continuous time process.
To fit the TSIR to mortality time series data, we model the number of deaths due to measles at each time step, D t as a fraction, ρ t , of the number of infected cases, I t :
 $$\matrix{ {D_t = \rho _t I_t \;} \cr} $$
We aggregated the number of deaths to produce observations for 24-time points in the year. This allows us to fit the TSIR to biweekly observations, which is close to the generation time for measles [Reference Anderson and May25]. Assuming that under-reporting of deaths due to measles is low, ρ t is the time-varying CFR for measles. We can use the same method for estimating the under-reporting rate in the TSIR framework, described in detail in [Reference Finkenstädt and Grenfell24], to estimate ρ t . Assuming all individuals eventually become infected, the number of infected individuals tracks the births, B t and the number of susceptible individuals is defined by:
 $$\matrix{ {S_{t + 1} = S_t + B_t - I_t + u_t} \cr} $$
where, u
t
is additive noise, with E[u
t
] = 0. If the number of susceptible individuals fluctuates around a mean, then $S_t = \bar S \bar N + Z_t $
, where
$S_t = \bar S \bar N + Z_t $
, where $\overline {S\;} $
is the average proportion of susceptible individuals in the population,
$\overline {S\;} $
is the average proportion of susceptible individuals in the population, $\bar S\bar N$
is the mean number of susceptible individuals in the population and Z
t
is the unknown deviation around the mean number of susceptible individuals. We can rewrite the susceptible difference equation in terms of the deviations, Z
t
and iterate successively with an initial starting condition, Z
0. This yields:
$\bar S\bar N$
is the mean number of susceptible individuals in the population and Z
t
is the unknown deviation around the mean number of susceptible individuals. We can rewrite the susceptible difference equation in terms of the deviations, Z
t
and iterate successively with an initial starting condition, Z
0. This yields:
 $$\matrix{ {\mathop \sum \limits_{k = 0}^{t - 1} B_k = - Z_0 + \mathop \sum \limits_{k = 0}^{t - 1} I_k + Z_t + u_t} \cr} $$
We can replace I k with D k /ρ k and the time-varying CFR can be estimated as the inverse of the slope of the regression line relating the cumulative number of births to cumulative number of deaths. To allow for local variation in the slope of the regression line, i.e. to allow the CFR to vary temporally, we used a locally varying regression method. Based on our simulation results, we use a cubic smoothing spline with 5 degrees of freedom. Our CFR estimates, however, are generally robust to the method used (loess regression, lowess regression and spline regressions with higher and lower degrees of freedom); all estimation methods produce similar temporal trends and magnitudes. Once we have estimated the CFR, we can use the TSIR framework to reconstruct the susceptible population and to estimate the seasonal transmission rates, β s (see [Reference Finkenstädt and Grenfell24] for details).
The surveillance area changed twice between 1970 and 1991; thus, slightly different populations are included in each of the three observation periods, although the majority of villages are included in all three surveillance area definitions (1970–1971, 1971–1978, 1978 onwards). In order to account for the fact that the population size and births are different over these three surveillance periods, we estimate the CFR separately for each time period. Although the population size is different in each surveillance period, we assume that the mean proportion of the population that is susceptible, $\; \overline {S\;} $
, was the same in each period, which allows us to fit the model to the entire mortality time series. Since the majority of villages were included in all three surveillance area definitions, we assume that the seasonal transmission rates, β
s
, were the same in each of the three surveillance populations. We drop the observations for the endpoint of each surveillance period and fit the model to the rest of the data to estimate ρ
t
,
$\; \overline {S\;} $
, was the same in each period, which allows us to fit the model to the entire mortality time series. Since the majority of villages were included in all three surveillance area definitions, we assume that the seasonal transmission rates, β
s
, were the same in each of the three surveillance populations. We drop the observations for the endpoint of each surveillance period and fit the model to the rest of the data to estimate ρ
t
, $\overline {S\;} $
and β
s
.
$\overline {S\;} $
and β
s
.
To examine the robustness of our method of estimating the CFR, we simulated measles incidence and mortality using different assumptions about the CFR over the simulation time period and examined the ability of the TSIR framework to recover the CFR from the simulated mortality data. We sampled incidence, I t+1, from a negative binomial distribution:
 $${ {I_{t + 1} \sim NB\left( {\displaystyle{{\beta _{s} I_t^\alpha S_t} \over {N_t}}, I_t} \right)} } $$
with mean $E[I_{t + 1} ] = \beta _{s\;} I_t^\alpha S_t /N_t $
and shape parameter I
t
. We simulated S
t
according to equation (3). We simulated I
t
and S
t
from 1978 to 1991, using the observed population and births over that time period and the estimates of the seasonal transmission rates from the TSIR fit to the data. We used I
0 = 100 and the estimated S
0 as the initial conditions and allowed the simulation to continue until the end of the observed time series. We then sampled deaths from the simulated incidence data assuming (1) constant CFR over the entire time period, (2) linearly increasing CFR over the time period, (3) linearly decreasing CFR over the time period and (4) non-linear CFR with an increase in the middle of the time period. For the first scenario, we kept the CFR constant at 0·0286, which was the average CFR estimated for Southeast Asia, based on studies conducted between 1980 and 2008 [Reference Wolfson, Grais, Luquero, Birmingham and Strebel2]; for the increasing and decreasing CFR scenarios we used the range of measles CFRs that have been estimated for Southeast Asia [Reference Wolfson, Grais, Luquero, Birmingham and Strebel2]. For the final scenario, we create an abrupt increase in CFR for a year (24-time steps). We assumed deaths were drawn from a binomial distribution with the size given by I
t
and probability of a death occurring given by the CFR for each time step. For each scenario, we estimated the CFR using the TSIR framework and compared with the true CFR used to simulate the time series. We estimated the CFR using loess regression, lowess regression and spline regressions with degrees of freedom ranging from 2 to 8.
$E[I_{t + 1} ] = \beta _{s\;} I_t^\alpha S_t /N_t $
and shape parameter I
t
. We simulated S
t
according to equation (3). We simulated I
t
and S
t
from 1978 to 1991, using the observed population and births over that time period and the estimates of the seasonal transmission rates from the TSIR fit to the data. We used I
0 = 100 and the estimated S
0 as the initial conditions and allowed the simulation to continue until the end of the observed time series. We then sampled deaths from the simulated incidence data assuming (1) constant CFR over the entire time period, (2) linearly increasing CFR over the time period, (3) linearly decreasing CFR over the time period and (4) non-linear CFR with an increase in the middle of the time period. For the first scenario, we kept the CFR constant at 0·0286, which was the average CFR estimated for Southeast Asia, based on studies conducted between 1980 and 2008 [Reference Wolfson, Grais, Luquero, Birmingham and Strebel2]; for the increasing and decreasing CFR scenarios we used the range of measles CFRs that have been estimated for Southeast Asia [Reference Wolfson, Grais, Luquero, Birmingham and Strebel2]. For the final scenario, we create an abrupt increase in CFR for a year (24-time steps). We assumed deaths were drawn from a binomial distribution with the size given by I
t
and probability of a death occurring given by the CFR for each time step. For each scenario, we estimated the CFR using the TSIR framework and compared with the true CFR used to simulate the time series. We estimated the CFR using loess regression, lowess regression and spline regressions with degrees of freedom ranging from 2 to 8.
Estimating transmission rate and CFR simultaneously
To examine the combination of CFR and transmission rate during the largest outbreak in our time series (from October 1975 to July 1976), we estimated the two parameters using the maximum likelihood ‘removal’ method introduced by [Reference Ferrari, Bjørnstad and Dobson26]. This method is similar to the TSIR, but allows us to simultaneously estimate the CFR and the transmission rate for a single epidemic. Assuming contacts occur at random in the population, infections will occur with probability 1 − e−βI/N . Ignoring births and variance in the transmission rate over the course of this short outbreak, we can model the transmission as a chain-binomial process, such that:
 $$\matrix{ {I_{t + 1} \sim{\rm Binomial}\left( {S_t, 1 - {\rm e}^{ - \beta I/N}} \right)} \cr} $$
 $$\matrix{ {S_{t + 1} = S_t - I_t = S_0 - \mathop \sum \limits_{k = 0}^t I_k} \cr} $$
As before, the number of deaths due to measles is given by equation (2), except now we assume a constant CFR, ρ, over the course of the outbreak. Therefore, deaths occur with probability 1 − e−βI/N × ρ. In this framework, the inherent infection dynamics are captured by β and is identifiable relative to ρ. We estimate the two parameters simultaneously by using numerical methods to maximise the log-likelihood of observing the data given the model.
RESULTS
Between 1970 and September 1991, one large outbreak of measles occurred in Matlab, with more than 4000 estimated cases (Supplementary Fig. S1) during the peak week of incidence (late March 1976) and about 465 deaths over the course of the outbreak. Several smaller outbreaks occurred between 1970 and 1991 with an estimated peak incidence between 500 and 1000 cases (Supplementary Fig. S1). The age at death due to measles did not vary much over this time period (median = 2·22 years; mean = 2·85 years), including during the larger outbreaks (Supplementary Fig. S2). The estimated average transmission rate, from the TSIR fit, is low ( $\bar \beta $
= 9·88) compared with previous estimates for measles [Reference Finkenstädt and Grenfell24, Reference Anderson and May25], likely due to our use of mortality data rather than incidence data (see discussion below).
$\bar \beta $
= 9·88) compared with previous estimates for measles [Reference Finkenstädt and Grenfell24, Reference Anderson and May25], likely due to our use of mortality data rather than incidence data (see discussion below).
Measles case-fatality rate in Matlab
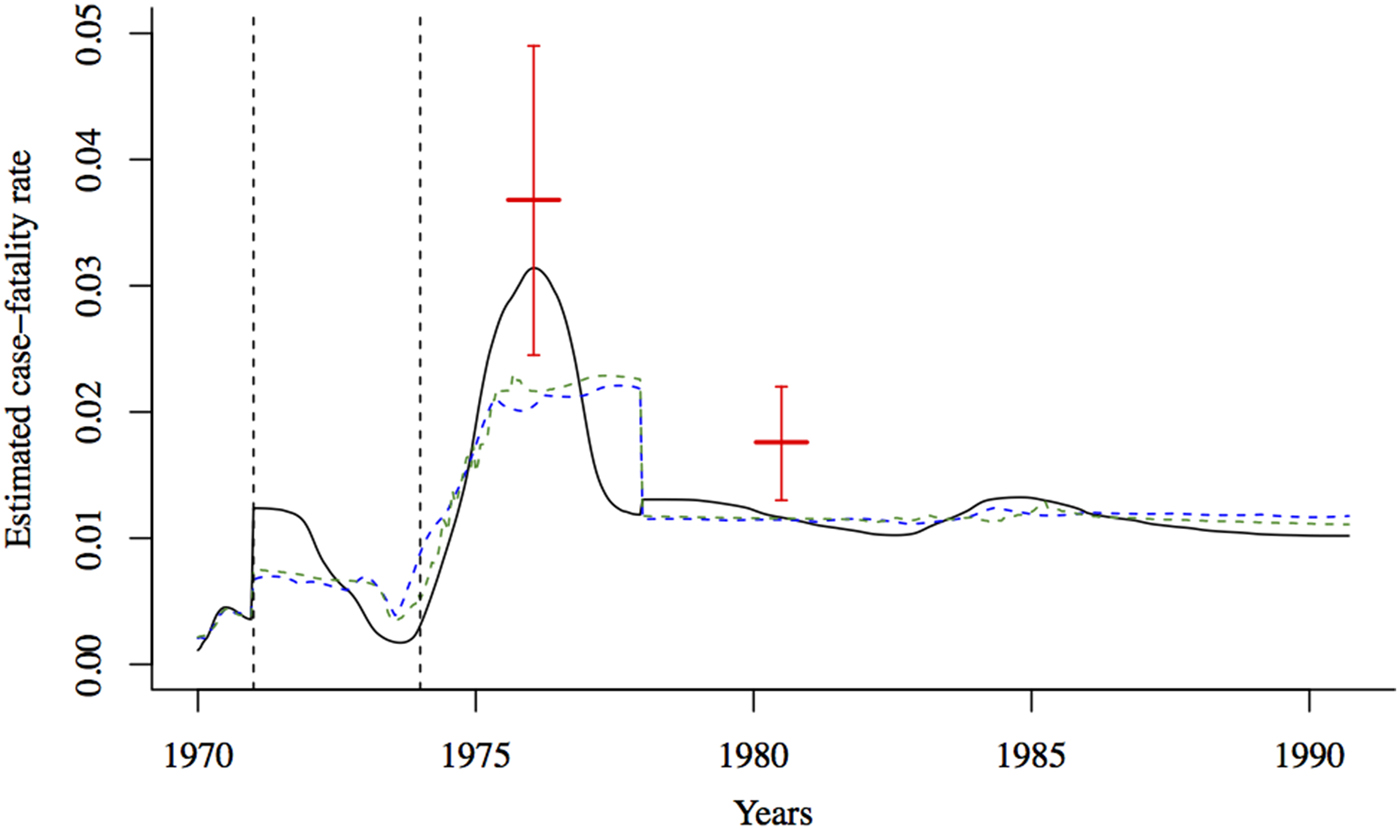
Figure 2 shows the estimated CFR of measles in Matlab between 1970 and 1991. The CFR increased slightly after the 1971 war and was considerably higher between January 1975 and December 1976. Our CFR estimate is within the 95% confidence interval of the estimate from 12 villages in the Matlab area between August 1975 and July 1976 [Reference Koster, Curlin, Aziz and Haque5]. However, our estimate is slightly lower than the CFR estimated for the Matlab area in 1980 by [Reference Bhuiya, Wojtyniak, D'Souza, Nahar and Shaikh27]. There are several possible reasons for this discrepancy. Bhuiya et al. [Reference Bhuiya, Wojtyniak, D'Souza, Nahar and Shaikh27] only included children five and under in their sample. Even within this age range, they found variation in measles CFR by age, with CFR highest for children 12–35 months of age and lower among younger children (likely due to maternal immunity) and older children. Our estimates for the measles CFR are based on the entire population of Matlab and thus will be lower than the under-5 CFR estimate, since CFR decreases with age after the first 12 months [Reference Wolfson, Grais, Luquero, Birmingham and Strebel2]. In the absence of incidence data by age, we cannot directly compare our estimates, which are unadjusted for the population age-distribution, to age-specific CFRs. The discrepancy could also be due to our estimation method, which may underestimate CFR depending on the underlying trend over time (see Fig. 3).
The estimated CFR from the regression of cumulative births against cumulative deaths using three estimation methods (black solid line: spline regression; blue dashed line: loess regression, green dashed line: lowess regression). The case-fatality rate for measles was estimated to be around 0·037 (95% binomial CI 0·025–0·049) in the Matlab area between August 1975 and July 1976 [Reference Koster, Curlin, Aziz and Haque5], and 0·018 (95% binomial CI 0·013–0·022) in 1980 [Reference Bhuiya, Wojtyniak, D'Souza, Nahar and Shaikh27] (indicated by solid red lines). The dashed vertical black lines indicate the onset of the war (1971) and the famine (1974).
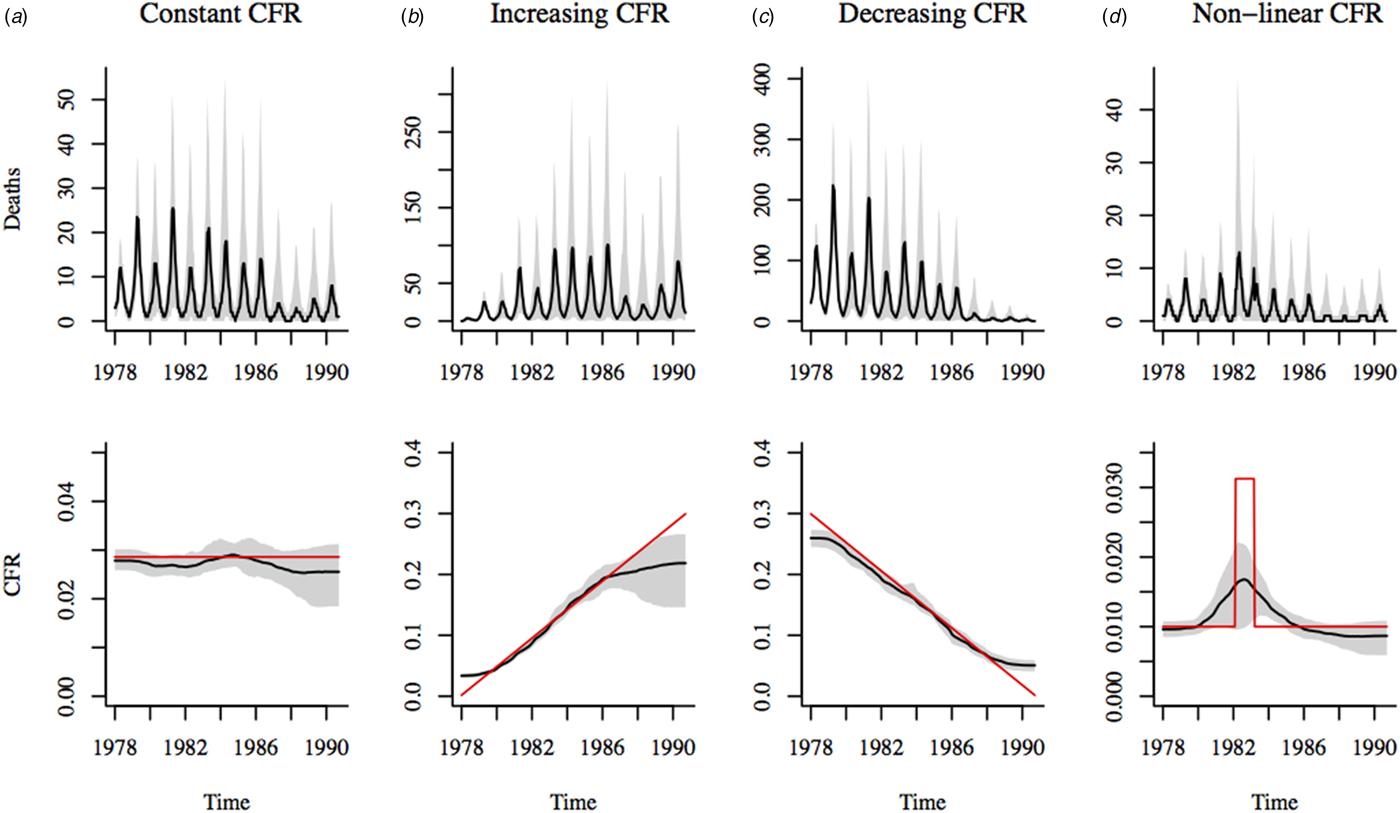
Estimates of CFR using spline regression (with 5 degrees of freedom) of cumulative births on cumulative simulated deaths. Stochastic simulations of deaths are shown in the top panel of plots. Black line shows the median of 500 simulations; the shadowed region corresponds to the range between the 10th and 90th percentiles of the simulations. Deaths were simulated assuming four scenarios: (a) constant CFR = 0·02; (b) linearly increasing CFR over the time period, (c) linearly decreasing CFR over the time period and (d) non-linear CFR with an increase in the middle of the time period. The bottom panel of plots shows median estimated CFR in black; the shadowed region corresponds to the range between the 10th and 90th percentiles of the estimates. Red line indicates the actual CFR assumed for each simulation scenario.
Robustness check
We simulated measles deaths in Matlab under a variety of scenarios, using a range of CFR values based on past estimates for Southeast Asia [Reference Wolfson, Grais, Luquero, Birmingham and Strebel2]. Results from our simulations (Fig. 3) suggest that the TSIR framework is generally able to capture the magnitude and temporal trend in CFR from mortality data. If the CFR is changing over time, the CFR estimate at the start and end of the observation period, as well as during sudden large fluctuations, may be biased depending on the estimation method used. The optimal estimation method, i.e. choice of local regression method will depend on the underlying trend in the CFR and the length of the time series. For the plausible range of CFR values in our simulations, spline regressions perform best (see Supplementary Figs S5 and S6 for comparison with other methods). Here, we choose spline regression with 5 degrees of freedom which avoids overfitting to fluctuations in the mortality data (which increases variability in the estimates) and produces reasonable estimates of the CFR under the various simulation scenarios (Supplementary Fig. S7).
One important limitation of this method of estimating CFR is that while we are able to capture long-term changes in CFR (such as increases, decreases, or sharp changes) we are unable to pick up regular annual seasonal changes in CFR (Supplementary Figs S8 and S9). A comparison of mortality and incidence data from England and Wales, however, showed that seasonal measles mortality patterns closely followed measles incidence patterns, with a small delay of less than 2 weeks [Reference Mantilla-Beniers, Bjørnstad, Grenfell and Rohani28], suggesting negligible seasonality in CFR. Further, a 2-year measles surveillance study in Matlab also found no significant difference in CFR by season [Reference De Francisco, Fauveau, Sarder, Chowdhury, Chakraborty and Yunus29].
The 1976 outbreak
We estimated the transmission rate and CFR during the 1976 outbreak using the chain-binomial model. Assuming that deaths were not under-reported, the transmission rate was 15·11 (95% CI 12·90–17·56) and the CFR was 0·031 (95% CI 0·026–0·043) during the 1976 outbreak (Supplementary Fig. S10 shows the fitted model for the 1976 outbreak). Our results suggest that both the CFR and the transmission rate were higher during the 1976 outbreak. The estimated transmission rate during the famine was higher than the mean transmission rate over the entire time period ( $\bar \beta $
= 9·88 from TSIR fit). The estimated CFR is in close agreement with our estimate of the CFR from fitting the TSIR model (CFR
TSIR
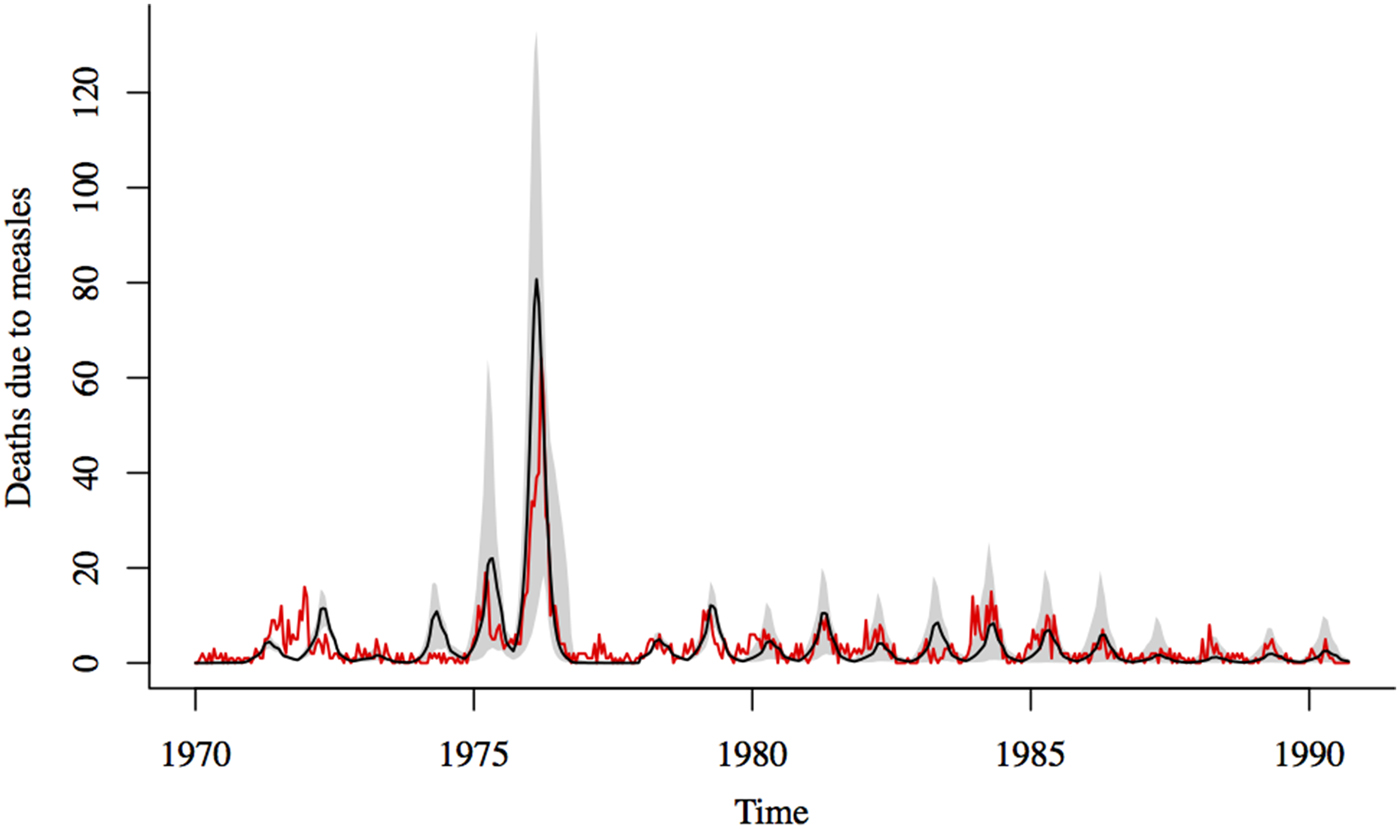
= 0·031 at the peak of the outbreak); Koster et al.’s [Reference Koster, Curlin, Aziz and Haque5] estimate of CFR from roughly the same time period is also within the 95% confidence interval of our estimate. Forward simulations using these estimates for the CFR and transmission rates for the 1976 outbreak and TSIR estimates for the rest of the observation period, provides a reasonably good fit to the data, despite the erratic nature of the outbreaks (Fig. 4).
$\bar \beta $
= 9·88 from TSIR fit). The estimated CFR is in close agreement with our estimate of the CFR from fitting the TSIR model (CFR
TSIR
= 0·031 at the peak of the outbreak); Koster et al.’s [Reference Koster, Curlin, Aziz and Haque5] estimate of CFR from roughly the same time period is also within the 95% confidence interval of our estimate. Forward simulations using these estimates for the CFR and transmission rates for the 1976 outbreak and TSIR estimates for the rest of the observation period, provides a reasonably good fit to the data, despite the erratic nature of the outbreaks (Fig. 4).
Comparison of reported and simulated measles deaths. Black line shows the median of 1000 simulations using estimates for the transmission rate and CFR for the 1976 outbreak and TSIR estimates of transmission and CFR for the rest of the time series; the shadowed region corresponds to the range between the 10th and 90th percentiles of the simulations. Red line shows the reported deaths due to measles.
Our results suggest that the CFR during the 1976 outbreak was 2·7 times higher than the CFR during the rest of the observation period. About 66% of the children who died during the 1976 outbreak was born between 1972 and 1974, with the largest proportion born during the 1974 famine (Supplementary Fig. S11). The estimated CFR also begins to increase after 1974, which suggests that the famine played a role. The distribution of age at death, normalised by the total number of children born in each year, shows that children born during the famine year had a higher probability of dying from measles within a 3-year window from birth, compared to children born in earlier and later years (Supplementary Fig. S12). This pattern may be explained by many potential factors such as differing exposure to the risk of measles incidence or differing exposure to the risk of dying from other causes for children born in different years. However, descriptions of the famine in 1974 and the few years preceding it, suggests that there was widespread malnutrition [Reference Rahaman22], which is likely to have led to the higher CFR for measles. In comparison, the outbreak following the 1971 war was characterised by a much smaller increase in the CFR (ρ = 0·016 (s.e. = 0·001); β = 10·56 (s.e. = 1·071)), which suggests that the direct effects of the war on mortality were more acute.
DISCUSSION
In 1976, Matlab experienced a large measles outbreak with more than 4000 estimated cases. Several smaller outbreaks occurred between 1970 and 1991. Unlike historical measles data from England and Wales and elsewhere [Reference Finkenstädt and Grenfell24, Reference Dalziel, Bjørnstad, van Panhuis, Burke, Metcalf and Grenfell30], the outbreak patterns in Matlab were erratic and annual cycles were only evident for a short period between 1976 and 1988 (Supplementary Fig. S1). This may be due to differences between mortality and incidence data. For instance, mortality data typically contains many more weeks with zero notifications since measles CFR is typically quite low. Further, changes in the CFR over time can cause the dynamics of the mortality time series to deviate from that of the incidence time series [Reference Mantilla-Beniers, Bjørnstad, Grenfell and Rohani28]. However, a comparison of the mortality time series in Matlab, with available measles surveillance data (surveillance of 16 270 children in the Matlab area between 1982 and 1985) suggests a strong association between reported deaths and incidence (Supplementary Fig. S3).
The estimated average transmission rate for measles in Matlab is low ( $\bar \beta $
= 9·88) compared with previous estimates for measles [Reference Finkenstädt and Grenfell24, Reference Anderson and May25], likely due to our use of mortality data rather than incidence data. Previous work has suggested that estimates of seasonal transmission rates from mortality data, using the TSIR framework, tends to underestimate the average transmission rate and overestimate the degree of seasonal variability [Reference Mantilla-Beniers, Bjørnstad, Grenfell and Rohani28]. This is owing to the fact that mortality data generally resembles poorly sampled case notifications data, with a reduced amplitude [Reference Mantilla-Beniers, Bjørnstad, Grenfell and Rohani28]. The estimated transmission rates peaked in March and were low between May and October (Supplementary Fig. S4). A reduction in the transmission during the summer months has been well-documented for measles epidemics in major European and American cities prior to the start of vaccination and has been attributed to the role of school terms [Reference Finkenstädt and Grenfell24, Reference Dalziel, Bjørnstad, van Panhuis, Burke, Metcalf and Grenfell30–Reference Schenzle32]. In Matlab, the decline in transmission during summer was not significantly lower than the mean transmission across the year. This is likely a result of low schooling rates in Matlab during this time period [Reference Becker18, Reference Becker and Weng19], which would reduce the amplitude of seasonal forcing due to school terms.
$\bar \beta $
= 9·88) compared with previous estimates for measles [Reference Finkenstädt and Grenfell24, Reference Anderson and May25], likely due to our use of mortality data rather than incidence data. Previous work has suggested that estimates of seasonal transmission rates from mortality data, using the TSIR framework, tends to underestimate the average transmission rate and overestimate the degree of seasonal variability [Reference Mantilla-Beniers, Bjørnstad, Grenfell and Rohani28]. This is owing to the fact that mortality data generally resembles poorly sampled case notifications data, with a reduced amplitude [Reference Mantilla-Beniers, Bjørnstad, Grenfell and Rohani28]. The estimated transmission rates peaked in March and were low between May and October (Supplementary Fig. S4). A reduction in the transmission during the summer months has been well-documented for measles epidemics in major European and American cities prior to the start of vaccination and has been attributed to the role of school terms [Reference Finkenstädt and Grenfell24, Reference Dalziel, Bjørnstad, van Panhuis, Burke, Metcalf and Grenfell30–Reference Schenzle32]. In Matlab, the decline in transmission during summer was not significantly lower than the mean transmission across the year. This is likely a result of low schooling rates in Matlab during this time period [Reference Becker18, Reference Becker and Weng19], which would reduce the amplitude of seasonal forcing due to school terms.
The TSIR framework offers a novel way for estimating the CFR for measles and possibly other acute, directly-transmitted, immunizing childhood infections. Our simulation results suggest that the ability of this method to recover the CFR using measles mortality data and demographic data depends on the underlying change in the CFR over time. Nonetheless, across a range of plausible CFR values and trends over time, the TSIR framework was able to recover both the magnitude and fluctuations of the CFR from simulated mortality data. We also mapped our CFR estimates to previous estimates from surveillance data for two-time points in our time series. We can capture both the magnitude and the change in CFR suggested by these previous estimates.
We document a sharp increase in measles CFR following the 1974 famine, with peak CFR occurring in 1976. The majority of children who died during this outbreak were born between 1972 and 1974. In addition to the cohorts born during the famine (the 1 and 2-years-olds in 1976), cohorts that were born after the end of the war, but before the declared start of the famine (the 3 and 4-year-olds in 1976) were likely to also have been suffering from some degree of malnutrition as a result of the food shortages during the post-war period [Reference Razzaque, Alam, Wai and Foster15, Reference Rahaman22]. Deteriorating levels of domestic rice production and food scarcity in Bangladesh continued from 1971 to 1974, with only temporary relief provided by foreign aid immediately following the end of the 1971 war [Reference Rahaman22].
We find that a significantly higher proportion of children born in 1974 died of measles compared with children born 3 years earlier and children born 3 years later. Because the mean age of death was fairly constant across our time series, the timing of the 1976 outbreak resulted in a large number of deaths, most likely as a result of higher CFR experienced by cohorts born during the period of food shortage. Our results are consistent with past work showing an increase in all-cause mortality continuing into the second year of life for famine-born cohorts in Matlab, compared with non-famine born cohorts [Reference Razzaque, Alam, Wai and Foster15]. Since the famine was over before these children's first birthday, Razzaque et al. [Reference Razzaque, Alam, Wai and Foster15] argue that the increase in all-cause mortality was likely a result of ‘debilitation during the famine period, which increased the risk of later mortality.’
In contrast, there was only a slight increase in measles CFR during the 1971 war. One possible explanation for this is the relatively short duration of the conflict. As Curlin et al. [Reference Curlin, Chen and Hussain20] notes, ‘the war began in March and ended in December; moreover, during the first three months civil disturbances and food shortages were localised and limited. Thus, the vulnerable period was brief.’ Further, massive international aid donations, primarily in the form of wheat, immediately following the end of the war, helped avert starvation temporarily [Reference Rahaman22]. Nutritional surveys conducted in Matlab in 1972 and 1975 showed a higher prevalence of malnourishment among children following the 1974 famine compared with the 1971 war [Reference Chen and Chowdhury14].
Improving our understanding of the relationship between nutrition, disease and mortality is fundamental to improving public health response during emergency situations such as armed conflicts and famines. Our results suggest that vaccination efforts should not only be intensified during famines, but also for a few years following a famine in order to reach children who were in-utero, or born, during periods of food shortages. To fully examine the effect of food shortages on measles CFR will require cohort studies that track nutrition status over time. Exploring optimal vaccination strategies during emergency situations, where resources are constrained, is another avenue for future research. Future research should also explore the indirect longer-term adverse effects of measles immunosuppression on mortality from other diseases [Reference Mina, Metcalf, de Swart, Osterhaus and Grenfell33], among cohorts that experience severe malnutrition early in life. Finally, the link between mother's nutritional status and the prevalence of maternal antibody to measles virus in infants is not well established [Reference Caceres, Strebel and Sutter34]. Examining this is beyond the scope of our data, but is an important open question for future research: if maternal malnutrition reduces the transfer of protective measles antibodies to children, it could be another potential amplifier of measles mortality following a famine.
SUPPLEMENTARY MATERIAL
The supplementary material for this article can be found at https://doi.org/10.1017/S0950268817002564
ACKNOWLEDGEMENT
This work was funded by the Eunice Kennedy Shriver National Institute of Child Health and Human Development (A.S.M., grant number 5R24HD047879), the National Institutes of Health training grant (A.S.M., grant number 5T32HD007163), the Bill and Melinda Gates Foundation and a Wellcome Trust Sustaining Health grant (C.J.E.M., grant number 106866/Z/15/Z). The data for this work was collected by ICDDR,B with support from the governments of Bangladesh, Canada, Sweden and the UK.
DECLARATION OF INTEREST
None.



