


1. Introduction
Previous research has found that social networks are generally resilient to external attacks, node knockouts, and exogenous shocks (Newman & Dale, Reference Newman and Dale2005; Phan & Airoldi, Reference Phan and Airoldi2015; Fernández-Martínez et al., Reference Fernández-Martínez, Andina-Díaz, Fernández-Peña, García-López, Fulgueiras-Carril and Liébana-Presa2017). The resiliency of networked groups against external attacks is driven in part by dynamic network formation, or the ability of agents’ to rewire their relational ties (Phan & Airoldi, Reference Phan and Airoldi2015; Fernández-Martínez et al., Reference Fernández-Martínez, Andina-Díaz, Fernández-Peña, García-López, Fulgueiras-Carril and Liébana-Presa2017; Almaatouq et al. Reference Almaatouq, Noriega-Campero, Alotaibi, Krafft, Moussaid and Pentland2020a). Dynamic network formation allows nodes to adjust their local connections after a node knockout. By forming new ties, the remaining agents can help take on the knocked-out node’s role in the group network. At the same time, topological features of networks can help prevent external attacks from disrupting the entire system by localizing the adverse effects of the exogenous shocks (Ash & Newth, Reference Ash and Newth2007). Together, these features help prevent disruptions in a network from leading to the system’s collapse.
Although the processes underlying network resiliency are widely known, previous research on how networked groups respond to exogenous shocks has mostly relied on observational analyses or computational models. Both of these approaches have provided useful insights but also pose analytic limitations. First, with some exceptions (e.g., Phan & Airoldi, Reference Phan and Airoldi2015; Stuart, Reference Stuart2017), observational analyses of how networked groups respond to exogenous shocks often do not have the pre- and post-network structure of the groups (e.g. Corbo et al., Reference Corbo, Corrado and Ferriani2016; Jordan, Reference Jordan2014; Scatà et al., Reference Scatà, Di Stefano, La Corte and Liò2018; Milton & Price, Reference Milton and Price2020) or only analyze changes in a single social network (Flack et al., Reference Flack, Girvan, De, Frans and Krakauer2006; Azoulay et al., Reference Azoulay, Zivin, Joshua and Wang2010). In turn, these studies lack causal inference leverage or may not generalize to other populations. Second, computational models necessarily make assumptions about agents’ actions and network structures (e.g. Doerr & Hernandez, Reference Doerr and Hernandez2010; Keller et al., Reference Keller, Desouza and Lin2010; Pumpuni-Lenss et al., Reference Pumpuni-Lenss, Blackburn and Garstenauer2017; Duxbury & Haynie, Reference Duxbury and Haynie2019; Twumasi-Boakye & Sobanjo, Reference Twumasi-Boakye and Sobanjo2019). These assumptions could presumably be mistaken in ways that produce incomplete or incorrect conclusions.Footnote 1
Given these uncertainties, and the relative importance of understanding how social networks respond to exogenous shocks, it would be beneficial to assess how real networked teams respond to node knockouts of central members in an experimental setting. Specifically, how do node knockouts affect performance, and how do the remaining members adapt to knockouts to offset the lost contributions of their removed teammate? We address this research gap by reporting the results of an experiment in which we impose exogenous shocks on small teams of real-world friends in the form of an unexpected removal of an actor from the team’s social network while the team is engaged in a game. Through this design, we causally identify the effects of individuals on their team and fellow team members, how the remaining teammates respond to exogenous shocks, and the effect of exogenous shocks on team performance. In so doing, we provide clarity on how real social networks adapt to node knockouts.
To assess the effect of node knockouts on networked teams, we have preexisting groups play a simple coordination game against a simulated opponent across ten rounds. During the experiment, teams can only communicate over preexisting social ties, which allows us to measure which individuals are the most central to their team network. In the treatment groups, the player with the highest degree centrality (i.e., the most relational ties) is removed after the fifth round, while in the control groups the team simply plays 10 rounds against the simulated opponent. The changes at the team and individual level allow us to precisely quantify how networked teams respond to node knockouts of central members.
Our research is driven by two hypotheses: (a) the loss of internal connectivity brought on by node knockouts will negatively impact the performances of teams and (b) teammates will adjust their behaviors to compensate for, but not fully offset, the lost contributions of the knocked out teammate, with the remaining central players becoming more central and the peripheral players becoming more peripheral within their team. The first hypothesis is based on a substantial literature that finds that the knockout of central and highly connected nodes can disrupt networked systems by reducing the system’s overall connectivity (e.g., Barabási & Bonabeau, Reference Barabási and Bonabeau2003; Flack et al., Reference Flack, Girvan, De, Frans and Krakauer2006; Azoulay et al., Reference Azoulay, Zivin, Joshua and Wang2010). We expect node knockouts of central players to negatively influence team performance because it will reduce the remaining teammates’ abilities to coordinate their behaviors and disseminate information. In the experiment, team coordination and information sharing are operationalized using two dependent variables, changes in the team record, and normalized volume of messages sent.Footnote 2 Due to the loss of a central teammate, we expect teams that experience a knockout to have a worse team record and send fewer messages within their team than the control teams.
For our second hypothesis, we expect players that shared ties with the knocked-out participant to become more integral to their team to redress the lost contributions of their knocked-out teammate. However, these players will not fully offset the lost contributions of the knocked-out teammate, which will lead to the remaining peripheral players becoming more isolated within the team. We operationalize changes in the remaining teammates messaging contributions by evaluating players’ degree, betweenness, and eigenvector centrality within their teams’ messaging networks after the knockout. These network centrality measures help us infer the influence of a node within their team’s messaging network, with increases in a participant’s message network centrality after a node knockout indicating that they have taken on a greater and more influential role within their team.
In total, we find some supporting evidence for our hypotheses. In particular, we find that the node knockout treatment reduces the normalized volume of messages sent at the team level but increases the centrality of the remaining players that shared ties to the knocked-out teammate in their teams’ messaging networks. Put another way, at the team level, node knockouts decrease overall information sharing within teams. At the individual level, influential members become more influential, while peripheral members become more isolated within their team. In addition, we find a negative effect of node knockouts on teams’ records. Although the effect is not statistically significant at the 0.05 level. The null effect suggests that exogenous shocks may not affect team coordination. However, the present null finding of the knockout on team performance may not generalize to when teams are engaging in more complex and difficult tasks.
2. Prior research and hypothesis development
The importance of understanding how to design efficient and effective teams has led to an expansive literature on how network structures influence team and group dynamics, including scholarship on how social networks affect team and group performance (Bavelas, Reference Bavelas1950; Guetzkow & Simon, Reference Guetzkow and Simon1955; Mulder, Reference Mulder1960; Landers & Lüschen, Reference Landers and Lüschen1974; Carron & Chelladurai, Reference Carron and Chelladurai1981; Evans & Dion, Reference Evans and Dion1991; Mullen & Copper, Reference Mullen and Copper1994; Beal et al., Reference Beal, Cohen, Burke and McLendon2003; Kearns et al., Reference Kearns, Suri and Montfort2006; Judd et al., Reference Judd, Kearns and Vorobeychik2010; Shore et al., Reference Shore, Bernstein and Lazer2015; Becker et al., Reference Becker, Brackbill and Centola2017; Argote et al., Reference Argote, Aven and Kush2018) and their resiliency to exogenous shocks (Najjar & Gaudiot, Reference Najjar and Gaudiot1990; Flack et al., Reference Flack, Girvan, De, Frans and Krakauer2006; Azoulay et al., Reference Azoulay, Zivin, Joshua and Wang2010; Sterbenz et al., Reference Sterbenz, Cetinkaya, Hameed, Jabbar and Rohrer2011; Freeman, Reference Freeman2014; Phillips, Reference Phillips2015; Zhang et al., Reference Zhang, Miller-Hooks and Denny2015; Dong et al., Reference Dong, Fan, Shekhtman, Shai, Du, Tian and Havlin2018; Liu et al., Reference Liu, Li, Ma, Szymanski, Stanley and Gao2020; Wang & Edgerton, Reference Wang and Edgerton2022). In this section, we briefly discuss the extant research on how social networks affect individuals and the performance of groups, but prioritize a discussion of the network resiliency literature, as the present study uses an experimental design to assess how social networks respond and adapt to node knockouts.
2.1 Network structure and performance
Leavitt (Reference Leavitt1951) analyzes how communication patterns influence the behaviors of individuals. Through the analysis of 100 students, Leavitt finds that variation in group communication affects the satisfaction of group members, emergence of leaders, and organizational structure of groups. In particular, students that were central to their group’s communication structure reported greater satisfaction and were more likely to become leaders. Scholars have expanded on this research to analyze other ways that social networks shape the behaviors and actions of individuals, including how social ties affect political preferences (e.g., Poteat & Spanierman, Reference Poteat and Spanierman2010; Campbell, Reference Campbell2013; Minozzi et al., Reference Minozzi, Song, Lazer, Neblo and Ognyanova2020), health outcomes (e.g., Christakis & Fowler, Reference Christakis and Fowler2007, Reference Christakis and Fowler2013), employment (Calvo-Armengol & Jackson, Reference Calvo-Armengol and Jackson2004; Ziersch & Arthurson, Reference Ziersch and Arthurson2005), and cooperation and conflict (e.g., Fowler & Christakis, Reference Fowler and Christakis2010; Larson & Lewis, Reference Larson and Lewis2017; Larson, Reference Larson2021).
In addition to research on how social networks influence the behaviors and actions of individuals, scholars have also assessed how social networks affect team-level outcomes, such as the ability of networked teams to collectively make a decision (Marsden, Reference Marsden1981; Shore et al., Reference Shore, Bernstein and Lazer2015; Noriega-Campero et al., Reference Noriega-Campero, Almaatouq, Krafft, Alotaibi, Moussaid and Pentland2018; Almaatouq et al. Reference Almaatouq, Yin and Watts2020b), complete a task (Leavitt, Reference Leavitt1951; Guetzkow & Simon, Reference Guetzkow and Simon1955; Kearns et al., Reference Kearns, Suri and Montfort2006; Judd et al., Reference Judd, Kearns and Vorobeychik2010), or internally disseminate information (Cowan & Jonard, Reference Cowan and Jonard2004; Luarn et al., Reference Luarn, Yang and Chiu2014; Becker et al., Reference Becker, Brackbill and Centola2017; Bernstein et al., Reference Bernstein, Shore and Lazer2018). Grund (Reference Grund2012) analyzes how the network structure of soccer teams affects their performance. He finds that teams with high intensity and low centralization generally perform better than other teams.
Other researchers have similarly found that teams with low centralization outperform highly centralized teams (e.g., Urban et al., Reference Urban, Bowers, Monday, Morgan and Ben1995; Schraagen et al., Reference Schraagen, Veld and De Koning2010); however, this finding may be contingent on the type, or difficulty, of task the team is trying to complete (Cox et al., Reference Cox, Pearce and Perry2003; D’Innocenzo et al., Reference D’Innocenzo, Mathieu and Kukenberger2016; Almaatouq et al. Reference Almaatouq, Yin and Watts2020b). In an experiment, Argote et al. (Reference Argote, Aven and Kush2018) exogenize network structures on small teams to assess how it affects the collective memory, or expertise, of teammates. They find that centralized teams are able to coordinate more efficiently than decentralized teams when there is a high rate of turnover of team members, while decentralized teams outperform centralized teams when the turnover rate is low.
Aside from Argote et al. (Reference Argote, Aven and Kush2018), other researchers have used experiments to understand how social networks influence individuals and teams (e.g., Mason et al., Reference Mason, Jones and Goldstone2008; Centola, Reference Centola2010; Mason & Watts, Reference Mason and Watts2011; Rand et al., Reference Rand, Arbesman and Christakis2011; Shirado et al., Reference Shirado, Fu, Fowler and Christakis2013; Melamed et al., Reference Melamed, Harrell and Simpson2018). Network experiments are especially flexible because they allow for social networks to be exogenously imposed on participants. This helps address potential endogeneity issues related to network topology and individual preferences and behaviors. Namely, the attributes and characteristics of individuals affect their network structure and network structure affects the attributes and characteristics of individuals. At the same time, exogenously imposing network structures on experiment participants reduces the level of realism because social networks outside of experimental settings reflect individual preferences.
2.2 Network structure and resiliency
Researchers have found that network structures across a variety of systems are resilient to exogenous shocks, external attacks, and local failures, including biological systems (Janssen et al., Reference Janssen, Bodin, Anderies, Elmqvist, Ernstson, McAllister and Ryan2006; Baggio et al., Reference Baggio, BurnSilver, Arenas, Magdanz, Kofinas and De Domenico2016; Donohue et al., Reference Donohue, Hillebrand, Montoya, Petchey, Pimm, Fowler and Adler2016), social relations (Newman & Dale, Reference Newman and Dale2005; Phan & Airoldi, Reference Phan and Airoldi2015; Fernández-Martínez et al., Reference Fernández-Martínez, Andina-Díaz, Fernández-Peña, García-López, Fulgueiras-Carril and Liébana-Presa2017), public utilities (Chen & Hero, Reference Chen and Hero2014; Dong et al., Reference Dong, Fan, Shekhtman, Shai, Du, Tian and Havlin2018), and transportation networks (Zhang et al., Reference Zhang, Miller-Hooks and Denny2015; Do & Jung, Reference Do and Jung2018), among others (Wang & Edgerton, Reference Wang and Edgerton2022). Although external and internal stressors may disrupt network systems, these stressors rarely lead to a collapse of the system. This is due in part to topological features of networked systems, with scholars finding that networks with high connectivity (Sterbenz et al., Reference Sterbenz, Hutchison, Çetinkaya, Jabbar, Rohrer, Schöller and Smith2014; Alenazi & Sterbenz, Reference Alenazi and Sterbenz2015), greater modularity (Dong et al., Reference Dong, Fan, Shekhtman, Shai, Du, Tian and Havlin2018), or scale-free degree distributions (Albert et al., Reference Albert, Jeong and Barabási2000; Wang et al., Reference Wang, Tang, Guo and Xiu2006) are highly resilient.
In addition to network topology, if a networked system has nodes that can form new relational ties it can also make the system more robust against node knockouts (Lusseau, Reference Lusseau2003). This is because the remaining nodes can form new ties to adjust to the lost connectivity caused by node knockouts or other exogenous shocks. Azadegan & Dooley (Reference Azadegan and Dooley2021) demonstrate how self-organization can make networked systems more robust to exogenous shocks by analyzing how supply chain networks responded to disruptions during the COVID-19 pandemic. They find that short and intermediate-term collaboration at the meso-level between suppliers helped companies respond to disruptions in supplier chains caused by the pandemic.
Although complex networks are often highly resilient, researchers have found that networked systems can be disrupted by coordinated knockouts of central and highly connected nodes (Gallos et al., Reference Gallos, Cohen, Argyrakis, Bunde and Havlin2005; De Domenico et al., Reference De Domenico, Solé-Ribalta, Gómez and Arenas2014; Duan et al., Reference Duan, Lv, Si, Wang, Li, Gao and Boccaletti2019; Wang & Edgerton, Reference Wang and Edgerton2022). Barabási & Bonabeau (Reference Barabási and Bonabeau2003) find that scale-free networks are especially vulnerable to node knockouts because relatively few nodes in the network account for a high proportion of the total ties within the networked system. Similarly, Flack et al. (Reference Flack, De, Frans and Krakauer2005, Reference Flack, Girvan, De, Frans and Krakauer2006) assess how node knockouts affect primate behavior. They find that removing several central adult male pigtailed macaque disrupt the play and grooming social network among the remaining pigtailed macaques.
2.3 Argument
Previous research on social networks suggests that network structure affects individuals, team performance, and resiliency. In this section, we discuss our expectations for how exogenous shocks influence teams and their members. Specifically, we hypothesize that: (a) the loss of internal connectivity brought on by node knockouts will negatively impact the performances of teams and (b) teammates will adjust their behaviors to compensate for, but not fully offset, the lost contributions of the knocked out teammate, with the remaining central players becoming more central and the peripheral players becoming more peripheral within their team. Together, the present analysis sheds light on how networked systems respond to exogenous shocks at the micro and macro levels.
Our first hypothesis is that the exogenous knockout of central teammates will reduce teams’ internal connectivity, which will hurt their performance. This hypothesis is drawn from extant studies of network disruption, including research on the effect of knockouts on professional athletes (Stuart, Reference Stuart2017), simulated agents (Carley et al., Reference Carley, Lee and Krackhardt2002; Carley, Reference Carley2006), cells (Galou et al., Reference Galou, Colucci-Guyon, Ensergueix, Ridet, Ribotta, Privat and Dupouey1996), and genes from a network (Nabi-Abdolyousefi & Mesbahi, Reference Nabi-Abdolyousefi and Mesbahi2012; Deutscher et al., Reference Deutscher, Meilijson, Kupiec and Ruppin2006). Generally, researchers have found that knockouts of central or highly connected nodes hurt the performance of the team and remaining members. Node knockouts reduce the performance of teams because of lost internal connectivity. In the context of our experiment, we hypothesize that the exogenous removal of the most central teammate will reduce a team’s ability to internally coordinate and share information. We use two dependent variables to assess these claims, changes in the: (a) team record and (b) normalized volume of messages sent. These variables were selected because they help capture how effectively the team coordinates their behaviors and internally disseminates information.
Our second hypothesis is that the remaining central players will become more influential within their team to adjust for, but not fully offset, the lost contributions of the knocked-out central teammate. This hypothesis is drawn from existing studies on changes in the characteristics of individuals within a team or group after an exogenous shock (Flack et al., Reference Flack, De, Frans and Krakauer2005, Reference Flack, Girvan, De, Frans and Krakauer2006; Azoulay et al., Reference Azoulay, Zivin, Joshua and Wang2010; Phillips, Reference Phillips2015; Jordan, Reference Jordan2014; Freeman, Reference Freeman2014). Researchers have generally found that networked systems adapt to node knockouts (e.g., Stuart, Reference Stuart2017; Azadegan & Dooley, Reference Azadegan and Dooley2021), but may not fully redress or offset the loss in internal connectivity caused by the removal of central and highly connected nodes. Further, in some cases node knockouts can cause networked systems and their members to retrench and withdraw so the attack can be locally absorbed within the system (Ash & Newth, Reference Ash and Newth2007). In the context of our experiment, we expect the remaining treated central participants that rewire their network to take on the lost contributions of their teammate by becoming more influential within their team’s messaging network after the knockout, while peripheral players will become more peripheral. We operationalize the influence of the remaining teammates as changes in their degree, betweenness, and eigenvector centrality for the weighted message frequency network. These centrality measures were selected because they indicate how important or influential a node is within the network (Abbasi et al., Reference Abbasi, Wigand and Hossain2014; Kermani et al., Reference Kermani, Badiee, Aliahmadi, Ghazanfari and Kalantari2016; Subbian et al., Reference Subbian, Sharma, Wen and Srivastava2014).
The present article contributes to the extant literature in two significant ways. First, we causally identify how individuals and teams simultaneously adjust to node knockouts. In so doing, we demonstrate the critical role of central, but secondary, teammates after a knockout by showing how they adjust their behaviors to compensate for the lost contributions of their teammate. Relatedly, we also demonstrate that node knockouts reduce internal connectivity by identifying a clear and robust negative effect of node knockouts on the normalized volume of messages sent at the team level. Together, this suggests that node knockouts increase the connectivity of some teammates but decrease the overall connectivity within teams. Namely, central members become more central after the knockout, while peripheral members become more peripheral within their teams. Second, we find that node knockouts have a null effect on team records, which suggests that knockouts, and the subsequent loss in internal connectivity, may not affect team performance.
3. Research design
Although the network structure underlying a team profoundly shapes the team and its members, it is tremendously challenging to quantify the effect of network structures on an outcome of interest. The difficulty in measuring the effect of social networks on an outcome of interest is driven in part by (a) the large number of social structures groups may possess; (b) the attributes and behaviors of individuals affect the network structure of groups; (c) a group’s network structure affects the attributes and behaviors of individuals; (d) social networks respond and adapt to external stimuli; and (e) issues (a)–(d) all interact with each other.
To address these issues, we develop an experiment that exogenously imposes node knockouts on the social networks of real groups. Specifically, we have preexisting networked groups play a simple coordination game, with treatment teams experiencing a node knockout halfway through the game. The experimental design draws inspiration from replicating the underlying processes and dynamics of teams that are vulnerable to node knockouts, such as sports teams that may experience injuries or penalties (e.g., soccer players that receive a red card and are removed from the game), military units that may have members become unexpectedly incapacitated, or criminal organizations that may be disrupted or dismantled by law enforcement (e.g., terrorist, rebel, or organized crime groups). The present experimental design is conceptually similar to existing experiments on collective memory (Argote et al., Reference Argote, Aven and Kush2018) and interventions into animal packs (Flack et al., Reference Flack, De, Frans and Krakauer2005, Reference Flack, Girvan, De, Frans and Krakauer2006), as these studies also remove nodes during their analysis. However, our design offers a distinct contribution in that we use real teams’ preexisting social network structure during the experiment.
3.1 Game design
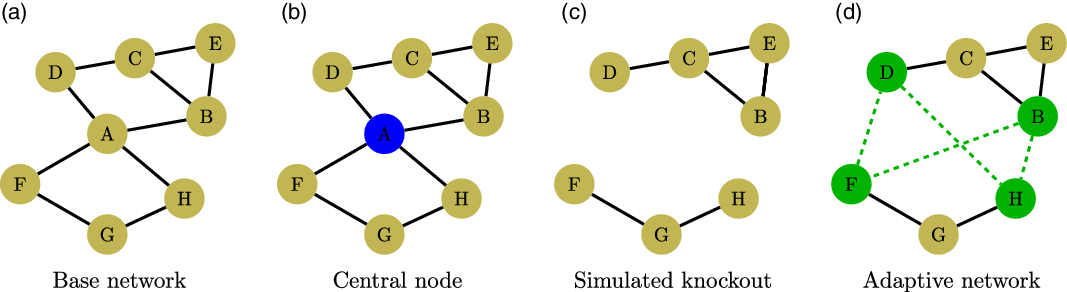
Figure 1 shows an illustration of the experimental design. In cell (a), we see the base social network. The ties between nodes in cell (a) indicate a preexisting relationship. In the experiment, teammates could only interact through their preexisting network. In the control trials, teams play 10 rounds with the same social network. Cells (b–d) show how the treatment trials differ from the control trials. In cell (b), the blue node, teammate A, has the most ties within their network and, therefore, will be removed as the node knockout treatment halfway through the experiment. In cell (c), we see the simulated knockout. Teammate A is removed from the team social network and its ties to nodes B, D, F, and H are severed. Last, in cell (d), we see the adaptive network. The green node teammates B, D, F, and H who shared ties to the knocked out teammate A can form new relational ties (green dashed lines). In the adaptive network, teammates are now able to interact through the newly formed ties.
The networks above are an illustration of the study design. In cell (a), we see the initial communication network of the team. The teams play ten rounds of a simple coordination game against a simulated opponent in the control trials. Cells (b–d) illustrate the experimental treatment trials. In cell (b), we see that the most central blue node in the communication network, teammate A, is selected for the knockout. In cell (c), teammate A is removed and all ties to teammate A are severed. The team has to develop a new communication strategy following the knockout. Last, in cell (d), we see the rewired network. The treated experiment participants form new messaging ties (the green nodes and dashed lines) with the remaining participants. The knockout enables us to measure both: (a) how the knockout affects the team and (b) how the remaining experiment participants adapt.
All teams in the treatment trials have three social networks: (a) the pre-knockout communication network, (b) the post-knockout communication network, and (c) the communication frequency networks; while the control trials have two social networks: (a) the communication network and (b) the communication frequency network. Figure 2a displays an example of the control, pre-knockout, and post-knockout communication networks. The pre-knockout, post-knockout, and control trial communication networks are all undirected message windows that teammates can dyadically communicate over. These communication ties were determined at the start of the experiment based on each team’s preexisting social ties. In the example Figure 2a, we can see that teammate A has four ties in their communication network and are able to message back and forth with players B, D, F, and H.
Examples of the communication and communication frequency network. In cell (a), we see the undirected messaging window network. This network is a reflection of the team’s preexisting social network. In cell (b), we can see the communication frequency network. These networks are directed and weighted by the number of messages sent over the communication network each round.
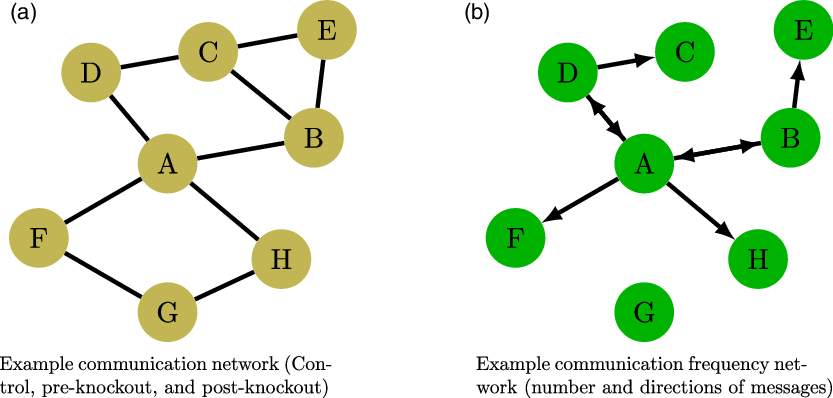
The communication frequency network is a weighted and directed network for the number of messages sent between players. The communication networks constrain the communication frequency networks. Figure 2b, shows an example communication frequency network based on the example communication network in Figure 2a. In this example, we can see that teammate A has sent and received messages to teammates B and D over their messaging windows, while only sending messages to teammates F and H. In this example, teammate G shares message window ties with nodes F and H but did not send or receive any messages with those teammates.
The differences between the communication frequency networks under the pre- and post-knockout communication networks reflect the adjusted behavior of both the team and its remaining members. Thus, we quantify the contributions of the experiment participants to helping develop their team strategy by using the communication frequency network because the centrality of participants changes each round depending on how the participants communicate with each other. Through this experimental design, we are able to measure how teams adapt following an exogenous shock and the individual contributions of both the knocked-out teammate and the remaining participants.
To assess how groups and individuals interact and coordinate their behaviors, the teams played a generalized version of the Colonel Blotto game online for 10 rounds against a simulated opponent. In the original conceptualization of the Colonel Blotto game, two participants have $n$
troops which they simultaneously divided between
$n$
troops which they simultaneously divided between $k$
battlefields. The player with the most troops on a battlefield wins the battlefield, and whoever wins more battlefields wins the game. The Colonel Blotto game is commonly used as an example of a mixed strategy game because the outcome is contingent on an opponent’s strategy.
$k$
battlefields. The player with the most troops on a battlefield wins the battlefield, and whoever wins more battlefields wins the game. The Colonel Blotto game is commonly used as an example of a mixed strategy game because the outcome is contingent on an opponent’s strategy.
During the experiment, the simulated opponent randomly places approximately 60%, 40%, and any remaining troops across the three battlefields.Footnote 3 This placement strategy falls within the optimal strategy range for the Colonel Blotto game, but the expected outcome of a round is contingent on the team’s strategy. We use a simulated opponent as opposed to a second team of individuals for two reasons. First, the simulated opponent uses an optimal strategy which allows us to better evaluate the experimental team’s strategy. For example, if we had two human teams competing against each other, both teams could use poor strategies at the same time but perform well in the game because their performances are correlated (Roberson, Reference Roberson2006; Hart, Reference Hart2008). Second, a simulated opponent helps us better estimate the impact of the exogenous shock on team performance because the simulated opponent is not affected by the exogenous shock.
Figure 3 displays an example of the experiment platform. At the start of the experiment, eight participants controlled 20 troops each (160 total per team) which they had to divide between three battlefields (bottom of Figure 3). To identify the team’s real-life social network, each participant was asked to rank the judgment of their teammates in a pre-experiment survey. Participants could only communicate through messaging windows with the top three teammates whose judgment they most respected and any player who ranked them in the top three (i.e., the pre-knockout and control communication network). This ensured that each participant had at least three and at most seven ties. This process served three purposes. First, because messaging window ties are determined by players selecting whose judgment they most respect, we expect for the leaders in the group to have the most messaging ties. This increased the level of realism because the team communication network mirrors the preexisting participants’ real-life social network. Second, the restricted communication network enabled us to precisely examine the flow of information through the network. Third, the restricted communication network made it more challenging for the teams to develop and coordinate their strategy during an experimental round.
Example gameplay screen for experiment participants. Each player is shown the round and their record in the upper left corner. On the left side, players can communicate with the teammates they are connected to. In this example, player Alex can communicate with their teammates: Claire, Peter, and Nadine. Next to the player message windows, each participant can see a timer that counts down the number of seconds left in each round. In this example, the player has 24 seconds left to commit their troops. At the bottom of the screen, the player can see how many troops they have left to distribute between battlefields BF1–BF3. The players then commit their troops by clicking the “commit” button.
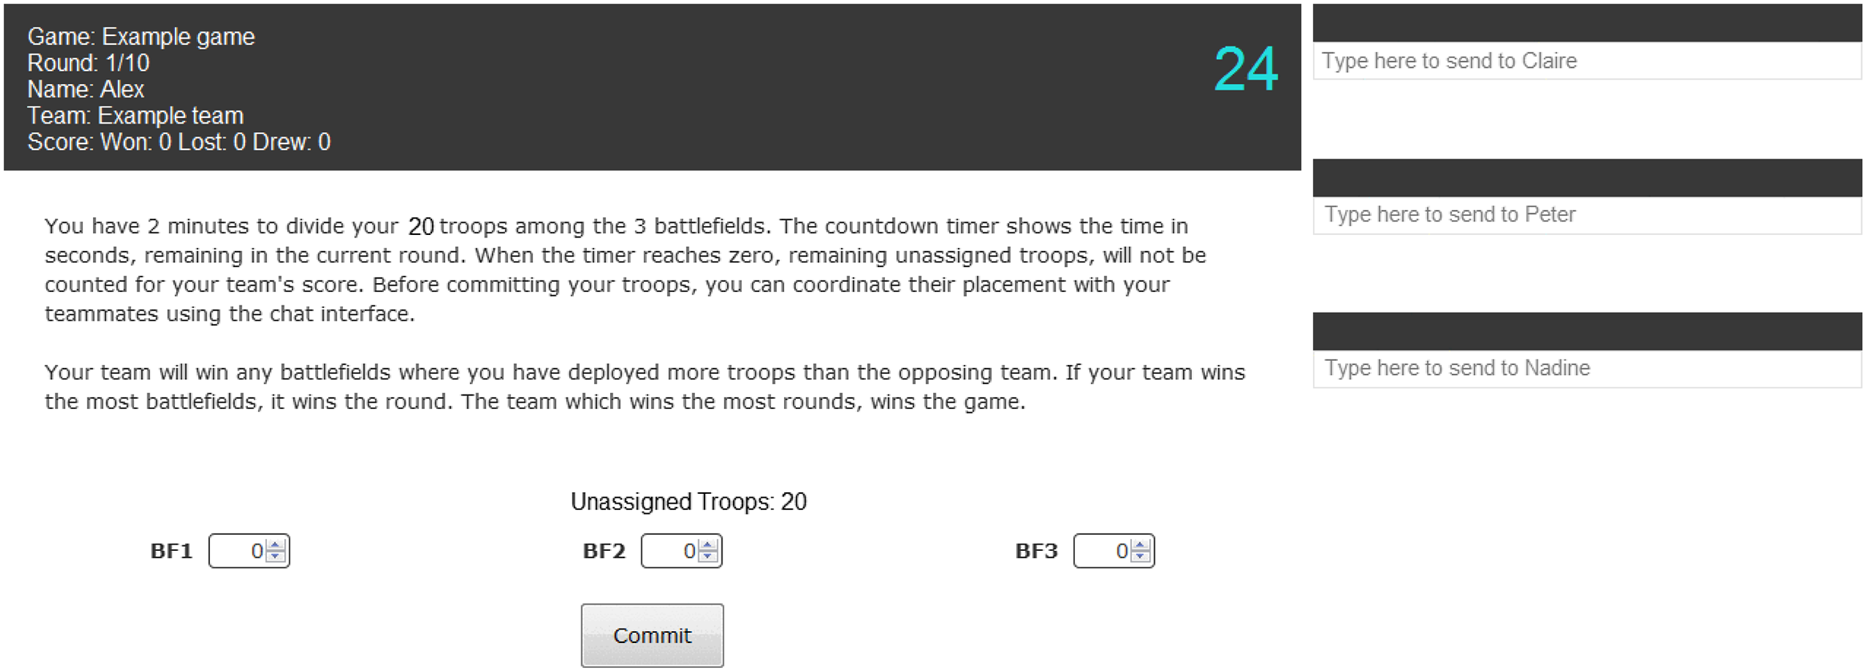
On the right side of Figure 3, we can see an example of an experiment participant’s messaging window ties. The number and directionality of the messages sent between players is the communication frequency network. Each experimental round lasted 1 minute and 45 seconds (center right of Figure 3). Following each round, teams had 15 seconds to see where their team placed their troops and where the simulated opponent placed its troops across the three battlefields.
In the control trials at the team level, each team played 10 rounds of the Colonel Blotto game against a simulated opponent. In the treatment trials, the player with the highest degree centrality (i.e., the player with the most communication ties) was removed from the experiment after the 5th round. After the player is removed, the team and the simulated opponent each lose 20 troops. Players who had selected the knocked-out teammate in their top three for judgment could select a new chat partner after the knockout. The new ties form the team’s post-knockout communication network. In the individual-level analysis, we consider the participants who rewired their network as the treated experiment participants.
Description of the team and individual-level recruitment data used in the analysis. Each team and individual participated in a 10 round experiment. Because we are concerned with the treatment effect of the knockout, we interact the treatment with round number (i.e., pre- or post-knockout rounds)
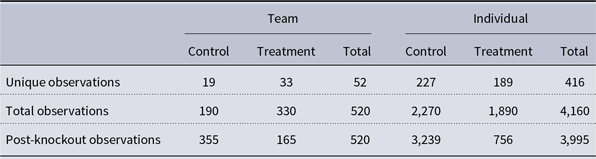
There are fewer total participants at the individual level because knocked-out teammates are dropped.
3.2 Recruitment
For the experiment, we recruited groups of participants through student clubs at a large university. Clubs were asked if they had teams of eight students who knew each other and were interested in participating in an experiment. Each club was given a $\$$
50 incentive per team of eight students and each club member was given
$\$$
50 incentive per team of eight students and each club member was given $\$$
10 for participating in the experiment. If a club had multiple teams of eight students that wanted to participate in the experiment, they were asked to self-sort into teams. This helped ensure the experimental teams were comprised of students that knew each other.
$\$$
10 for participating in the experiment. If a club had multiple teams of eight students that wanted to participate in the experiment, they were asked to self-sort into teams. This helped ensure the experimental teams were comprised of students that knew each other.
Table 1 displays the number of experiment teams and participants. In total, 52 teams comprised of 8 players were recruited for the experiment. For the analysis, we assess how teams and individuals play a game across ten rounds. Therefore, each club and individual corresponds to 10 observations. For the team-level analyses, 33 teams were part of the node knockout treatment, corresponding to 330 treatment rounds, while 19 teams were in the control group, corresponding to 190 control rounds. At the individual level, 189 participants rewired their network after the knockout and are therefore considered treated experimental units, while 227 individuals are in the control group. This corresponds to 1,890 treatment and 2,270 control observations at the individual level. Because we are concerned with how teams and players adjust to the knockout, the treatment effect is estimated as the interaction between if the game round was pre- and post-knockout (rounds 1–5 versus rounds 6–10) and if the individual or team received the treatment effect. This corresponds to five observations per treated team and individual, or 165 team-level observations of treated teams and 756 individuals during rounds 6–10.
4. Material and methods
4.1 Treatment
The experiment participants removed during the node knockout treatment trials were identified by the team’s communication network. Specifically, we remove the player with the highest degree centrality, or most messaging window ties, in their team communication network.Footnote 4 At the individual level, the teammates who had selected the knocked-out participant in the communication network are considered the treated experiment participants. These players are distinct from the other team members because they are able to rewire their communication network after the knockout.
Because we are concerned with how teams and individuals adjust their behaviors to the knockout, we assess how the node knockout affects teams and individuals in the post-knockout rounds of the experiment. This is estimated as an interaction effect between treatment and time, or how teams and individuals in the treatment trials adjusted their behaviors in the last five rounds compared to treated teams and individuals in the first five rounds and the control teams and individuals (Schustack & Sternberg, Reference Schustack and Sternberg1981; Angrist & Pischke, Reference Angrist and Pischke2008).
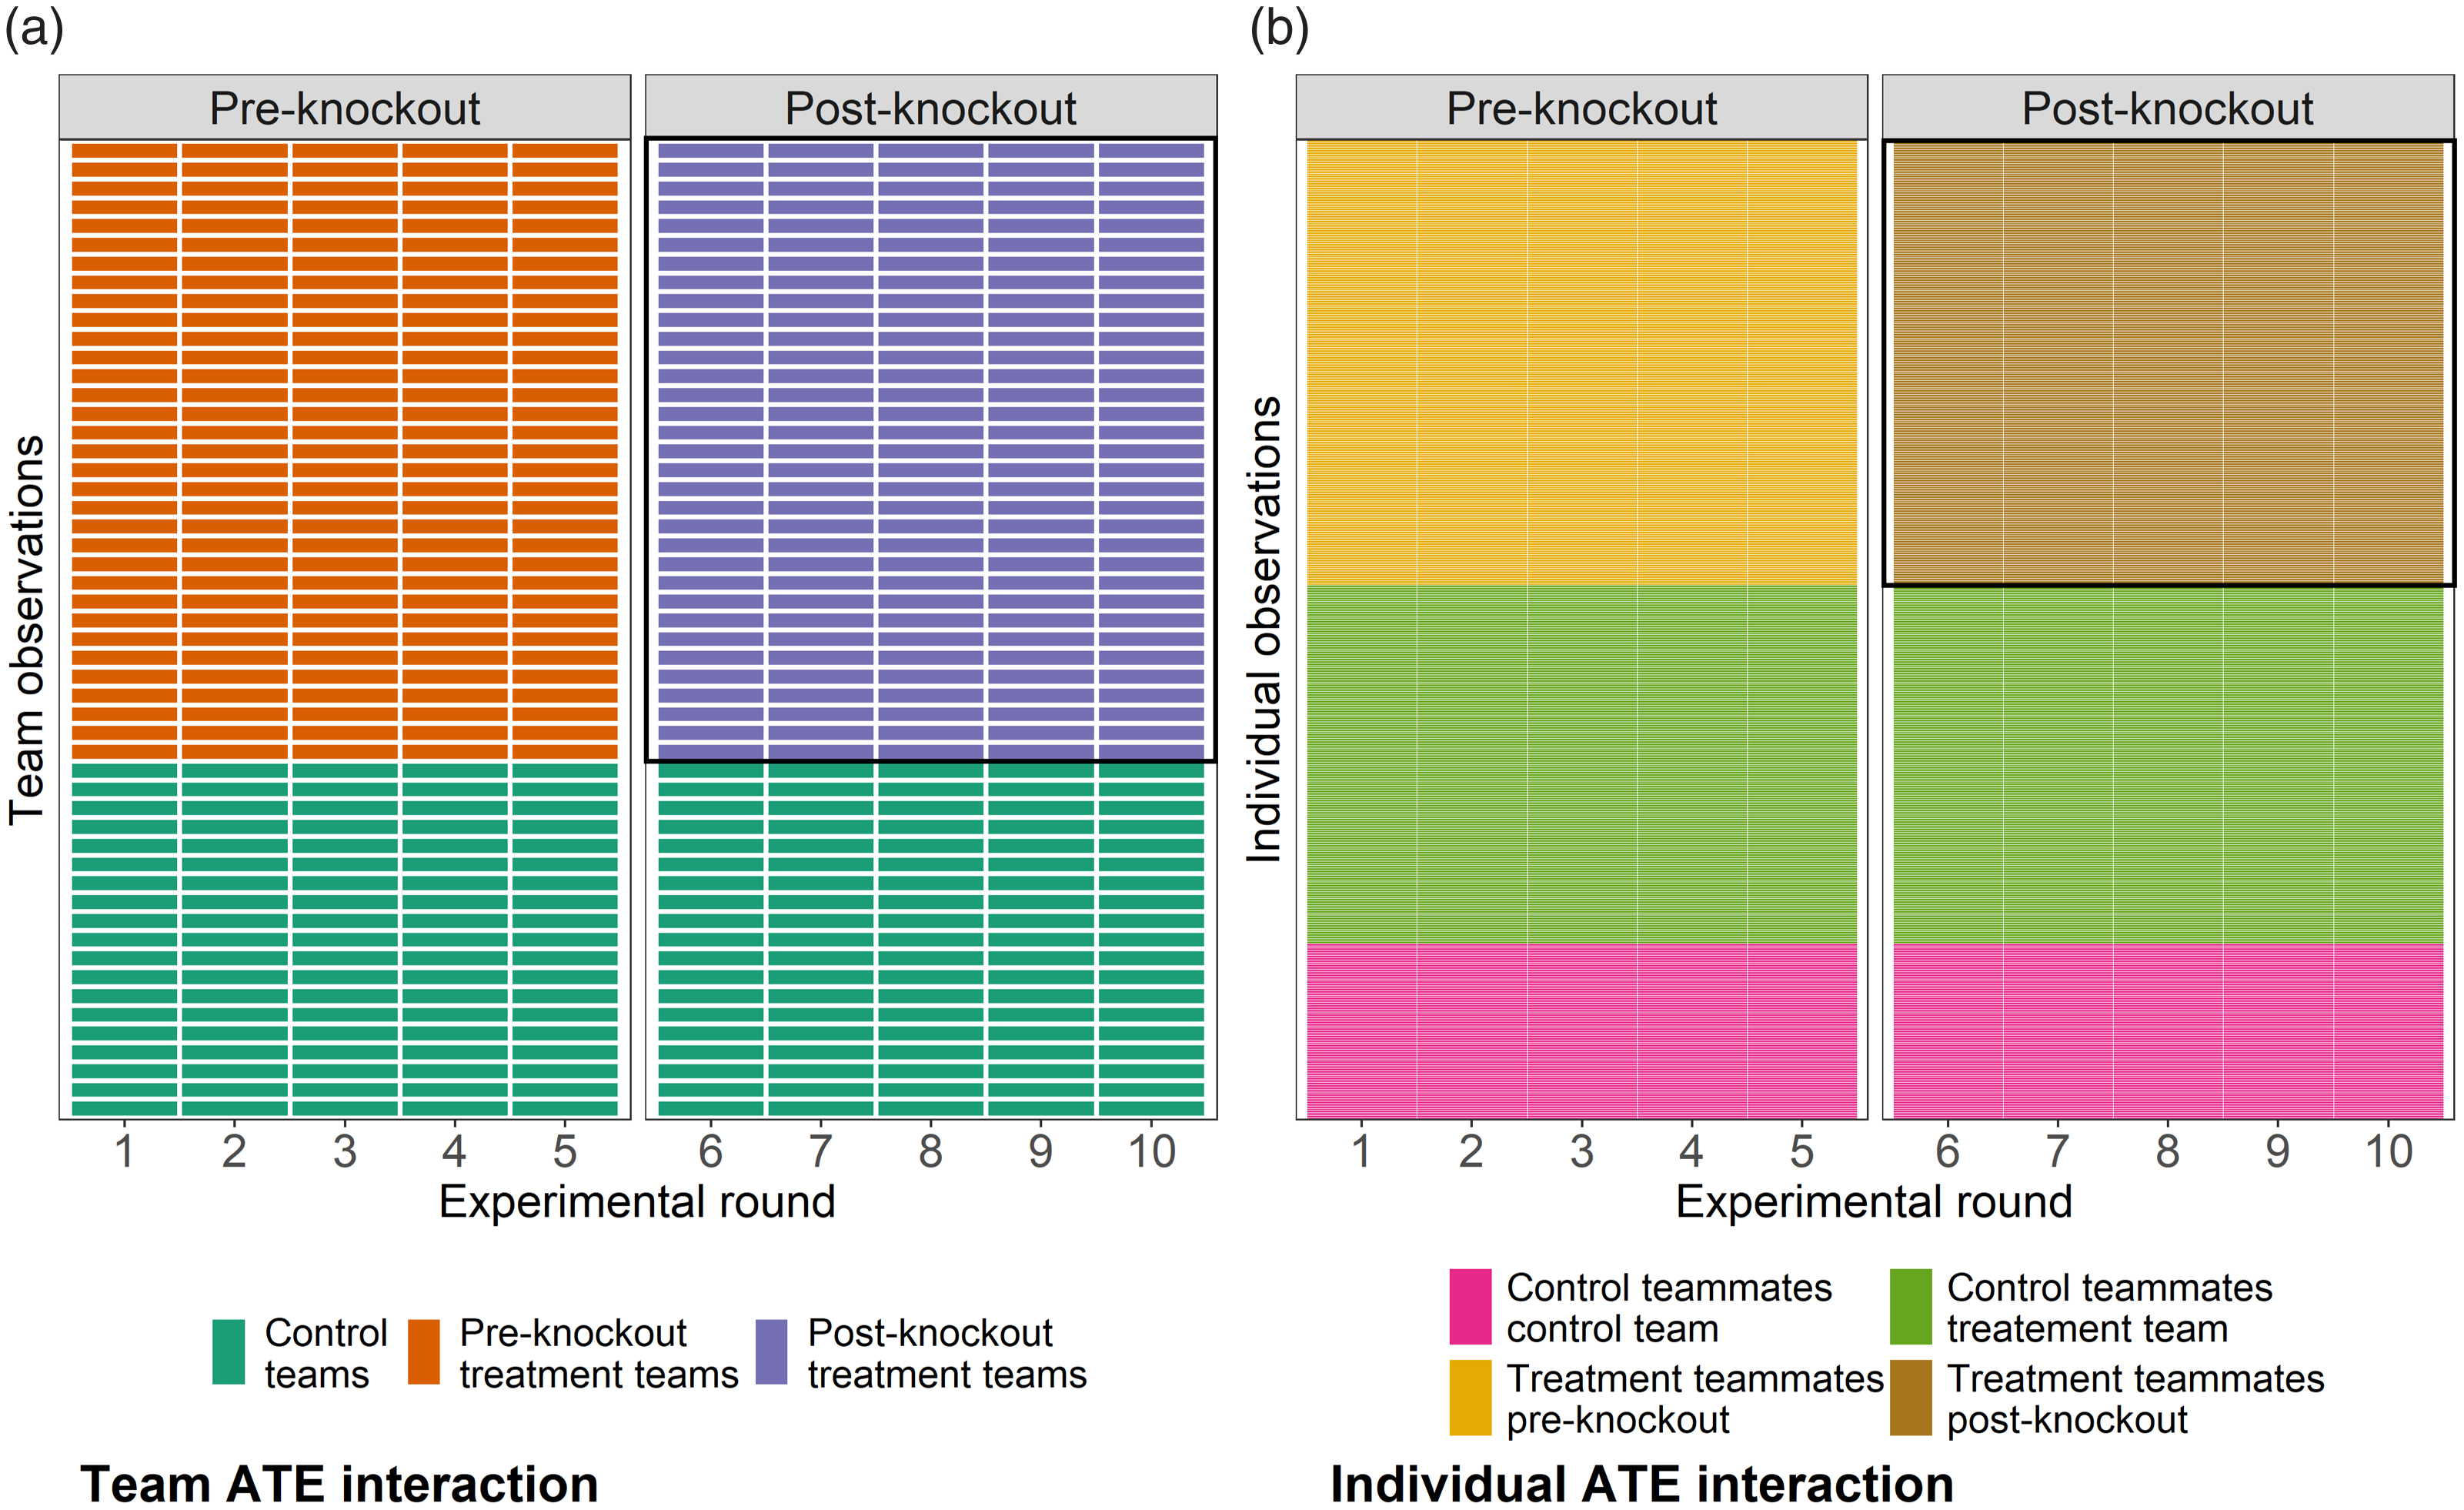
Figure 4 displays a visualization of the treatments as the interaction for teams and individuals against time. In cell (a), we can see the main effects of time and treatment (i.e., the node knockout) for teams. In the upper right corner (outlined in black), is the interaction between those main effects. This part of the graph only includes teams that experienced a knockout in the post-knockout rounds, which constitutes approximately 32% of the observations. In cell (b), we can see the main effects of time and the treatment (i.e., rewiring the network) for individuals. Likewise, in the upper right corner (outlined in black), is the interaction between those main effects. This part of the graph only includes individuals that rewire their network in the post-knockout rounds, which constitutes approximately 20% of the observations.
Waffle plot of the treatment effect of the knockout experiment as the interaction between the node knockout (team level in cell [a]) and network rewire (individual level in cell [b]) and time. Each cell corresponds to an observations, with 520 team level observations and 3,995 individual level observations.
4.2 Dependent variable
4.2.1 Team level
At the team level, we assess how exogenous shocks impact teams’ internal connectivity, or their ability to coordinate behavior and disseminate information, as these processes are associated with better team performance and outcomes (e.g., Bowers et al., Reference Bowers, Salas, Prince and Brannick1992; Entin & Serfaty, Reference Entin and Serfaty1999; Carron & Chelladurai, Reference Carron and Chelladurai1981). We operationalize team coordination and information dissemination as the teams’ records and the normalized volume of messages sent, respectively. We hypothesize that a loss in internal connectivity brought on by a node knockout will decrease the ability of teams to coordinate and internally share information which will reduce their record and lead to fewer messages sent at the team level. In addition to these dependent variables, we assess our hypotheses with alternative dependent variables in the appendix.
The team record variable is a dummy variable signifying if the team won in a given round. In Figure 5a, we see the team record proportion by treatment and time. Notably, teams perform worse in the pre-knockout rounds for both the treatment and control trials, with control teams winning 14% of their games and the treatment teams winning 21%. After the knockout, both teams show improvements in their record, with the control teams winning 35 and the treatment teams winning 41% of their games. The improvement in team records could be partially driven by improved team coordination because they better understand how to beat the simulated opponent.
Dependent variables at the team level. In cell (a) we can see the proportions of wins and losses by treatment and time. In cell (b), we can see the normalized volume of messages sent by treatment and time.
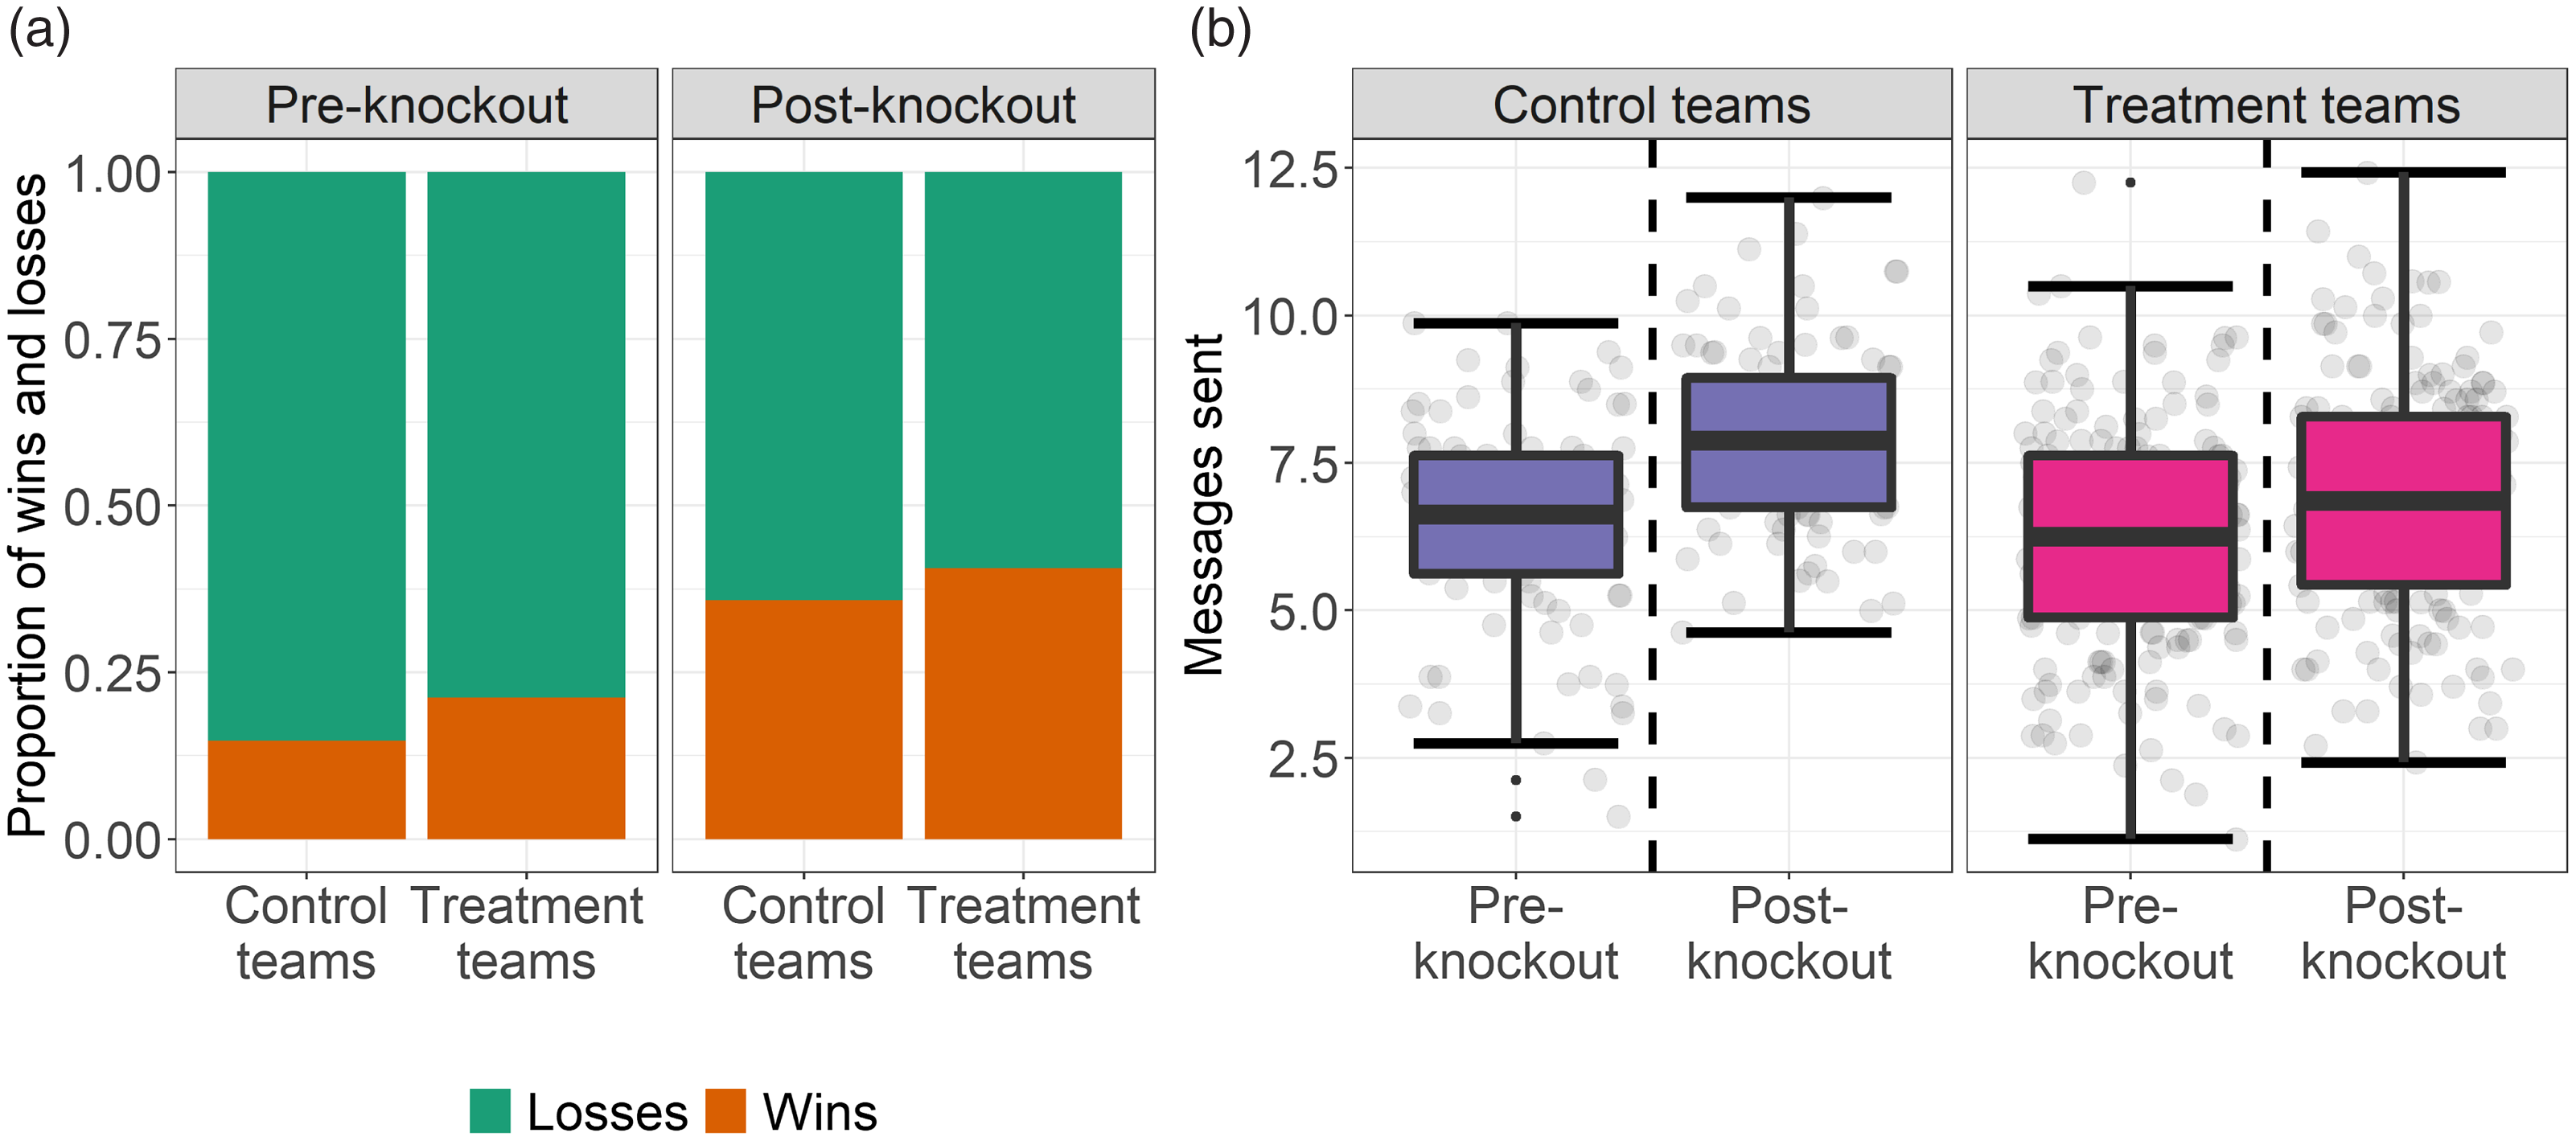
In Figure 5b, we see a boxplot of normalized volume of messages sent. The normalized volume of messages sent is derived by dividing the total messages sent by a team in a given round by the total number of players (eight players in the control trials and pre-knockout treatment trials and seven in the post-knockout treatment trials). In both the control and treated experimental teams, we see increases in the number of messages sent after the knockout, with a mean increase of 6.47–7.93 messages sent by control teams and 6.18–6.91 messages sent by treated teams. Similar to the team record, the increases in messages sent could be partially driven by improved communication because the teams better understand how to beat the simulated opponent.
4.2.2 Individual level
At the individual level, we assess how the reaming teammates adapt and try to compensate for the lost contributions of their knocked-out teammate. To do so, we analyze changes in the treated teammates’ degree, betweenness, and eigenvector centrality in their teams’ communication frequency network after the knockout compared to the control teammates. Degree centrality measures the count of messages sent and received by experiment participants in a given round. Betweenness centrality is the number of shortest paths in the communication frequency network that goes through a participant to total paths. And eigenvector centrality expands on degree centrality by weighting the number of ties a vertex has by the importance of nodes in which they are tied. These variables were selected because they are commonly associated with how influential a node is within their network, with scholars finding that central nodes enjoy greater reputations (e.g., Meo et al., Reference Meo, Musial-Gabrys, Rosaci, Sarne and Aroyo2017), higher social capital (e.g., Li et al., Reference Li, Liao and Yen2013; Zhang & Luo, Reference Zhang and Luo2017), and are more likely to be identified as leaders (e.g., Dubois & Gaffney, Reference Dubois and Gaffney2014; Risselada et al., Reference Risselada, Verhoef and Bijmolt2016; Sasaki et al., Reference Sasaki, Yamamoto, Miyao, Katsuta and Kono2017). We draw on this literature and argue that a teammate’s centrality within their team communication frequency network is indicative of their influence and importance in disseminating information for their team. We hypothesize that teammates who rewire their network will have increases in their centrality because they are compensating for the lost contributions of the knocked-out teammate. However, the loss in overall team connectivity will further reduce the centrality of more isolated members.
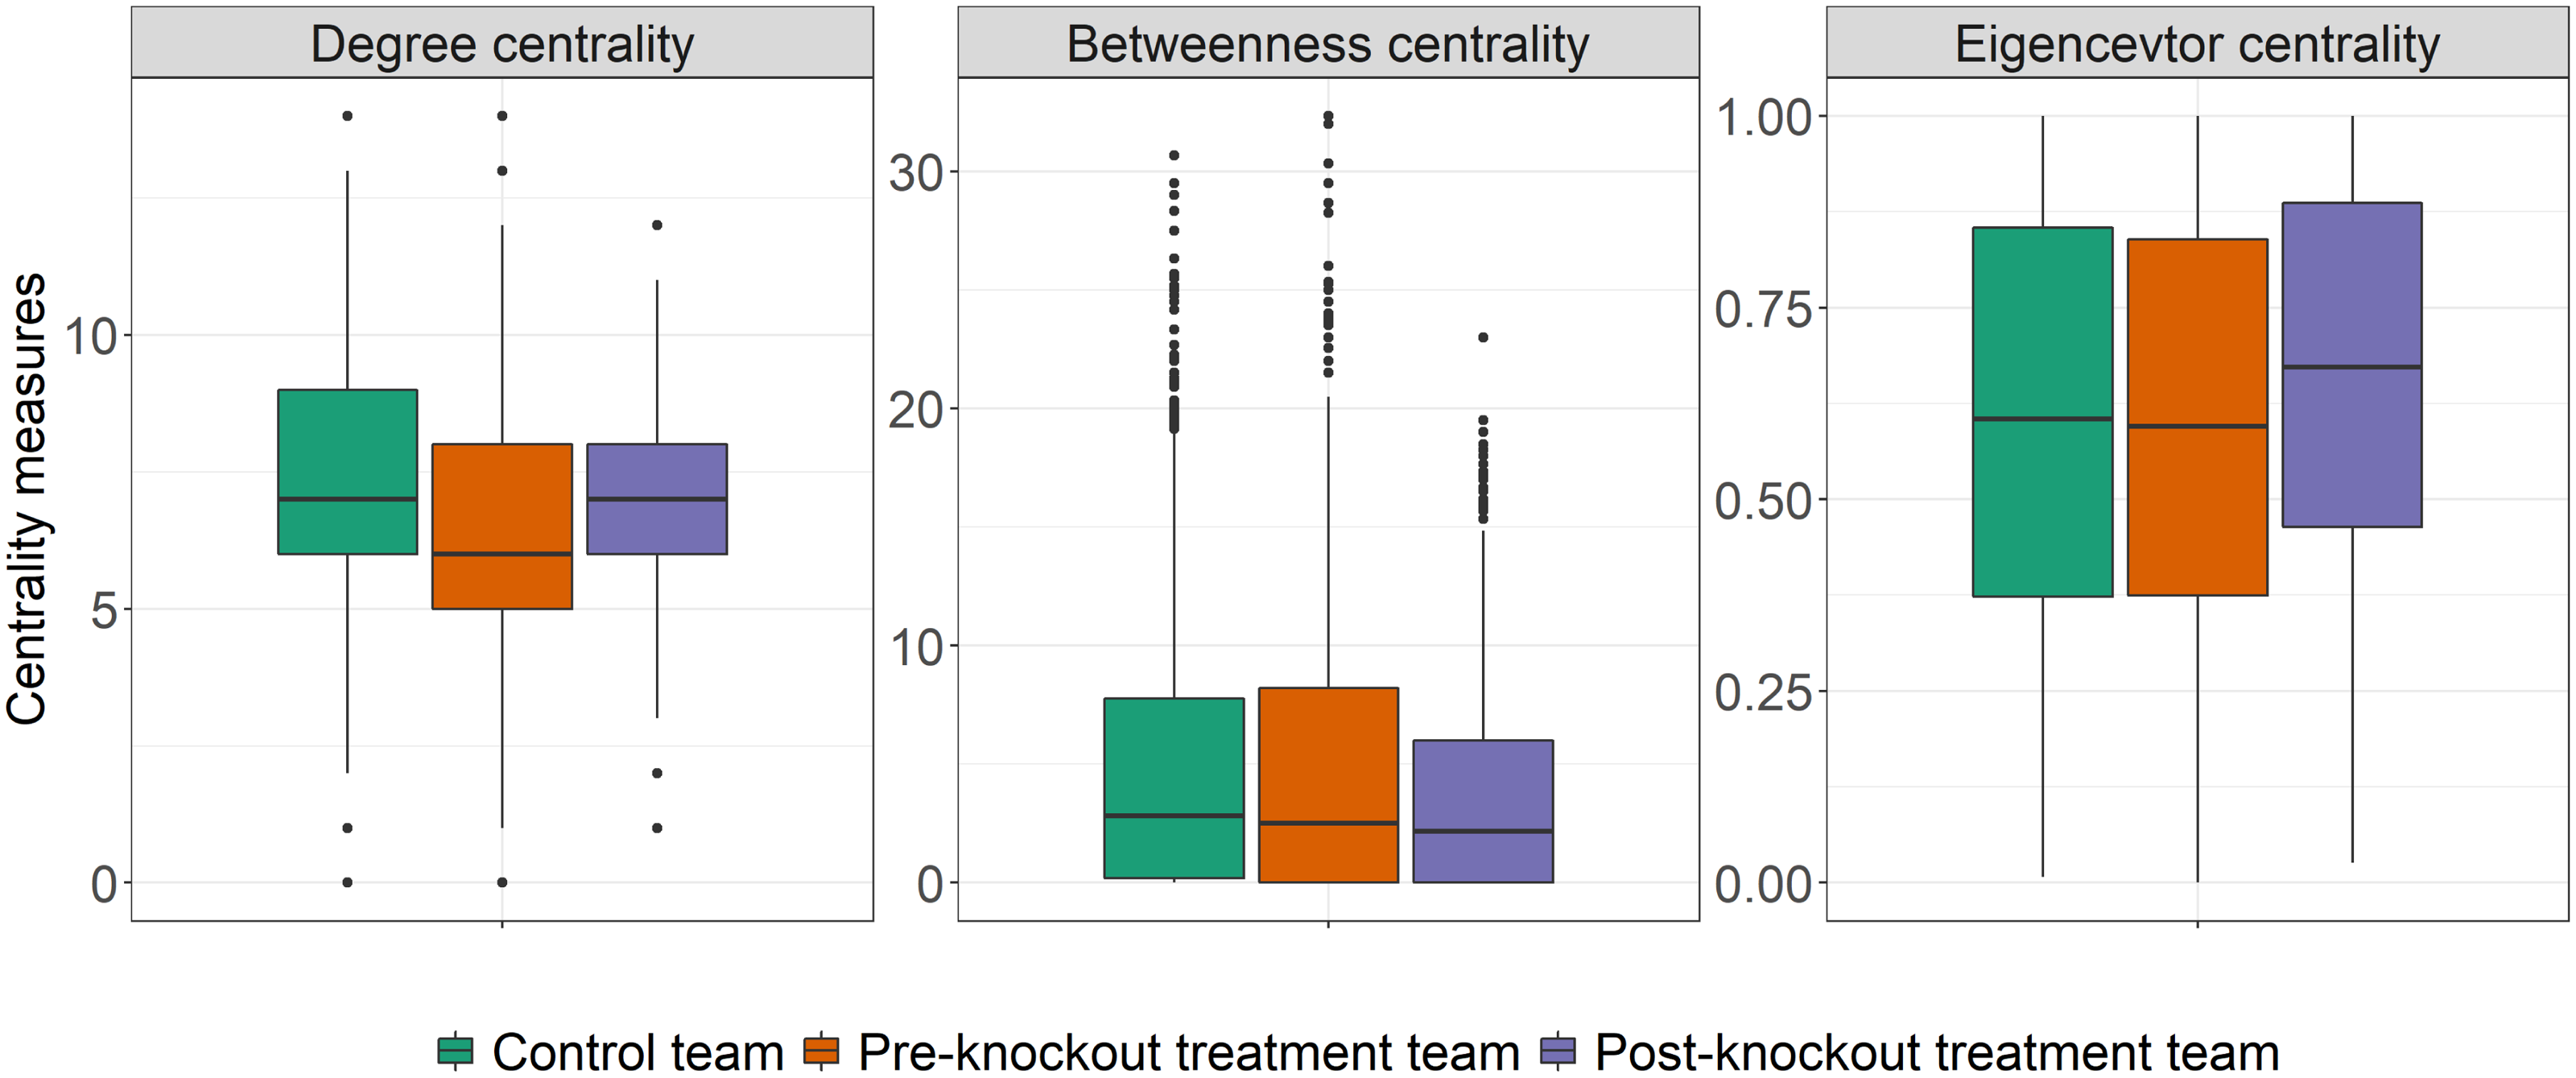
Figure 6 displays boxplots of the individual level dependent variables. Across all measures, we see high similarity in participants’ degree, betweenness, and eigenvector centrality measures in the control teams, pre-knockout treatment, and post-knockout treatment rounds. For degree centrality, participants had a mean centrality of 7.15 in the control trials, 6.52 in the pre-knockout treatment trials, and 6.97 in the post-knockout treatment trials. For betweenness centrality, participants had a mean centrality of 5.01 in the control trials, 4.91 in the pre-knockout treatment trials, and 3.72 in the post-knockout treatment trials. And last, for eigenvector centrality, participants had a mean centrality of 0.60 in the control trials, 0.60 in the pre-knockout treatment trials, and 0.66 in the post-knockout treatment trials.
Dependent variables at the individual level. In cell (a) we see degree centrality of all participants. In cell (b), we see the betweenness centrality of all participants. And in cell (c), we see the eigenvector centrality of all participants.
4.3 Nuisance parameter
In the team-level models, we include the communication network density and degree centralization as control variables. Previous researchers have used these variables as measures for the centralization of teams, with denser networks indicating that a team is more decentralized and higher degree centralization indicating that a team has a hierarchical structure (see Landers & Lüschen, Reference Landers and Lüschen1974; Carron & Chelladurai, Reference Carron and Chelladurai1981; Evans & Dion, Reference Evans and Dion1991; Mullen & Copper, Reference Mullen and Copper1994; Beal et al., Reference Beal, Cohen, Burke and McLendon2003; Argote et al., Reference Argote, Aven and Kush2018, for research on how density and centralization affect team performance). The communication network density is the proportion of connections over the number of potential connections, with dense communication networks indicating more ties within the team. Degree centralization is a group-level measure of the dispersion of nodes’ degree centrality scores, with higher scores indicating a more hierarchical network structure.
In addition to controlling for team performance, these variables are also included to help us further assess how the node knockouts affect team messaging, as teams’ communication networks constrain with whom players can interact. Thus, the communication network density and degree distribution may be especially relevant for the post-knockout treated teams, as these teams have fewer players and more decentralized communication networks, with a mean communication network density of 0.63 for the control teams, 0.64 for the pre-knockout treated teams, and 0.70 for the post-knockout treated teams, and a mean degree centralization measure of 0.27 for the control teams, and 0.28 for the pre-knockout treated teams, and 0.23 for the post-knockout treated teams (see appendix for additional descriptive information on the communication networks). Thus, network density and degree distribution directly affect the normalized volume of messages sent by teams. In the appendix, we replicate these models with alternative control variables.
4.4 Methods
We use difference in difference regressions to measure changes in the teams and individuals from the node knockout. The equation follows:
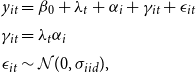 \begin{align*} y_{it} &= \beta _0 + \lambda _t + \alpha _i + \gamma _{it} + \epsilon _{it}\\[3pt] \gamma _{it} &= \lambda _t \alpha _i\\[3pt] \epsilon _{it} &\sim \mathcal{N}(0, \sigma _{iid}), \end{align*}
where $\beta _0$
is the intercept,
$\beta _0$
is the intercept, $\lambda _t$
is the time trend,
$\lambda _t$
is the time trend, $\alpha _{i}$
is the treatment, and
$\alpha _{i}$
is the treatment, and $\gamma _{it}$
(the interaction effect between
$\gamma _{it}$
(the interaction effect between $\lambda _t$
and
$\lambda _t$
and $\alpha _{i}$
) is the difference in difference estimate. For our experiment, the difference in difference estimate is the average treatment effect because it accounts for time-varying processes in the experiment and the impact of the treatment. At the team level, the difference in difference interaction effect is if the team experienced a knockout and it is a post-knockout experimental round (see Figure 4a). Likewise, at the individual level, the difference in difference interaction effect is if the teammate rewired their network and if it is a post-knockout experimental round (see Figure 4b). Through this approach, we can control for teams adjusting and learning the experiment over time. This allows us to more cleanly estimate the average treatment effect for the node knockout on teams and individuals that rewire their network.
$\alpha _{i}$
) is the difference in difference estimate. For our experiment, the difference in difference estimate is the average treatment effect because it accounts for time-varying processes in the experiment and the impact of the treatment. At the team level, the difference in difference interaction effect is if the team experienced a knockout and it is a post-knockout experimental round (see Figure 4a). Likewise, at the individual level, the difference in difference interaction effect is if the teammate rewired their network and if it is a post-knockout experimental round (see Figure 4b). Through this approach, we can control for teams adjusting and learning the experiment over time. This allows us to more cleanly estimate the average treatment effect for the node knockout on teams and individuals that rewire their network.
All presented regressions are estimated via 2,500 bootstrap simulations.Footnote 5 To test the robustness of our findings, we run both standard and random effects difference in difference regressions. Specifically, we include a random effect for teams. The random effects help account for unobserved heterogeneity between teams not captured by the other independent variables. In addition to the presented regressions, the appendix contains alternative model specifications.
5. Results
5.1 Team level
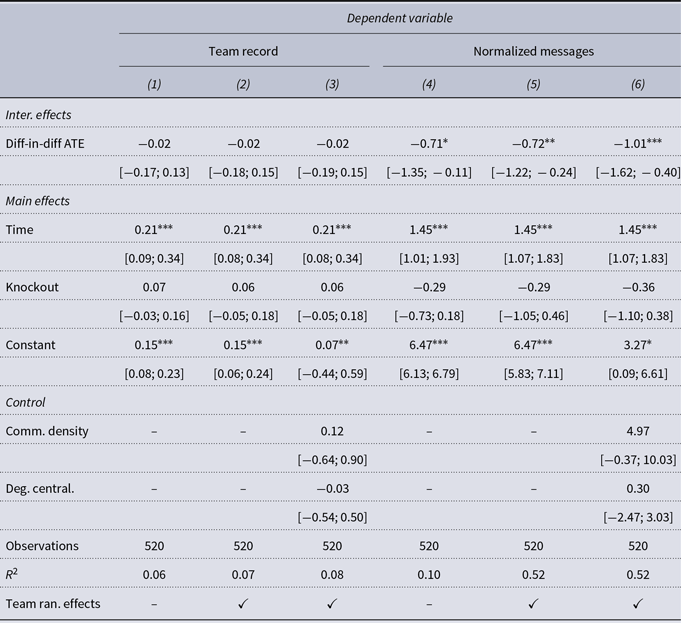
Table 2 reports the team difference in difference regression results. In total, we find some evidence for our hypotheses. Across all models on changes in the normalized volume of messages sent, the effect of the node knockout is statistically significant and negative, with teams sending 1.03 fewer messages per round, holding all else constant.Footnote 6 This corresponds to 5 fewer messages sent during the post-knockout rounds for treated teams.
Average treatment effect for the changes in team performance using the team record and the normalized messages sent. Across both models, teams that experience a node knockout send less messages compared to the control teams
Brackets are 95% bootstrap confidence intervals. $^{***}p\lt 0.001$
;
$^{***}p\lt 0.001$
; $^{**}p\lt 0.01$
;
$^{**}p\lt 0.01$
; $^{*}p\lt 0.05$
. Estimated with 2,500 boot-strap simulations. Models (2), (3), (5), and (6) include team random effects.
$^{*}p\lt 0.05$
. Estimated with 2,500 boot-strap simulations. Models (2), (3), (5), and (6) include team random effects.
Aside from the effect of node knockouts on messages sent, we also find three notable null findings. First, the teams that experience a node knockout were 2% less likely to win games compared to the control and pre-knockout teams. However, the estimated effect of the node knockout on teams’ records is not statistically significant at the 0.05 level. In addition to the aforementioned results, we also find that the effect of communication network density is positively associated with both teams’ records and their volume of messages sent, with a one-unit increase in communication density increasing the team probability of winning by 12% and the volume of messages sent by 5.04. However, in both models, the effect is not statistically significant at the 0.05 level, suggesting that greater internal connectivity has an indeterminate effect on team performance. This null finding is notable given that previous scholarship has found a positive association between internal connectivity (i.e., network density) and team performance (e.g., Landers & Lüschen, Reference Landers and Lüschen1974; Carron & Chelladurai, Reference Carron and Chelladurai1981; Evans & Dion, Reference Evans and Dion1991; Mullen & Copper, Reference Mullen and Copper1994; Beal et al., Reference Beal, Cohen, Burke and McLendon2003). Last, we similarly find null results for degree centralization and team records on the normalized volume of messages sent, with a negative relationship between degree centralization and team record and a positive association between degree centralization and volume of messages sent.
5.2 Individual contributions
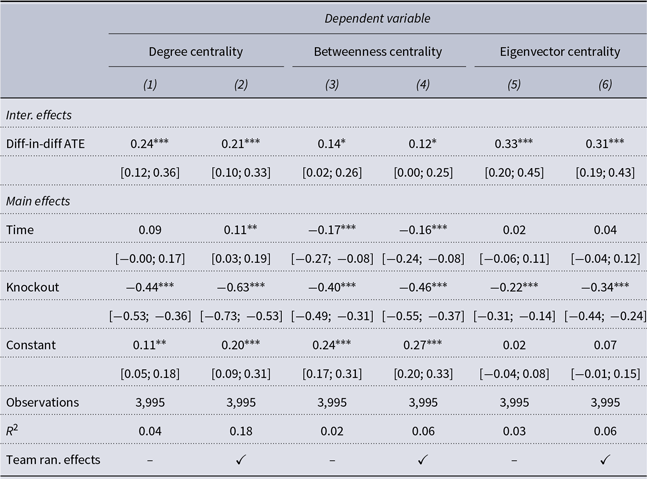
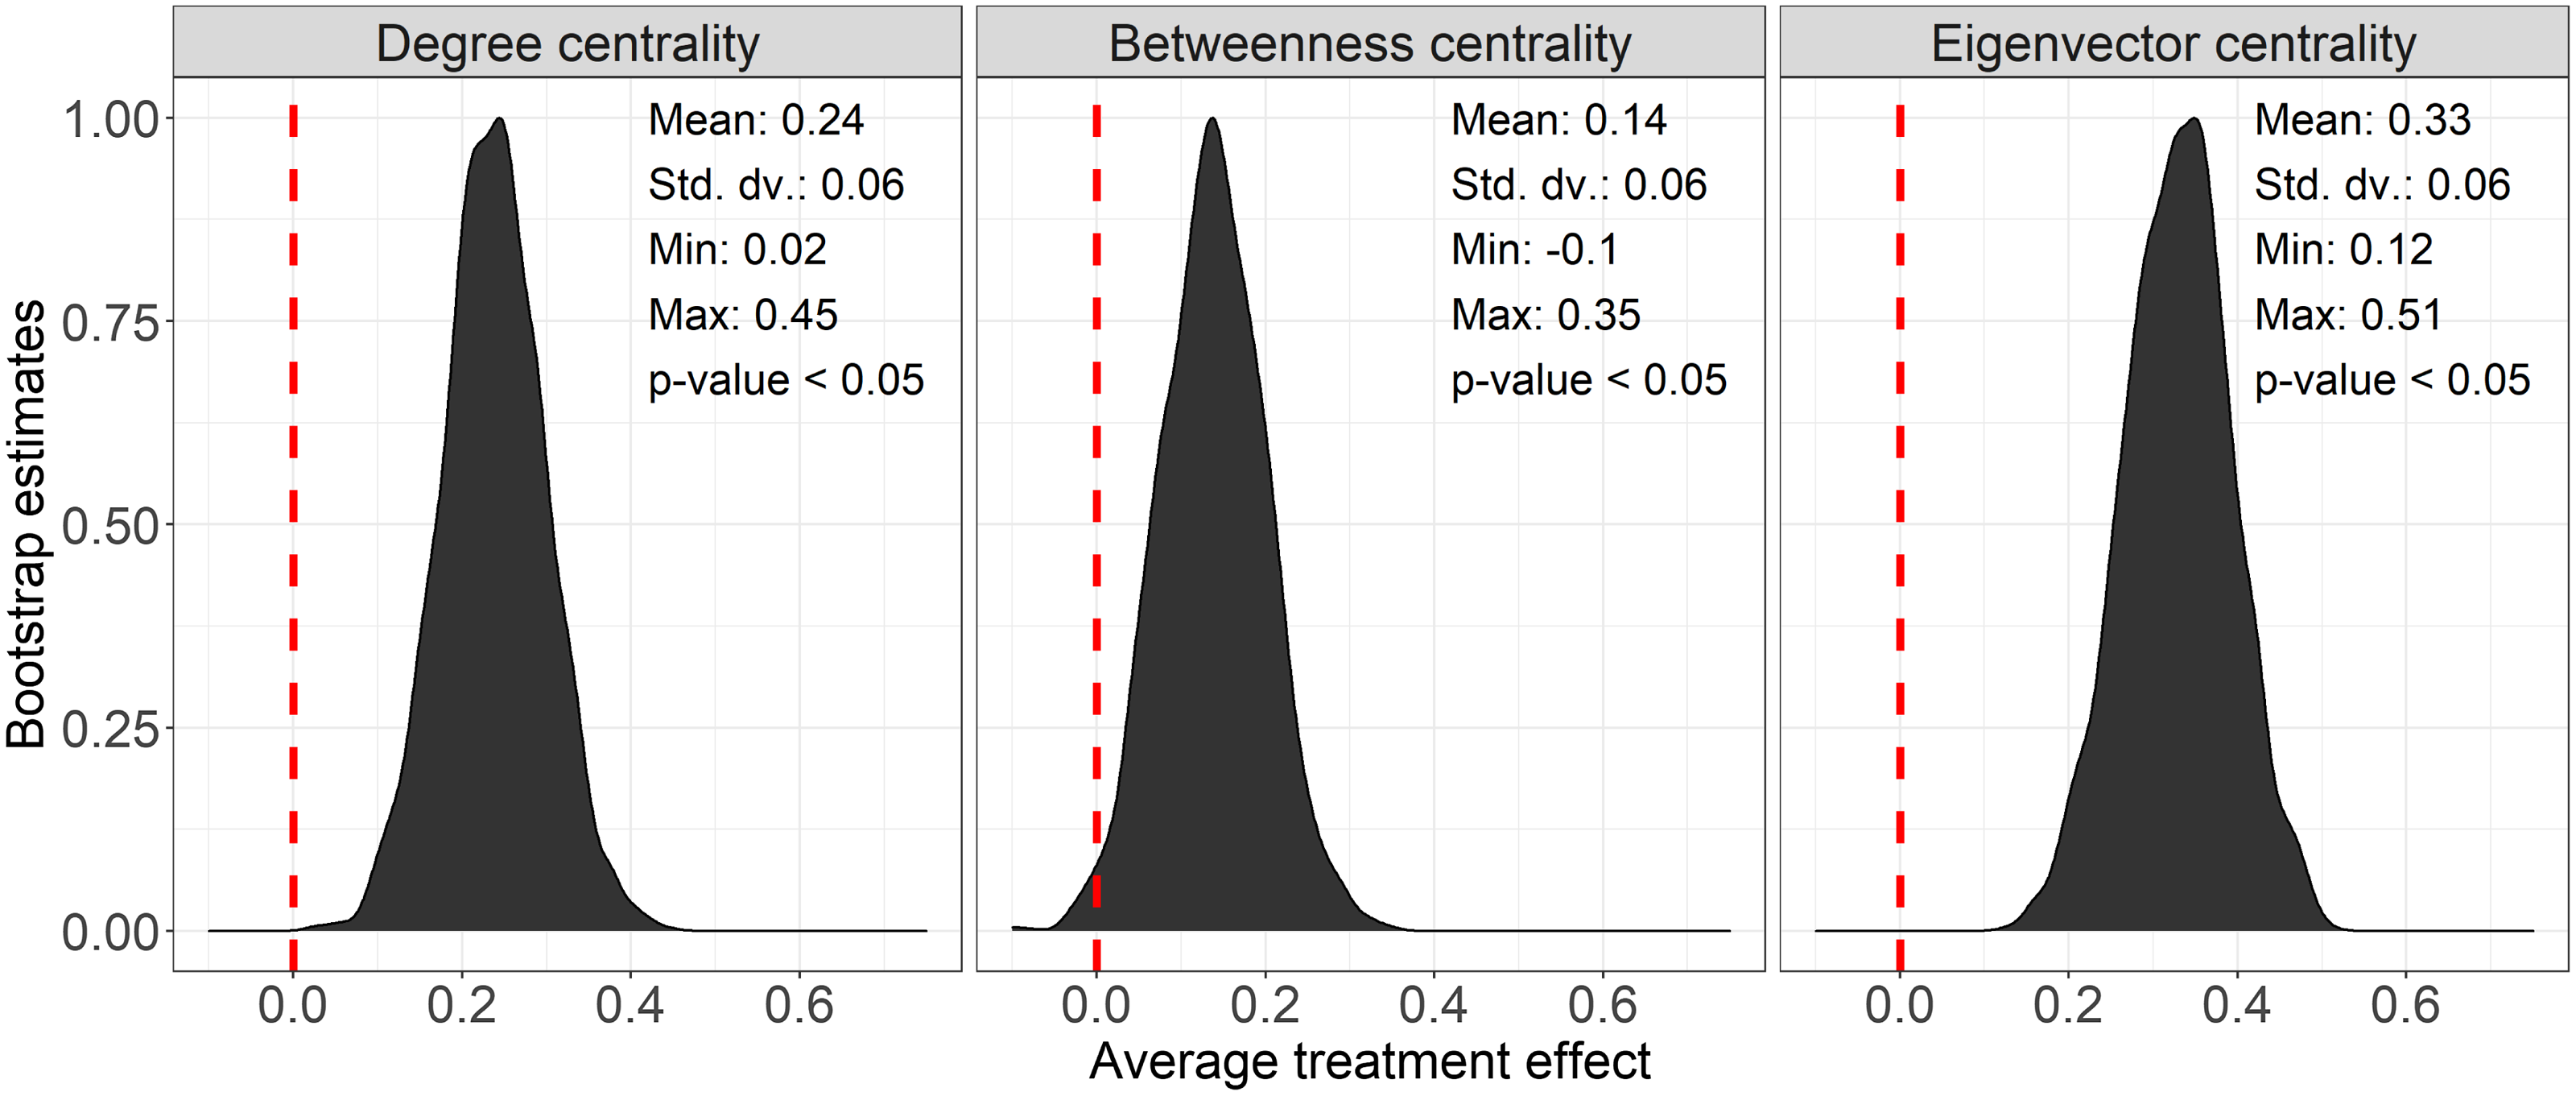
Table 3 reports the individual difference in difference regression results. In total, we find strong evidence for our hypothesis that teammates who rewire their network after the node knockout become more integral, while peripheral members become more isolated within their teams’ communication frequency network. Across all models, the effect of the node knockout and adaptation is statistically significant and positive, with an increase in 0.21 degree, 0.12 betweenness, and 0.31 eigenvector centrality for the teammates that rewired their network compared to the control participants.Footnote 7 Figure 7 helps us further understand the estimated effect of rewiring the network by visualizing a distribution of all bootstrapped estimates. In total, zero of the bootstrapped treatment effect estimates are below zero in the degree and eigenvector centrality regressions, while 1.4% of the bootstrapped treatment effect estimates are below zero in the betweenness centrality regression.
Average treatment effect for the knockout on the communication frequency network. Across all models, we see that players connected to the knocked out player become more central to the team following the knockout
Brackets are 95% bootstrap confidence intervals. $^{***}p\lt 0.001$
;
$^{***}p\lt 0.001$
; $^{**}p\lt 0.01$
;
$^{**}p\lt 0.01$
; $^{*}p\lt 0.05$
. Estimated with 2,500 bootstrap simulations. Models (2), (4), and (6) include team and treatment random effects.
$^{*}p\lt 0.05$
. Estimated with 2,500 bootstrap simulations. Models (2), (4), and (6) include team and treatment random effects.
The difference in difference estimates for the changes in centrality for the treated individual participants from the standard difference in difference regressions. Following the knockout, the treated experiment participants became more central to their team communication frequency networks.
At the same time that the treated participants become more central to their team’s communication, the knockout treatment reduces the degree, betweenness, and eigenvector centrality of all remaining teammates compared to the control teammates on the teams that did not experience the knockout, with a decrease in 0.63 degree, 0.46 betweenness, and 0.34 eigenvector centrality. This means that the remaining control participants on the knockout teams see reductions in their influence within their team’s communication network frequency (i.e., internal information sharing). These individual-level findings relate to the team-level models on changes in the normalized volume of messages sent. Specifically, this suggests that node knockouts cause the remaining influential participants to become more influential, while the remaining less influential participants become less influential.
6. Discussion
The present findings provide a deeper understanding and contribute to the existing literature on network resiliency and team performance. We find that teams that experience a network knockout send fewer messages, all else equal. However, while the teams send fewer messages overall, the remaining members that adapted their network after the knockout see increases in their communication frequency network centrality. Put another way, node knockouts appear to decrease their team’s internal connectivity while increasing the connectivity of other central members. These conflicting findings help us infer the role of the knocked-out participant in the experiment. Specifically, this suggests the knocked-out participant helped communicate the team strategy to their teammates during an experimental round. Therefore, their removal from the team reduced overall team connectivity, with central team members becoming more central and peripheral team members becoming more peripheral within their team’s communication frequency network. This finding adds to the growing body of research on how network centrality can help us understand leadership and network adaptation (e.g., Li et al., Reference Li, Liao and Yen2013; Zhang & Luo, Reference Zhang and Luo2017; Dubois & Gaffney, Reference Dubois and Gaffney2014; Risselada et al., Reference Risselada, Verhoef and Bijmolt2016; Sasaki et al., Reference Sasaki, Yamamoto, Miyao, Katsuta and Kono2017). Further, it suggests that even if teammates adjust their behaviors after a node knockout, it may not fully compensate or offset the lost contributions of the removed node in the short term.
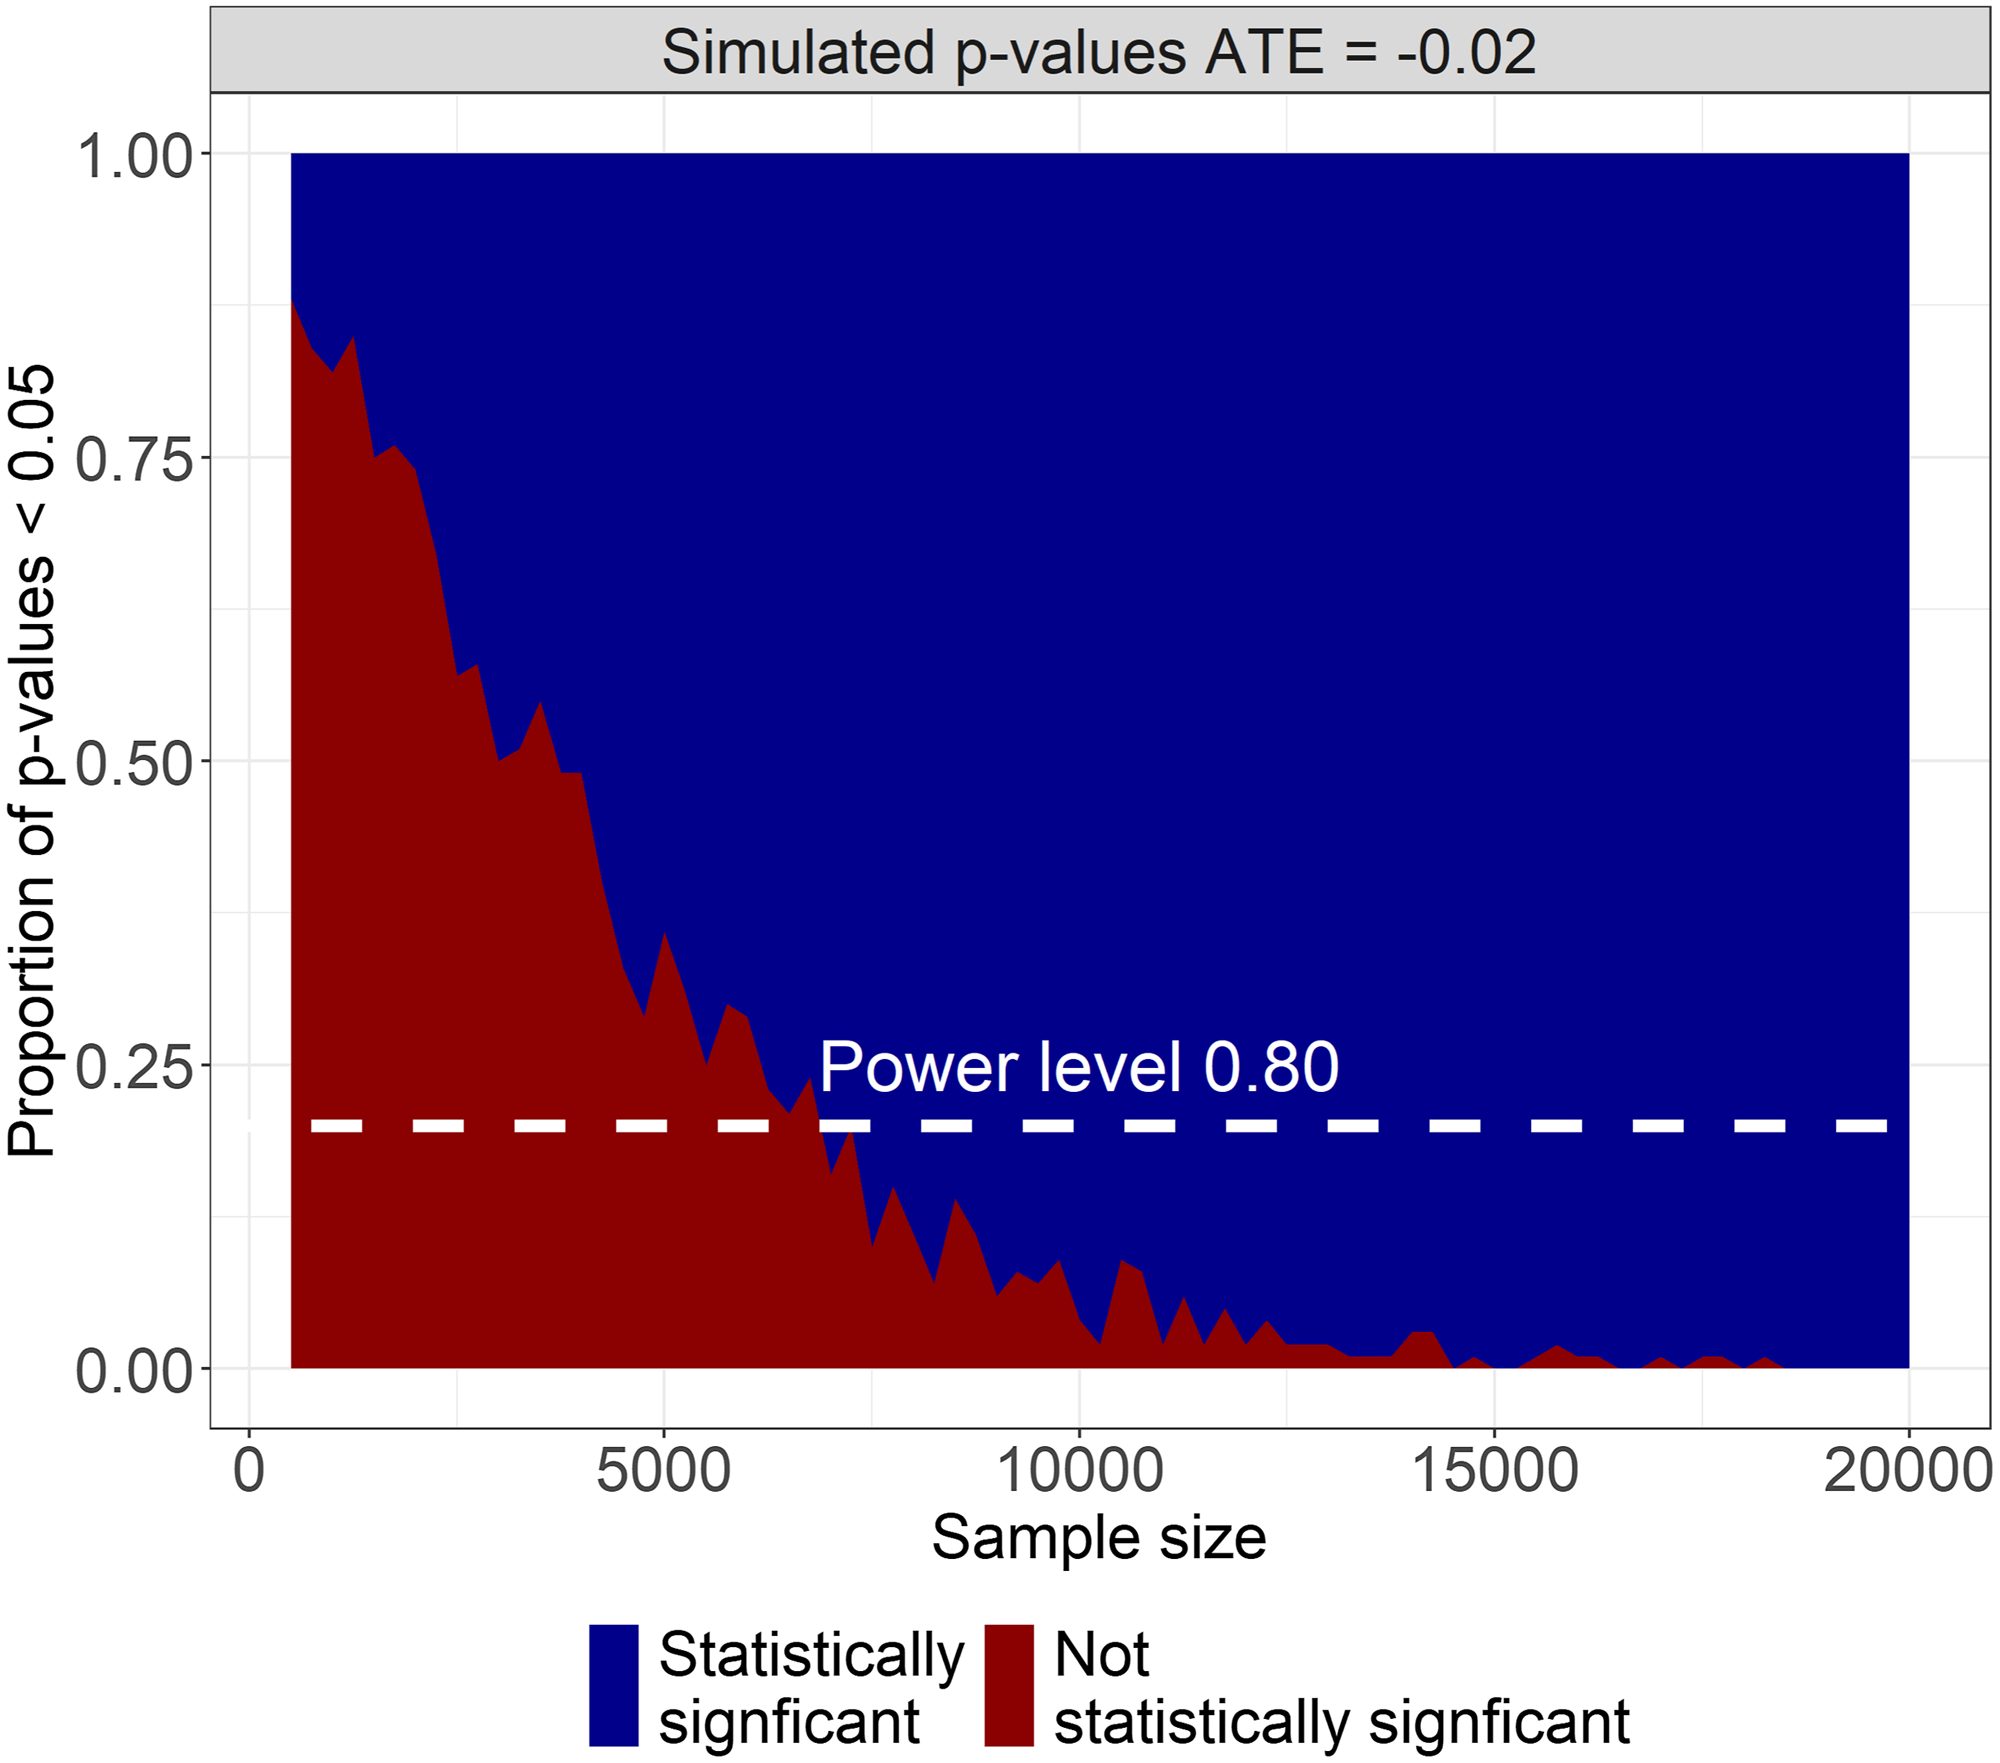
In addition to this finding, our study also contributes to the extant research on team performance and network structure. Although teams are often able to outperform individuals, researchers have recently analyzed the conditions under which individuals can outperform teams. The presented analysis contributes to this literature. Based on our results, we estimate that the node knockout decreases a team’s probability of winning by 2%. With that estimated treatment effect, we would have to sample approximately 7,000 teams to detect a statistically significant effect of node knockouts on team performance more than 80% of the time (see Figure 8 for visualization of simulated $p$
-values by sample size). This suggests that although node knockouts may have a negative impact on teams, teams may not be greatly affected by a node knockout if the coordination task is similar to the generalization of the Colonel Blotto game presented in this paper.
$p$
-values by sample size). This suggests that although node knockouts may have a negative impact on teams, teams may not be greatly affected by a node knockout if the coordination task is similar to the generalization of the Colonel Blotto game presented in this paper.
Simulated p-values by sample size. Starting at sample sizes over 7,000 is when the average treatment effect starts of −0.02 starts to be detected in more than 80% of the simulations.
The null finding of node knockouts on team performance is consistent with previous research analyzing how individuals and teams differentially perform on tasks with varying difficulty. Almaatouq et al. (Reference Almaatouq, Yin and Watts2020b) conduct a two-stage experiment. In the first stage, participants complete tasks with varying levels of complexity. In the second stage, the experiment participants are randomly assigned into a group or individual treatment and perform similar tasks. They find that individuals are able to outperform teams when the task is simple. The Colonel Blotto game may be a similarly simple task wherein individuals can outperform groups. Thus, the loss of a member may have a nominal effect on the team despite influencing the teams’ messaging and communication.
We also find that decentralized communication, communication network density, and hierarchy may not affect team performance. These findings conflict with several studies that demonstrate that greater network density improves team performance (e.g., Landers & Lüschen, Reference Landers and Lüschen1974; Carron & Chelladurai, Reference Carron and Chelladurai1981; Evans & Dion, Reference Evans and Dion1991; Mullen & Copper, Reference Mullen and Copper1994; Beal et al., Reference Beal, Cohen, Burke and McLendon2003). Although most studies have found a positive relationship between network density and team performance, several studies have found that team performance and network density may have a curvilinear relationship, with very sparse and dense networks performing worse than networked teams with an intermediate number of internal connections (e.g., Burt, Reference Burt1999; Wise, Reference Wise2014). We explore this effect in the appendix but similarly find no effect of communication network density on team records or the volume of messages sent. This finding, combined with the node knockout effect on team records, may be an interesting area for future study, as the null effect of the exogenous shock on team record may be related to experimental teams engaging in a simple task (Almaatouq et al. Reference Almaatouq, Yin and Watts2020b).
7. Conclusion
The present study makes four notable contributions to extant research on network structure, resiliency, and adaption. First, we show the conditions under which node knockouts affect the performance of real-world teams, with the removal of a central teammate reducing the internal dissemination of information. This suggests that leaders (i.e., central nodes) play a crucial role in connecting disparate parts of their team’s network. Second, we analyze how the remaining players adapt to node knockouts to offset the lost contributions of the removed teammate, with secondary, but central, members becoming more central and peripheral members becoming more peripheral within their team’s communication network. This finding suggests that knockouts differentially influence the remaining teammates by further integrating influential members while simultaneously isolating non-influential members. Together, the first and second findings help us understand how networked systems adapt at the macro and micro levels to node knockouts, with a loss in overall connectivity at the network level and some retrenchment and integration at the nodal level. Third, the present analysis contributes to the growing body of work on how team structure and coordination may not be beneficial in certain situations. Indeed, the null effect of the exogenous shock on team records may be because teams were tasked with a simple coordination game instead of working on a more difficult task. And fourth, the experiment offers a novel methodological contribution for experiments on networked systems. Specifically, by recruiting preexisting groups, we conduct experiments on real social networks, which gives us critical insights into network adaptation at the team and individual levels.
However, before further discussing the implications of the study, we wish to note four potential limitations. First, several of the individual and team models have low $R^2$
values, meaning that little of the variance in the dependent variable is explained by the independent variables. This suggests that other factors omitted from the models may help us understand team performance and participants’ contributions.Footnote
8
Second, exogenous shocks outside of a laboratory experiment may affect individuals and teams differently than a simulated knockout. Namely, the experiment imposed some restrictions on how the experimental team could adapt their communication network after an exogenous shock, whereas real-world networked teams may have a broader range of ways to respond to a node knockout. Third, our experiment asked participants to compete in a simple coordination game. The effect of exogenous shocks on teams may differ if teams perform harder, more intensive tasks. And fourth, the communication of the participants was restricted to their pre-selected social network ties. Although the communication network reflected their real social networks, the messaging network between the participants would have likely differed if they could communicate with any of their teammates during the experimental game. The third and fourth limitations offer areas for future research. Subsequent studies can investigate how teams adapt to exogenous shocks when performing more challenging tasks, or allow teammates to communicate with all other participants team through dyadic messaging windows.
$R^2$
values, meaning that little of the variance in the dependent variable is explained by the independent variables. This suggests that other factors omitted from the models may help us understand team performance and participants’ contributions.Footnote
8
Second, exogenous shocks outside of a laboratory experiment may affect individuals and teams differently than a simulated knockout. Namely, the experiment imposed some restrictions on how the experimental team could adapt their communication network after an exogenous shock, whereas real-world networked teams may have a broader range of ways to respond to a node knockout. Third, our experiment asked participants to compete in a simple coordination game. The effect of exogenous shocks on teams may differ if teams perform harder, more intensive tasks. And fourth, the communication of the participants was restricted to their pre-selected social network ties. Although the communication network reflected their real social networks, the messaging network between the participants would have likely differed if they could communicate with any of their teammates during the experimental game. The third and fourth limitations offer areas for future research. Subsequent studies can investigate how teams adapt to exogenous shocks when performing more challenging tasks, or allow teammates to communicate with all other participants team through dyadic messaging windows.
The limitation notwithstanding, this study offers several significant contributions to research on team performance, leadership, individual motivation, and how teams adapt to exogenous shocks. Through our analysis, we provide greater clarity on how teams respond to exogenous shocks. In so doing, we precisely demonstrate how teammates respond to exogenous shocks in the form of node knockouts. In particular, the individual level and team messaging results provide key insight into how teams adapt to node knockouts. Specifically, the treated teams become more disconnected despite the increases in connectivity from the remaining central participants that rewire their networks. This suggests that node knockouts reduce internal team communication at the expense of the more disconnected teammates. In addition to our substantive contributions, we also offer a novel methodological contribution to experimental studies in network science. Our present experiment design uses real networked teams in the experiment. This gives us a more precise and realistic understanding of how social networks respond to exogenous shocks. This design may benefit other researchers who want to understand how real social networks affect different phenomena.
In addition to our research contributions, our analysis also has direct policy implications, including criminal justice, military, counter-terrorism, and counter-insurgency policies. For example, law enforcement can use these results to construct more proficient teams and more resilient to exogenous shocks. Conversely, policymakers can use these findings to disrupt criminal and terrorist organizations by understanding how teams adapt after leaders are removed.
Competing interests
None.
Supplementary materials
For supplementary material for this article, please visit http://doi.org/10.1017/nws.2022.26


 Open access

