

1. Introduction
This paper reflects on the Irish experience of public investment and fiscal policy management over the last 25 years to draw key policy lessons. The lessons from Ireland’s boom-and-bust cycle are especially instructive for how to manage investment and fiscal policy. Ireland initially experienced rapid economic growth with abundant fiscal headroom up to 2007. There was then a deep crisis around the global financial crisis (GFC), which necessitated severe fiscal austerity. Since 2015, the Irish economy has recovered strongly. Though painful, Ireland’s experience offers a unique insight into the challenges of managing public investment dynamically, challenges that are often hidden in more stable economies.
While drawn from the Irish case, these lessons are broadly applicable. Many economies face similar pressures: demographic change, climate transition imperatives, constrained fiscal environments and institutional capacity gaps.
Based on our analysis, and motivated by a desire to improve the quality and effectiveness of public capital formation, this paper identifies five core lessons. These concern (1) the need for sustained investment effort even when facing tough choices regarding public expenditure, (2) the importance of assessing the adequacy of public capital, (3) counter-cyclicality as an important principle of public investment, (4) crowding-in private investment and (5) the challenge for public investment caused by longer-term challenges such as the necessary climate transition. We also propose two overarching design suggestions for fiscal policy and investment management frameworks.
The rest of the paper is structured as follows: we next give a very brief discussion of the macroeconomic and fiscal context of the Irish experience for readers unfamiliar with it. We then explore how public sector capital might affect economic activity emphasising the importance of adequate capital stock and acknowledging the challenges in assessing such adequacy. Section 3 considers how a reduction in investment can adversely affect the capacity of the economy to produce capital particularly in the construction sector. Section 4 examines the relationship between public and private investment and discusses how private investment bottlenecks can result from legal and regulatory environments. Section 5 focuses on climate transition investment to point out the benefits of acting sooner where longer-term challenges are obvious in advance. We then discuss how the public sector can better manage investment projects within its fiscal rules and the political processes to approve large-scale projects.
2. Macroeconomic background
Before we introduce these key lessons and policy design suggestions, we provide a very brief background of the Irish macroeconomy over the last quarter of a century to provide context to the rest of the analysis for readers unfamiliar with the Irish economy.
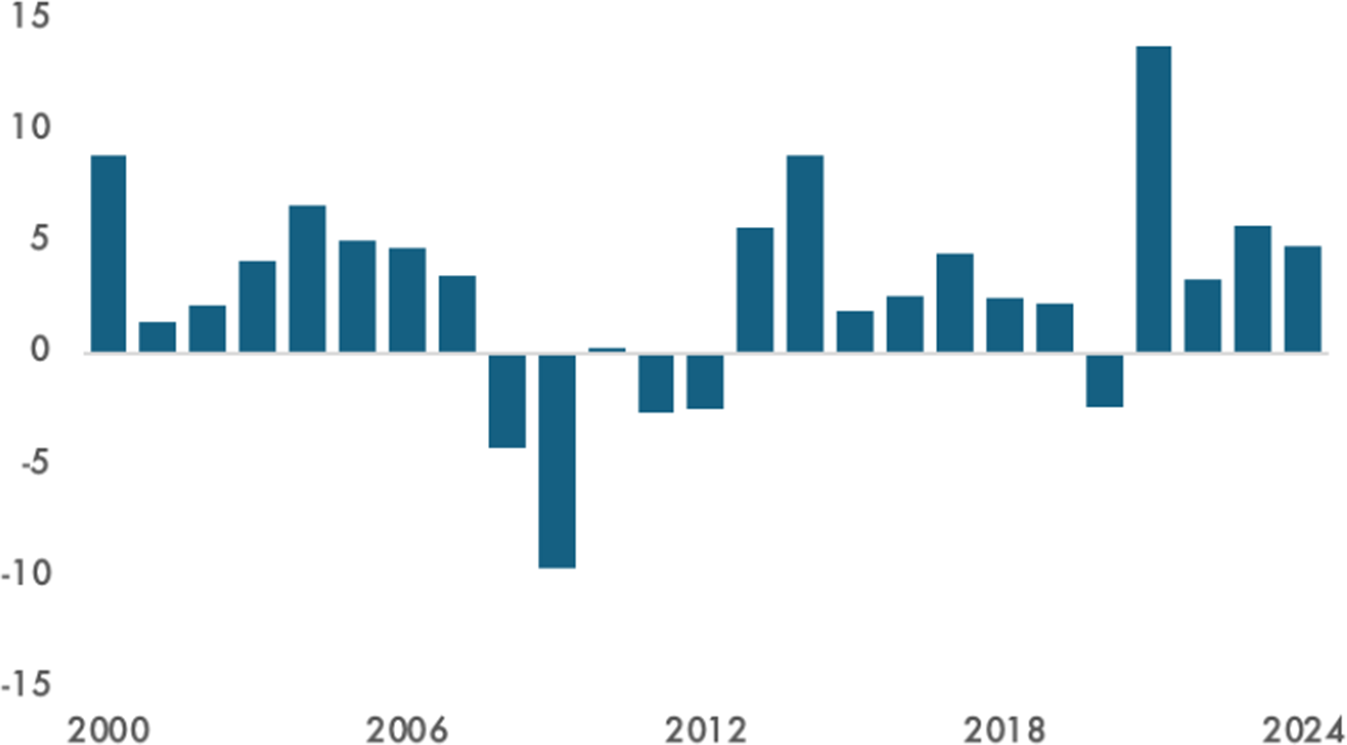
The Irish economic convergence experience over the 1990s and early 2000s has been labelled the Celtic Tiger. Having grown in real terms at over 8% in the late 1990s, Figure 1 shows that even the last few years of this convergence up to the GFC involved real growth averaging 4.5%.Footnote 1 Between 2008 and 2012, the economy contracted as the effects of the GFC were felt particularly acutely in Ireland. Since then, Ireland has continued to grow strongly compared to other advanced economies.
Ireland’s growth experience since 2000.
Annual real modified gross national income (GNI*) growth, % change.
Source: CSO.
Notes: Modified gross national income (GNI*) is used as a more appropriate measure for assessing the sustainability of the public finances and for gauging economic activity.

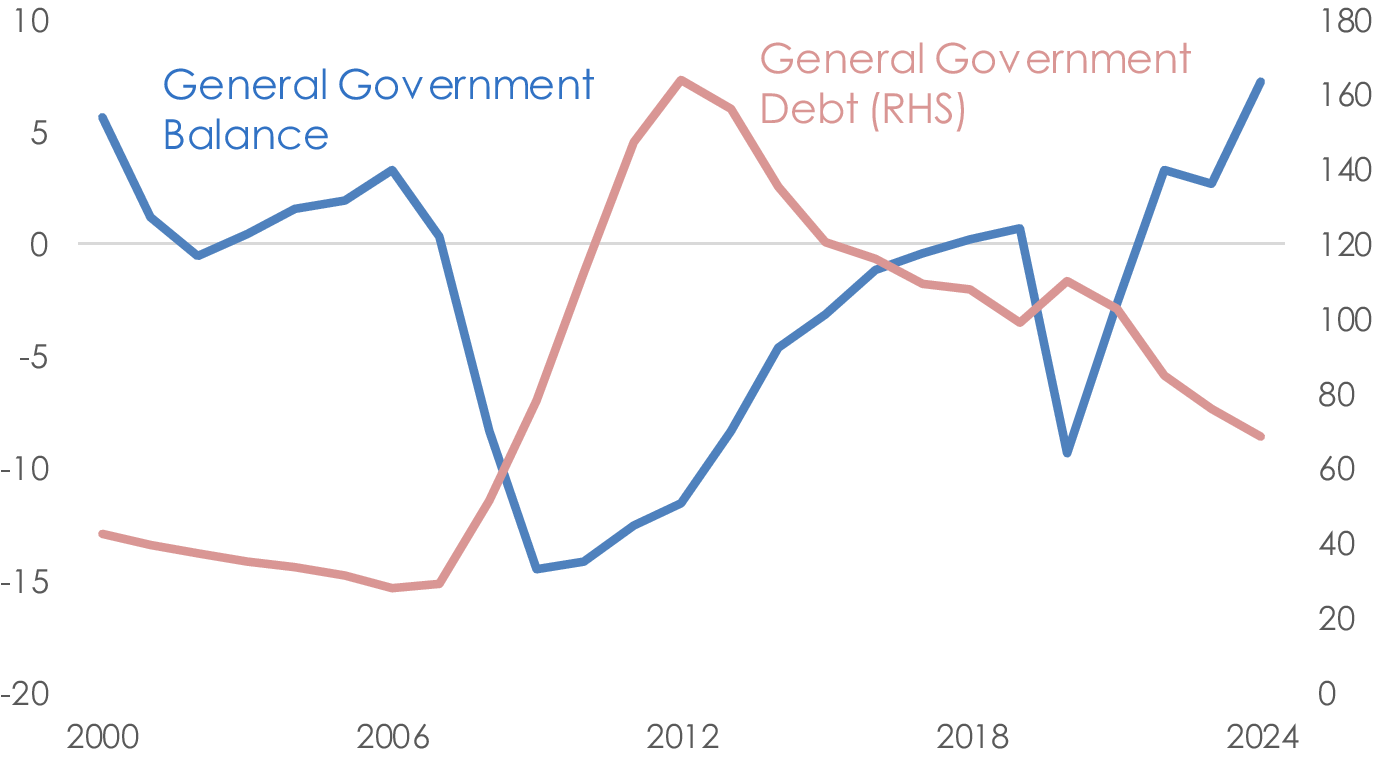
The strong economic performance has generally been associated with a favourable fiscal position. Figure 2 shows that the strong growth together with surpluses in the early 2000s drove debt levels to below 30% of GNI* in 2007. The economic slowdown, and the costs associated with the bailouts of the financial system, leads to deficits and debt skyrocketing to over 160% of GNI* in 2012. The banking sector costs are not included in the general government balance shown, but these are included in the debt; they amounted to 3% of GNI* in 2009, over 27% in 2010 and 5.5% in 2011. Since then, strong growth has resumed, reinstating Ireland’s favourable debt dynamics though debt remains over 60%.Footnote 2
Ireland’s fiscal experience since 2000.
General government balance and general government debt as a share of GNI*.
Sources: CSO.
Notes: The general government balance (GGB), expressed as % of GNI*, excludes the costs related to banking sector supports around the global financial crisis.

It is worth noting that the recent fiscal performance is somewhat flattered by Ireland’s extraordinary intake of corporation tax receipts in recent years. These receipts, associated with multinational profits and especially related to intellectual property held in Ireland, boost tax revenues such that corporation tax now accounts for nearly 30% of all tax revenue, up from around 10% a decade ago (Cronin, Reference Cronin2025). Without these receipts, and despite a strong economy with record-high levels of employment, substantial deficits would be occurring; estimates for 2023 suggest that without the excess corporation tax there would be a deficit of €3.3bn rather than the €7.9bn surplus recorded. A major concern is that these corporate tax receipts are incredibly concentrated, with just three US multinational companies accounting for close to 40% of receipts.
3. The importance of adequate capital stock
In this section, we focus on the key role of the stock of capital in economic activity. We discuss how the emphasis on investment can distract from the importance of the stock. We also draw our first two lessons: the first relates to the need for sustained investment to maintain the stock of capital, and the second concerns the importance of assessing the appropriate stock of capital and discusses the challenges involved in doing so accurately.
3.1. The role of public investment in economic activity
The flow of public investment plays a foundational role in sustaining long-run economic growth and societal well-being. From a theoretical perspective, the production function depends on the stock of capital. But in standard models, there is no distinction made between public capital and private capital. Owing to its distinctive features, there are many ways that public capital could be incorporated into macroeconomic models.
For public capital that we think of as a pure substitute for private capital, an additive approach makes sense:
 $$ {Y}_t={A}_t{L}_t^{\alpha }{\left({K}_t^P+{K}_t^G\right)}^{1-\alpha } $$
Otherwise, public infrastructure may exhibit strong complementarities with private capital and labour. For example, a private distribution company may remain unproductive without adequate transport links. In production function terms, this suggests a Leontief relationship:
 $$ {Y}_t={A}_t{L}_t^{\alpha }{\left(\min \left\{{K}_t^G,{K}_t^P\right\}\right)}^{1-\alpha } $$
Finally, some forms of public investment can be thought of as completely separate to the traditional forms of private capital. As such, this capital can enter the production function as a separate Cobb–Douglas input, with its own weight, and the extent of public capital acts like a form of aggregate productivity as far as private investment decisions are concerned:
 $$ {Y}_t={A}_t{L}_t^{\alpha }{\left({K}_t^P\right)}^{\gamma }{\left({K}_t^G\right)}^{1-\alpha -\gamma } $$
This conceptualisation underscores the necessity of differentiated assessments across investment types. While housing may serve both social and economic functions, transport and energy infrastructure have more direct productivity effects.
3.2. Lesson 1: The need for sustained investment
Despite its importance in the productive capacity of the state, public investment is often a politically popular choice for cuts when there is pressure on public expenditure. One reason for this is that such cuts have a deferred effect. This is because what matters is the capital stock, and lower investment even for a few years has only a negligible effect. This highlights a key characteristic of public investment: the impact of underinvestment is nonlinear and subject to long lags. Essentially, the government can continue to operate with similar capacity in the near term. Infrastructure can deteriorate gradually, with performance degradation accumulating slowly until visible failure occurs.
For example, a motorway typically degrades incrementally so not conducting regular maintenance barely affects the road effectiveness initially. But without regular maintenance, which might have been possible with regular works involving only minor user inconvenience, the road can ultimately suffer more structural damage, severely restricting road use and prompting costly and disruptive works to restore capacity. But because the consequences only materialise years later, the suboptimal decision to cut investment remains a popular one.
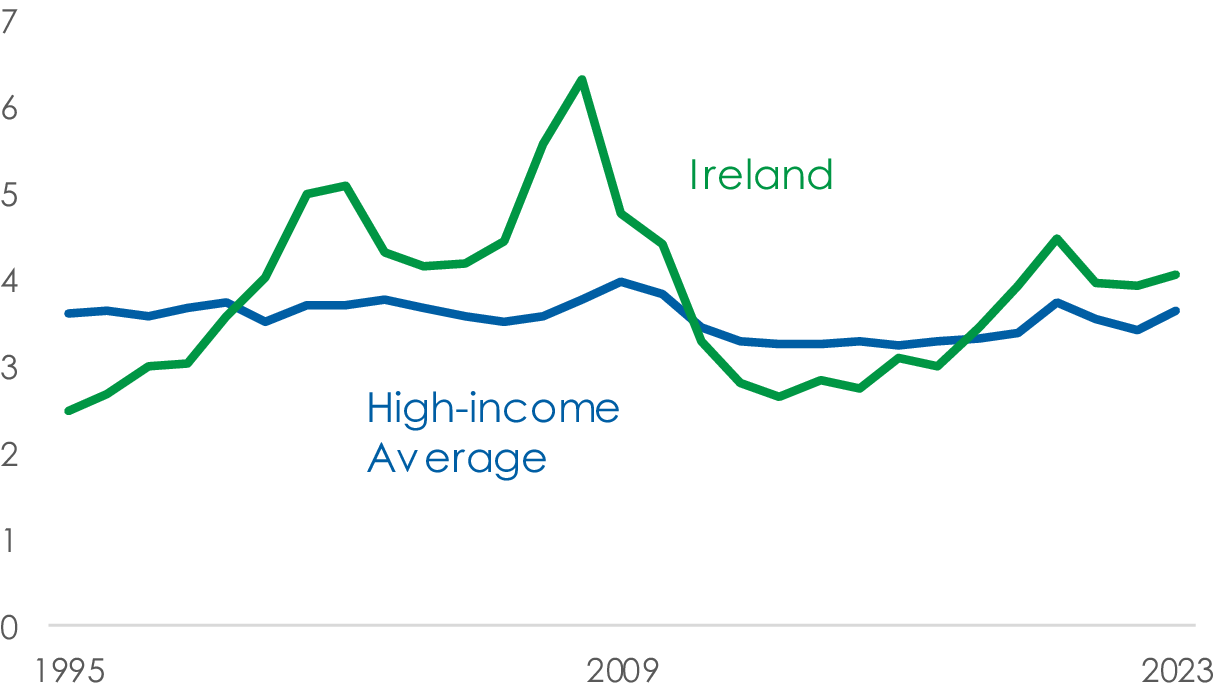
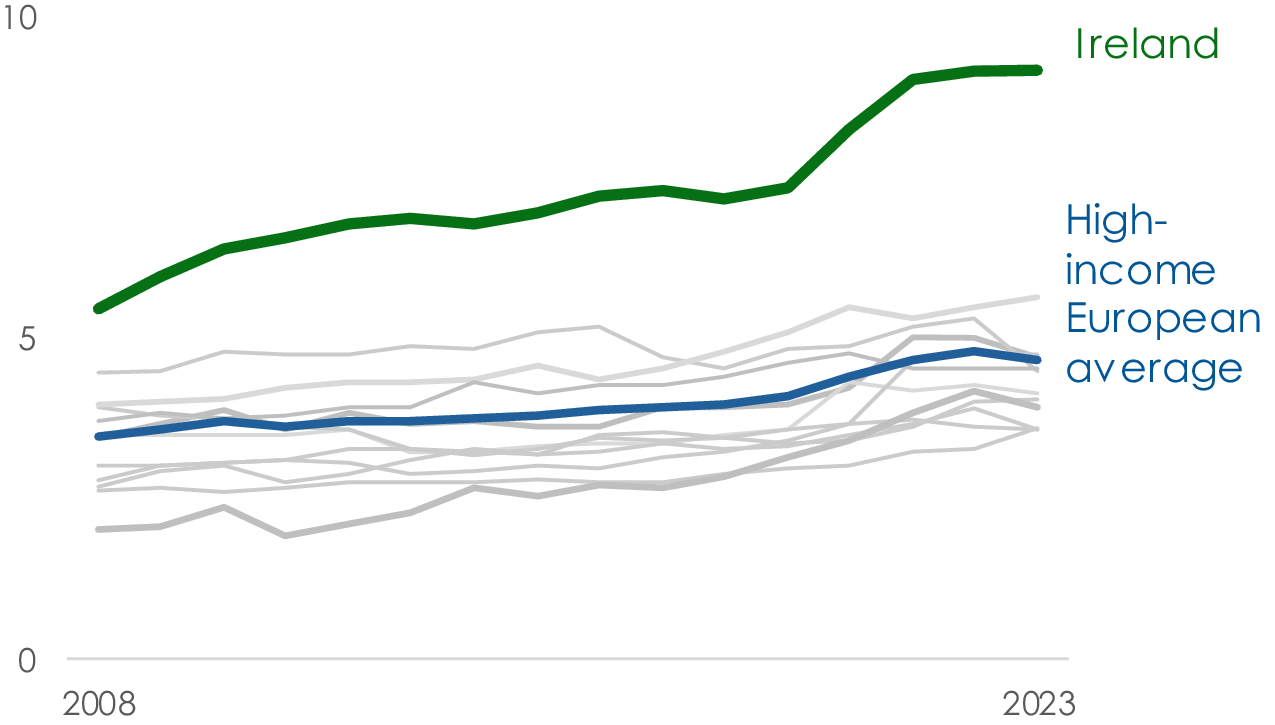
In Ireland, the period of rapid economic convergence with the European core exposed significant infrastructure deficits, prompting a sustained period of high investment. However, the fiscal retrenchment following the GFC led to a sharp contraction in fiscal spending. As with many countries, public investment was among the first areas cut, despite its long-run returns and relatively low political salience. Figure 3 shows this cyclicality. Though investment has grown above high-income European countries, we will next argue that there are reasons to still worry that recent investment has not been sufficiently high.
Government investment fell dramatically after the financial crisis.
General government investment as a share of national income (GNI* for Ireland).
Sources: Eurostat and CSO.
Notes: GDP is used for the national income of all countries apart from Ireland, where GNI* is used. The high-income average countries are: Austria, Belgium, Denmark, Finland, France, Germany, Ireland, Italy, Netherlands, Norway, Portugal, Spain and Sweden.

3.3. Lesson 2: The importance of assessing the adequacy of public capital
The central importance of capital stock requires that we assess the adequacy of public capital. Projections for demand of infrastructure are key to ensuring the capital stock keeps up. This entails a shift from flow-based expenditure metrics to stock-based indicators. There are several candidates for estimating the demand for infrastructure and capital goods. Three obvious approaches involve the population, economic activity and employment. Under all three headings, demand for infrastructure in Ireland has increased in recent years.
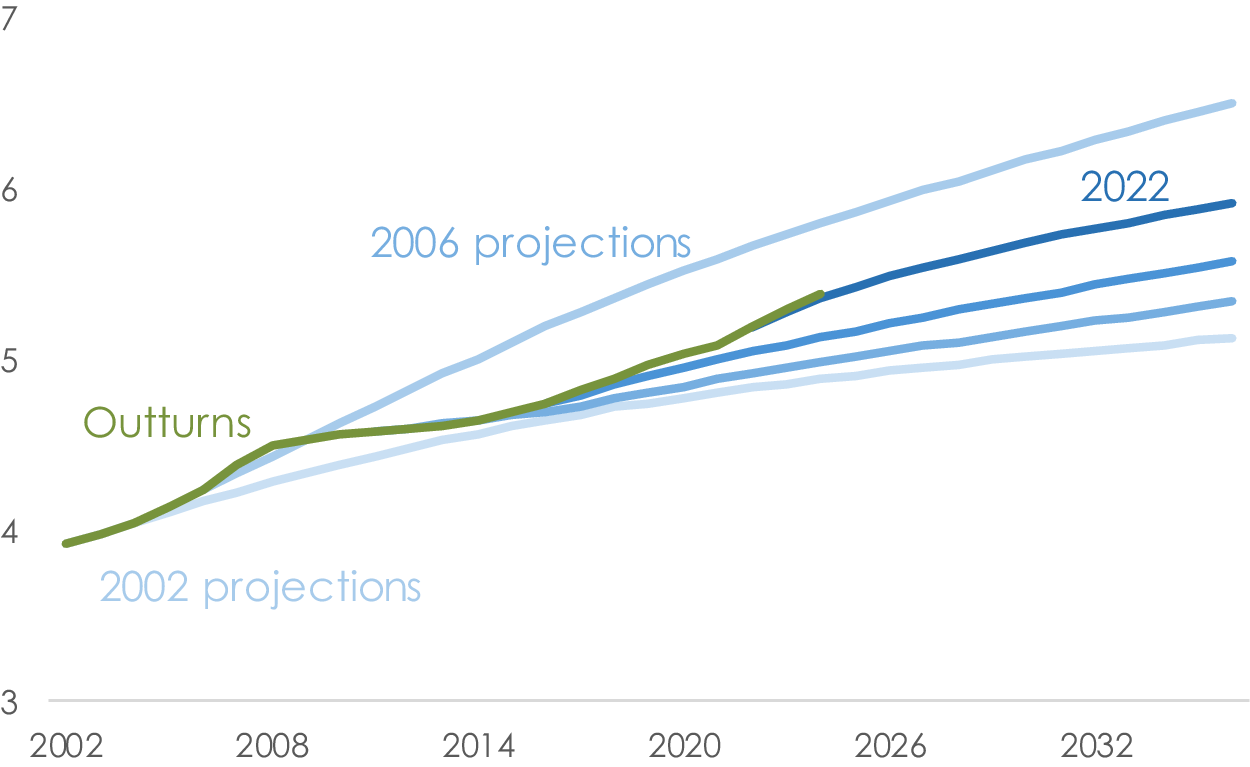
The Irish experience particularly highlights the importance of forecasting the population as key. Between 2001 and 2021, the population grew by 1.3% per annum in Ireland, which compares to a European Union (EU)-27 average of just 0.2% per annum. The population projections often used for planning have experienced large forecast errors in recent decades. If the population today were where we would have forecast it ten years ago, Ireland’s capital stock would not be so badly stretched. But with a much higher population, things are different.
Figure 4 shows that projections produced in 2007 vastly overestimated the population in the following years. It was assumed that the large inflows of migrants during the economic boom, a combination of Irish workers returning home and new migrants to Ireland, would continue. However, due to the GFC, Ireland saw a large outward migration. More recently, Ireland has once again experienced strong inward migration, which was not fully anticipated.
The population in Ireland has been difficult to forecast.
Millions of people.
Sources: CSO and CSO population projections. 2006 projections refer to projections based on the 2006 census, which were published in 2007.

The age structure of the population also determines the demand for certain types of infrastructure. This matters greatly for the demand for certain types of infrastructure. For example, Ireland currently has an extremely young population. This means it has greater requirements for infrastructure in education. In future decades, as the population ages, the demands on healthcare infrastructure will grow.
Beyond the headline capital stock, individual sectors also matter greatly. Some sectors of the economy have different requirements for infrastructure. For example, Ireland has a heavy presence of pharmaceutical and tech companies (Figure 5). These firms are heavy users of water and electricity. As a result, Ireland may require larger infrastructure in these areas.
Ireland has unusually large pharma and tech sectors.
Percentage of total employment accounted for by pharmaceuticals and ICT.
Sources: Eurostat and authors’ workings.
Notes: Employment in the pharmaceutical sector (NACE code C21, manufacture of basic pharmaceutical products and pharmaceutical preparations) and information and communications sector (NACE code J) as a share of total employment is shown. Countries shown are Ireland, Austria, Belgium, Denmark, Finland, France, Germany, Italy, Netherlands, Portugal, Spain and Switzerland.

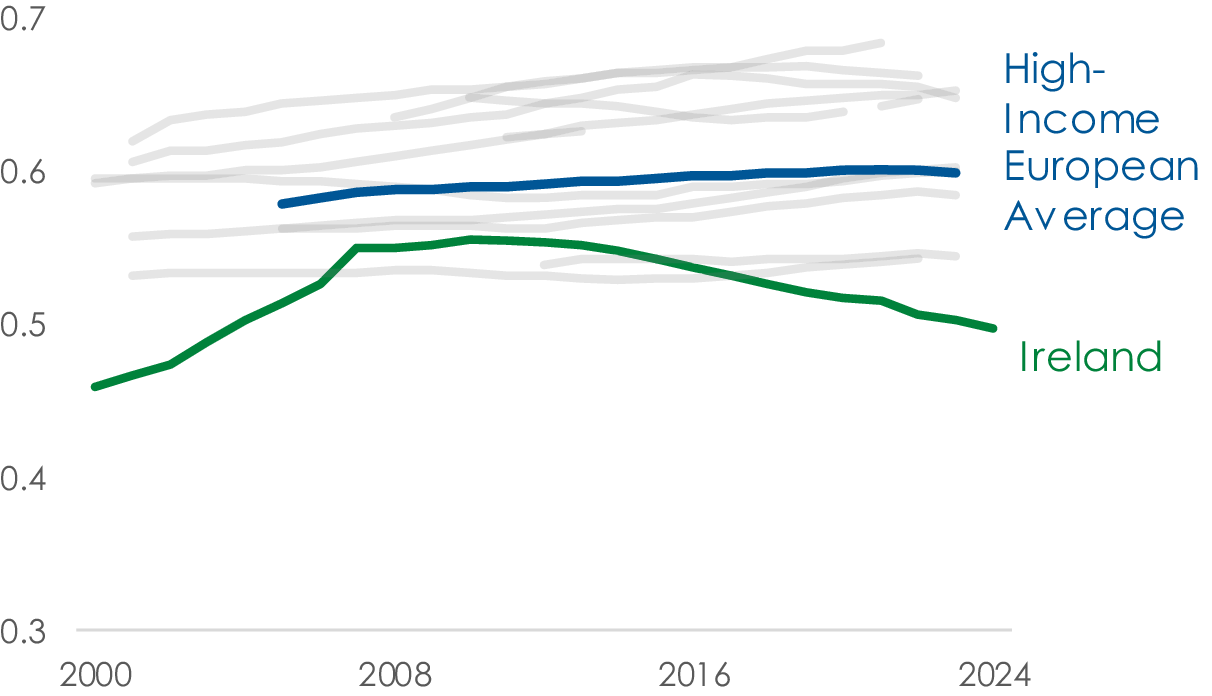
Likewise, it is important to think about specific types of infrastructure that the public sector might be well placed to address either directly or through facilitating greater private investment (discussed more below). One particular type of capital that Ireland lacks is housing. Figure 6 shows that prior to the financial crisis Ireland’s housing stock per capita was converging on other high-income European countries. However, the higher-than-expected population growth and low construction output in recent years have led to an increase in the structural demand for housing, and a widening infrastructure gap with other high-income countries has emerged.
Ireland’s stock of housing is low.
Housing stock per person aged 15 and over.
Sources: Eurostat, Statistik Austria, StatBel, Danmarks Statistik, Tilastokeskus Suomi, INSEE, DeStatis, European Central Bank, Centraal Bureau voor de Statistiek, Instituto Nacional de Estatística, Moody’s, Statistikmyndigheten, Office for National Statistics, CSO and authors’ workings.
Notes: The countries shown are Ireland, Austria, Belgium, Denmark, Finland, France, Germany, Italy, Portugal, the Netherlands, Spain, Sweden and the UK. For Ireland, Census data for 1991, 1996, 2002, 2006, 2011, 2016 and 2022 are used for the dwelling stock. The interim years are approximated using a capital accumulation equation based on Electricity Supply Board (ESB) connection (1992–2010) and new dwelling completion (2011–2024) data and an average annual implied depreciation rate of 0.31% for 1992–2024.

Current estimates place this underlying demand at approximately 44,000 units annually over the medium term; however, this figure is subject to considerable uncertainty, particularly with respect to future net migration flows (Bergin and Egan, Reference Bergin and Egan2024). Importantly, if demand is not met in any year, it can accumulate in subsequent years. Quantifying the magnitude and dynamics of this backlog is challenging. The Housing Commission (2024) estimates the current shortfall at 245,000. Addressing the shortage over 10 years would result in an annual housing requirement of 68,500 per annum, significantly above current output levels.
4. Cyclicality of investment and capital production capacity
Perhaps the most enduring lesson from the Irish experience is the damage caused by procyclical investment policy. During the post–crisis downturn, investment in the construction sector collapsed. This contraction was not merely cyclical; it induced structural damage to delivery capacity. Construction workers emigrated, firms went bankrupt, and public sector capability in the management and delivery of major projects was eroded.
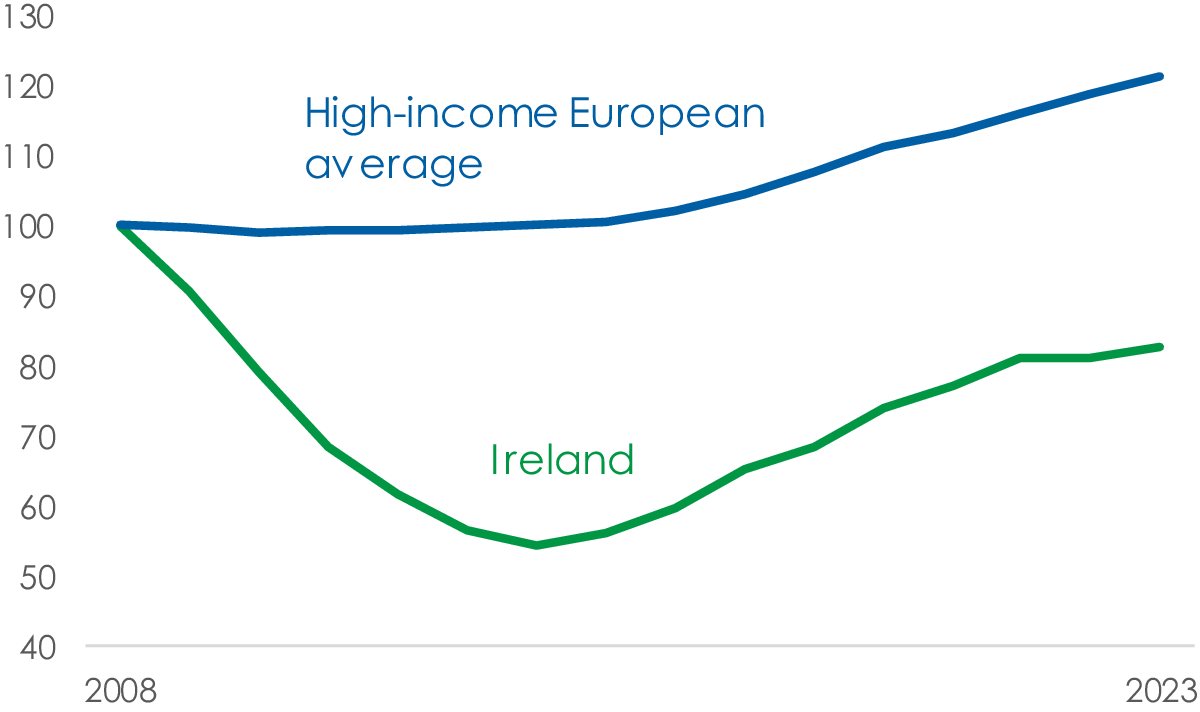
Investment within the construction sector has remained subdued since the financial crisis. The productive capital stock in the sector remains about 20% below its 2008 level and around 32% lower than in other high-income European countries (Figure 7). As such, the productive capacity of the construction sector is significantly lower compared to the past, and there is a large gap with other high-income countries.
Capital in the Irish construction sector has yet to recover from the financial crisis.
Productive capital stock, index 2008 = 100.
Sources: Eurostat and authors’ calculations.
Notes: High-income European countries consist of Austria, Belgium, Germany, Greece, Spain, Finland, France, Ireland, Italy, Luxembourg and the Netherlands.

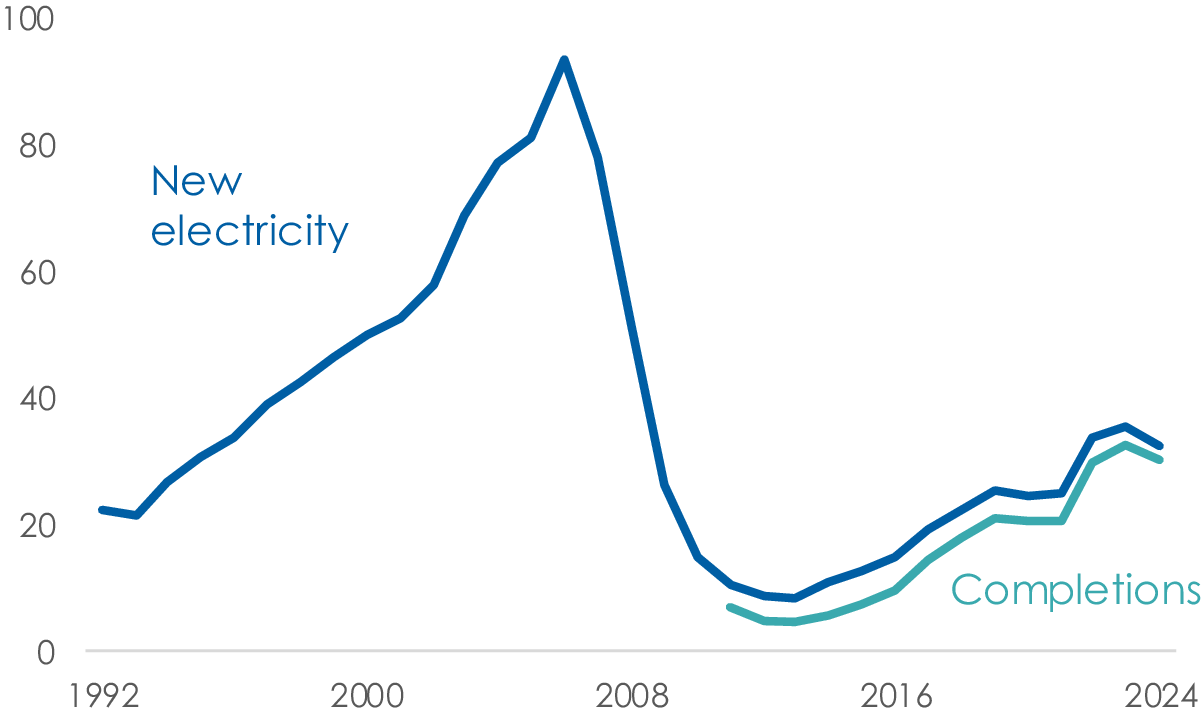
The post–2008 financial crisis period marked a severe downturn in construction activity, exemplified by the collapse of housing completions—from over 90,000 units in 2006 to fewer than 10,000 by 2011 (see Figure 8). On a per capita basis, housing completions were over seven times higher than in the UK in 2006, although both countries converged to similarly low levels by 2011. Over the same period, the construction sector’s share of total employment declined sharply from 12.6% in 2006 to 4.8% in 2011. The downturn in construction persisted throughout the following decade, with average annual completions between 2010 and 2019 reaching only 13,500 units, a stark contrast to the average of over 63,000 units recorded during the preceding decade (2000–2009) and well below the estimates of rising demand outlined earlier.
Housing completions have seen large swings.
Thousands of completions.
Sources: CSO.
Notes: Prior to 2011, the most reliable source of data for housing completions was new connections to the electricity network. This would slightly overestimate housing completions, as houses which were disconnected for more than two years or houses which were previously unfinished would be counted when (re)connected to the electricity network.

The long-term effects of this collapse in construction capacity continue to be felt, even amid a high-growth recovery. It has meant that it has been a challenge to scale investment even though Ireland’s corporate tax windfalls have created financial room for capital spending. Tight labour markets and thin construction capacity have acted as binding constraints. The result is a paradox: public demand for housing and infrastructure is urgent, and funding is available, yet delivery is impaired.
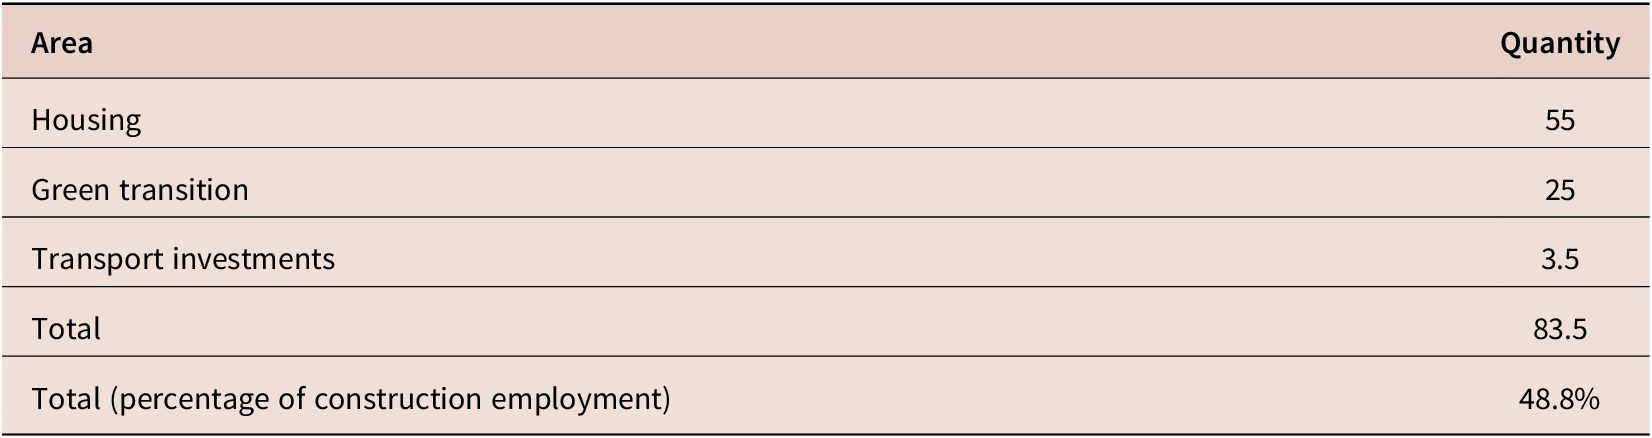
On the labour side, the construction sector requires tens of thousands of additional workers to meet the needs of housing, transport and green transition investment. Conroy and Timoney (Reference Conroy and Timoney2024) suggest that an additional 83,500 construction workers—equivalent to a 49% increase in construction employment—will be needed over the medium term to meet Ireland’s infrastructure requirements (Table 1).
Labour requirements for capital projects

Sources: Authors’ calculations, CSO and Kakkar, Farrell and Lynch (Reference Kakkar, Farrell and Lynch2024).
Notes: Additional construction workers required, thousands. Estimates assume no improvements in construction sector productivity. Kakkar, Farrell and Lynch (Reference Kakkar, Farrell and Lynch2024) had suggested 24,000 additional workers would be required for investments to meet renewable energy targets. However, as delivery has been somewhat delayed in the initial years of the projects, accelerated delivery may be required out to 2030. As a result, we increase the required number of workers to 25,000.
Addressing infrastructure deficits requires a substantial labour input, particularly in the construction sector. This demand poses challenges for the economy, particularly when large infrastructure deficits are apparent in multiple sectors. The unemployment and inactivity rates among workers previously employed in the construction sector are already notably low. Although apprenticeship and college applications in relevant fields have been increasing in recent years, they remain insufficient to meet labour needs in the short term. There is some scope for a reallocation of labour from within the construction sector from commercial real estate activity—where demand for office space has significantly declined since the pandemic—to residential and civil activity.
There is still a need for more workers. Historically, Ireland has successfully attracted international migrants to the construction sector. However, this channel may not be a panacea, as wage differentials between Ireland and countries from which construction workers have traditionally migrated have narrowed (Irish Fiscal Advisory Council, 2024) and additional workers also add to housing demand, at least in the short term. One policy lever that could be used is to increase the number of work permits for construction workers from non-EU countries. Less than 4% of all work permits issued in Ireland in 2024 were for construction-related activities.
Another option for increasing labour supply in the construction sector is training, but this is more of a medium-term option and requires sustained policy focus.
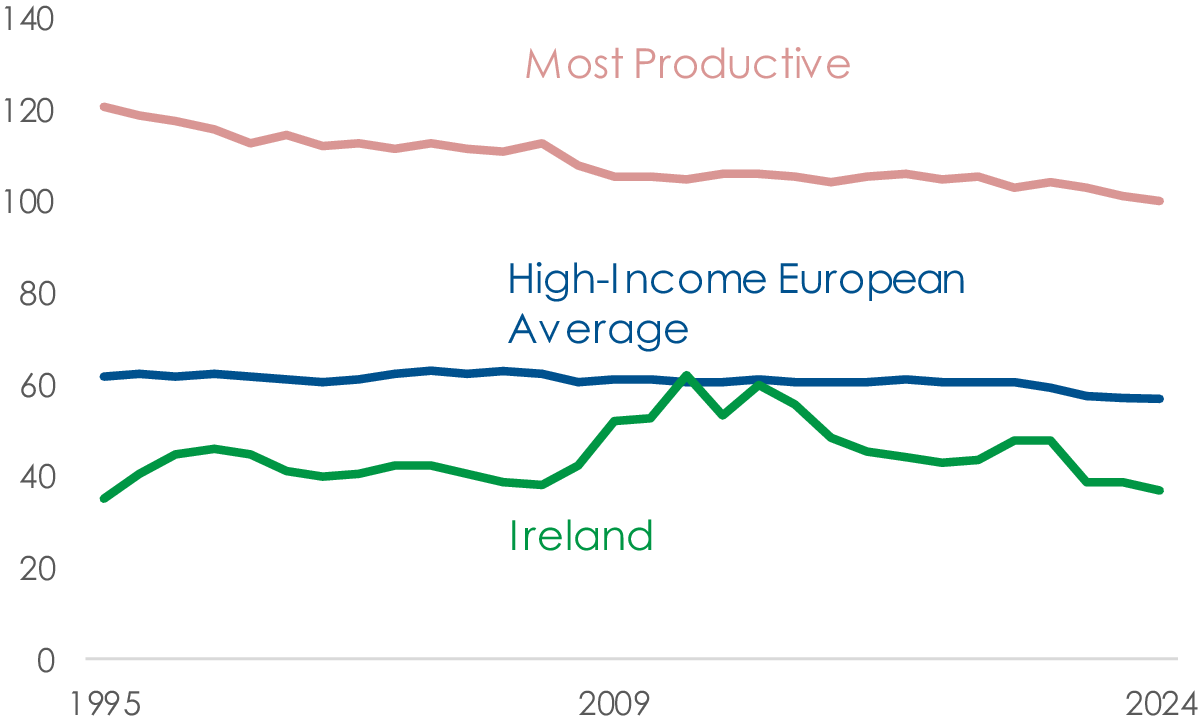
A key issue in addressing infrastructure deficits is relatively low productivity in the construction sector in Ireland. Productivity in the sector is significantly lower than in other high-income European countries (Figure 9). The construction sector’s historically low productivity in Ireland, relative to high-income peers, reflects regulatory fragmentation and limited adoption of modern techniques. For instance, the potential of modular housing has been stymied by inconsistent local authority standards. Without harmonisation and scale, efficiency gains remain elusive.
Productivity in the Irish construction sector is low.
Index: Construction output per hour worked.
Source: Eurostat.
Notes: Real construction output (Gross Value Added, 2015 prices) in the construction sector is used. This is then divided by hours worked in the construction sector. The high-income European countries used are Austria, Belgium, Denmark, Finland, France, Germany, Greece, Ireland, Italy, Luxembourg, Netherlands, Norway , Portugal, Spain, Sweden and Switzerland. Norway is the country with the highest productivity in every year examined.

If construction productivity were to increase to the rate prevailing in other high-income European countries, Conroy and Timoney (Reference Conroy and Timoney2024) show that the required increase in construction workers needed over the medium term would be substantially more manageable. Their estimates suggest that 16,900 additional workers, 9.9% of current construction employment, would be required if productivity in the Irish construction sector increased by 35% so it reaches the high-income European average (see Figure 9). This is down from needing 83,500 workers, or nearly 49% of current workers, without higher productivity.
4.1. Lesson 3: Countercyclical public investment can protect capacity and promote value for money
To mitigate these effects, a more countercyclical approach to public investment is warranted. One strategy involves maintaining a pipeline of ‘shovel-ready’ projects—initiatives that are fully planned and can be rapidly implemented in response to economic downturns (Haughwout, Reference Haughwout2019), particularly in construction.Footnote 3 The objective is to ensure policy agility: investment should be capable of ramping up when macroeconomic conditions allow or require it. Unfortunately, typical project lead times of three years mean governments miss windows of opportunity. Construction cycles do not align neatly with electoral cycles or fiscal space. Moreover, political and institutional hurdles—from procurement rules to interdepartmental coordination—further delay execution.
Such a framework would not only support employment and productive capacity during periods of weak private investment but also enhance value for money through more efficient resource allocation. However, the key challenge in implementing such a framework is the trade-off between the prioritisation of different infrastructure projects and the timing of investment, especially at present when the economy is operating at close to potential.
Such a framework, if in place, can help to deal with situations in which there are significant infrastructure deficits across various areas of the economy. Such deficits cannot be easily addressed in a single year. Prioritisation and multiyear planning are needed to address these deficits. A framework that is flexible to respond to changing needs, as well as changing economic circumstances, can ensure a closer-to-ideal aggregate capital stock and protect capacity in key capital-producing sectors.
5. The relationship between public and private investment
A natural question is whether we need state capital or whether we can rely entirely on the private market to provide the necessary capital stock. Where the economy fails to function efficiently due to market failures or distortions, there is a basis for justifying public intervention (Honohan, Reference Honohan1997). In choosing areas where state intervention is needed to provide public infrastructure, it is necessary to establish that market failure exists or may exist.
The rationale for public intervention can be classified under four headings, specifically (1) spending to provide services which are thought to have a ‘public good’ characteristic that would inhibit their optimal provision in the private sector, (2) schemes mainly designed to alter relative prices facing private firms and individuals in order to correct for some externality, i.e. ‘corrective subsidy’, (3) targeted schemes designed to alter behaviour where private agents are thought to be inadequately informed or where a specific externality exists and (4) subsidies primarily aimed at redistribution, e.g. social housing.
It is crucial that public investment stimulates, rather than displaces, private sector investment. For example, improved infrastructure can make private investment more profitable. But the interaction between public and private investment depends heavily on the economy’s position in its cycle. When the economy is operating near full capacity, there is a risk of overheating if public and private investments compete for limited resources.
6. Lesson 4: Crowding in private investment should be encouraged
In addition to its direct role in generating public capital stock, the state plays a central role in enabling private investment in other ways. In Ireland, as in many jurisdictions, the regulatory environment—especially the planning and legal systems—has become a major bottleneck. These areas should be the target of reform efforts especially at times when there is intense competition for investment resources or when financial resources for direct investment are reduced.
In Ireland, the housing market exemplifies this dynamic. Despite acute demand and public consensus on need, total housing supply remains inadequate. While there is certainly an argument for more social housing, the majority of housing in Ireland is provided by the private sector, and here, there are a series of additional challenges in encouraging private investment in housing project, particularly concerning the planning and legal system. These add uncertainty to projects, increase costs and ultimately impede private investment.
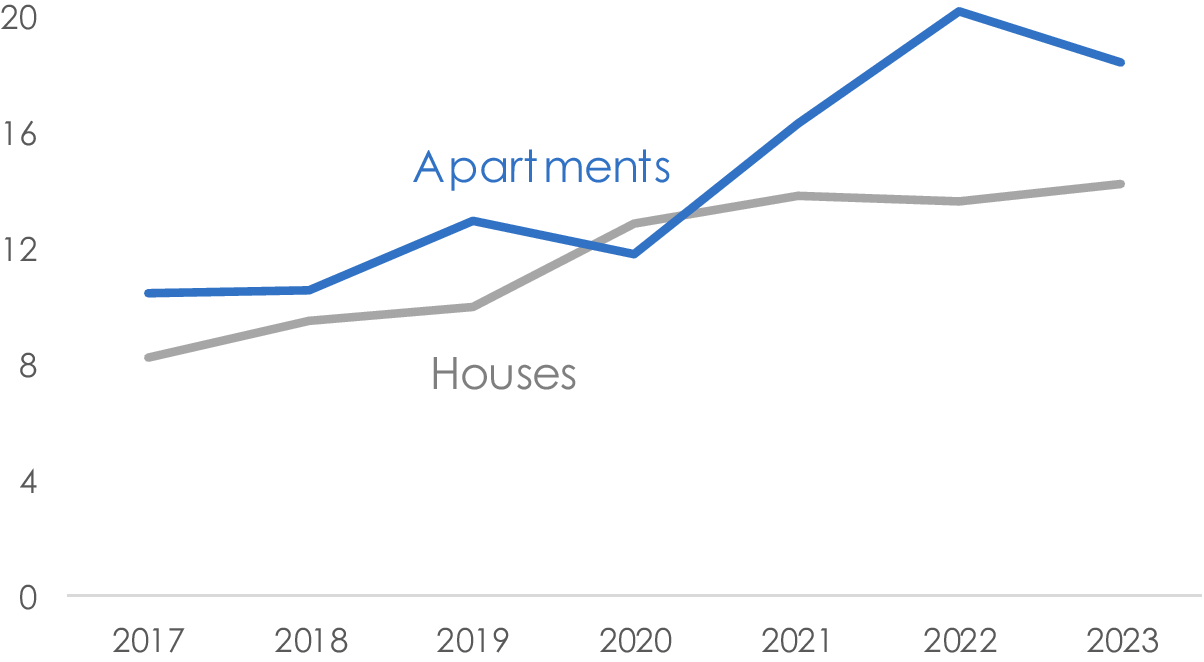
Planning approvals for large projects can take up to nine months, with further delays arising from judicial review. Some construction firms now retain legal counsel in anticipation of litigation—a symptom of systemic dysfunction. Figure 10 shows that there are growing delays between the granting of planning permission and the commencement of work in housing construction.
Long delays from planning to commencement.
Average time between planning to work commencing, months.
Source: Joyce (Reference Joyce2024).

These dynamics are not confined to housing. A slow and unpredictable planning system elevates the costs of infrastructure projects, rendering some unviable. In renewable energy, approval timelines are similarly long: Onshore wind projects face approval periods of up to nine years, compared to 3–5 years in most European countries (Draghi, Reference Draghi2024). Solar projects experience delays of 3.6 years, against a European average of 2.5.
Importantly, many of these barriers are not fiscal. They relate to policy design, administrative capacity and institutional coordination. Addressing them can unlock significant private capital with minimal public expenditure. The challenge lies in building systems that are predictable, transparent and efficient. This requires political commitment and cross-government coordination.
7. Climate investment: an area of strategic importance
There will always be certain areas that are considered strategically important for policy. In some cases, these will arguably be so big as to necessitate a departure from conventional fiscal rules. We can think of these areas of strategic importance as follows. These are domains where the long-term benefits significantly outweigh the immediate costs and where inaction carries substantial risks. Recognising strategic dimensions is paramount to how we might craft fiscal rules that genuinely serve a nation’s long-term prosperity.
For Ireland, climate-related spending unequivocally falls into the area of strategic importance. Unlike conventional public spending, spending on climate can generate enduring benefits that extend far beyond the short term. It can help enhance energy security, reduce reliance on volatile, expensive and polluting fossil fuel imports, improve public health, help stave off the effects of climate change, cultivate new innovative industries and avoid legislated costs associated with missing climate targets.
Climate-related expenditure is likely to be large initially. But it can significantly improve outcomes in many areas.
-
• Reduced Running Costs: Climate investment lowers energy and fuel bills for households and operational expenses for businesses freeing up expenditure for other productive uses.
-
• Innovation and Growth: It spurs innovation and growth in sectors that will be crucial components of tomorrow’s economy, marking out a competitive advantage, potentially crowding in further private investment and expertise into these vital areas.
-
• Environmental Obligation: The overwhelming scientific consensus on the need to limit climate change, underscored by the Intergovernmental Panel on Climate Change, means that it is essential that Ireland and others meet climate commitments.
-
• Improved Public Health: Reduced fossil fuel use leads to better air quality and, if widely acted on, helps reduce heat-related illnesses and hospitalisations. Evidence for Ireland suggests temperature increases of 1 to 1.6 °C by 2041–2060 compared to 1981–2000 would increase emergency heat-related hospitalisations by 12% (Duffy et al., Reference Duffy, de Bruin, Henry, Kweku-Kyei, Nolan and Walsh2024). More generally, a healthier population would be expected to have lower rates of absenteeism, increased well-being and higher productivity.
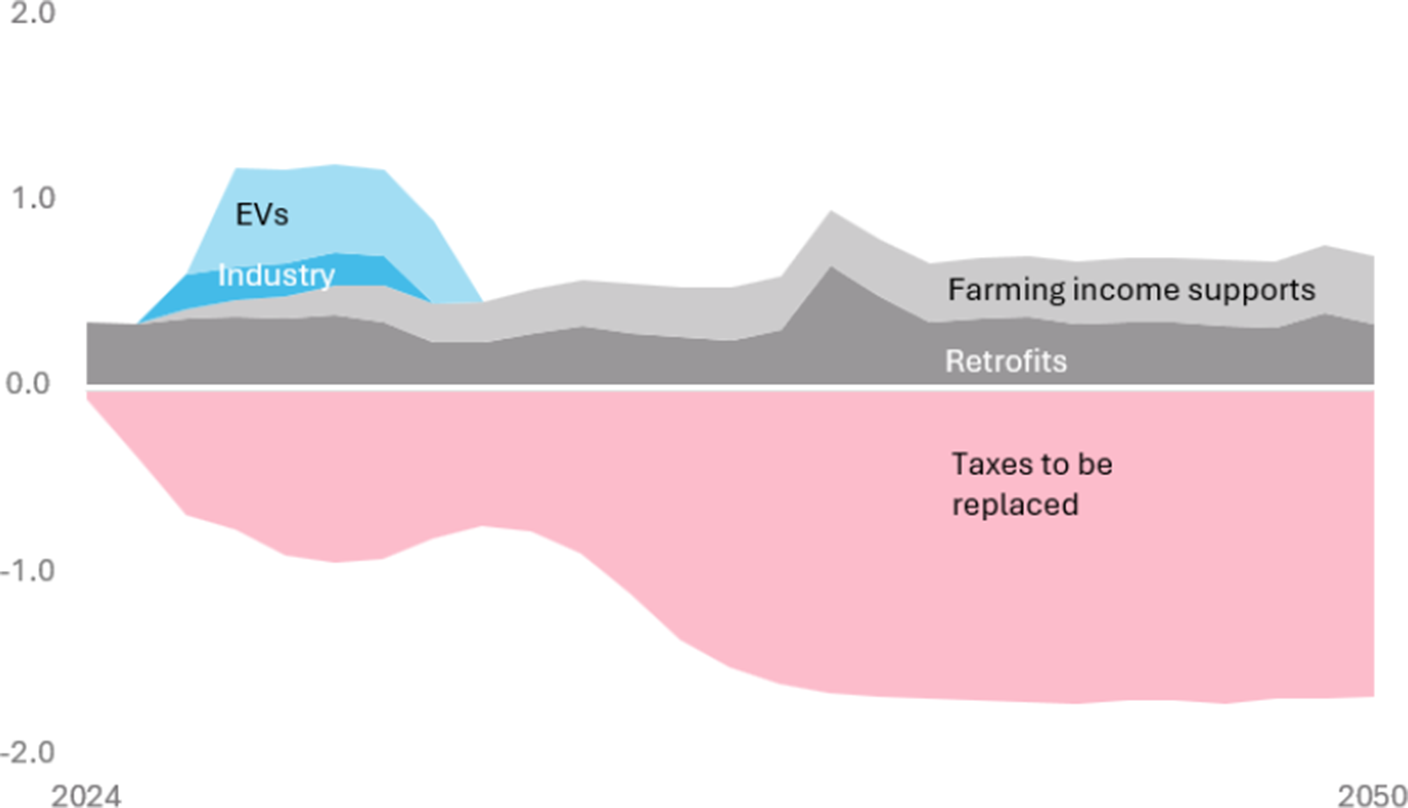
To transition to net zero by 2050, Casey and Carroll (Reference Casey and Carroll2023) estimate that Irish governments need to allocate about 0.6% of national income every year on average to spending in support of the transition (Figure 11). Out to 2030, costs could be slightly higher at about 1% per annum. This would help accelerate the initial adoption of electric vehicles and support industry efforts on carbon capture and storage. These costs are not trivial, but in many cases this is expenditure that could be redirected from existing long-term capital allocations broadly falling in the environmental or transport areas. Moreover, the direct costs should mostly be transitional and the ultimate cost to the state might be lower than expected.
Public climate spending is relatively small.
% GNI*, transition fiscal impacts under net-zero scenario.
Source: Casey and Carroll (Reference Casey and Carroll2023).

Revenue reductions pose a far greater fiscal impact. If today’s tax system were left unchanged, Ireland would eventually face an annual reduction in revenues equivalent to 1.7% of national income. This would reflect sharp decreases in fuel use, the fact that electricity attracts lower Value-Added Tax (VAT) rates and the fact that Electric Vehicles (EVs) attract lower rates of annual motor tax and registration tax.
While the environmental importance of such changes is welcome, the challenge to the existing tax system should not be underestimated. A key point here is that the revenue reductions faced in a net-zero transition would be equivalent to a tax cut. The reductions assume that the transition happens and that today’s tax system, with its reliance on fossil fuel revenues, is not modernised. In other words, replacing these revenues, while challenging, would not be an effective tax increase, merely a switch to alternative revenue sources that would counteract a drop in the revenue-to-output ratio that would otherwise take place.
If Ireland fails to make its transition, it potentially faces substantial costs related to its agreed targets. A report by the Irish Fiscal Advisory Council and Ireland’s Climate Change Advisory Council (2025) looks at the cost to Ireland of missing its EU climate commitments. It estimates that unless it goes beyond existing policy measures, the government could face up to €26.6 billion in costs from missing its targets (nearly 6% of GNI*). This outlay would exceed the estimated transition costs between 2025 and 2030 depicted in Figure 11.
There is substantial uncertainty around the EU’s climate architecture and doubts about whether it will be enforced. The legislation is split across many areas, and determining the prices to use on gaps to targets is especially difficult. The Effort Sharing Regulation covers emissions from domestic transport, buildings, small industry, waste and agriculture. Under this, Ireland would have to purchase the gap to its targets if it emits more than allowed from overperforming countries—those that reduce their emissions more than required. Two other pieces of legislation pose smaller yet still significant costs. They cover land use and forestry and the share of energy coming from renewable sources.
Policymakers would be wise to avoid complacency. Policymakers might be tempted to think that enforcement at the EU level will weaken in time. But there are reasons to doubt that. Some overperforming countries, such as Spain and Portugal, stand to benefit from the regime and thus have an incentive to see it enforced. Other underperformers, like Germany and Italy, face much smaller burdens relative to the size of their economies—as little as one-fifth of Ireland’s burden when scaled to the size of their economy. They might see it better to accept and pay these costs rather than upend Europe’s climate architecture.
Given existing legislation, Ireland’s climate action is an unavoidable necessity reflecting Ireland’s international commitments to supporting the EU’s efforts to achieve carbon neutrality by 2050. It also reflects legislation introduced by the previous Irish coalition government. This legislation sets a series of carbon budgets that aim to reduce greenhouse gas emissions, broadly consistent with European objectives. Failure to meet these commitments not only carries the risk of substantial financial costs but also undermines Ireland’s role in global efforts to combat climate change.
7.1. Lesson 5: There is a benefit to planning carefully and acting sooner when facing long-term challenges
Ireland’s experience underscores the urgency and importance of strategic climate investment. By investing in upgrading Ireland’s energy grid and supporting the uptake of electric vehicles, Ireland could promote a healthier, more sustainable and energy-secure society, ultimately boosting economic activity. Moreover, investment sooner can help Ireland to avoid the potential costs of missing Ireland’s EU climate targets. As these costs are estimated to be substantial, it makes much better sense to avoid these outlays and instead direct resources now towards transformative investments in Ireland’s energy infrastructure, electric vehicle adoption and sustainable land management.
A similar argument can be made to address the demographic challenge faced by most advanced economies. As the population ages, due to falling birth rates and, especially, falling mortality rates, existing pay-as-you-go pension systems in many countries become unsustainable. There are also forecastable increases in health expenditure associated with an older population. Changes to address these challenges are often politically unpopular, but in the Fiscal Council’s Long-Term Sustainability Report we showed that acting sooner would ultimately cost less (Irish Fiscal Advisory Council, 2020). Specifically, if fiscal adjustments took place from 2026 to 2035, they would be less than half the scale of required adjustments if delayed until 2036–2050. Timely action to reform the pension system, including pension age increases, can reduce the impact of ageing costs.
8. Improving public investment frameworks
The previous lessons highlight that there is much that can be done to improve public investment. In this section, we outline suggestions for changing the systems for fiscal policy management.
8.1. Design suggestion 1: rethinking fiscal rules for investment
A central policy recommendation is to revise fiscal rules to better accommodate productive investment. Public capital formation should be protected from cyclical cuts and viewed through a long-run lens. One approach is to introduce a benchmark floor for investment—e.g. 3% of gross domestic product (GDP). This need not be a formal rule, but it can serve as a powerful signalling device.
And for some types of investment, it may be useful to think about them outside the traditional spending rules. Continuing from the previous section, to the extent that climate transition is a strategically vital undertaking that offers a unique pathway to long-term economic growth, we should view much of public spending on the climate transition as not merely an expenditure item to be weighed against others within standard fiscal rules. A differentiated approach to fiscal rules is warranted to prioritise and facilitate the necessary investments. By recognising the profound and multifaceted benefits of climate action, Ireland can secure a more sustainable, prosperous and resilient economic future.
8.2. Design suggestion 2: strengthening investment management frameworks
Beyond funding, the quality of public investment management is critical. Ireland’s recent experience underscores this point. Flagship projects—such as the National Children’s Hospital and the National Broadband Plan rollout—have experienced cost overruns exceeding 200%, undermining credibility and public trust.
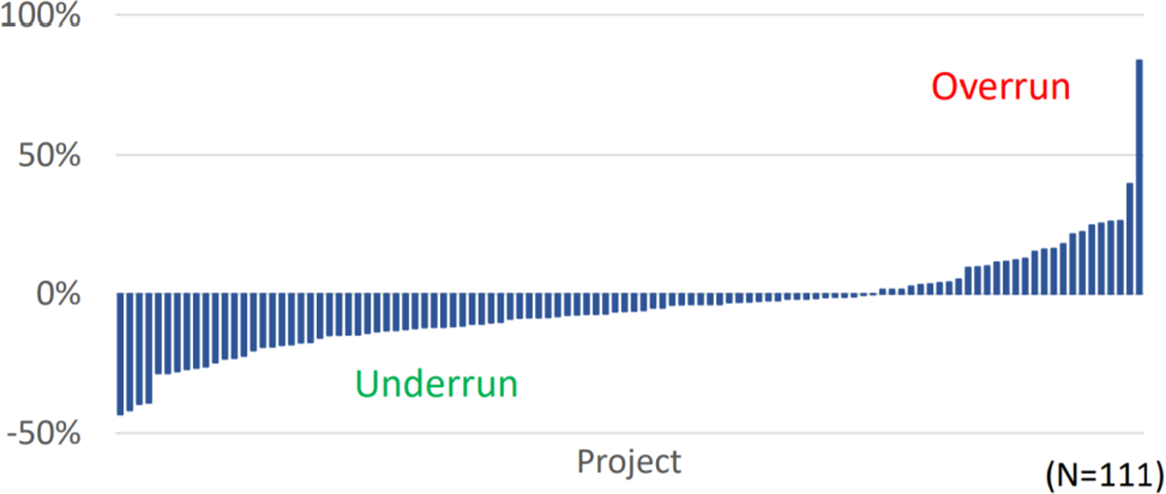
The Norwegian State Project Model is a good example of how public investment can be managed well. It offers a model of disciplined, transparent investment governance. The Norwegian system emphasises front-end project appraisal, with strong departmental buy-in central oversight, and assurances from external experts. Projects exceeding a certain threshold (approximately €100 million) undergo rigorous evaluation, though often taking less than a year and costing under 0.2% of the total project value. By making important decisions before work commences, this ‘concept’ framework has significantly reduced overruns and improved delivery. Figure 12 shows that projects have typically been delivered on or under budget.
Norwegian state capital projects have typically been delivered on budget.
Percentage deviation from budget including contingency (P85).
Source: Welde (Reference Welde2025).

Key features of this system include structured project selection, integrated social value assessments and contingency funding managed at the departmental level. The quality assurance aspect at the entry stage and just before execution is a key component of this framework. Importantly, these quality assurance processes are done concurrently with other front-end activities, so they do not cause significant delays to projects commencing. The Norwegian approach is principle-based and enjoys strong institutional support. Impressively, the whole process is underpinned by a less than 20-page guide; this stands in stark contrast to the voluminous planning documents produced in other jurisdictions.
The implication is clear: better planning reduces uncertainty, lowers costs and increases the probability of timely, on-budget delivery. For Ireland and other countries grappling with delivery challenges, the Norwegian model offers a compelling blueprint. It is not merely about technical procedures but about building state capacity, fostering interdepartmental coordination and embedding accountability into every stage of the investment cycle.
9. Conclusion
We believe that the Irish case offers a rich set of lessons on the challenges of delivering sustained, effective public investment. These insights highlight the need for better forecasting, more agile institutions, coherent fiscal rules and stronger public investment management. If implemented, these reforms could transform investment from a source of vulnerability into a pillar of sustainable, inclusive growth.

 Open access