

1. Introduction
Nowadays, wireless communication technologies are rapidly evolving to accommodate people’s demands and requirements, which are changing exponentially [Reference Develi1]. As wireless technology advances, the need for spectrum resources is increasing, which has resulted in a scarcity of spectrum due to a static spectrum allocation policy. On the contrary, recent studies on current spectrum allocation show the underutilization of the allocated spectrum to the licensed user at any specific location and time. Cognitive radio has been identified as a possible technology for addressing the issues of spectral scarcity and underutilization [Reference Srinu, Sabat and Udgata2].
Cognitive radio (CR) is a critical technology that allows for more efficient use of restricted and inefficiently utilized frequency bands using an opportunistic manner [Reference Develi1]. CR has four main tasks/functions: spectrum sensing (SS), spectrum decision/management, spectrum sharing/allocation, and spectrum mobility/handoff. SS is used to determine the portion of the spectrum that are vacant and senses the presence of licensed primary users (PUs). Spectrum management selects the most suitable vacant spectrum holes among the detected ones. The goal of spectrum sharing is to evenly or fairly distribute the spectrum holes among the secondary users (SUs). Spectrum mobility aims to maintain communication while transitioning to better spectrum holes [Reference Fawzi, El-Shafai, Abd-Elnaby, Zekry and Abd El-Samie3, Reference Tomar, Bagwari and Kanti4].
Among all functions of CR, SS is regarded as the most critical component in its establishment. A number of SS methods have been suggested in recent decades, which can be classified into two categories based on the bandwidth of interest for spectrum sensing: wideband and narrowband. Narrowband spectrum sensing examines a single frequency band at a time, whereas wideband spectrum sensing analyzes multiple frequencies simultaneously [Reference Arjoune and Kaabouch5]. Another way to categorize sensing techniques is by the requirement for prior information of PU signals, which are classified as coherent and noncoherent detection. However, spectrum sensing techniques are popularly classified into three different techniques for sensing spectrum holes: transmitter-based, interference-based, and receiver-based detection. In this study, we only look at transmitter-based detection. Under transmitter-based detection, many techniques are presented such as eigenvalue detection, energy detection (ED), cyclostationary feature detection (CFD), and matched filter detection (MFD).
In this study, ED is generally adopted for SS due to its noncoherent method, in which the SU receiver requires no prior information about PU signals. It has a low computational complexity and a fast sensing time. However, noise uncertainty, which is the random or unpredictable and unavoidable variation of noise in any wireless communication system, severely reduces ED performance, especially when SNR is low [Reference Prieto, Andrade, Martínez and Galaviz6]. Many methods have been proposed to address the challenges of ED. Among those methods, entropy detection becomes the most robust one due to the noise uncertainty at low SNR values. Furthermore, because it does not require prior information about primary signals, its implementation complexity is comparable to that of ED. There are many types of entropy detection, such as Shannon, Renyi, Kapur, and Tsallis entropy. So, by comparing these types of entropy with each other, the one that outperforms better is examined in this study for developing two-stage SS with conventional ED (CED).
In this study, to address the challenges of ED and to further enhance the performance of entropy-based detection, two-stage SS techniques are proposed, using conventional energy detection (CED) and best performer entropy types among the entropies listed above. Because it accomplishes SS within the shortest time and provides accurate detection at high SNR values, ED is used as the coarse stage (first stage) for the proposed technique. However, due to its robustness to noise uncertainty in low SNR values, the best performer entropy detection technique is used in the fine stage (second stage).
The main contributions of this study are as follows.
We applied different types of entropy-based detection to alleviate the performance degradation of CED, which occurs at low SNR condition due to uncertainty of noise. Moreover, the performance comparisons among various types of entropy detection are performed to choose the best performer entropy method.
Depending on the results found from the comparison, a novel two-stage spectrum sensing techniques are developed using CED as a coarse stage and the best performer entropy detector as a fine stage.
The two most important parameters used to evaluate the performance of any SS method are probability of detection (Pd) and probability of false alarm (Pf). The probability of correctly detecting the presence of a primary (licensed) user is denoted by Pd. As a result, a high Pd is preferable because it ensures less interference to primary users. Pf is the probability of incorrectly declaring the primary user presence.
The structure of this study is as follows: Section 2 presents a review of various works that are closely related to the proposed system, and Section 3 discusses a system model of conventional energy detection, entropy detection, and the proposed two-stage spectrum sensing. In Section 4, the simulation results using MATLAB 2020a are presented with their discussion. Finally, Section 5 brings the study to a close and makes suggestions for future research.
2. Related Works
In [Reference Venkatapathi, Khan and Rao7], the performance of SS (spectrum sensing) for CR was examined under noise floor and low SNR values were presented. This study combines dynamic or adaptive threshold ED with the kernel principal component analysis (KPCA) to overcome the vulnerability of energy detection (ED) to noise uncertainty at low SNR values. A novel mathematical approach is proposed to obtain the optimal sensing duration for energy detection and to analyze the effect of sample numbers on the existence of noise uncertainty in [Reference Mahendru, Shukla and Banerjee8]. In [Reference Sahithi, Priya and Pratap9], an investigation of the use of ED for spectrum sensing technique in CR is presented. In this study, the concept of different types of spectrum sensing techniques with their theoretical and mathematical formulas is discussed clearly. In this study, the ED method is one of the SS techniques that is analyzed in detail. An energy detection method is used to detect the unused portions of the spectrum and make them available for reuse. Using the energy detection method, we can identify and allocate gaps in the spectrum to secondary users. Also, the effects of fading, shadowing, and hidden terminal problems on detection performance are discussed. This study analyzes energy detection techniques well, but it fails to detect PU signals at low SNR levels.
In [Reference Prieto, Andrade and Martínez10], a numerical analysis of histogram-based estimation techniques for entropy-based spectrum sensing is proposed. In this study, spectrum detection based on entropy had been proposed to sense primary transmission in cognitive radio network (CRN). To estimate entropy, the histogram method was used. The performance of the entropy-based detection with respect to several rules for calculating the number of bins in the histogram is evaluated. It demonstrated that the performance of detection is different for each of the aforesaid rules due to the probability distribution of the PU signal. The main focus of this study was on the optimal determination of number of bins. However, the current hot research topics on the area of CRs are improving the performance of spectrum sensing at low SNR. In addition, the Shannon entropy is the only subject of this work. Other types of entropy, such as Renyi, Kapur, and Tsallis entropy, are not included.
The authors in [Reference Kumar and Goyel11] present a comparison of Tsallis and Kapur entropy in communication systems. This work focuses on analyzing the best entropy in communication system among the Kapur, Tsallis, and generalized entropy. The authors of [Reference Sabat, Srinu, Raveendranadh and Udgata12] considered a cyclostationary feature for cognitive radio based on entropy estimation to enhance the SS. In this study, the proposed algorithms are verified under single-node and multi-node/cooperative situations. In [Reference Chen and Nagaraj13, Reference Vaidehi, Swetha and Sastry14], entropy-based spectrum sensing for cognitive radio is proposed. A numerical study is performed in [Reference Prieto, Andrade and Martínez10] to analyze histogram estimation methods for entropy-based SS. The performance of the entropy-based detection is evaluated in this study in relation to numerous rules for calculating the number of bins in the histogram.
In [Reference Fawzi, El-Shafai, Abd-Elnaby, Zekry and Abd El-Samie3], two-stage SS techniques for CR with adaptive thresholds are proposed by combining two-well techniques: wavelet denoising and energy detection. In this study, an ED technique is used to determine the availability or presence of PU signal in the presence of a high SNR value by comparing the energy of the received signal with values of the threshold. However, in the presence of low SNR values, a wavelet denoising stage is used prior to energy detection (ED) to decrease the noise influence and to sense the PU signal in noisy environments. The authors of [Reference Li, Wang and Kuang15] present a two-step SS technique for cognitive radio networks (CRNs). In this work, two-step techniques are implemented using energy detection (ED) as the first stage and maximum eigenvalue detection (MED) as the second stage. According to the comparison results of this study, the proposed method takes less sensing time than MED and ED while achieving approximately the same sensing performance as MED. In [Reference Wasonga, Olwal and Abu-Mahfouz16], an improved two-stage SS for CRNs is proposed. The author focuses on resolving the non-optimality issues occurring in the spectrum sensing performance of two-stage and improves the probability of detection.
In [Reference Mashta, Wainakh and Altabban17], new parallel fully blind multistage detectors are proposed. Appropriate stages are assumed based on the estimated SNR value that is achieved from the SNR estimator. Energy detection is used in the first stage for its simplicity and sensing accuracy at high SNR. For low SNR, a maximum eigenvalue detector techniques with different smoothing factors are adopted for higher stages. The sensing accuracy for maximum eigenvalue detector increases with an increase in smoothing factor. Also, they analyzed the performance of two cases of the proposed detector: two-stage and three-stage schemes. However, the computational complexity at the higher stages becomes increased due to the use of eigenvalue detector and an increase in smoothing factor. The authors of [Reference Paul, Kunarapu, Banerjee and Maity18] presented the SS in cognitive vehicular networks for uniform mobility model. In this study, cooperative spectrum sensing (CSS) based on ED scheme is enabled for CR vehicular networks by considering the velocity of PU and SU nodes as a uniform motion. Initially, a distance-dependent distribution function is proposed to find the probability of a secondary user resides in particular coverage of the PU transmission zone.
In [Reference Paul and Maity19], a machine learning for spectrum information and routing in multi-hop green CRNs is presented. In this study, a support vector machine (SVM) is used for predicting PU activity without accomplishing any SS task in system operation. After that, a deep Q-network (DQN)-based energy and spectrum efficient routing strategy is suggested to maximize the CRN throughput. In [Reference Wu, Wang and Yuan20], an intelligent reflecting surface (IRS)-enhanced ED for SS in CRNs is proposed. This study clearly discusses both situations where the PU is directly connected to SU and those where they are not. Furthermore, IRS-enhanced ED for cooperative SS is also proposed to improve the detection performance of SS. The authors in [Reference Paul and Maity21] present a kernel fuzzy C-means clustering (KFCM) on ED-based cooperative SS. This study focuses on enhancing the performance of detection using KFCM rather than fuzzy C-means clustering (FCM). There are two types of KFCM, which are KFCM-K and KFCM-F. The KFCM-F forms are considered in this study since it does not require an inverse mapping from kernel space. The summary of recent research paper is listed in Table 1.
3. System Model
In this section, the spectrum sensing (SS) methods such as energy detection, entropy-based detection, and the proposed two-stage SS are discussed. Each method of SS has its own set of benefits and drawbacks.
The main task of SS in CRNs is to determine whether an authorized PU (primary user) is present or not on a given channel, so that secondary users can efficiently access and exploit the unoccupied or unused spectrum. SS depends on a well-known method known as signal detection. In a noisy environment, signal detection methods are used to detect the availability of signal. Signal detection could be simplified to a basic identification problem that can be formulated as hypothesis test analytically [Reference Abdo-tuko22]. Generally, spectrum sensing can be modeled as a binary hypothesis problem in the detection theory and can be given as [Reference Bagwari and Tomar23]follows:

where n = 1, 2, 3, …, N is the sample number of the sampled signal that has been received, y (n) is the sampled signal that has been received by secondary users, w (n) is the noise introduced by AWGN (additive white Gaussian noise) channel with zero mean and variance
 , s (n) is the signal from PU with variance
 and zero mean, h is the impulse response of the channel or the channel amplitude gain between PU transmitter and secondary user (SU) receiver since we use AWGN channel h = 1. H0 and H1 represent absence (null hypothesis) and presence (alternative hypothesis) of the PU, respectively.
3.1. Energy Detection
Energy detection (ED) is one of the most frequently used approaches, and because of it, it requires no prior information about the PU signal and has small computational complexity. Figure 1 depicts the ED block diagram, which is used to identify whether or not PU is present in a given channel. Initially, an ideal band pass filter with a bandwidth of interest is used to prefilter the received signal in an ED. Then, the filtered signal is fed into ADC (analog-to-digital converter) converter. After that, the ADC output signal is squared and integrated over the predetermined time interval. The obtained signal from the integrator is used to develop a test statistics [Reference Develi1]. Finally, the defined or developed test statistics are compared with a predefined threshold “
 ,” to identify whether or not the licensed user is present. Test statistics of ED is given as [Reference Bagwari and Tomar23]follows:

where T(y) represents the test statistics of ED.
Block diagram of energy detection.

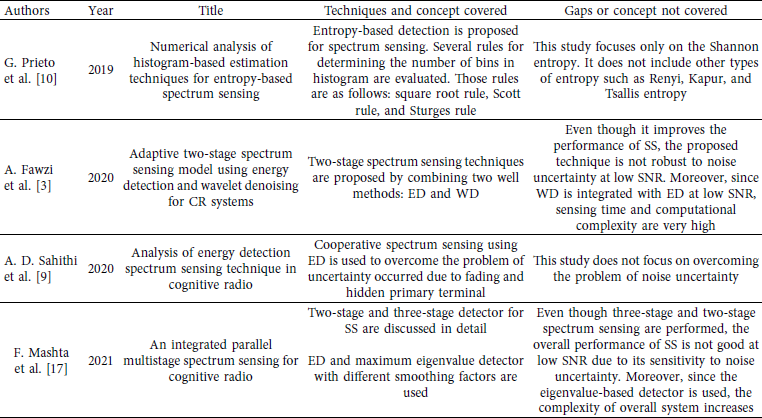
The detection probability (Pd) and false alarm probability Pf are two parameters used to evaluate the detection performance of any SS method. Pd and Pf are associated with a specific threshold λED that test decision statistics [Reference Bagwari and Tomar23]:


where T denotes the test statistics, λED is the predefined threshold of ED, N is the sample number,
 is the variance of AWGN, and
 is the variance of PU signal.
Here,

where Q (x) is Q function.
The detection threshold can be given as follows:
3.2. Entropy-Based Detection
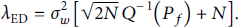
Figure 2 shows the basic block diagram of entropy-based detector. After applying DFT to a binary hypothesis given in equation (1), we get the following:
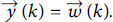
where
 ,
,
 , and
, and
 are frequency spectrum representation of the primary user (PU) signal, received signal, and noise signal, respectively.
Block diagram of entropy-based detector.

Numerous methods for predicting the entropy (randomness) of random variables depending on a limited set of observations have been suggested. Entropy estimation based on histogram is evaluated in this study due to its lower complexity.
By splitting the ranges of (
 ) of values in y into L bins of constant width A, the data set for histogram, which is
 , is obtained. Let nk denotes the number of items in y that fall within the kth bins such that
 [Reference Prieto, Andrade, Martínez and Galaviz6, Reference Prieto, Andrade and Martínez10, Reference Vaidehi, Swetha and Sastry14]. After constructing the histogram, the entropy, which is denoted by E, is calculated as follows.
The Shannon entropy formula is given by the following equation [Reference Prieto, Andrade and Martínez10, Reference Vaidehi, Swetha and Sastry14]:
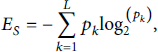
where E S is Shannon entropy, L is the number of bins, and P k is the frequency of occurrences in kth bins.
The Renyi entropy formula is given by the following equation [Reference Vaidehi, Swetha and Sastry14]:

where E R is Renyi entropy, α is the order of entropy, L is the number of bins, and P k is the frequency of occurrences in kth bins.
The Tsallis entropy formula is given by the following equation [Reference Kumar and Goyel11, Reference Vaidehi, Swetha and Sastry14]:

where E T is Tsallis entropy.
Kapur’s entropy formula is given by the following equation [Reference Kumar and Goyel11]:

where E K is Kapur’s entropy, α is the order of entropy, and pk is the frequency of occurrences in kth bins and is given as [Reference Prieto, Andrade and Martínez10, Reference Vaidehi, Swetha and Sastry14]follows:

By substituting equation (13) in equations (9), (10), (11), and (12), we get the test statistics [Reference Prieto, Andrade and Martínez10, Reference Vaidehi, Swetha and Sastry14].

The detection threshold is determined as [Reference Prieto, Andrade and Martínez10, Reference Vaidehi, Swetha and Sastry14]follows:
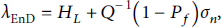
where

In Gaussian noise entropy, the number of bins is denoted by L, γ represents Euler–Mascheroni constants, Pf is false alarm probability, and σn is the standard deviation of H under H0.
3.3. Proposed Two-Stage Spectrum Sensing
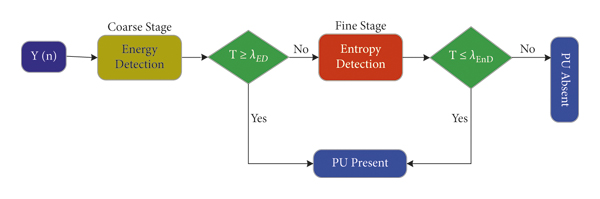
In this study, two-stage SS techniques are developed to enhance the performance of detection as shown in Figure 3. In the first stage (coarse stage), ED is used because it has faster sensing time than other methods, and then, the average power of the received signal is compared with a threshold λED; if it exceeds λED, then the channel is declared to be occupied by PU; else, we proceed to the second stage. In the second stage (fine stage), one of the entropy-based detection methods that outperform other methods of entropy is used, and then, statistical tests are executed using entropy formulas and compared it with a threshold λEnD to decide whether channel is idle or occupied.
System model for proposed two-stage spectrum sensing.
The general mathematical equations for false alarm probability and detection probability in two-stage SS are given as follows, respectively:


where Pfa is false alarm probability of overall system, Pd is detection probability of overall system,
 is false alarm probability of coarse stage,
 is false alarm probability of fine stage,
 is detection probability of coarse stage, and
 is detection probability of fine stage.
4. Simulation Results
In this section, the simulation results of energy detection, entropy-based detection, and two-stage detection are discussed using MATLAB version 2020a. Simulations are provided to evaluate the performance of the proposed two-stage SS with respect to conventional energy detection and entropy-based detection under AWGN channels. 10,000 Monte Carlo simulations and 1000 sample number were used to generate the simulation results. According to IEEE 802.22 standard, all simulations must take into account the requisite detection probability (≥90%), the probability of false alarm (≤10%), and the probability of miss-detection (<10%) for cognitive radio. SNR wall is a key factor evaluated in all graphs of the result to compare the proposed techniques with the existing ones. Moreover, SNR wall is used to compare various types of entropy-based detection with each other. The minimal SNR below which detection is not possible is referred to as the SNR wall.
Figure 4 depicts the relationship between detection probability (Pd) and SNR for conventional energy detection (CED) and various types of entropy-based detection at a probability of false alarm (Pf = 0.1), number of bins (L = 15), and order of entropy (α = 4). Any spectrum sensing technique with a detection probability greater than or equal to 0.9 (≥90%) can distinguish PU signal from noise signals, according to IEEE 802.22 standards. As observed, Tsallis entropy, Shannon entropy, energy detection, and Kapur’s entropy detect primary user (PU) signal at SNR wall of −7 dB, −9 dB, −10 dB, and −14 dB, respectively. However, the Renyi entropy detects the PU signal at an SNR wall of −20 dB. Renyi entropy detection has a significant improvement of about 13 dB, 11 dB, 10 dB, and 6 dB in SNR wall compared with Tsallis, Shannon, and Kapur entropy, respectively. Depending on this result, the Renyi entropy can detect a weaker PU signal than other entropy methods since it has a lower SNR wall than others. The detection technique with a lower SNR wall value has better sensitivity. Hence, it can be concluded that the Renyi entropy detection outperforms both CED and all other types of entropy.
P d vs. SNR at Pf = 0.1 and α = 4 for CED and different types of entropy.

Figure 5 depicts the receiver operating characteristic (ROC) curve for both CED and various types of entropy-based detection at SNR = −18 dB. This simulation is done by setting the number of bins to 15 and the order of entropy to 4. As shown in Figure 5, an increase in the probability of false alarm enhances the detection probability of entropy. Renyi entropy-based detection achieves the desired probability of detection (Pd ≥ 0.9) with the lowest probability of false alarm when compared to other methods. As illustrated in the figure, the Kapur entropy has better performance than the Shannon and Tsallis entropy. Also, the Shannon entropy has a better probability of detection than the Tsallis entropy. As observed, the Renyi entropy achieves the desired probability of detection with 0.05 probability of false alarm, while the Kapur entropy, Shannon entropy, Tsallis entropy, and CED achieve it with 0.22, 0.33, 0.36, and 0.9, respectively. The detector with a higher probability of false alarm leads to poor spectrum utilization. Hence, it can be deduced that the Renyi entropy outperforms all other methods since it requires a lower probability of false alarm to obtain the required detection probability than the others.
ROC curve for CED and various types of entropy detection at SNR = −18 dB.

Figure 6 depicts the complementary receiver operating characteristics (CROC) curve for both CED and various types of entropy-based detection at SNR = −18 dB. As it can be seen, the Renyi entropy-based detection has the lowest probability of miss-detection when compared to other methods. The method with the lowest miss-detection probability can make efficient use of the spectrum holes.
CROC curve for CED and various types of entropy detection at SNR = −18 dB.
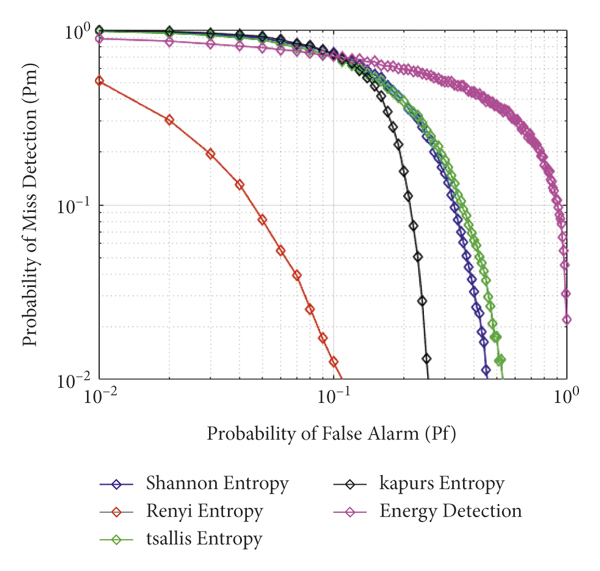
Figure 7 illustrates the impact of the number of bins on the Renyi entropy-based detection. As observed from the figure, the detection probability decreases as the number of bins increases. When the number of bins is 15 (L = 15), the Renyi entropy detection can detect the primary signal up to −20 dB SNR values, whereas at L = 17 and L = 20, it can detect the PU signal up to −19 dB and −18 dB, respectively. As a result, the sensing performance of entropy detection increases as the number of bins decreases.
P d vs SNR curves for Renyi entropy detection at various numbers of bins.
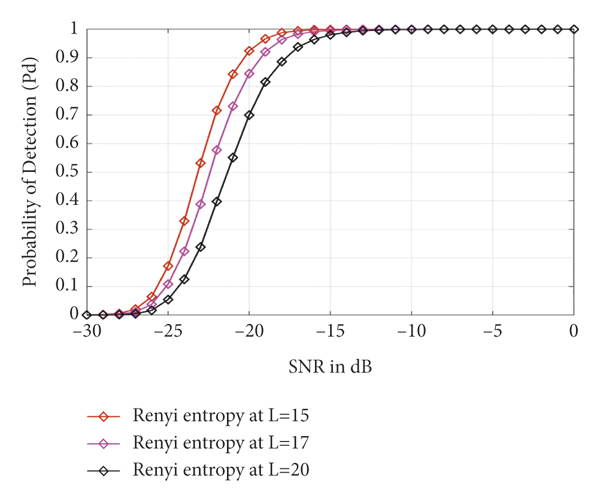
Figure 8 depicts the comparison among the proposed two-stage SS, Renyi entropy-based detection and conventional energy detection (CED), at a particular probability of false alarm of 0.1, number of bins of 15, and order of entropy of 4. The comparison results show that the proposed method outperforms both Renyi entropy and CED by a significant performance improvement. For instance, at a given SNR of −23 dB, the detection probability of the proposed technique is 0.6336, while the detection probability of Renyi entropy and CED is 0.5354 and 0.2113, respectively. In other words, the proposed two-stage technique has a significant improvement of about 11 dB and 1 dB in SNR wall when compared to CED and Renyi entropy, respectively.
P d vs SNR at Pf = 0.1 and α = 4 for CED and different types of entropy.
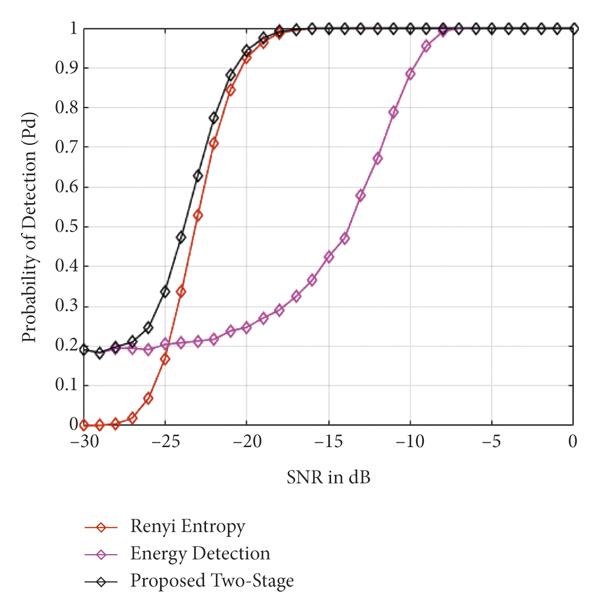
Figure 9 shows the ROC curve that compares the proposed two-stage SS with Renyi entropy and CED at SNR = −23 dB, Pf = 0.1, and L = 15. As it can be seen, the proposed two-stage methods have a lower probability of false alarm than Renyi entropy and CED for detecting PU signals within the desired probability of detection. It is clear from the figure that the proposed detector performs better in terms of detection. For instance, at a given probability of false alarm of 0.1, the detection performance of the proposed technique is 0.631, while the detection probability of Renyi entropy and CED is 0.5298 and 0.2153, respectively. In other words, the proposed two-stage SS technique achieves the desired probability of detection with 0.16 probability of false alarm, while the Renyi entropy and CED achieve it with 0.18 and 0.96, respectively. As a result, it is possible to deduce that the proposed techniques have better detection performance than both Renyi entropy and CED since it requires a lower probability of false alarm to obtain the desired probability of detection than others.
ROC curve for proposed two-stage SS technique at SNR = -23 dB.
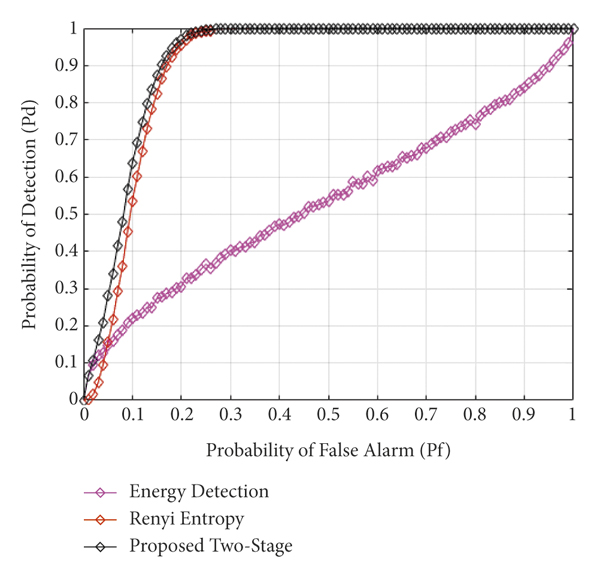
Figure 10 shows the CROC curve that compares the proposed two-stage SS with Renyi entropy and CED at SNR = −23 dB, Pf = 0.1, and L = 15. As it can be observed from the figure, the proposed technique has a lower missed detection probability over all ranges of Pf compared with Renyi entropy and CED. For instance, at a given probability of false alarm of 0.07, the missed detection probability of the proposed technique is 0.5885, while the missed detection probability of Renyi entropy and CED is 0.7127 and 0.8258, respectively. The detection technique with a lower probability of missed detection leads to less interference to PU by SU. Therefore, from this result, it can be concluded that the proposed technique is better at distinguishing PU signals from noise signals than Renyi entropy and CED.
CROC curve for proposed two-stage SS technique at SNR = -23 dB.

Figure 11 illustrates the ROC curve for the proposed two-stage SS technique at various sample sizes. In this simulation, the SNR value is set to −27 dB. The detection performance improves as the number of samples increases for a particular probability of false alarm. At a particular or given SNR and false alarm probability, only a sample size of 3000 may attain IEEE 802.22 standards, as seen in the graph. The ROC curve plotted for the proposed two-stage SS technique with 3000 sample sizes achieves the desired probability of detection (i.e., Pd ≥ 90%) with 0.09 probability of false alarm, while the ROC curve plotted with 2500 and 1000 sample size achieves it with 0.15 and 0.26, respectively. As a result, it is possible to deduce that the performance of proposed SS technique is enhanced by increasing the sample sizes (number of samples) since an increasing sample size decreases the false alarm probability of attaining the required probability of detection.
ROC curve of proposed two-stage SS technique with the different number of samples.
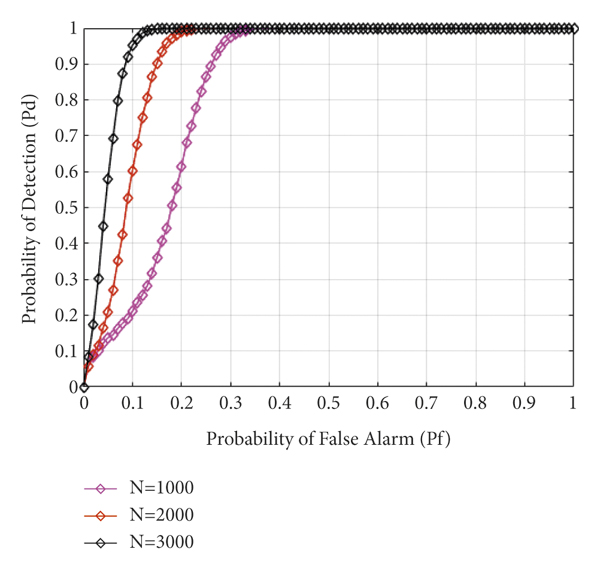
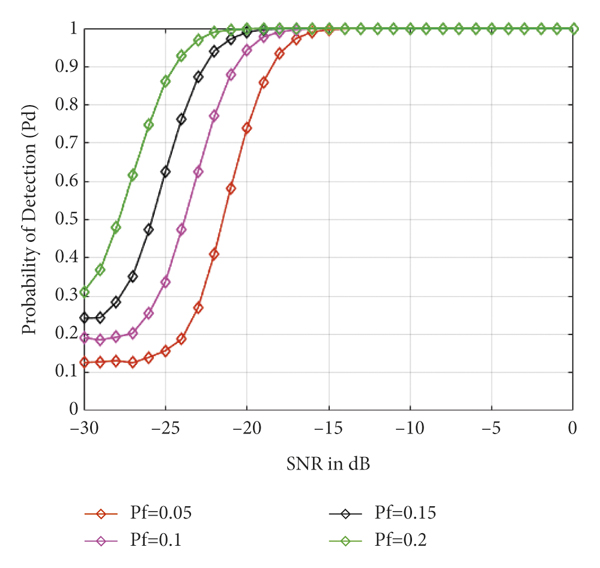
Figure 12 shows the detection performance of the proposed two-stage SS scheme at the sample number of 1000 (N = 1000) for various values of the probability of false alarm. As illustrated in the graph, the detection probability is increased when the probability of false alarm increases. As shown from the figure, the curve that is plotted with Pf = 0.2 achieves the desired detection probability at an SNR of −24 dB, whereas the curves that are plotted with Pf = 0.15, Pf = 0.1, and Pf = 0.05 achieve it at SNRs of −22 dB, −20 dB, and −18 dB, respectively. In other words, the curve that is plotted using Pf = 0.2 has the highest probability of detection when compared to others, while Pf = 0.05 has the lowest detection performance. However, the maximum acceptable Pf for cognitive radio is 0.1, which cannot be surpassed according to IEEE 802.22 standards.
Performance comparison of the proposed two-stage SS technique at various values of false alarm probability.
5. Conclusion and Future Research
In this work, a two-stage SS scheme for CR has been developed to improve the detection performance. The proposed detector consists of conventional energy detection as coarse stage and Renyi entropy-based detection as fine stage. The comparison results show that the proposed method outperforms both Renyi entropy and CED by a significant performance improvement. For instance, at a given SNR of −23 dB, the detection probability of the proposed technique is 0.6336, while the detection probability of Renyi entropy and CED is 0.5354 and 0.2113, respectively. This indicates that the detection of the proposed technique is improved by 1.1834 times compared with Renyi entropy, while it is improved by 2.9986 times compared with CED. In other words, the proposed two-stage technique has a significant improvement of about 11 dB and 1 dB in SNR wall when compared to CED and Renyi entropy, respectively.
According to the simulation results, increasing the number of samples improves the detection probability of the spectrum sensing scheme. Moreover, it has been observed that the detection probability of the SS scheme increases as both SNR and the probability of false alarm increase. In addition, this study investigates the performance analysis among four types of entropy detections, and the simulation result shows that the Renyi entropy is the best one at the entropy order of 4 (α = 4). In the future, it is recommended to analyze the impact of cooperative sensing on the proposed two-stage SS scheme. Another possibility for future research is to adapt the proposed two-stage SS scheme to analyze its behavior within MIMO detecting circumstances and investigate its effect on the performance of sensing. In this study, the AWGN channel was employed for detection, and the other channel like fading channel (Rayleigh and Rician) can be applied for detection.
Data Availability
The data are available from the corresponding author upon request.
Conflicts of Interest
The authors declare that they have no conflicts of interest.


 Open access