


Introduction
The life cycle of species of the genus Gnathostoma Owen 1836 follows a well-defined pattern, in which mammals of different species act as specific definitive hosts, while cyclopoid copepods and poikilothermic vertebrates act as first and second generalist intermediate hosts, respectively. The taxonomic status of Gnathostoma species in Mexico is relatively clear, with three well-documented species (G. binucleatum, G. lamothei, and G. turgidum) (Bertoni-Ruiz et al. Reference Bertoni-Ruiz, Lamothe-Argumedo, García-Prieto, Osorio-Sarabia and León-Régagnon2011) and a fourth recently described species, G. mexicanum (Mosqueda-Cabrera et al. Reference Mosqueda-Cabrera, Sánchez-Miranda, Castillo-Loeza, Torres-Carrera and García-Prieto2025b). In contrast, their life cycles remain unclear. Among these species, G. turgidum has a Pan-American distribution (Bertoni-Ruiz et al. Reference Bertoni-Ruiz, Lamothe-Argumedo, García-Prieto, Osorio-Sarabia and León-Régagnon2011; Monet-Mendoza et al. Reference Monet-Mendoza, Osorio-Sarabia and García-Prieto2005), and its adult forms parasitize the stomach of the marsupials Didelphis virginiana (Díaz-Camacho et al. Reference Díaz-Camacho, Willms, Rendón-Maldonado, de la Cruz-Otero, Delgado-Vargas, Robert, Antuna, León-Règagnon and Nawa2009, Reference Díaz-Camacho, Delgado-Vargas, Willms, de la Cruz-Otero, Rendón-Maldonado, Robert and Nawa2010; Lamothe-Argumedo et al. Reference Lamothe-Argumedo, Akahane, Osorio-Sarabia and García-Prieto1998), D. marsupialis (Acosta-Virgen et al. Reference Acosta-Virgen, López-Caballero, García-Prieto and Mata-López2015; Chero et al. Reference Chero, Sáez, Mendoza-Vidaurre, Iannacone and Cruces2017), and D. aurita (Maldonado Jr. et al. 2020; Travassos Reference Travassos1925). The morphology of its developmental stages is well known; the egg has a plug at each end and numerous pits on its surface (Díaz-Camacho et al. Reference Díaz-Camacho, Willms, Rendón-Maldonado, de la Cruz-Otero, Delgado-Vargas, Robert, Antuna, León-Règagnon and Nawa2009; Mosqueda-Cabrera et al. Reference Mosqueda-Cabrera, Almeyda-Artigas, Sánchez-Miranda, Carranza-Calderón and Sánchez-Núñez2010); second-stage (L2) and early third-stage larvae have been described from in vitro development and experimental infections, respectively (Mosqueda-Cabrera et al. Reference Mosqueda-Cabrera, Almeyda-Artigas, Sánchez-Miranda, Carranza-Calderón and Sánchez-Núñez2010). Advanced third-stage larvae (AdvL3) are known through forms collected from their natural hosts (Cole et al. Reference Cole, Choudhury, Nico and Griffin2014; Díaz-Camacho et al. Reference Díaz-Camacho, Delgado-Vargas, Willms, de la Cruz-Otero, Rendón-Maldonado, Robert and Nawa2010; Mosqueda-Cabrera et al. Reference Mosqueda-Cabrera, Sánchez-Miranda, Carranza-Calderón and Ortiz-Nájera2009, Reference Mosqueda-Cabrera, Desentis-Pérez, Padilla-Bejarano and García-Prieto2023) and experimentally (Mosqueda-Cabrera et al. Reference Mosqueda-Cabrera, Sánchez-Miranda, Carranza-Calderón and Ortiz-Nájera2009). Adults were re-described by Bertoni-Ruiz et al. (Reference Bertoni-Ruiz, Lamothe-Argumedo, García-Prieto, Osorio-Sarabia and León-Régagnon2011) from naturally infected hosts. However, some questions remain regarding the life cycle of this nematode: i) Are frogs, and not fish, the second intermediate host of the species? ii) Given that opossums are scavengers, how can second intermediate/paratenic hosts be identified on the basis of their diet? iii) As has been reported for G. binucleatum, are birds involved in their life cycle? and iv) Do the records of AdvL3 in fish, although limited, suggest the possible involvement of G. turgidum as the causal agent of human gnathostomiasis?
This research aims to provide additional information on the life cycle dynamics of G. turgidum on the basis of new natural and experimental findings, including the molecular identification of larval/adult forms from distinct hosts.
Materials and methods
Host collection was carried out in the municipality of San Francisco Ixhuatán, Oaxaca (16°21′9″N, 94°29′3″W), between September 2023 and June 2025, with permission under SPARN/DGVS/13127/24 granted by the Ministry of Environment and Natural Resources (SEMARNAT). In total, 19 marsupial specimens were collected. Some of these marsupials were obtained through hunting; the others consisted of specimens killed by traffic on the highway that connects Ixhuatán with 20 de Noviembre (El Morro). One specimen of the bird Bubulcus ibis was collected near Laguna Las Garzas (16°17′44″N, 94°27′55″W at 7 m.a.s.l.). Ninety-two specimens of the fish Dormitator latifrons were collected from three water bodies with different seasonality: Las Garzas (semipermanent), La Flor (temporary), and Estero Las Trancas (permanent). These habitats are in the Dead Sea Basin in the Chiapas Coast Hydrological Region (RH23), bordering the Upper and Lower Lagoon Basin of the Tehuantepec Hydrological Region (RH22) (Figure 1) (INEGI 2004). In total, 11 specimens of Lithobates forreri were recovered from the stomachs of both B. ibis and D. virginiana (Table 4).
Geographic location of the study area. Ostuta River (RO), ‘La Flor’ Lagoon (LF), ‘Las Garzas’ Lagoon (LG), ‘Las Trancas’ Estuary (ET), Tehuantepec Hydrological Region (RH22), Chiapas Coast Hydrological Region (RH23).

Figure 1. Long description
A multi-panel map layout. In the top-right corner, an inset map shows the state of Oaxaca within Mexico, bordering the Gulf of Mexico to the North and the Pacific Ocean to the South. The main map focuses on the coastal area between 94 degrees 36 minutes 40 seconds West and 94 degrees 20 minutes West.
On the West side, the Laguna Inferior is a large water body. Moving East, the R H 22 region contains the Ostuta River labeled R O. A central vertical boundary line separates R H 22 from R H 23. Along this boundary are the settlements San Francisco Ixhuatan to the North and 20 de Noviembre El Morro further South.
In the R H 23 region to the East, three specific study sites are marked: La Flor Lagoon labeled L F, Las Garzas Lagoon labeled L G, and Las Trancas Estuary labeled E T. The far East of the map shows the Mar Muerto water body. The southern edge of the map is the Pacific Ocean. A scale bar at the bottom indicates a distance of 7 kilometers, and the map scale is 1 to 120,000.
Treatment of hosts and search for helminths
The specimens were transported in coolers to the field laboratory for processing. The internal organs were immediately removed, placed in 0.9% saline (mammals) or 0.6% saline (fish, amphibians, and bird), and examined under a stereomicroscope. The marsupial skulls were removed for processing and subsequent identification according to Gardner (Reference Gardner1973). The liver and stomach (mammals), muscles (fish, frogs, and bird), and intestines and liver (bird) were digested using artificial gastric juice (prepared with hydrochloric acid and pepsin), and helminths were searched following Mosqueda-Cabrera et al. (Reference Mosqueda-Cabrera, Desentis-Pérez, Padilla-Bejarano and García-Prieto2023).
Experimental life cycle
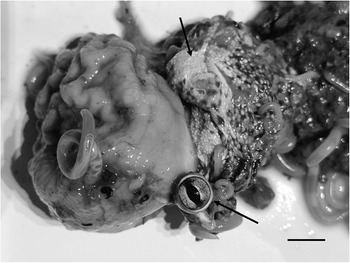
The life cycle study began with the removal of adult worms from the stomach of the definitive host (Figure 2); to obtain eggs and facilitate the recreation of the life cycle, two females collected in April 2024 were temporarily placed in Petri dishes containing 0.9% saline solution. One hour later, G. turgidum females naturally expelled their eggs into the fluid. To concentrate the eggs, we gently rotated the dishes, and aliquots of the fluid were stored in 2 ml black Eppendorf tubes containing distilled water and sterile gentamicin (50 μg/ml) to reduce the presence of antagonist bacterial biota from the host and then stored at room temperature. Additionally, each female was individually washed with saline solution and transferred to glass tubes containing Locke’s solution for 24 hours to allow continued egg expulsion. The expelled eggs were recovered using a sterile pipette, and the females were placed back into tubes with new Locke’s solution. This process was repeated for 3 days. Recovered eggs were washed with tap water until they were free of female mucus and directly placed into Petri dishes containing tap water. These eggs were incubated at 32°C ± 2°C, and the water was removed every 24 hours and replaced with an equal volume. An aliquot was taken daily, placed onto glass slides, and examined under an optical microscope until larval development (L2) was completed. The eggs stored in black Eppendorf tubes were examined at three different time points: 70, 150, and 182 days. In this case, hatching was stimulated by constant exposure to light under a stereomicroscope for 1 to 2 hours.
Female Gnathostoma turgidum in the stomach of Didelphis virginiana. Arrows point to the eye and body of a Lithobates forreri frog. Scale bar = 10 mm.

L2 was used to infect cyclopoid copepods collected from the canals of the Xochimilco Lake system in Mexico City (19°17′21″N; 99°06′31″W). The copepods were maintained in glass containers with water from the lake (10% of the container’s capacity) along with L2 for 2 hours; then, they were immediately transferred to an incubator at 30°C ± 2°C. During the incubation period, the copepods were fed powdered flaky fish food. Once the early third-stage larva (EaL3) developed, the copepods were used to infect the second intermediate hosts (fish, frogs, and mice). The fish and frogs used for infection were fry of Oreochromis niloticus, Poeciliopsis gracilis, Poecilia sp., and Xenopus laevis obtained through commercial sale and maintained in fish tanks at 29°C ± 2°C. The fish were exposed ad libitum to copepods (prevalence of 40%, mean intensity of 2.7) and examined on different days after infection. In addition, a population of P. gracilis, which had been exposed to EaL3-infected copepods for 48 hours, was fed ad libitum to specimens of albino African frogs (X. laevis) obtained from commercial sales and examined on different days post-infection.
Several EaL3-infected copepods were orally administered to mice ( Mus musculus ) using a plastic Pasteur pipette. To facilitate this process, rodents were first stimulated to drink sugar water from the pipette. All the hosts were examined for helminths using the muscle and internal organ digestion method described in the first section.
Processing of nematode specimens
Adult worms and larvae were fixed in hot 70% ethyl alcohol and preserved in new cold 70% ethyl alcohol. The samples intended for molecular analysis were stored directly in 100% ethyl alcohol. Measurements and photographs of the samples, cleared with Amman lactophenol, were taken using an ocular micrometre and a digital camera attached to a compound microscope, respectively. Measurements are in micrometers (μm) unless otherwise indicated. The range is followed by the mean, standard deviation, and sample size (n) in parentheses. The studied specimens were deposited in the Colección Nacional de Helmintos (CNHE) del Instituto de Biología de la Universidad Nacional Autónoma de México (IBUNAM), Mexico City, as follows: adult forms (CNHE: 12286); eggs in D. virginiana faeces (CNHE: 12287); second-stage larvae (CNHE: 12288); and copepods infected with early third-stage larvae (CNHE: 12289).
Molecular procedures and phylogenetic analysis
Given the high degree of morphological variability detected previously in the larvae of some Gnathostoma spp. (Mosqueda-Cabrera et al. Reference Mosqueda-Cabrera, Desentis-Pérez and Padilla-Bejarano2025a) and difficulties in identification, immature specimens were also characterised using molecular information. Five specimens with apparent morphological distinction were processed for DNA extraction. Total DNA was recovered from two or three pooled specimens belonging to the same morphotype, given the small size of each individual. To link larvae with adult forms, we also extracted DNA from two adult specimens recovered from didelphids. A BioBasic DNA extraction kit was used following the manual provided by the manufacturer, with the exception of the last step, in which DNA was eluted in half (30 μl) of the buffer indicated.
The partial region of mitochondrial cytochrome C oxidase (cox1) was amplified with the primers LCO/HCO (Folmer et al. Reference Folmer, Black, Hoeh, Lutz and Vrijenhoek1994) under the following thermal profile: initial denaturation to 94°C for 5 min; followed by 35 cycles of 94°C for 1 min, 45°C for 1 min, and 72°C for 1 min; and a final elongation at 72°C for 7 min. Unsuccessful PCRs were repeated with the primers from Prosser et al. (Reference Prosser, Velarde-Aguilar, León-Règagnon and Hebert2013), which were also used in the sequencing process, generating contigs based on up to 6 reads.
To corroborate the 600 base pairs (bp) of cox1 amplification, the PCR products were visualized by electrophoresis on an agarose gel. Successful amplifications were purified using CentriSep 96 filter plates (Thermo Fisher Scientific, Pittsburgh, Pennsylvania) with Sephadex G-50 (Cytiva, Marlborough, Massachusetts). The sequencing reactions included 0.4 μl of BigDye Terminator v. 3.1 (Applied Biosystems, Waltham, Massachusetts), 2 μl of 5× Buffer, 4 μl of ddH2O, 1 μl of primer at 10 μM, and 3 μl of purified PCR product (total volume of 10 μl). The samples were subsequently purified using Sephadex G-50, after which 25 μl of 0.5 mM EDTA was added to each sample, which was subsequently sequenced in an ABI-PRISM 3100 (Applied Biosystems®, Waltham, Massachusetts) LANABIO, IB-UNAM. The sequences generated were assembled using Geneious v. 5.1.7.
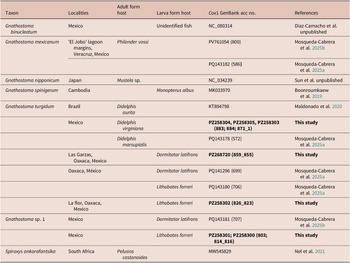
A phylogenetic reconstruction was performed on the basis of the cox1 sequences generated here as well as those previously published (Table 1). The gnathostomatid Spiroxys ankarafantsika was selected as the outgroup. Alignment was conducted in the MAFFT online version (Katoh et al. Reference Katoh, Rozewicki and Yamada2019); the final matrix consisted of 669 bp and 21 terminals. The available sequences for G. binucleatum (GenBank acc. No. AB180103), G. doloresi (GenBank acc. No. AB180100), G. hispidum (GenBank acc. No. AB180102), and G. nipponicum (GenBank acc. No. AB180101) were intentionally excluded from the analysis, given that the sequences represent the second half of the cox1 gene and do not overlap with the rest of the sequences available or those generated here. Maximum likelihood was the selection criterion for phylogenetic inference, using IQtree (Nguyen et al. Reference Nguyen, Schmidt, Von Haeseler and Minh2015), establishing 1000 pseudoreplicates of ultrafast Bootstrap for nodal support values (Hoang et al. Reference Hoang, Chernomor, Von Haeseler, Minh and Vinh2018), and the substitution model that best fit the data was automatically estimated (Kalyaanamoorthy et al. Reference Kalyaanamoorthy, Minh, Wong, Von Haeseler and Jermiin2017). The best-fit model was TN+F+G4.
Metadata associated with taxa used in the cox1-based phylogenetic analysis of Gnathostoma species

Table 1. Long description
A C O X 1 based phylogenetic tree with bootstrap values indicated at the nodes. The tree is rooted by the outgroup Spiroxys ankarafantsika M W 5 4 5 8 2 9 from South Africa.
Moving from top to bottom, the terminal taxa are organized into the following clades:
1. Gnathostoma nipponicum N C 0 3 4 2 3 9 from Japan.
2. Gnathostoma spinigerum M K 0 3 3 9 7 0 from Cambodia.
3. Gnathostoma binucleatum N C 0 8 0 3 1 4 from Mexico.
4. A large clade containing Gnathostoma turgidum and Gnathostoma species 1.
- The Gnathostoma turgidum subgroup includes specimens from Brazil K T 8 9 4 7 9 8 and multiple specimens from Mexico, including P Z 2 5 8 3 0 4, P Z 2 5 8 3 0 5, P Z 2 5 8 3 0 3, P Q 1 4 3 1 7 8, P Z 2 6 8 7 2 0, P Q 1 4 1 2 9 6, P Q 1 4 3 1 8 0, and P Z 2 5 8 3 0 2.
- The Gnathostoma species 1 subgroup includes specimens from Mexico labeled P Q 1 4 3 1 8 1, P Z 2 5 8 3 0 1, and P Z 2 5 8 3 0 0.
5. Gnathostoma mexicanum clade at the bottom, containing specimens P V 7 6 1 0 5 4 and P Q 1 4 3 1 8 2 from Mexico.
Nodes show high support values, such as 100 percent for the Gnathostoma mexicanum and Gnathostoma turgidum clades.
Pairwise genetic distances were calculated with Mesquite (Maddison Reference Maddison2008) using the Kimura 2-parameter model according to Nei and Kumar (Reference Nei and Kumar2000).
Results
Natural infections: Adult forms in the definitive host
Adult forms of the nematode were found with the anterior end of the stomach enclosed within its layers. They were identified as G. turgidum since both sexes present only the anterior end of the body covered by scales with a variable number of points. In the region occupied by the cervical papillae, the male has 8 to 10 points (8 points are more common), and the female has 8 to 13 points (10 and 12, frequently).
Embryonic development
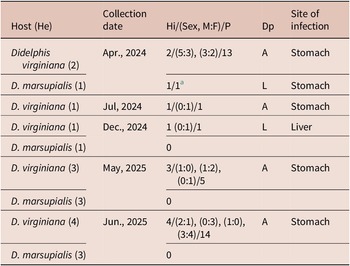
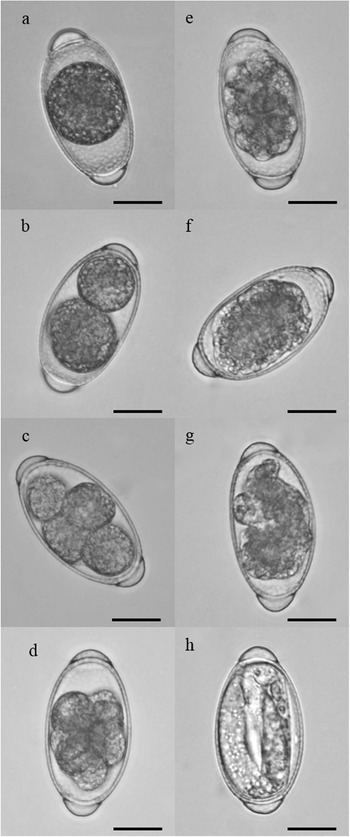
Among the 11 worms recovered from definitive hosts, five hosts contained both males and females (Table 2). At the time of expulsion, the eggs contained a cell mass. Eggs that were directly incubated developed L2, which typically began after 10 days (Figure 3). The development and hatching of the eggs kept in the dark for 70 and 150 days were interrupted at varying intervals. During these periods, approximately 90% of the eggs remained as cell masses, while the remaining 10% completed their development to the L2 stage. Exposure to light from the stereomicroscope and incubation promoted the reinitiation of development in a fraction of the population, while the majority of the eggs remained in developmental arrest (as a cell mass) for an additional 10 to 15 days, reaching full development asynchronously. Finally, after 182 days in darkness, all the eggs had fully developed into L2. Additionally, in two populations of adult worms (collected in April 2024 and May 2025), eggs with shell abnormalities were observed; these findings will be published separately.
Some data on natural infection of definitive hosts in the life cycle of Gnathostoma turgidum collected in the municipality of San Francisco Ixhuatán, Oaxaca. He = host examined, Hi = infected host, M = male, F = female, P = number of helminths collected, Dp = development phase, A= adult, L = larvae
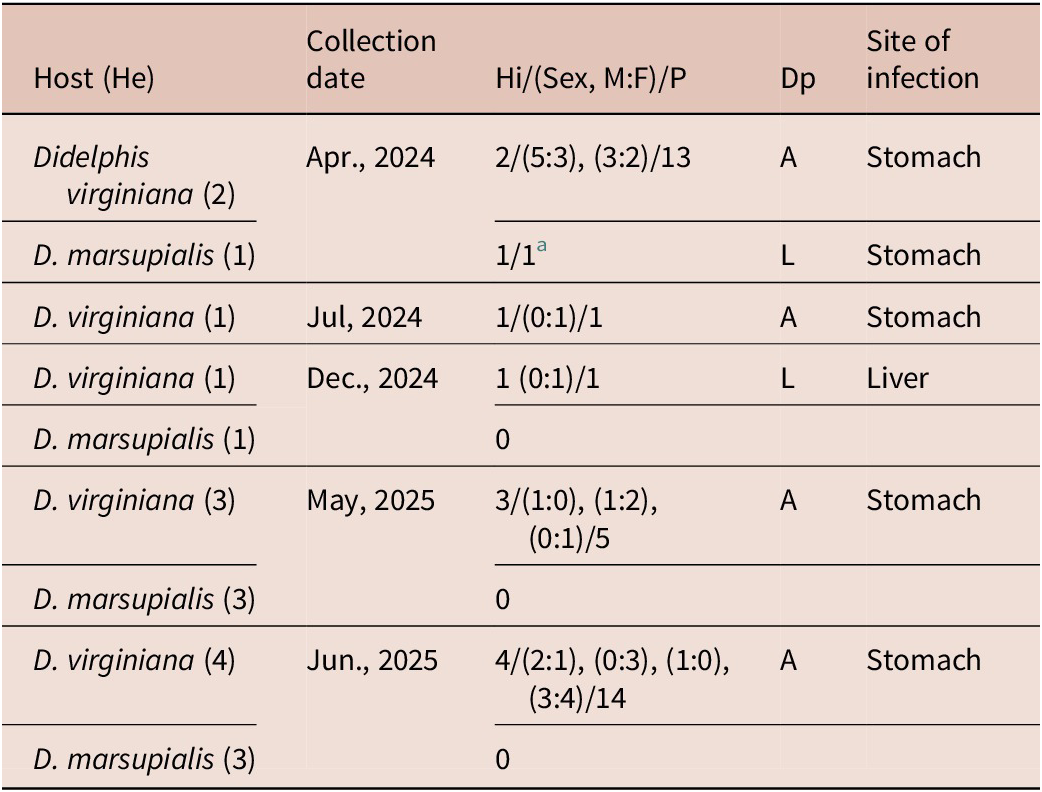
Table 2. Long description
The table consists of five columns: Host (H e), Collection date, H i / (Sex, M:F) / P, D p, and Site of infection.
* April 2024: Two Didelphis virginiana examined, both infected with 13 total helminths (sex ratios 5:3 and 3:2), adults found in the stomach. One D. marsupialis examined, infected with one larva in the stomach.
* July 2024: One D. virginiana examined, infected with one adult female in the stomach.
* December 2024: One D. virginiana examined, infected with one larva in the liver. One D. marsupialis examined, zero infections.
* May 2025: Three D. virginiana examined, all infected with 5 total helminths (sex ratios 1:0, 1:2, and 0:1), adults found in the stomach. Three D. marsupialis examined, zero infections.
* June 2025: Four D. virginiana examined, all infected with 14 total helminths (sex ratios 2:1, 0:3, 1:0, and 3:4), adults found in the stomach. Three D. marsupialis examined, zero infections.
a AdvL3 Gnathostoma sp.
Embryonic development of Gnathostoma turgidum. a, Cell mass; b–d, first cell divisions; e, blastulation; f, gastrulation; g, first-stage larva; h, second-stage larva. Scale bar = 20 μm.

Figure 3. Long description
A series of eight micrographs, labeled a through h, arranged in two vertical columns. Each panel features a scale bar representing 20 micrometers.
Left Column:
* Panel a: An oval egg containing a single, dark, dense circular cell mass centered within the shell.
* Panel b: The cell mass has divided into two distinct, equal-sized spheres.
* Panel c: The mass has divided further into four distinct cells.
* Panel d: A multi-cell stage showing approximately eight to ten visible cells clustered together.
Right Column:
* Panel e: Blastulation stage where the cells form a hollow-looking sphere with a more granular texture.
* Panel f: Gastrulation stage where the internal mass appears more integrated and textured, filling more of the egg cavity.
* Panel g: First-stage larva where the mass begins to elongate and take on a curved, worm-like shape.
* Panel h: Second-stage larva showing a fully formed, elongated worm-like organism coiled within the egg shell, with visible internal structures and a distinct head and tail region.
Experimental infections
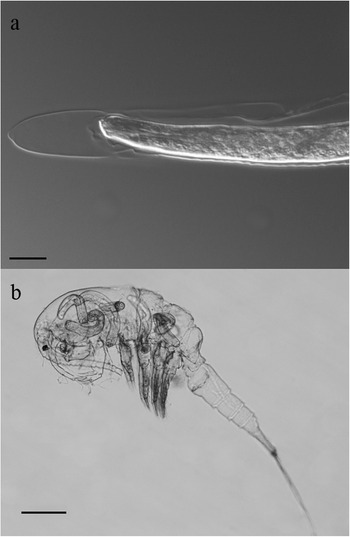
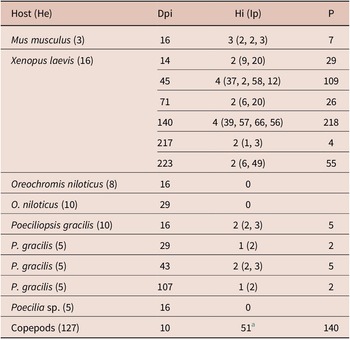
Second-stage larvae developed to EaL3 (Figure 4) between 8 and 10 days post-infection (dpi). The frequency distribution of the larval population in the copepods was as follows: 0 (76), 1 (19), 2 (11), 3 (7), 4 (5), 5 (3), 6 (3), 7 (1), 8 (1), and 10 (1). Between 14 and 107 dpi, a variable amount of AdvL3 was obtained from the second potential host, which was infected with copepods containing EaL3, except for the fish O. niloticus and Poecilia sp. Although African frogs and mice are not natural hosts for G. turgidum, larvae were also obtained from them. In frogs, the infection persisted for up to 223 dpi, with variations in the 16 infrapopulations (Table 3).
Experimentally obtained larval stages of Gnathostoma turgidum. a, Second-stage larva, scale bar = 10 μm; b, early third-stage larvae infecting the coelom of a copepod, scale bar = 200 μm.

Figure 4. Long description
The figure consists of two vertically stacked panels.
Panel a, located at the top, is a high-magnification micrograph of a second-stage larva. The image shows the anterior end of the worm-like parasite, characterized by a rounded, translucent cephalic cap. The internal body structure is granular and dense, tapering slightly as it extends toward the right. A scale bar in the bottom-left corner represents 10 micrometers.
Panel b, located at the bottom, is a lower-magnification micrograph showing a copepod host infected with early third-stage larvae. The copepod is oriented with its head toward the left and its segmented tail extending toward the bottom-right. Inside the translucent body cavity (coelom) of the copepod, several coiled, tubular larvae are clearly visible, concentrated primarily in the cephalothorax region. A scale bar in the bottom-left corner represents 200 micrometers.
Results of infection of advanced third-stage larvae of Gnathostoma turgidum in the musculature of experimental intermediate hosts. He = hosts examined, Dpi = days post-infection, Hi = infected hosts, Ip = infrapopulations, P = Component population

Table 3. Long description
The table consists of four columns: Host (H e), D p i (days post-infection), H i (I p) (infected hosts and infrapopulations), and P (component population).
* Mus musculus (3 hosts examined): 16 D p i, 3 infected hosts with infrapopulations of 2, 2, and 3, totaling a population of 7.
* Xenopus laevis (16 hosts examined) across six time points:
- 14 D p i: 2 infected hosts (9, 20), P = 29.
- 45 D p i: 4 infected hosts (37, 2, 58, 12), P = 109.
- 71 D p i: 2 infected hosts (6, 20), P = 26.
- 140 D p i: 4 infected hosts (39, 57, 66, 56), P = 218.
- 217 D p i: 2 infected hosts (1, 3), P = 4.
- 223 D p i: 2 infected hosts (6, 49), P = 55.
* Oreochromis niloticus (8 hosts examined): 16 D p i, 0 infected.
* Oreochromis niloticus (10 hosts examined): 29 D p i, 0 infected.
* Poeciliopsis gracilis across four time points:
- 16 D p i (10 hosts): 2 infected (2, 3), P = 5.
- 29 D p i (5 hosts): 1 infected (2), P = 2.
- 43 D p i (5 hosts): 2 infected (2, 3), P = 5.
- 107 D p i (5 hosts): 1 infected (2), P = 2.
* Poecilia species (5 hosts examined): 16 D p i, 0 infected.
* Copepods (127 hosts examined): 10 D p i, 51 infected (early third stage larvae in the haemocoel), P = 140.
a Early third stage larvae in the haemocoel.
Early third-stage larvae from natural infections
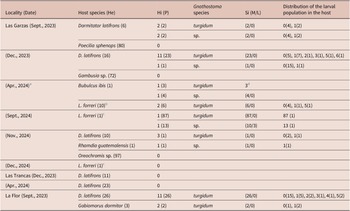
We found 28 specimens of EaL3 from D. latifrons (26) and G. dormitor (2) collected during September 2023 from La Flor Lagoon (Table 4). The larval stage was identified by possessing long cervical sacs comparable in length to the oesophagus, the shape of cephalic bulb spines, and poorly differentiated genital primordia (Figure 5a–d). These specimens were identical to those recovered by experimental infection in copepods (Figure 5e–f).
Data on natural infections of second intermediate and paratenic hosts in the life cycle of Gnathostoma turgidum and Gnathostoma sp. collected in the municipality of San Francisco Ixhuatán, Oaxaca. He = host examined, Hi = infected host, P = number of larvae collected, Si = site of infection, M = musculature, L = liver

Table 4. Long description
The table is organized into six columns: Locality (Date), Host species (H e), H i (P), Gnathostoma species, S i (M/L), and Distribution of the larval population in the host.
Locality: Las Garzas
- Sept., 2023: Dormitator latifrons (6) showed 2 (2) infections for both turgidum and sp. in musculature. Poecilia sphenops (80) had 0 infections.
- Dec., 2023: D. latifrons (16) had 11 (23) turgidum infections and 1 (1) sp. infection, all in musculature. Gambusia sp. (72) had 0 infections.
- Apr., 2024: Bubulcus ibis (1) had 1 (3) turgidum infections in the serous layer of the intestine and 1 (4) sp. infections in musculature. L. forreri (10) from B. ibis stomach had 2 (6) turgidum infections.
- Sept., 2024: L. forreri (1) from D. virginiana stomach had 1 (87) turgidum infections in musculature and 1 (13) sp. infections split (10/3) between musculature and liver.
- Nov., 2024: D. latifrons (10) had 3 (1) turgidum infections. Rhamdia guatemalensis (1) had 1 (1) sp. infection. Oreochromis sp. (97) had 0 infections.
- Dec., 2024: L. forreri (1) had 0 infections.
Locality: Las Trancas
- Dec., 2023 and Apr., 2024: D. latifrons (11 and 23 respectively) both showed 0 infections.
Locality: La Flor
- Sept., 2023: D. latifrons (26) had 11 (26) turgidum infections in musculature. Gobiomorus dormitor (3) had 2 (2) turgidum infections in musculature.
a The waterbody dried up.
b Stomach contents of Bubulcus ibis.
c Stomach contents of D. virginiana.
d In the serous layer of the intestine.
Early third-stage larva of Gnathostoma turgidum. a–d, From the musculature of Dormitator latifrons; e–f, from experimental infection of cyclopoid copepods. Scale bars = 50 μm.

Figure 5. Long description
A multi-panel figure containing six light micrographs labeled a through f.
Panel a shows a full-length view of a third-stage larva with a slender, elongated body tapering at the posterior end.
Panel b provides a high-magnification view of the cephalic bulb at the anterior end, showing four transverse rows of hooklets and a striated cuticle below the bulb.
Panel c displays a close-up of the internal anatomy, specifically the junction between the esophagus and the intestine, showing the glandular structure.
Panel d is a high-magnification view of a cervical sac, appearing as a granular, elongated internal organ.
Panel e shows a whole-body view of a smaller larva from an experimental infection, curved into a C-shape.
Panel f provides a detailed view of the cephalic bulb of the smaller larva, also featuring four rows of hooklets.
Vertical scale bars representing 50 micrometers are present in each panel to indicate size. The background is a neutral, uniform gray.
Advanced third-stage larvae from natural and experimental infections
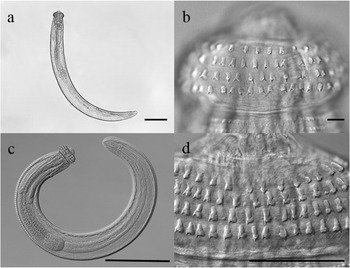
In total, 143 AdvL3 were collected from the musculature (140) and liver (3) of eight host species belonging to three classes. The fish were obtained during six collections in three water bodies with different hydroperiods, and the frogs were obtained from the stomach contents of a bird and marsupials (Table 4). Among these 143 specimens, two main morphotypes were identified, representing two distinct species: G. turgidum and Gnathostoma sp. The larvae of both forms differ mainly in body size (Figure 6), the ratio of oesophageal width/body width at the oesophagus–intestinal intersection, and the shape and size of the spines in the rows of the cephalic bulb (Figure 7). Regarding the size of the genital primordium, the position of the excretory pore differed in relation to the rows of body spines and the number of hooks in the rows of the cephalic bulb (Table 5).
Comparison between advanced third-stage larvae of Gnathostoma spp. isolated from naturally infected hosts. Gnathostoma sp. (left) from Lithobates forreri, G. turgidum from Dormitator latifrons (centre), G. turgidum from Lithobates forreri (right). Scale bar = 200 μm.

Figure 6. Long description
A black and white micrograph displays three parasitic larvae against a light background.
* On the far left is a large, thick larva of Gnathostoma species from Lithobates forreri. It is oriented vertically with a prominent, dark, rounded cephalic bulb at the top. The body curves sharply to the right at the bottom. Internal structures like the esophagus and intestine are visible as dark, dense regions within the translucent body wall.
* In the center is a much smaller, slender larva of G. turgidum from Dormitator latifrons. It is positioned higher in the frame, oriented vertically with a slight curve toward the right. Its internal organs are less dense and more transparent than the specimen on the left.
* On the right is a medium-sized larva of G. turgidum from Lithobates forreri. It is shaped like a C, with the head at the top and the body curving deeply to the right and then back toward the center. The cephalic bulb is clearly defined, and the internal digestive tract is visible as a shaded tube running through the center of the body.
A black scale bar representing 200 micrometers is located in the bottom left corner.
Comparison of the cephalic bulb and the ratio between the width of the oesophagus and the body at the esophago-intestinal junction of the advanced third-stage larva of two species of Gnathostoma. a–b, Gnathostoma sp. from Lithobates forreri, scale bar = 100 μm; c–d, G. turgidum from Dormitator latifrons, scale bars = 20 μm; e–f, G. turgidum from L. forreri, scale bars = 50 μm.

Figure 7. Long description
A six-panel micrograph arranged in three rows and two columns.
* Panel a: Top-left. Close-up of the cephalic bulb of Gnathostoma species from Lithobates forreri. It shows four transverse rows of hooklets. A scale bar at the bottom left represents 100 micrometers.
* Panel b: Top-right. Longitudinal view of the esophago-intestinal junction of the same species. The esophagus is wide relative to the body width. A scale bar at the bottom left represents 20 micrometers.
* Panel c: Middle-left. Cephalic bulb of Gnathostoma turgidum from Dormitator latifrons, showing four rows of hooklets with a different spacing than panel a. A scale bar at the bottom left represents 20 micrometers.
* Panel d: Middle-right. Esophago-intestinal junction of G. turgidum from D. latifrons. The junction shows a distinct narrowing of the esophagus as it meets the intestine. A scale bar at the bottom left represents 20 micrometers.
* Panel e: Bottom-left. Cephalic bulb of G. turgidum from L. forreri, displaying four rows of sharp hooklets. A scale bar at the bottom left represents 50 micrometers.
* Panel f: Bottom-right. Esophago-intestinal junction of G. turgidum from L. forreri, showing the internal tissue structure at the transition point. A scale bar at the bottom left represents 50 micrometers.
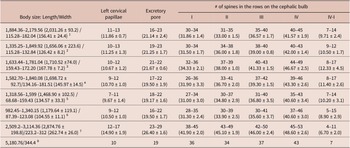
Morphometric comparison between advanced third-stage larvae of G. turgidum obtained from experimental and naturally infected hosts

Table 5. Long description
The table compares eight larval groups (superscripts 1 through 8) across several morphometric parameters.
Columns include:
- Body Dimensions (Length/Width)
- Left Cervical Papilla
- Excretory Pore
- Number of spines in the cephalic bulb rows (I, II, III, IV, and the difference IV-I).
Key data points:
- Group 1 (M. musculus, experimental): Length 1,884.36–2,179.56; Width 115.28–182.04; Spines in rows I-IV range from 30 to 45.
- Group 2 (X. laevis, experimental): Length 1,335.25–1,849.92; Width 115.28–132.84; Spines in rows I-IV range from 30 to 43.
- Group 3 (B. ibis, natural): Length 1,633.44–1,781.04; Width 159.43–172.20; Spines in rows I-IV range from 32 to 49.
- Group 4 (L. forreri from D. virginiana stomach): Length 1,582.70–1,840.08; Width 134.16–181.51; Spines in rows I-IV range from 26 to 46.
- Group 5 (L. forreri from B. ibis digestive tube): Length 1,318.56–1,599; Width 68.68–159.43; Spines in rows I-IV range from 27 to 43.
- Group 6 (D. latifrons, natural): Length 982.45–1,340.15; Width 87.39–123.08; Spines in rows I-IV range from 28 to 46.
- Group 7 (Gnathostoma species from L. forreri): Significantly larger dimensions with Length 2,509.2–3,114.36; Width 223.2–312; Spines in rows I-IV range from 38 to 53.
- Group 8 (D. virginiana liver): Single specimen with Length 5,180.76; Width 344.4; Spines in rows I-IV are 36, 34, 37, and 43 respectively.
Measurements based on 1seven larvae of 16 dpi recovered from muscle of M. musculus, experimental infection (CNHE 12278); 2four larvae of 71 dpi recovered from muscle of X. laevis, experimental infection (CNHE 12279); 3three larvae from B. ibis, natural infection (CNHE 12280). 410 larvae recovered from muscle of L. forreri found in the stomach of D. virginiana, natural infection (CNHE 12281);5six larvae recovered from muscle of L. forreri found in the digestive tube of B. ibis, natural infection (CNHE 12282); 610 larvae recovered from muscle D. latifrons, natural infection (CNHE 12283); 7 nine larvae of Gnathostoma sp. recovered from muscle of L. forreri found in the stomach of D. virginiana, natural infection (CHNE 12284); 8one larval specimen recovered from liver of D. virginiana (CNHE 12285).
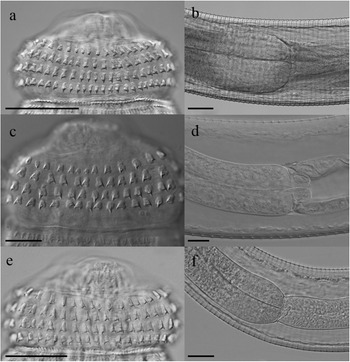
Among the larvae of G. turgidum, we detected high morphological variation; both experimental and naturally recovered specimens displayed differences: i) the following two main sizes were identified: the smallest larvae from fishes of natural infections (Figure 8a–b) and the largest larvae recovered from both natural and experimental frog infections (Figure 8c–d); and ii) the sizes of the cephalic bulb spines and shape (blunt vs. rectangular) were also distinct (Figure 8b, d). Nevertheless, the two groups share the number of transverse spine rows along the body, the position of the cervical papillae and the excretory pore as well as the number of spines in the cephalic bulb.
Comparison of advanced third-stage larva of Gnathostoma turgidum. a–b, Isolated from the musculature of Dormitator latifrons; c–d, isolated from the musculature of Lithobates forreri. Scale bars: a, c = 200 μm; b, d = 50 μm.

Figure 8. Long description
A four-panel micrograph labeled a through d.
* Panel a: A light micrograph of a whole larva from Dormitator latifrons. The body is slender and curved in a C-shape. The anterior end features a distinct head bulb. A scale bar at the bottom right represents 200 micrometers.
* Panel b: A high-magnification view of the head bulb from panel a. It shows four transverse rows of hooklets. The hooklets are small, sharp, and backward-pointing. A scale bar at the bottom right represents 50 micrometers.
* Panel c: A light micrograph of a whole larva from Lithobates forreri. The body is thicker and more tightly coiled than the specimen in panel a. The internal organs and striated cuticle are visible. A scale bar at the bottom right represents 200 micrometers.
* Panel d: A high-magnification view of the head bulb from panel c. Similar to panel b, it displays four rows of hooklets, though they appear slightly more robust in this specimen. A scale bar at the bottom right represents 50 micrometers.
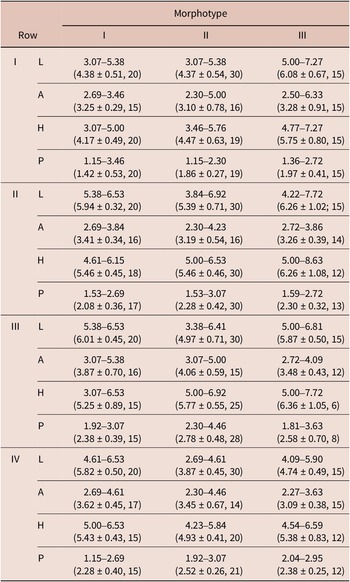
With respect to spine size, the larvae of G. turgidum from naturally infected fishes present three morphotypes on the basis of the length of the spines of the four rows of the cephalic bulb (Figure 9). Compared with the other three rows, the specimens of morphotype I show the smallest spines in the first row, which are almost identical; in morphotype II, the specimens show identical spines in the first and fourth rows but are smaller than those in the second and third rows; finally, in morphotype III, the first three rows are similar in size but larger than those in the fourth row (Table 6). The number of specimens of morphotype II was greatest across collection sites (Table 6).
Comparison of the size of the cephalic bulb hooks between the morphotypes of the advanced third-stage larva of Gnathostoma turgidum from Dormitator latifrons. A, Morphotype I; b, morphotype II; c, morphotype III. Scale bar = 5 μm.

Figure 9. Long description
A three-panel vertical stack of micrographs showing the surface of the cephalic bulb. Each panel includes a scale bar representing 5 micrometers.
* Panel a, Morphotype I. The top panel shows four rows of small, closely packed hooks. The hooks have a broad base and a short, slightly curved point.
* Panel b, Morphotype II. The middle panel displays four rows of hooks that are larger and more elongated than those in Morphotype I. The hooks have a more pronounced, curved claw-like shape with a distinct gap between individual hooks.
* Panel c, Morphotype III. The bottom panel shows four rows of hooks that appear more robust and widely spaced. These hooks have a thicker base and a sharp, downward-pointing tip. Some hooks in the lower rows appear paired or overlapping.
Morphometric comparison of three spine morphotypes of Gnathostoma turgidum on the four rows of hooks of the cephalic bulb obtained from D. latifrons. L = length, W = width, H = leaf, P = depth. Data are expressed in μm. Range (Mean ± standard deviation, n)

Table 6. Long description
The table presents morphometric data in micrometers for three morphotypes (I, II, and III) across four rows of hooks (I, II, III, and IV). For each row, four parameters are measured: L (length), A (width), H (leaf), and P (depth). Data is formatted as Range (Mean plus or minus standard deviation, n).
Row I:
* L: Morphotype I 3.07–5.38 (4.38 plus or minus 0.51, 20); Morphotype II 3.07–5.38 (4.37 plus or minus 0.54, 30); Morphotype III 5.00–7.27 (6.08 plus or minus 0.67, 15).
* A: Morphotype I 2.69–3.46 (3.25 plus or minus 0.29, 15); Morphotype II 2.30–5.00 (3.10 plus or minus 0.78, 16); Morphotype III 2.50–6.33 (3.28 plus or minus 0.91, 15).
* H: Morphotype I 3.07–5.00 (4.17 plus or minus 0.49, 20); Morphotype II 3.46–5.76 (4.47 plus or minus 0.63, 19); Morphotype III 4.77–7.27 (5.75 plus or minus 0.80, 15).
* P: Morphotype I 1.15–3.46 (1.42 plus or minus 0.53, 20); Morphotype II 1.15–2.30 (1.86 plus or minus 0.27, 19); Morphotype III 1.36–2.72 (1.97 plus or minus 0.41, 15).
Row II:
* L: Morphotype I 5.38–6.53 (5.94 plus or minus 0.32, 20); Morphotype II 3.84–6.92 (5.39 plus or minus 0.71, 30); Morphotype III 4.22–7.72 (6.26 plus or minus 1.02, 15).
* A: Morphotype I 2.69–3.84 (3.41 plus or minus 0.34, 16); Morphotype II 2.30–4.23 (3.19 plus or minus 0.54, 16); Morphotype III 2.72–3.86 (3.26 plus or minus 0.39, 14).
* H: Morphotype I 4.61–6.15 (5.46 plus or minus 0.45, 18); Morphotype II 5.00–6.53 (5.46 plus or minus 0.46, 30); Morphotype III 5.00–8.63 (6.26 plus or minus 1.08, 12).
* P: Morphotype I 1.53–2.69 (2.08 plus or minus 0.36, 17); Morphotype II 1.53–3.07 (2.28 plus or minus 0.42, 30); Morphotype III 1.59–2.72 (2.30 plus or minus 0.32, 13).
Row III:
* L: Morphotype I 5.38–6.53 (6.01 plus or minus 0.45, 20); Morphotype II 3.38–6.41 (4.97 plus or minus 0.71, 30); Morphotype III 5.00–6.81 (5.87 plus or minus 0.50, 15).
* A: Morphotype I 3.07–5.38 (3.87 plus or minus 0.70, 16); Morphotype II 3.07–5.00 (4.06 plus or minus 0.59, 15); Morphotype III 2.72–4.09 (3.48 plus or minus 0.43, 12).
* H: Morphotype I 3.07–6.53 (5.25 plus or minus 0.89, 15); Morphotype II 5.00–6.92 (5.77 plus or minus 0.55, 25); Morphotype III 5.00–7.72 (6.36 plus or minus 1.05, 6).
* P: Morphotype I 1.92–3.07 (2.38 plus or minus 0.39, 15); Morphotype II 2.30–4.46 (2.78 plus or minus 0.48, 28); Morphotype III 1.81–3.63 (2.58 plus or minus 0.70, 8).
Row IV:
* L: Morphotype I 4.61–6.53 (5.82 plus or minus 0.50, 20); Morphotype II 2.69–4.61 (3.87 plus or minus 0.45, 30); Morphotype III 4.09–5.90 (4.74 plus or minus 0.49, 15).
* A: Morphotype I 2.69–4.61 (3.62 plus or minus 0.45, 17); Morphotype II 2.30–4.46 (3.45 plus or minus 0.67, 14); Morphotype III 2.27–3.63 (3.09 plus or minus 0.38, 15).
* H: Morphotype I 5.00–6.53 (5.43 plus or minus 0.43, 15); Morphotype II 4.23–5.84 (4.93 plus or minus 0.41, 20); Morphotype III 4.54–6.59 (5.38 plus or minus 0.83, 12).
* P: Morphotype I 1.15–2.69 (2.28 plus or minus 0.40, 15); Morphotype II 1.92–3.07 (2.52 plus or minus 0.26, 21); Morphotype III 2.04–2.95 (2.38 plus or minus 0.25, 12).
Source: Martínez-Salazar and León-Règagnon 2005
Both the G. turgidum larvae of natural and experimental infections in frogs display a unique morphotype in terms of body size and show the arrangement of morphotype III (Figure 9c) in terms of the size of their spines (Figure 8d). Finally, the larvae that were recovered from mouse hosts were slightly larger than those obtained from poikilothermic hosts (Table 5).
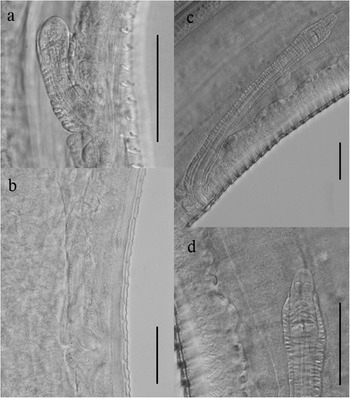
On the other hand, the larvae extracted from the liver of D. virginiana, identified as G. turgidum, and those of frogs (Gnathostoma sp.), showed precocity in their development. The first is characterised by a larger body size (Figure 10) than the larvae of the same developmental stage obtained from frogs (Table 5), and by the relationship of the genital primordium to the body size (147.2 vs. 47.9, ratio of 0.028 vs. 0.028) of larvae obtained from frogs (and bird) and those found in the definitive host. In the larvae recovered from L. forreri (Gnathostoma sp.), the genital primordium developed beyond what was expected, with a length of 302.5 and a ratio of 0.105, i.e., 3.8 times greater than that of G. turgidum (Figure 11).
Precocious larva of Gnathostoma turgidum isolated from the liver of Didelphis virginiana. Scale bars = 100 μm.

Figure 10. Long description
The image consists of four panels labeled a through d, each containing a vertical scale bar representing 100 micrometers.
* Panel a (top-left): A high-magnification view of the cephalic bulb. It shows four transverse rows of hooklets. The hooklets in the upper rows are larger and more spaced out, while the lower rows show smaller, more densely packed spines on the body surface.
* Panel b (top-right): A view of the anterior region showing the esophagus and cervical sacs. Four elongated, club-shaped cervical sacs are visible, extending posteriorly from the base of the head bulb alongside the muscular esophagus.
* Panel c (bottom-left): A detailed view of the esophago-intestinal junction. The granular texture of the posterior esophagus meets the beginning of the intestinal tract, surrounded by a translucent cuticle with fine transverse striations.
* Panel d (bottom-right): The posterior end of the larva. The body tapers to a rounded tail. A small indentation marks the position of the anus near the ventral surface of the terminal end.
Comparison of the genital primordium of advanced third-stage larvae of Gnathostoma spp. a, G. turgidum from Bubulcus ibis; b, immature G. turgidum from the liver of Didelphis virginiana; c–d, Gnathostoma sp. from the musculature of Lithobates forreri. Scale bars = 50 μm.

Figure 11. Long description
A four-panel composite of light micrographs labeled a through d. Each panel includes a vertical black scale bar representing 50 micrometers.
* Panel a: Top-left. Shows a Gnathostoma turgidum larva from a cattle egret. The genital primordium is a distinct, elongated, and slightly curved cellular mass located internally against the striated body wall.
* Panel b: Bottom-left. Shows an immature Gnathostoma turgidum from an opossum liver. The primordium appears as a less defined, elongated cluster of cells situated longitudinally within the larval body.
* Panel c: Top-right. Shows Gnathostoma species from frog musculature. The primordium is a long, narrow, multi-nucleated structure oriented diagonally, positioned between the internal organs and the thick, cuticle-lined body wall.
* Panel d: Bottom-right. A higher magnification view of Gnathostoma species from frog musculature. The primordium is centered, showing a clear oval-shaped anterior end with dense cellular organization, positioned adjacent to the undulating internal margin of the body wall.
Molecular and phylogenetic results
Gnathostoma turgidum from Mexico shows a conspecific intrapopulation relationship, forming a monophyletic group with low genetic distance between Mexican samples (1%) and moderate genetic distance with G. turgidum from Brazil (3.4%). Consistent with the observed morphological differences, a genetically distinct lineage was detected, referred to as Gnathostoma sp., which is closer to G. spinigerum (from Cambodia) than the American species G. binucleatum, G. mexicanum, and G. turgidum. The lineage of Gnathostoma sp. includes two larvae extracted from L. forreri and one from D. latifrons; the genetic distance between Gnathostoma sp. and G. spinigerum is 9.8% on average. These results also indicate that two independent species share the same intermediate host. In terms of the differences in the size of the larvae identified as G. turgidum between fish and frogs, the genetic distances fail to support them as distinct (Figure 12).
Phylogram of Gnathostoma species based on available cox1 sequences.

Figure 12. Long description
The phylogram branches from a root on the left.
* The uppermost branch is the outgroup Spiroxys ankarafantsika.
* The main clade begins with a node labeled 71, leading to N C underscore 034239 Gnathostoma nipponicum from Japan.
* A subsequent node labeled 94 splits into M K 033970 Gnathostoma spinigerum from Cambodia and a cluster of Gnathostoma species from Mexico (labels 707, 803, and 814 underscore 816) with bootstrap values of 100 and 97.
* Below this, a node labeled 50 leads to N C underscore 080314 Gnathostoma binucleatum from Mexico.
* The bottom major clade, supported by a bootstrap value of 98, contains two main groups:
- A group of Gnathostoma mexicanum from Mexico (labels 800 and 586) with a bootstrap value of 100.
- A large cluster of Gnathostoma turgidum from Brazil and Mexico, supported by a node labeled 82. This cluster includes various life stages (Adult, Larva, Juvenil) from different hosts such as Di. aurita, Di. virginiana, L. forreri, and Do. latifrons. Internal nodes within this cluster show bootstrap values ranging from 60 to 75.
A scale bar at the bottom left indicates a genetic distance of 0.04.
Discussion
The fish used in this study were collected from three water bodies: 1) Las Garzas (semipermanent), 2) La Flor (temporary annual), and 3) Estero Las Trancas (permanent). In Las Garzas, the annual water supply is greater than the losses, although with variable water levels (Williams Reference Williams2006). During our study, which involved discussions with residents, we observed that fish (D. latifrons) migrate to Las Garzas lagoon during the rainy season, from the Dead Sea estuaries (Las Trancas) or through the overflow of the Ostuta River through the torrential runoff typical of the region (Figure 1). Associated with this habitat are seasonal water bodies, where wet and dry periods alternate each year, depending on the season (La Flor). Its flooding lasts for several months, which is enough for both animals and macroscopic plants to complete the aquatic stages of their life cycle (Williams Reference Williams2006).
In this context, the life cycle of G. turgidum develops as follows: before the rainy season (April–May), gravid females of G. turgidum release eggs along with the opossum faeces; during the rainy season (June–July), the host expels females carrying eggs inside the uterus. The expelled eggs are in the gastrulation phase and continue their development until second-stage larvae. During embryonic development, we observed the arrest of development and the hatching of the embryo in a process similar to seclusion (sensu Chabaud (Reference Chabaud1954)). In the natural environment, development arrest depends on the ambient humidity related to sporadic rainfall in the area. Alternatively, eggs retained in the uterus and expelled together with the female could also be protected for long periods, developing embryos until favourable conditions appear, as occurs in some nematode species (Wharton Reference Wharton and Lee2002; Zhao et al. Reference Zhao, Han, Liao, Wang, Wu, Liu and Lindsay2017); however, this must be proven for Gnathostoma spp. In the study area, rain occurs in the second half of June, when the eggs hatch. The ensheathed second-stage larva moves vigorously to attract the attention of the copepod, which ingests it and, upon reaching the intestine, penetrates it to establish itself in the haemocoel, where it will reach the EaL3 (Figure 4).
Under natural conditions, the fry, juvenile, and adult stages of three of the five sampled fish species were negative for AdvL3 of G. turgidum (Table 4); however, the larvae of this species (also reported as Gnathostoma sp. I by Mosqueda-Cabrera et al. Reference Mosqueda-Cabrera, Desentis-Pérez and Padilla-Bejarano2025a) were identified in juveniles and adults of D. latifrons, and in juveniles of Gobiomorus dormitor; both fish species could be infected by copepods that constituted part of their diet (Yáñez-Arancibia and Díaz-González Reference Yáñez-Arancibia and Díaz-González1977). Interestingly, a group of EaL3 encysted in the musculature of D. latifrons was also recovered in our study, with characteristics similar to those of EaL3 infecting copepods. The differences observed in size between larvae from D. latifrons and L. forreri could be related to incomplete development in the first host and complete development in frogs (Table 5). In addition, we found a group of AdvL3, but with incomplete development, considering their body size, shape of the spines on the cephalic bulb and lower percentage of coverage of the cervical sacs in relation to the length of the oesophagus (Figure 8a–b).
A possible explanation for such differences could be the arrest in larval development present in the fish. This interruption involves a facultative element; it occurs only in certain hosts, circumstances, and times of the year, frequently affecting only a portion of the worms (Anderson Reference Anderson2000; Michel Reference Michel1974). Therefore, in G. turgidum, larval arrest occurs in two stages: as EaL3 and as developing larvae towards AdvL3 within the musculature of D. latifrons. Whether the differences in the size and development of EaL3 and AdvL3 are related to the morphotypes observed in the spines of the cephalic bulb (Figure 9) should be investigated in future research.
Experimental infections of fish, frogs and rodents resulted in variable levels of infection (Table 3 ). In O. niloticus and Poecilia sp., no larvae were recovered, whereas in P. gracilis, recovery was low compared with that obtained in X. laevis and M. musculus. A large number of AdvL3 was recovered in X. laevis fed with the fish infected during the previous 48 hours; these results suggest that fish can ingest many infected copepods and, if consumed by an intermediate host in a short time (before the larvae develop), fish act as transport hosts, resulting in the accumulation of many larvae that they will transfer to their predators (frogs), who will maintain the infection over time.
The recovery of G. turgidum AdvL3 from both natural and experimental infections in frogs is high. The differential infection levels obtained in naturally infected fish and frogs, particularly the mean abundance (1.0 vs. 8.0, respectively) (Table 4), and complete larval development of AdvL3 in the second intermediate host clearly reveal host specificity towards frogs as obligatory second intermediate hosts. Poulin and Lagrue (Reference Poulin and Lagrue2015) reported that helminths show different levels of host specificity; in the life cycle of G. turgidum, the frogs involved in trophic transmission are located downstream with respect to the copepods.
These results suggest that i) fish act as intermediate and/or transport hosts (as Uber sensu Schoeman et al. Reference Schoeman, Joubert, Du-Preez and Svitin2020); specifically, Dormitator latifrons are facultative hosts for this nematode species. ii) Under natural conditions, frogs (L. forreri) are obligatory second intermediate hosts. They acquire the infection during the tadpole stage and maintain it until the juvenile stage. After metamorphosis, adult frogs continue to become infected during the rainy season by ingesting small fish, tadpoles, and/or juveniles, thus transporting AdvL3 to the definitive host when they are preyed upon. iii) Obtaining AdvL3 from experimental infections in mice does not necessarily mean that this occurs under natural conditions. In this context, experimental studies have revealed that parasites can often successfully infect many more hosts than are observed in nature (Poulin and Keeney Reference Poulin and Keeney2008); the complete development observed in experimentally infected fish may also reflect this phenomenon. iv) Birds (B. ibis) likely act as paratenic hosts and, together with the definitive host, contribute to the dispersal of the species (Bertoni-Ruiz et al. Reference Bertoni-Ruiz, Lamothe-Argumedo, García-Prieto, Osorio-Sarabia and León-Régagnon2011; Monet-Mendoza et al. Reference Monet-Mendoza, Osorio-Sarabia and García-Prieto2005). Paratenic hosts facilitate transmission by bridging trophic levels (Anderson Reference Anderson2000), maintaining long-term infections, or concentrating high larval loads in their tissues (Callaway Reference Callaway2016).
Once in their final host, AdvL3 migrate to the liver to continue their development as juveniles; from there, they return to the stomach, where reproduction occurs. Our results on natural infections in D. virginiana confirmed the observations of Díaz-Camacho et al. (Reference Díaz-Camacho, Delgado-Vargas, Willms, de la Cruz-Otero, Rendón-Maldonado, Robert and Nawa2010) on the permanence (nine months) of the worms in the host (Figure 13a–b). Reproduction begins before the rainy season and ends midway through, with the death and expulsion of adult worms. Because of this, frogs acquire AdvL3 only during the rainy season and accumulate it year after year in their musculature (Figure 13c).
Schematic representation of the life cycle of Gnathostoma turgidum following the symbology of Esch and Fernández (Reference Esch and Fernandez2013). The outer circle refers to the time of infection of intermediate and definitive hosts. a, Time that the species remains in the definitive host Didelphis virginiana; b, reproduction in the stomach; c, advanced third-stage larva in intermediate and paratenic hosts; d, rainy season.

Figure 13. Long description
At the center of the diagram is an inverted triangle labeled Opossum. A dashed arrow points from the Opossum to a vertical sequence: asterisk Egg asterisk, followed by a solid arrow to asterisk L sub 2 asterisk, then a solid arrow to a box labeled Copepod containing E a L sub 3. From the Copepod, a dashed arrow leads to a box labeled Tadpole forward slash Fish containing A d v L sub 3 forward slash E a L sub 3. This box has a dashed arrow pointing to a box labeled Frog containing A d v L sub 3, which in turn has a dashed arrow pointing to a box labeled Bird containing A d v L sub 3. Dashed arrows from the Frog and Opossum indicate potential transmission routes back to the definitive host.
Surrounding this central cycle are four concentric colored arcs. The innermost yellow arc is labeled c. The next arc is green, labeled b. The third arc is red, labeled a. The outermost arc is blue, labeled d.
The entire diagram is enclosed in a large circle marked with twelve tick marks representing months, with capital letters J, M, M, J, S, and N placed at intervals around the perimeter to denote January, March, May, July, September, and November. The red arc a spans from approximately November to July. The green arc b spans from May to July. The yellow arc c is a nearly complete circle. The blue arc d spans from July to September.
Among the G. turgidum AdvL3 isolated from the liver of D. virginiana, one had a larger body size than expected (precocity) and was even larger than those isolated from natural frog infections (5,180 vs. 1,699 μm, respectively). In G. turgidum, precocity has been reported in the liver of Philander opossum (Almeyda-Artigas et al. Reference Almeyda-Artigas, Mosqueda-Cabrera and Sánchez-Núñez2010) and in larvae in the same organ but in D. virginiana (Díaz-Camacho et al. Reference Díaz-Camacho, Delgado-Vargas, Willms, de la Cruz-Otero, Rendón-Maldonado, Robert and Nawa2010). Precocity generally occurs in intermediate hosts as a response to host behaviour or other factors that could restrict transmission, such as temporary water bodies. This response is clear in AdvL3 of Gnathostoma sp. in L. forreri, which has a highly developed genital primordium (Figure 11c, d), whereas in G. turgidum, it has been detected in the liver of the definitive host for a long time.
In G. turgidum, the prepatent period between AdvL3 and juveniles has been documented by Mosqueda-Cabrera et al. (Reference Mosqueda-Cabrera, Sánchez-Miranda, Carranza-Calderón and Ortiz-Nájera2009) at 135 days post-infection, just the time at which the larvae remain as AdvL3 in the liver of D. virginiana (Díaz-Camacho et al. Reference Díaz-Camacho, Delgado-Vargas, Willms, de la Cruz-Otero, Rendón-Maldonado, Robert and Nawa2010). In contrast, in G. binucleatum, the prepatent period spans between 17 and 35 dpi in dogs and cats infected with AdvL3 from birds (Díaz-Camacho et al. Reference Díaz-Camacho, Willms, Ramos, de la Cruz-Otero, Nawa and Akahane2002); considering the length of the moulting time of this species in relation to the results presented in our study for G. turgidum, it is very likely that its larvae were precocious. The absence of precocity of G. turgidum in the intermediate host, the long duration for which AdvL3 remain in the liver of the definitive host and the migration that occurs in it suggest two hypotheses: i) that G. turgidum, throughout its evolution, could have lost an intermediate host, a role currently played by the definitive host and ii) the fact that the long-term persistence of the nematode in the definitive host could be indicative of the tendency towards secondary monoxeny, similar to that reported in the life cycle of some ascarids (Anderson Reference Anderson2000).
On the basis of data from Díaz-Camacho et al. (Reference Díaz-Camacho, Delgado-Vargas, Willms, de la Cruz-Otero, Rendón-Maldonado, Robert and Nawa2010) and our own observations, we conclude that small AdvL3 grow and eventually replace large AdvL3, which then develop into juveniles in the liver and adults in the stomach of opossums. Therefore, the presence of the different stages is not simultaneous in the definitive host.
Among the species of the genus Gnathostoma found in Mexico, only G. turgidum presents a marked seasonality in its life cycle, and there are no records of adult forms after the rainy season; the prevalence is apparently higher in summer and extremely low in winter (Díaz-Camacho et al. Reference Díaz-Camacho, Delgado-Vargas, Willms, de la Cruz-Otero, Rendón-Maldonado, Robert and Nawa2010; Mosqueda-Cabrera et al. Reference Mosqueda-Cabrera, Sánchez-Miranda, Carranza-Calderón and Ortiz-Nájera2009; Nawa et al. Reference Nawa, De la Cruz-Otero, Zazueta-Ramos, Bojórquez-Contreras, Sicairos-Félix, Campista-León, Torres-Montoya, Sánchez-Gonzáles, Guzmán-Loreto, Delgado-Vargas and Díaz-Camacho2009). Therefore, the seasonality detected in this species can be attributed primarily to the obligatory annual loss of adult forms. This phenomenon could be attributed to the expulsion of adult stages as immune-mediated ‘self-curing’ of the host by massive larval invasion during a short period of exposure, resulting in the establishment of new larvae until an equilibrium state is obtained (see Moreau and Chauvin Reference Moreau and Chauvin2010).
Therefore, the immune mechanisms acting on G. turgidum larvae and adults in the definitive host prevent chronic infection and subsequent host death. Despite the ingestion of frogs with a high parasite load (up to 87 AdvL3), a maximum intensity of 8 adults was observed in this study and 14 in the study by Díaz-Camacho et al. (Reference Díaz-Camacho, Willms, Rendón-Maldonado, de la Cruz-Otero, Delgado-Vargas, Robert, Antuna, León-Règagnon and Nawa2009). Once in the definitive host, the encysted larvae in the frogs are released and migrate to the liver, where they remain as ‘small AdvL3’ and then grow into ‘large AdvL3’ (Díaz-Camacho et al. Reference Díaz-Camacho, Delgado-Vargas, Willms, de la Cruz-Otero, Rendón-Maldonado, Robert and Nawa2010); however, owing to the self-curing phenomenon, only a small fraction will become established.
Seasonal patterns in parasite transmission also allude to complex habitat dynamics related to the timing of rainfall that synchronises parasite transmission to that of the fish (Cattadori et al. Reference Cattadori, Haydon and Hudson2005). Dormitator latifrons migrate upstream between streams and river drainages (Vega-Villasante et al. Reference Vega-Villasante, Ruiz-González, Chong-Carrillo, Basto-Rosales, Palma-Cancino, Tintos-Gómez and Badillo-Zapata2021) from Las Trancas. Its populations are more abundant during the rainy season (Navarro-Rodríguez et al. Reference Navarro-Rodríguez, Flores-Vargas, González-Guevara, Téllez-López and Amparán-Salido2010), and juveniles are likely to take advantage of runoff to migrate to Las Garzas and La Flor (Figure 1). In these freshwater habitats, fish acquire infection by feeding on copepods, which are common in their diet (Yáñez-Arancibia and Díaz-González Reference Yáñez-Arancibia and Díaz-González1977). At the end of the rainy season, the fish become trapped in the water bodies. In La Flor, the fish die because of water loss during the dry phase. During migration and desiccation, the fish could become food for the definitive host. In the Las Trancas estuary, the salinity is high and is influenced by the Dead Sea, a habitat where the fish remain year-round, develop, and reproduce. However, the high salinity of this location could affect the survival of second-stage larvae; thus, the life cycle is not established.
While adverse conditions and habitat disturbances may be important factors in the evolution of the life cycles of free-living organisms (Southwood Reference Southwood1988), it is more likely that the life cycles of parasitic organisms follow the behaviour and trophic interactions of their hosts (Esch and Fernández Reference Esch and Fernandez2013). The transmission dynamics of G. turgidum throughout its life cycle undeniably constitute a fascinating object of study (Nawa et al. Reference Nawa, Delgado-Vargas and Díaz-Camacho2024). The present research provides new insights into its life cycle, highlighting its marked seasonality and complex interactions with its hosts and the environment; however, the origin of the arrest of larval development in D. latifrons and whether they are infective to the definitive host are unknown. Notably, we found a putative new Gnathostoma species that also infects D. latifrons and frogs on the same slope. The zoonotic potential of both species should be resolved because they have been found in fish intended for human consumption (Mosqueda-Cabrera et al. Reference Mosqueda-Cabrera, Desentis-Pérez, Padilla-Bejarano and García-Prieto2023; present study).
Acknowledgements
We express our deep gratitude to Mr. Ariel Jiménez Cabrera and Mr. Joel Parada García, residents of the ‘20 de Noviembre’ agency of the Municipality of San Francisco Ixhuatán, Oaxaca, for their collaboration in fishing, hunting and searching for dead animals. We thank Laura Márquez, Nelly López, and Andrea Jiménez (LANABIO IB-UNAM) for their help with molecular biology procedures. Georgina Ortega-Leite provided important references.
Financial support
This work was partially funded by Programa de Apoyo a Proyectos de Investigación e Innovación Tecnológica (PAPIIT) No. IN226525 to Alejandro Oceguera-Figueroa.
Competing interest
The authors declare no competing interests.
Ethical standards
All applicable international, national, and institutional guidelines for the ethical handling of animals and for collection of zoological material were followed. Hosts were collected under permits SPARN/DGVS/13127/24 by Secretaría de Medio Ambiente y Recursos Naturales, Mexico, issued to Miguel A. Mosqueda-Cabrera.







 Open access

