





Introduction
Trade-offs in reproductive investment are common, such as increased offspring size at the expense of offspring number (Clutton-Brock Reference Clutton-Brock1984; Stearns Reference Stearns1992; Roff Reference Roff1993; Fox and Czesak Reference Fox and Czesak2000). One way these trade-offs could appear for females in species that lay eggs is through altering how offspring are apportioned throughout the reproductive lifespan – that is, through modulating their egg-laying pattern. Mate availability can influence a female’s egg-laying investment patterns, with females of common gobies, Pomatoschistus microps Krøyer (Gobiiformes: Gobiidae), investing more into current over future reproduction when mate access is uncertain (Heubel et al. Reference Heubel, Lindström and Kokko2008). However, in the common lizard, Zootoca vivipara Lichtenstein (Squamata: Lacertidae), females are less likely to produce a second viable clutch in a breeding season when mate access is limited (Breedveld et al. Reference Breedveld, San-Jose, Romero-Diaz, Roldan and Fitze2017).
Understanding how egg-laying patterns can be altered to vary investment into current or future reproduction requires characterising these patterns and the conditions under which they change. Variation in egg-laying patterns has predominantly been studied in animals that either have distinct reproductive bouts separated by many months (Godfray et al. Reference Godfray, Partridge and Harvey1991; Jetz et al. Reference Jetz, Sekercioglu and Böhning-Gaese2008; Haywood Reference Haywood2013) or are constrained by the need to find oviposition sites for offspring nutrition (Papaj Reference Papaj2000; Sadeghi and Gilbert Reference Sadeghi and Gilbert2000). Many insects, however, do not have these timing or location-based constraints on egg-laying and can lay a portion of their eggs each day during the few days or weeks that they are reproductively active (Fritz et al. Reference Fritz, Stamp and Halverson1982), using previous mates’ sperm stored in the females’ reproductive tracts (Sivinski Reference Sivinski1980). If these insects can alter their egg-laying patterns from day to day, such as by delaying laying eggs until current environmental conditions are favourable, they may be able to better deal with constraints on their reproduction. However, modifying reproductive investment in real-time to increase one’s reproductive output at any one point in time may have physiological costs because egg production is expensive and increasing this rate may require reallocation of resources. This could result in a reduction in eggs laid later or in a lower total number of eggs laid by females that have invested more in reproduction initially relative to other females.
Balancing current and future reproduction through modifying egg-laying patterns could help to optimise obtaining the benefits of multiple mating that can aid in maximising reproductive output (Arnqvist and Nilsson Reference Arnqvist and Nilsson2000; Fedorka and Mousseau Reference Fedorka and Mousseau2002; Simmons Reference Simmons2005; but see Jennions et al. Reference Jennions, Drayton, Brooks and Hunt2007). Being able to assess local mate availability could help to achieve this balance. If a female is experiencing high local mate availability, she can obtain multiple mates quickly, allowing her to obtain the benefits of multiple mating sooner in life, thereby making earlier reproductive investment beneficial. However, low local mate availability may encourage her to delay reproductive investment until later in life, when she has obtained more mates. If a female lays most of her eggs right after her first mating, she may lose out on benefits obtained from her subsequent mates that could impact her offspring’s survival. Female crickets of different species are able to facultatively modulate their egg-laying patterns under stressful conditions (Rence et al. Reference Rence, Ostenso and Mueller1987; Adamo Reference Adamo1999; Wilson and Walker Reference Wilson and Walker2019) and lay more eggs when exposed to attractive males (Ting et al. Reference Ting, Judge and Gwynne2017; Rebar et al. Reference Rebar, Barbosa and Greenfield2019), suggesting that egg-laying patterns may be an important way in which crickets modulate their reproductive investment.
Acoustic sexual signals produced by male crickets can be used by females to gauge local mate availability and therefore could modulate egg-laying patterns. Male crickets typically produce long-range acoustic sexual signals by rubbing their wings together (Bertram et al. Reference Bertram, Harrison, Thomson and Fitzsimmons2013; Hall and Robinson Reference Hall, Robinson and Jurenka2021), allowing a female to assess multiple signallers at once. Exposure to acoustic cues simulating high mate availability can alter aspects of reproductive investment that could enable earlier egg-laying, such as increasing egg-development rates (Bateman et al. Reference Bateman, Verburgt and Ferguson2005) and increasing investment into reproductive tissues (Conroy and Roff Reference Conroy and Roff2018). In the Pacific field cricket, Teleogryllus oceanicus Le Guillou (Orthoptera: Gryllidae), males typically provide high-viability sperm to females that have mated once before and lower-viability sperm to virgin females. Modulating egg-laying patterns based on mate availability could therefore help female T. oceanicus to control which of her mates sire her offspring (Eberhard Reference Eberhard1996), as well as allow her to maximise the use of viable sperm from the 2–6 mates she obtains in the field (Simmons and Beveridge Reference Simmons and Beveridge2010). For T. oceanicus populations where acoustic cues of mate availability are reliable signals of mate availability, exposure to acoustic cues can increase reproductive tissue investment (Heinen-Kay et al. Reference Heinen-Kay, Strub, Balenger and Zuk2019a; Sturiale and Bailey Reference Sturiale and Bailey2023) and lead to females laying more eggs earlier (Simmons and Lovegrove Reference Simmons and Lovegrove2024), even if overall reproductive output is unchanged (Lierheimer and Tinghitella Reference Lierheimer and Tinghitella2017; Heinen-Kay et al. Reference Heinen-Kay, Strub, Balenger and Zuk2019a). These findings suggest that the perception of mate availability based on acoustic cues could be important for shaping egg-laying patterns in this species. However, if acoustic cues misrepresent the local mate availability, a female’s investment in her egg-laying pattern may not be optimised to best improve her reproductive output. In a situation where mate availability cues are unreliable, how may a female’s egg-laying pattern change?
In Hawaiian populations of T. oceanicus, acoustic cues of perceived mate availability are no longer reliable for determining mate availability because the acoustic environment experienced by these crickets has changed drastically over the last few decades. The introduction of an acoustically orienting parasitoid fly Ormia ochracea Bigot (Diptera: Tachinidae) has facilitated the spread of the “flatwing” mutation that silences males by modifying their wing structure (Zuk et al. Reference Zuk, Rotenberry and Tinghitella2006). Females in these acoustically altered populations now experience a novel acoustic environment that is not representative of local mate availability, and we see that females from different populations alter their investment in reproductive traits (Bailey and Zuk Reference Bailey and Zuk2008, Reference Bailey and Zuk2012; Swanger and Zuk Reference Swanger and Zuk2015). For example, when exposed to acoustic cues representing high mate availability, investment into reproductive tissue increases for females from predominantly wild-type populations (Heinen-Kay et al. Reference Heinen-Kay, Strub, Balenger and Zuk2019a). Reproductive tissue investment for females from Kauai, where the population is predominantly flatwing and thus almost silent (Zuk et al. Reference Zuk, Bailey, Gray and Rotenberry2018), is unchanged by acoustic exposure but is generally low, similar to that of females from predominantly normal-wing populations reared in silence (Heinen-Kay et al. Reference Heinen-Kay, Strub, Balenger and Zuk2019a). The egg-laying patterns of females in these populations may be important for determining whether these females are able to obtain the benefits of multiple mating, given that a lack of future mate availability ought to delay egg laying until females are able to obtain viable sperm from multiple males. However, under parasitism pressure, investing in current reproduction may be beneficial in a silent environment.
Here, we investigated whether perceived mate availability based on acoustic cues influenced the egg-laying patterns of female T. oceanicus from Kauai, which is an almost silent acoustic environment for T. oceanicus (Zuk et al. Reference Zuk, Bailey, Gray and Rotenberry2018). To answer this question, we monitored the number of eggs laid by females over regular intervals in a two-week period while they were exposed to either acoustic cues or silence. If Kauai females use perceived mate availability to modulate their egg-laying, we expected that rearing the insects in a silent environment would delay egg-laying, consistent with previous work that shows a corresponding reduction in reproductive tissue investment in silent environments (Heinen-Kay et al. Reference Heinen-Kay, Strub, Balenger and Zuk2019a; Sturiale and Bailey Reference Sturiale and Bailey2023). Such a delay may be observed in (1) a reduced total number of eggs laid in the two-week period, (2) a lower proportion of total eggs laid in the first week, and (3) egg-laying patterns that change over time. Furthermore, we examined our data to see if a trade-off occurred between current and future reproduction: we compared the number of eggs laid by T. oceanicus females across subsequent treatments in our study. If a trade-off in investment into egg-laying occurred, we expected to see this reflected in negative correlations between the number of eggs laid at subsequent timepoints. Finally, we examined whether a cost to variability in egg-laying patterns relative to a female’s total reproductive output was evident, and we expected to see a negative correlation if there was a physiological cost to high modulation of egg-laying patterns.
Materials and methods
Study system
We used laboratory-reared, inbred lines of crickets that bred true for either the normal-wing or flatwing phenotypes that were constructed for use in other studies (Heinen-Kay et al. Reference Heinen-Kay, Strub, Balenger and Zuk2019a, Reference Heinen-Kay, Urquhart and Zuk2019b; Richardson et al. Reference Richardson, Heinen-Kay and Zuk2021). The normal-wing and flatwing colonies were descended from the Kauai colony, established in 2003 and supplemented annually with eggs from the wild (see Heinen-Kay et al. Reference Heinen-Kay, Strub, Balenger and Zuk2019a for details of colony construction). Briefly, individual females from the Kauai laboratory colony were mated singly with either a normal-wing male or a flatwing male. As crickets have an XX–XO sex determination system, the parental female genotype was determined using both the male phenotype of the F1 offspring and the parental male phenotype. The F1 females that were homozygous were mated with a male with the same wing morph from the Kauai colony to produce F2 lines that bred true for wing morph, and these F2 lines were combined to generate the colonies. These colonies were maintained at constant densities in Caron Insect Growth chambers (model 6025; Caron Scientific, Marietta, Ohio, United States of America) at 26 °C and 75% humidity with a photo-reversed 12:12–hour light:dark cycle. Colonies were housed in 15-L plastic containers with ad libitum access to Teklad high-fibre rabbit chow (product code 2031, Envigo Bioproducts, Inc., Madison, Wisconsin, United States of America), moist cotton for water and oviposition, and egg cartons for shelter.
Experimental treatments of perceived mate availability
Females used for the experiment were separated from the colony at a late juvenile stage, when sex differences were evident (n = 27 from the flatwing colony; n = 51 females from the normal-wing colony). They were placed in plastic containers (35.9 cm × 20 cm × 12.4 cm) with ad libitum Teklad high-fibre rabbit chow, water, and egg cartons for shelter.
To ascertain whether perceived mate availability influenced egg-laying patterns, we set up an acoustic treatment by broadcasting song (or silence) during the entire dark cycle (12 hours/day) to experimental females from the late juvenile stage until the end of the egg-laying monitoring period. Females were randomly assigned to either of these treatments (n = 35 in song: flatwing = 10, normal-wing = 25; n = 43 in silence: flatwing = 17, normal-wing = 26). Individuals in the silent treatment were reared in incubators that lacked both acoustic playback and singing males.
In the song treatment incubators, we played song as uncompressed waveform audio (wav) files from AGPTEK A20 (AGPTEK, Brooklyn, New York, United States of America) audio players. Three Bose SoundLink Color 2 speaker (Bose Corporation, Framingham, Massachusetts, United States of America) were placed in each incubator, one on each shelf. Playback amplitude was calibrated to 80–85 dB (re 20 μPa, fast RMS, C-weighted) and measured with an Extech 407750 Sound Level Meter (FLIR Commercial Systems, Inc., Nashua, New Hampshire, United States of America) at 10 cm from the playback speaker to approximate the decibel level of a singing cricket at a distance of 50 cm (Simmons et al. Reference Simmons, Zuk and Rotenberry2001). The incubators were foam-lined to prevent sound from transmitting outside the incubator. The acoustic playback was made up of synthetic cricket songs, following the methods of Platz and Forester (Reference Platz and Forester1988). A dataset describing song characteristics at 26 °C from the Hawaiian Archipelago in the early 1990s informed the construction of 10 unique songs, following the methods in SynSing Graphical User Interface (Tanner et al. Reference Tanner, Swanger and Zuk2019, Reference Tanner, Justison and Bee2020) and running in MATLAB, version 2018b (https://www.mathworks.com/products/matlab.html). These synthetic songs represent the natural variation in male calling song across the two islands in the dataset and were combined to generate a 12-hour-long playback that simulated high mate availability.
Eclosion checks and mating setups
To determine when females reached adulthood, we performed eclosion checks every other day for late-stage juvenile females. Eclosed females were transferred into individual 118-mL cups containing food, water, and egg carton for shelter. Each female’s pronotum width was measured to the nearest 0.01 mm using digital callipers (product code 15 240; Vorel, TOYA S.A., Wrocław, Poland). Because T. oceanicus are typically sexually mature six days after eclosion (Bailey and Zuk Reference Bailey and Zuk2008), eclosed females were marked to be mated on the next mating setup day (which happened once a week) that was seven days after the eclosion date. In this way, females were either 7, 10, or 12 days after eclosion at the time of mating. These ages are representative of females in the field, which are typically not found past 21 days post-eclosion (Simmons and Zuk Reference Simmons and Zuk1994).
Females were mated to normal-winged males from either the normal-wing colony or the Kauai colony to eliminate any effect of differences in sperm competition or quality, as flatwing males sire more offspring (Heinen-Kay et al. Reference Heinen-Kay, Urquhart and Zuk2019b). During the experiment, an incubator malfunction led to the death of all adult males in our normal-wing colony, and so we used normal-wing males from the Kauai population (the normal-wing population was descended from this colony). Two days before mating, the males were separated from the females and kept in a plastic container (35.9 cm × 20 cm × 12.4 cm) with food, water, and shelter to ensure that males were not sperm depleted before mating. Males were randomly assigned to females for mating, and both were placed in empty 118-mL cups inside an incubator with a speaker playing a synthetic courtship song made to Kauai population preferences (details of the construction of the song are provided in Kota et al. Reference Kota, Urquhart and Zuk2020). After 15 minutes, if mating had occurred (as determined by the female having a spermatophore attached), the male was removed, his pronotum width was measured to the closest 0.01 mm, and he was returned to the colony. If the spermatophore remained attached to the female for at least 30 minutes, she was transferred to a plastic box (12 cm × 12 cm × 5 cm) with food, shelter, and wet sand in a Petri dish (60 mm diameter, 15 mm height) for moisture and oviposition. These boxes were cleaned twice weekly and haphazardly returned to their respective incubators to ensure that placement in the incubator did not influence the experimental outcomes. If mating did not occur or the spermatophore was removed early, the female was returned to her original colony.
Egg-laying monitoring
The wet sand–filled Petri dishes in the boxes were changed thrice weekly for two weeks. Timepoints at which the egg numbers were counted were as follows: T1 – day 2, T2 – day 4, T3 – day 7, T4 – day 9, T5 – day 11, and T6 – day 14). After removing the Petri dishes from the box, they were labelled with the cricket’s ID and their retrieval timepoints. We used 50-mesh (i.e., 50 openings of 0.297 mm per linear inch) sieves (8 inch/203 mm diameter; LABALPHA, Wuxi, Jiangsu, China) to filter the eggs from the sand and count them. Eggs that were blackened or discoloured (between 0 and 5 such eggs laid per individual at each timepoint) were excluded from these counts because they did not undergo typical embryogenesis (Donoughe and Extavour Reference Donoughe and Extavour2016). If eggs could not be counted immediately, they were placed in a refrigerator at 4 °C until counted. Before analysis, the number of eggs laid at each timepoint was divided by the number of days between that timepoint and the previous timepoint to calculate the average number of eggs laid per day at each timepoint across the two-week monitoring period.
Statistical analysis
Females that did not live through the 14 days of egg-laying were removed from the experiment (n = 2). We also removed females that laid 20 or fewer eggs over the two-week monitoring period (n = 5 from silent treatment, n = 4 from song treatment) because such individuals may not have received viable sperm (Loher and Edson Reference Loher and Edson1973). This left n = 32 females in the song treatment (flatwing = 8, normal-wing = 23) and n = 38 females in the silence treatment (flatwing = 13, normal-wing = 25) that were included in the final analysis. Although genotype had a significant effect in some of our analyses, performing our analyses on only the normal-wing females did not change our conclusions about the effects of the predictors of interest, and we therefore report analyses with both flatwing and normal-wing females included. (For results for only the normal-wing females, see Supplementary material, Tables S1 and S2.)
Results of the repeated-measures multivariate analysis of covariance testing of the effect of song or silent treatment on the egg-laying patterns of Teleogryllus oceanicus females. Covariates are genotype, female pronotum width, male pronotum width, and female age. Significant effects (P < 0.05) are noted in bold.

Linear models testing the effect of song or silent treatment on the total number of eggs laid and the fraction of eggs laid in the first week by Teleogryllus oceanicus females. Covariates are genotype, female pronotum width, male pronotum width, and female age. Significant effects (P < 0.05) are noted in bold.

We conducted all statistical analyses using R, version 4.1.3. To evaluate the egg-laying patterns of females, we performed a repeated-measures multivariate analysis of covariance to determine the effect of treatment (song or silence) on egg-laying patterns. We included the covariates of genotype, female pronotum width, male pronotum width, and age of the females at mating in the model. The analysis was done by treating the egg-laying counts at each timepoint as repeated measures within subjects, and these were fitted as a response matrix to a multivariate linear model with lm with the fixed effect of interest and the covariates. We then used the Anova function from the car package, version 3.1.2, to conduct a repeated-measures test using Pillai’s trace, which is robust to violations of assumptions such as sphericity.
To determine whether treatment (song or silence) influenced the number of eggs laid by females in the first week of monitoring, as well as the total number of eggs laid, we used linear models (the lm function in base R). The model included the covariates of genotype, the female’s pronotum width, the pronotum width of her mate, and the age of the female. The analyses used the 10-day post-eclosion females as the reference group for the three age groups; we report the results for the 7- and 12-day post-eclosion females relative to that group.
To determine whether a trade-off in increasing current egg-laying investment versus future egg-laying occurred, we ran partial correlations using the pcor.test function in the ppcor package, version 1.1 (Kim Reference Kim2015), between the average number of eggs laid per day by each individual in subsequent timepoints, while controlling for female pronotum width as a proxy for body size. We did this for each pair of timepoints – that is, T1 against T2, T2 against T3,…T5 against T6. We employed the nonparametric Kendall’s tau-b rank-correlation method, which accounts for ties in the ranks of data, because the number of eggs laid at each timepoint was not normally distributed as per Shapiro–Wilk tests.
Finally, to determine whether a cost to variability in egg-laying accrued in the total number of eggs laid, we first calculated z-scores for the number of eggs laid at each timepoint for each female, relative to their mean number of eggs laid. This allowed us to compare a standardised measure of variability for each female among the entire group of individuals tested. As in the above analyses, we used the pcor.test function to find the Kendall’s tau-b rank-correlation coefficient between the average z-score (calculated from the absolute values of the z-scores for each timepoint) for each female and the total number of eggs she laid, while controlling for female pronotum width as a proxy for body size.
Results
Perceived mate availability has no impact on egg-laying
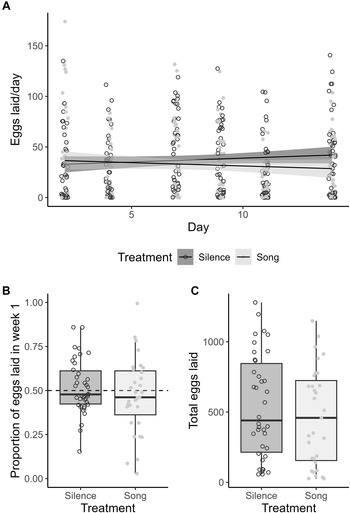
Exposure to the song or silent treatment did not influence the egg-laying patterns of T. oceanicus females (Table 1; Fig. 1A). The song treatment was also associated with neither the proportion of eggs laid in the first week (Table 2; Fig. 1B) nor the total number of eggs laid (Table 2; Fig. 1C).
Egg-laying patterns among females that were reared under song (dark grey box and band, open circles) and silent treatments (light grey box and band, filled circles) to mimic high and low mate availability: A, egg-laying patterns over two weeks – grey bands represent 95% confidence intervals around the linear fit for each treatment; B, proportion of eggs laid in the first week relative to the total number of eggs; C, total number of eggs laid over two weeks. In B and C, the edges of the boxplot represent the first and third quartiles (Q1 and Q3) of the data, and the thick solid line in the middle represents the median. The whiskers extend to the largest and smallest values within 1.5× the interquartile range (IQR = Q3 – Q1).

The number of eggs laid at each timepoint differed (Table 1). Although there was no main effect of genotype on egg-laying patterns, a significant interaction occurred between genotype and time (Table 1). This interaction is reflected in normal-wing females laying 53% of their eggs in the initial week of monitoring, when flatwing females laid only 44% of their total eggs (Table 2), even though both genotypes laid a similar total number of eggs overall (Table 2). Other covariates, including age, female pronotum width, and male pronotum width, did not impact overall egg-laying patterns (Table 1) or the total number of eggs laid by females (Table 2). Larger females laid more eggs in the first week of monitoring (Table 2), but the covariates of male pronotum width and female age did not influence this proportion (Table 2).
Variability and trade-offs within individual egg-laying patterns
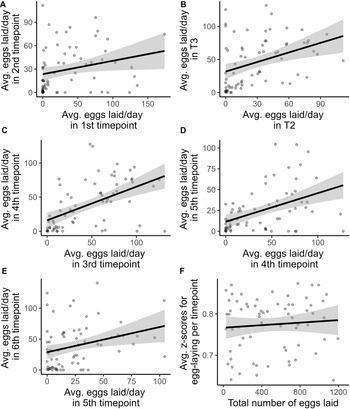
No evidence of a trade-off between current and future egg-laying in the number of eggs laid by T. oceanicus was observed, with correlations between the number of eggs laid by females in subsequent timepoints consistently being positive (Table 3; Fig. 2A–E). In addition, females that produced more eggs did not have more variable egg-laying patterns (Table 3; Fig. 2F).
Partial correlations exploring the possibility of trade-offs between number of eggs laid in subsequent timepoints and variability in egg-laying patterns and total number of eggs laid. Significant relationships (P < 0.05) are noted in bold.

A–E, Average number of eggs laid per day at one timepoint plotted against the subsequent timepoint, from timepoints 1 to 6; F, female’s average z-scores against the total number of eggs she laid. Average z-scores are calculated from the absolute values of the z-scores for the number of eggs laid at each timepoint compared to the average number of eggs laid across all timepoints for each female. The grey band represents the 95% fit for the linear fit between these variables.

Discussion
Egg-laying patterns in T. oceanicus were not affected by mate availability as perceived through acoustic sexual signals (Fig. 1). This lack of effect is consistent with a lack of socially induced plasticity for egg production investment within T. oceanicus populations where perceived mate availability cues are unreliable (Lierheimer and Tinghitella Reference Lierheimer and Tinghitella2017; Heinen-Kay et al. Reference Heinen-Kay, Strub, Balenger and Zuk2019a; Simmons and Lovegrove Reference Simmons and Lovegrove2024). Furthermore, no evidence of costs of increased investment in egg-laying to future reproduction was found, nor was there a relationship between the variability in egg-laying patterns and total eggs laid (Table 3; Fig. 2). These findings suggest that modulation of reproductive investment in this species does not incur physiological costs that impact the number of offspring they produce, which may enable females to adjust their egg-laying patterns in real-time.
Our study showed that egg-laying patterns for female T. oceanicus from the island of Kauai, which currently experience an almost silent environment, did not change based on perceived mate availability (Fig. 1). This suggests that females from the silent populations may still be able to obtain benefits from multiple mating regardless of acoustic mate availability cues because the females do not bias their investment towards early reproduction, as seen in Australian T. oceanicus unaffected by the O. ochracea parasitoid (Simmons and Lovegrove Reference Simmons and Lovegrove2024). Our work aligns with Lierheimer and Tinghitella’s (Reference Lierheimer and Tinghitella2017) finding that the total number of eggs laid was not affected by either the song or silence treatment (Fig. 1C), suggesting that this lack of effect of perceived mate availability on egg-laying is not unique to the present study. Yet, such acoustic treatments can impact multiple other aspects of reproductive investment in T. oceanicus, such as female receptivity and phonotaxis (Bailey and Zuk Reference Bailey and Zuk2008, Reference Bailey and Zuk2012; Swanger and Zuk Reference Swanger and Zuk2015), which are pre-copulatory traits. Our results are consistent with findings in past studies (Lierheimer and Tinghitella Reference Lierheimer and Tinghitella2017; Heinen-Kay et al. Reference Heinen-Kay, Strub, Balenger and Zuk2019a; Simmons and Lovegrove Reference Simmons and Lovegrove2024), suggesting that socially induced plasticity for overall egg production investment has been lost in this species, specifically when these cues are unreliable (DeWitt et al. Reference DeWitt, Sih and Wilson1998; Snell-Rood Reference Snell-Rood2013). Potentially, if post-copulatory reproductive investment is decoupled from pre-copulatory investment in T. oceanicus, this may explain why we don’t see a response to the lack of song in egg-laying traits, while we do for other post-copulatory traits. Kota et al. (Reference Kota, Urquhart and Zuk2020) suggested that such a decoupling may help maintain the loss of the sexual signal in this species, with females differing in the time they take to mount males with or without the flatwing morphology (pre-copulation) but not in the time they retain the spermatophore after copulation. Although the genotype of the females did impact egg-laying patterns over time, with normal-wing females laying more eggs than flatwing females in the first week, it didn’t influence the total number of eggs laid throughout the monitoring period (Table 2). This is consistent with previous work by Heinen-Kay et al. (Reference Heinen-Kay, Urquhart and Zuk2019b) and Richardson et al. (Reference Richardson, Heinen-Kay and Zuk2021), which demonstrated that carrying the flatwing allele reduced reproductive tissue investment in females; as a result, this delay in egg-laying may be the result of flatwing females tending to have fewer eggs fully develop earlier in their lifetimes. Overall, the lack of effect of perceived mate availability on egg-laying patterns may benefit Kauai females by allowing current conditions, rather than external cues, to determine their reproductive investment.
If female T. oceanicus from Kauai do not use acoustic cues to detect local mate availability, could they be using other cues to determine their reproductive investment? Cuticular hydrocarbons – lipids that primarily function to prevent desiccation of insect cuticles – also serve as a contact-based sexual signal in this species due to their sex-specific composition (Tregenza and Wedell Reference Tregenza and Wedell1997; Thomas and Simmons Reference Thomas and Simmons2009). Females encounter cuticular hydrocarbons through physical contact with a male or when traces of the lipids remain on the substrate in the environment. These cues have been predominantly studied in the context of mate choice (Gray et al. Reference Gray, Bailey, Poon and Zuk2014), rather than as a method of gauging mate availability. However, Richardson et al. (Reference Richardson, Hoversten and Zuk2025) work with female T. oceanicus from Hilo, Hawaii – a population with typically more normal-wing males than flatwing males (Zuk et al. Reference Zuk, Bailey, Gray and Rotenberry2018) – shows that reproductive tissue investment was reduced when a mismatch in cues occurred, for example, under conditions of high cricket density in the laboratory, but without acoustic cues. Richardson et al. (Reference Richardson, Hoversten and Zuk2025) address the possibility that their high-density treatment, while providing cues of mate availability through cuticular hydrocarbons, could be interpreted as providing cues for high competition for resources, leading females to reduce their reproductive investment to increase investment in survival. More work is needed to determine whether cuticular hydrocarbons are used by female T. oceanicus as a mate availability cue because cuticular hydrocarbons can remain on the substrate for long periods and therefore may not reflect current mate availability.
We found no evidence of costs in the number of eggs laid later among females that increased earlier investment into egg-laying, with positive correlations shown between the number of eggs laid by females in subsequent timepoints (Fig. 2A–E). For T. oceanicus, the number of offspring they lay therefore may be unaffected by increased investment into egg laying at various points in time, which would accommodate large variation in egg-laying patterns. Previous studies have demonstrated trade-offs between the numbers of current and future eggs laid under conditions that reflected an advantage to terminal investment, such as infection stress (Adamo Reference Adamo1999) or old age (Rence et al. Reference Rence, Ostenso and Mueller1987; Wilson and Walker Reference Wilson and Walker2019). The present experiment was performed under constant conditions, with females at ages similar to those in the field (Simmons and Zuk Reference Simmons and Zuk1994) and ad libitum food; as a result, any incurred costs to egg numbers may have easily been recuperated due to the lack of stressful conditions. Trade-offs may be present in other aspects of reproduction that we did not measure, such as a trade-off between egg size and egg number (Smith and Fretwell Reference Smith and Fretwell1974; Gershman et al. Reference Gershman, Miller and Hamilton2022), which can impact offspring survival. Simmons and Lovegrove (Reference Simmons and Lovegrove2024) found such a cost for Australian T. oceanicus females that increased their egg production in response to male song, which produced offspring weighing 5% less than those produced by females in silence. This could lead to reduced offspring quality despite increased offspring numbers, as seen in Sturiale and Bailey (Reference Sturiale and Bailey2023). Such a trade-off potentially could constrain egg-laying patterns in the field over multiple generations, whereas the lab environment may allow for relaxed selection and therefore the high variation in egg-laying patterns observed in the present study.
Despite optimal and consistent conditions for T. oceanicus females in our experiment, we saw high interindividual variability in egg-laying patterns (Fig. 2) and no relationship between variable egg-laying and total number of eggs laid over the two-week monitoring period (Table 3). Why would this amount of variation in egg-laying occur under controlled, ideal conditions? Perhaps egg-laying patterns for the crickets we tested are predominantly driven by individual variation rather than by environmental cues. We suggest four ways in which this could have happened. First, variation in a hormone such as juvenile hormone, which is linked to egg investment in many insect species (Dingle and Winchell Reference Dingle and Winchell1997; Bloch et al. Reference Bloch, Borst, Huang, Robinson, Cnaani and Hefetz2000; Zera Reference Zera2016) and delays egg-laying in butterflies (Snell-Rood et al. Reference Snell-Rood, Davidowitz and Papaj2011), could play a large role in determining egg-laying patterns in T. oceanicus. Second, our results show that the larger females tended to lay more eggs than smaller females did in the initial week of egg-laying (Table 2), although this didn’t affect the total number of eggs laid. This could be because larger females are able to store more eggs in a short amount of time and therefore are able to lay more eggs soon after mating. Third, variability in a female’s egg-laying pattern may depend on how recently she has acquired nutrients and how she allocates these nutrients to reproduction over somatic functions, both of which would vary among individuals (van Noordwijk and de Jong Reference van Noordwijk and de Jong1986; Laskowski et al. Reference Laskowski, Moiron and Niemelä2021). Finally, variation in egg-laying pattern could be due to seminal fluid proteins that are transferred during mating (Chapman Reference Chapman2001; Wigby et al. Reference Wigby, Sirot, Linklater, Buehner, Calboli and Bretman2009; Simmons et al. Reference Simmons, Ng and Lovegrove2022 ). These proteins help induce egg production and oviposition (Loher Reference Loher1979; Loher et al. Reference Loher, Ganjian, Kubo, Stanley-Samuelson and Tobe1981) but are not required for oviposition to begin (Rence et al. Reference Rence, Ostenso and Mueller1987; Kelly et al. Reference Kelly, Peruzzini, Chasse-Bilodeau, Roche and Olivier-Montiglio2024). Male size (represented by pronotum width) didn’t affect egg-laying in the present study, and although we ensured males were not sperm depleted before mating, we did not control for male age or previous male mating experience, both of which can influence seminal protein deposition (Thomas and Simmons Reference Thomas and Simmons2007; Rutkowski et al. Reference Rutkowski, Foo, Jones and McNamara2023). Given the complexity underlying egg-laying patterns, investigating the factors that influence them can provide insight into how seemingly unrelated evolutionary pressures on behaviour and physiology (Sugawara and Loher Reference Sugawara and Loher1986; Sugawara Reference Sugawara1993; Cury et al. Reference Cury, Prud’homme and Gompel2019) intersect to allow for the coexistence of multiple successful egg-laying strategies, as suggested by Moore et al. (Reference Moore, Harris and Moore2007).
Acknowledgements
The authors thank Karen Mesce, Mingzi Xu, Emilie Snell-Rood, Jon Richardson, and two anonymous reviewers for their helpful comments on the manuscript. They also thank the members of the Zuk lab for feedback on the project and Ruth Shaw for insightful ideas on analysis approaches. Funding for this work was provided by the University of Minnesota. Aarcha Thadi was responsible for the conceptualisation of the study, data collection, analysis, and writing; Ruby Ales was responsible for data collection and editing the manuscript; and Marlene Zuk was responsible for the conceptualisation of the study and editing the manuscript.
Competing interests
The authors declare that they have no competing interests.
Data availability
Data are available on Dryad DOI: https://doi.org/10.5061/dryad.cnp5hqcfk.
Supplementary material
The supplementary material for this article can be found at https://doi.org/10.4039/tce.2025.10020.





 Open access

