

Introduction
Genebanks are essential for preserving biodiversity which is crucial for environmental sustainability, climate adaptation, and future food security. They store the plant genetic resources used by researchers and breeders in developing new, climate-resilient varieties. To meet future crop improvement and productivity targets, the availability of high quality, highly viable, germplasm is critical. Thus, it is recommended genebanks periodically monitor the change in viability of their seedlots to ensure the timely regeneration of material and, subsequently, maintain its genetic integrity. However, with viability monitoring one of the costliest genebank activities (Hay and Whitehouse Reference Hay and Whitehouse2017), the ability to estimate how long a sample of seeds will maintain viability above a threshold is a valuable tool when trying to schedule testing to maximise cost-efficiencies, particularly as collections grow.
Since the 1960’s, there has been a concerted effort to establish ex situ seed collections, with a global total, to date, equating to approximately 1,750 collections, conserving around 7.4 million accessions (FAO 2010). With their establishment, came guidelines and standards for the active management of their germplasm (IBPGR 1985; FAO 1994, 2014, 2022). The current standards relating to viability monitoring, published by the Food and Agriculture Organisation of the United Nations in the Genebank Standards (FAO 2014), recommends an initial viability test is carried out within 12 months of the accession being received, with subsequent monitoring intervals set at a third of the time predicted for viability to decease to 85% (i.e. through the viability equations (Ellis and Roberts Reference Ellis and Roberts1980)) – up to a maximum interval of 40 years. If, however, this cannot be estimated; monitoring intervals should be every 5 or 10 years, depending on whether the species is expected to be short or long-lived (FAO 2014).
Orthodox seed longevity increases systematically with the decrease in temperature and moisture content and are, therefore; expected to survive for a long period of time under genebank storage conditions. However, despite this, whatever the environment; and even when initial quality is high, some species are better at maintaining viability in storage than others. These inherent (genotypic), inter-species, differences in seed longevity are quantified by the Ellis and Roberts (Reference Ellis and Roberts1980) seed viability equation and results from differences in the seeds’ sensitivity to change in moisture content at a constant temperature. However, as the inherent longevity of only approximately 70 species is known (Hong et al. Reference Hong, Linington and Ellis1996; Demir et al. Reference Demir, Hay and Sariyildiz2009; SER/INSR/RBG Kew 2023), genebanks are forced to rely on non-evidence-based viability monitoring intervals for the management of their accessions, such as those recommended in the Genebank Standards (FAO 2014). Whilst understanding inherent (genotypic) differences in longevity is useful; seed longevity is also heavily influenced by other factors, such as the pre- and post-harvest environment (incl. the timing of harvest) and seed processing operations (Whitehouse et al. Reference Whitehouse, Hay and Lusty2020) which, subsequently result in differences in longevity both between accessions (within a species) and seedlots (within an accession). This makes it challenging when trying to adhere to “default” intervals, based on predictions and/or expectations.
As many genebanks have now been operational for a few decades, a wealth of viability information on their collections have been collected. Data, relating to observed longevity and/or the change in viability of accessions during storage has been published by some genebanks (Walters et al. Reference Walters, Wheeler and Grotenhuis2005; Lee et al. Reference Lee, Jeon, Lee, Lee and Kim2013; Van Treuren et al. Reference Van Treuren, de Groot and van Hintum2013, Reference Van Treuren, Bas, Kodde, Groot and Kik2018; Hay et al. Reference Hay, de Guzman and Sackville Hamilton2015, Reference Hay, Whitehouse, Ellis, Hamilton, Lusty, Ndjiondjip, Tia D’ Wenzel, Santos, Yazbek, Azevedo, Peerzada, Abberton, Oyatomi, de Guzman, Capilit, Muchugi and Kinyanjui2021; Ellis et al. Reference Ellis, Nasehzadeh, Hanson and Woldemariam2018, Reference Ellis, Nasehzadeh, Hanson, Ndiwa and Woldemariam2019; Yamasaki et al. Reference Yamasaki, Domon, Tomooka, Baba-Kasai, Nemoto and Ebana2020). Much of the data shows variability in the change in viability during storage between species and accessions; with many genebanks alluding to the need to regenerate their material more frequently than expected although; also showing evidence of high viability being maintained for multiple decades in many taxa.
The Australian Grains Genebank (AGG) is one of the largest and most diverse crop genebanks globally, holding approximately 217,000 accessions from 1,250 species of temperate and tropical cereals, legumes, and oilseeds. The tropical crops constitute around 25% of the total accessions and represent 38 genera: with Sorghum, Common bean, Soybean and Mungbean being the main contributors – collectively accounting for 14,463 of the total 31,471 active accessions (Table 1). Since the AGG Tropical collection began in 1984, periodic germination tests on seedlots have been recorded resulting in a large, historical, dataset.
Total number of active accessions within each crop group, and the number represented by the six target species, currently conserved under long-term (−20°C) storage at the Australian Grains genebank (AGG). The remaining columns represent the total number of accessions conserved globally at both the crop and species level. Global data at the crop level was extracted through the World Information and Early Warning System on Plant genetic Resources (WIEWS) (FAO 2024) and global data at the species level was accessed through Genesys (https://www.Genesys-pgr.Org/)
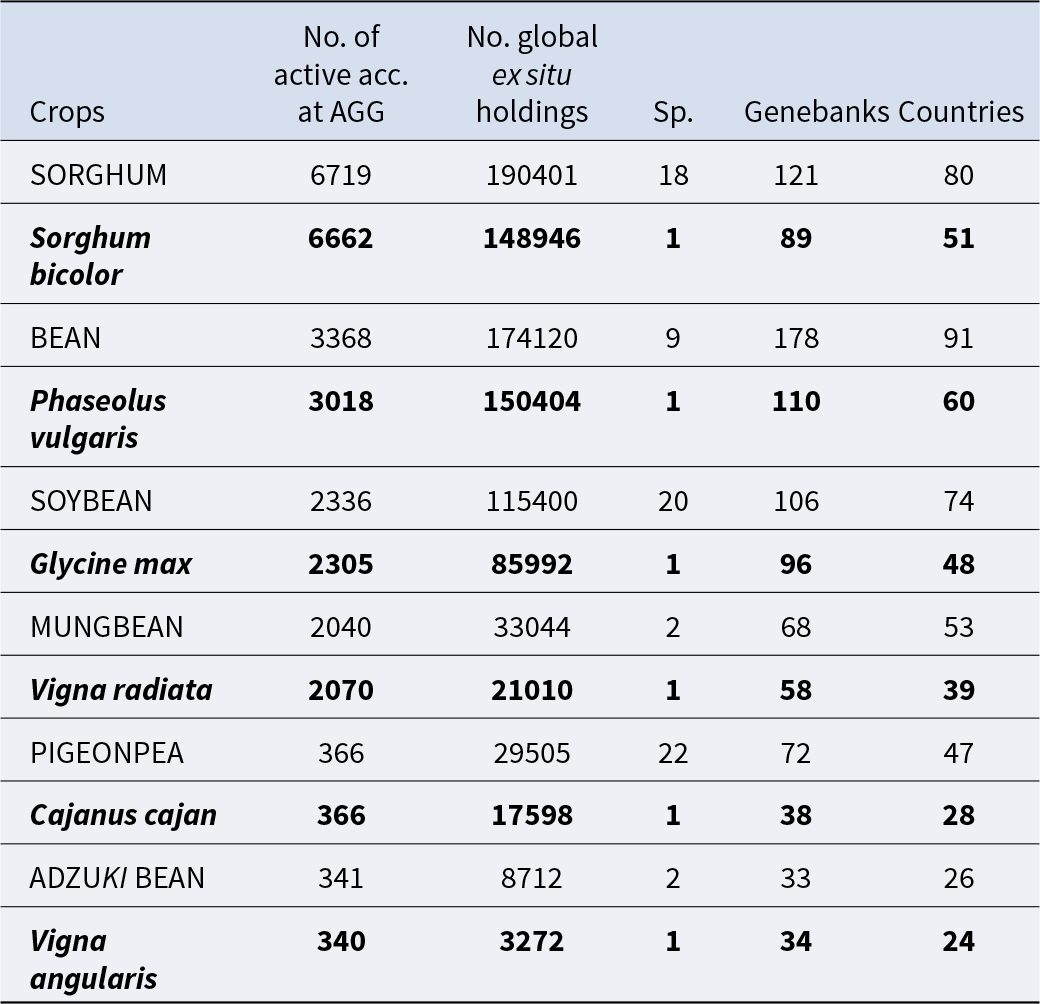
Table 1 Long description
The table compares active accessions conserved at the Australian Grains genebank (AGG) with global ex situ holdings, and lists the number of species, genebanks, and countries represented for each crop group and its target species. At AGG, sorghum has the most active accessions at 6,719, followed by bean at 3,368, soybean at 2,336, and mungbean at 2,040; pigeonpea and adzuki bean are much smaller at 366 and 341. Globally, sorghum also has the largest holdings at 190,401, ahead of bean at 174,120 and soybean at 115,400; mungbean has 33,044, pigeonpea 29,505, and adzuki bean 8,712. For target species, Sorghum bicolor accounts for nearly all AGG sorghum accessions at 6,662 and has 148,946 global holdings across 89 genebanks in 51 countries. Phaseolus vulgaris dominates bean at AGG with 3,018 and has 150,404 global holdings across 110 genebanks in 60 countries; Glycine max similarly dominates soybean at AGG with 2,305 and has 85,992 global holdings across 96 genebanks in 48 countries. One inconsistency is that Vigna radiata is listed with 2,070 active accessions at AGG, slightly higher than the mungbean crop total of 2,040, suggesting a possible data or classification mismatch. Crop groups generally list many species, such as pigeonpea with 22 and soybean with 20, while each target species row lists one species. Global totals come from different sources at crop and species levels, so crop-level and species-level global figures are not directly interchangeable.
This study aimed to analyse the historical AGG viability data, collated from germination tests carried out on seedlots that were at least 20 years old (regenerated/accessioned in 2005, or earlier), to assess the observed longevity of six tropical crops, under long-term storage. The species with the largest number of accessions within the AGG tropical collection were targeted – Sorghum bicolor (L.) Moench, Phaseolus vulgaris L., Glycine max (L.) Merr, and Vigna radiata (L.) R. Wilczek – along with Cajanus cajan (L.) Huth and Vigna angularis (Willd.) Ohwi & H.Ohashi that, although not large crop groups in the AGG, they are significant contributors within global ex-situ holdings (WIEWS) (FAO 2024; Table 1). The aim was to determine appropriate species-specific monitoring intervals to benefit the global management of these crops – noting the inherent longevity of both Cajanus cajan and Vigna angularis are currently unknown.
Materials and methods
AGG operates under long-term storage conditions, maintaining seeds in sealed laminated-aluminium foil packets at equilibrium with 15% relative humidity and − 20°C. Prior to 2014, the tropical collection was maintained, under the same conditions, at a site in Biloela, Queensland. Accessions at AGG are originally acquired through the importation from international genebanks or organisations, or through domestic donation from Australian organisations, with all subsequent multiplication and/or regeneration cycle(s) undertaken at the AGG following current, best-practice, standards for plant production. Therefore, many accessions are represented by more than one seedlot which are numbered sequentially with each cycle of regeneration. For example, the original sample is represented as seedlot 1, and the current, active, seedlot is from the most recent regeneration cycle, using seed from the previous cycle/seedlot. Thus, as the different seedlots within an accession derive from the original sample of seed but, also exhibit some degree of heterogeneity due to being regenerated at different regeneration sites and/or in different years, they were considered separately. To maximise the number of observations (germination test results) per seedlot, we only included those seedlots which had been received by the genebank (through acquisition or regeneration) prior to 2006 and thus, have been in storage for a minimum of 20 years.
Data
Accession inventory and viability data for Vigna angularis, Cajanus cajan Sorghum bicolor, Glycine max, Phaseolus vulgaris, and Vigna radiata were queried to identify only those accessions regenerated/accessioned prior to 2006, and with a minimum of two viability results. The data fields included were: AGG accession number, taxonomy, biological status (e.g. traditional cultivar, landrace, breeding material), regeneration year, regeneration site, date tested, test result (%; germination) and germination test conditions. This data was exported into separate Excel files for each species. At the time of requesting this information, the date a seedlot entered storage was not recorded, therefore a storage entry date was estimated, based on harvest and processing timelines, according to the regeneration year. From this, the approximate storage time (in days) was calculated by deducting the storage date from the viability test date(s). Prior to analysis, any entries with missing, incomplete or incorrect data were excluded.
Additional periodic testing
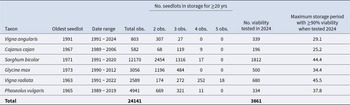
To increase the number of observations, and to get a better understanding of the current viability status of seeds from each species, we completed an additional 3,861 germination tests in 2024, across the six species (Table 2). For Vigna angularis, V. radiata and Cajanus cajan; all active seedlots which were at least 20 years old, and which already had associated viability data were able to be tested. Due to the larger number of seedlots associated with the remaining three species, only a proportion were able to be retested in 2024. These seedlots were first selected based on the completeness of inventory data, followed by time since the last test (minimum of 5 years) and on the quantity of seed available. Ability to germinate was estimated with two replicates of 25 seeds, sown onto germination paper (Anchor Paper Co.). They were incubated, following the species-specific germination protocols recommended by the International Seed Testing Association (ISTA, 2023). Seeds were classified as germinated when the radicle had emerged by at least 2 mm.
Summary of the historical viability monitoring data for six tropical crop species, including the number of the seedlots which had been in storage for a minimum of 20 years, and which showed multiple observations. Of the total number of seedlots, from each species, that were re-tested in 2024, the maximum storage period whereby seeds showed ≥90% viability is reported
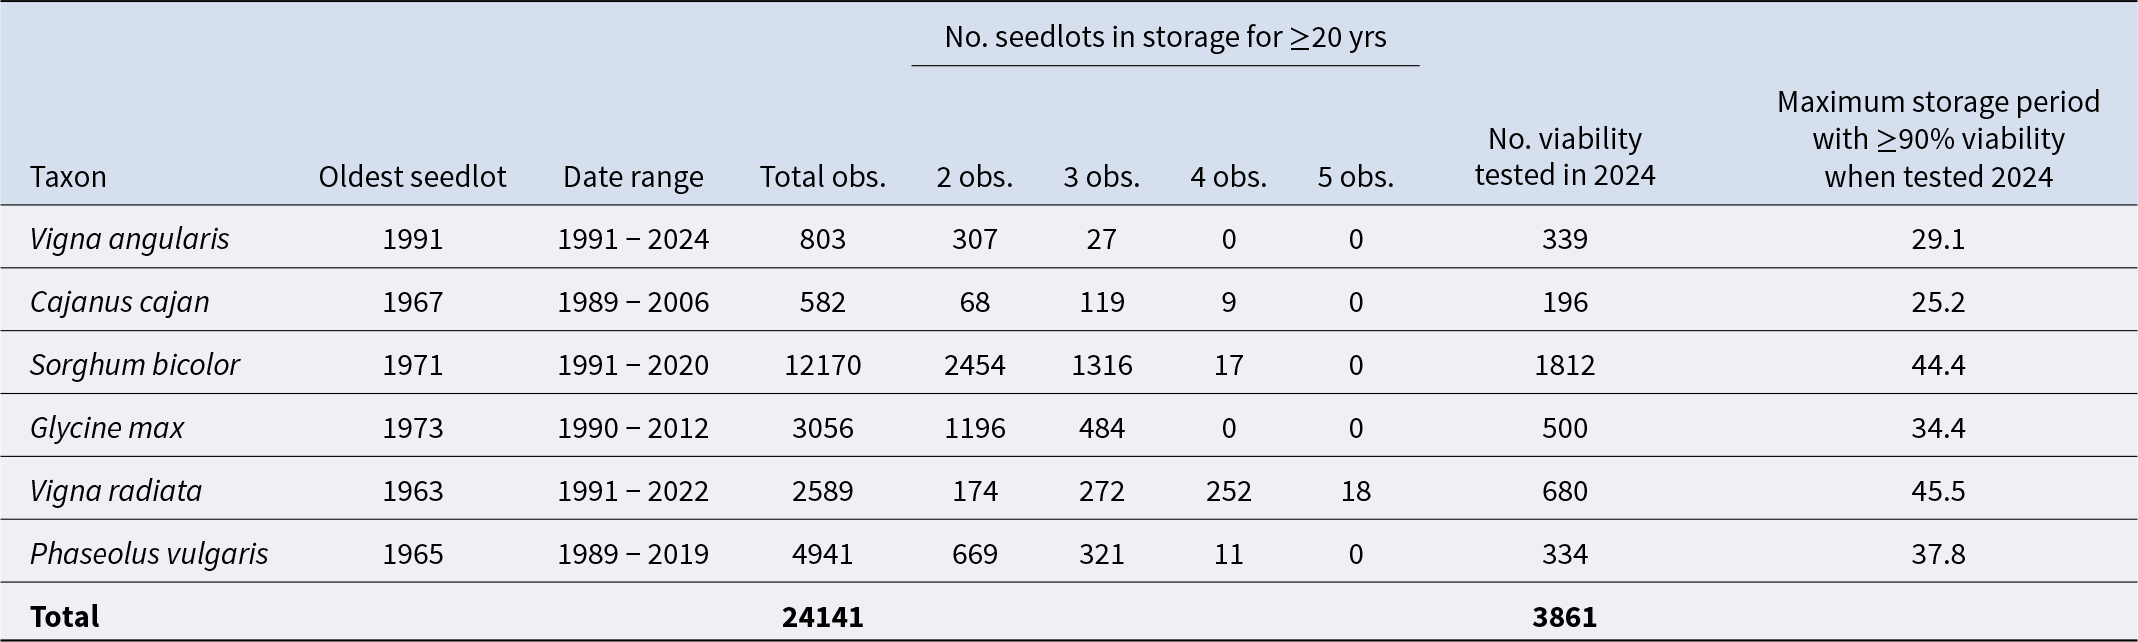
Table 2 Long description
The table summarizes long-term seed viability monitoring for six tropical crop species, focusing on seedlots stored for at least 20 years and how many times each seedlot was observed. For each species it lists the oldest seedlot year, the monitoring date range, total observations, counts of seedlots with two to five observations, how many seedlots were viability-tested in 2024, and the longest storage time that still met at least 90 percent viability in 2024. Sorghum bicolor has by far the most observations at 12,170 and also a long high-viability storage period at 44.4 years, with 1,812 seedlots tested in 2024. Vigna radiata shows the longest high-viability storage period at 45.5 years and is the only species with notable numbers of four and five observations, including 252 with four and 18 with five. The shortest high-viability storage period is for Cajanus cajan at 25.2 years, despite having an oldest seedlot from 1967 and 196 seedlots tested in 2024. Other maximum high-viability storage periods are 29.1 years for Vigna angularis, 34.4 years for Glycine max, and 37.8 years for Phaseolus vulgaris. Across all species there are 24,141 total observations and 3,861 seedlots tested in 2024, but differences in observation counts and date ranges mean species are not equally monitored, which can affect comparisons.
Analysis
Change in ability to germinate during storage for each seedlot was analysed using probit analysis in GENSTAT (23rd Edition; VSN International Ltd, Hemel Hempstead, UK), for each species; thereby fitting the Ellis and Roberts (Reference Ellis and Roberts1980) seed viability equation:
 \begin{equation}v = Ki - p/\sigma \end{equation}
to estimate values for Ki (the theoretical initial viability in probits and providing the intercept of the fitted survival curves) and σ (the time it takes for viability to fall by 1 NED/probit). To suit this dataset, storage periods were transformed in years, thus p (time) and 1/σ (slope of the seed survival curve once percentages are transformed to probits) were in units of years and 1/years, respectively. With the potential for Ki and σ to differ between seedlots, the full model was first fitted simultaneously to each seedlot (i.e. different values of Ki and σ) which revealed 3 patterns for change in the ability to germinate with storage period: no change detected, increase in the ability to germinate or a decline in the ability to germinate.
To determine appropriate monitoring intervals, based on observed longevity estimates, for each species; seed survival curves were fitted only to those seedlots which showed a decline in the ability germinate (i.e. assuming loss in viability) across a minimum of three observations during storage. However, for Phaseolous vulgaris and Vigna angularis the representative number of seedlots adhering to these criteria was small, in relation to the total number of active accessions for the species. Therefore, seedlots with two observations – but which had the first test carried out within two years of storage and the subsequent test a minimum of 15 years later – were also included in the analyses. The full model was fitted simultaneously to each seedlot before fitting the reduced model, constraining σ to a common value. The approximate F-test was used to determine the best model (i.e. that can be fitted without a significant increase in the residual deviance; p > 0.05). The estimate of p 85 (time for viability to decline to 85%) was also used as a measure of longevity, with monitoring intervals set at a third of the time for viability to fall to 85%, in accordance with the Genebank Standards (FAO 2014)
Results
Of the total 31,471 active accessions within the AGG’s tropical collection, Sorghum bicolor, Glycine max, Vigna radiata and Phaseolous vulgaris contribute the most accessions. Of the six target species, Sorghum bicolor accounts for the largest number of accessions (6,662) and Vigna angularis the least number of accessions (340) (Table 1). The entire dataset, combining the viability data across all species, consisted of 24,141 observations (viability test results) (Table 2). The date ranges of these observations varied between species, with the earliest recorded tests carried out between 1989 and 1991 (Table 2). Similarly, the total number of observations also varied between species and between seedlots, with some seedlots showing up to five observations (Table 2). Furthermore, of the total number of active seedlots within each species, the proportion that were at least 20 years old, and which showed multiple observations during storage, was variable (Table 1 and 2). For example, 334 of the total 340 active Vigna angularis accessions were at least 20 years old and showed multiple observation data – equating to 98% of the data. However, for Vigna radiata this proportion equated to only 33% of the total number of active accessions (Table 1 and 2).
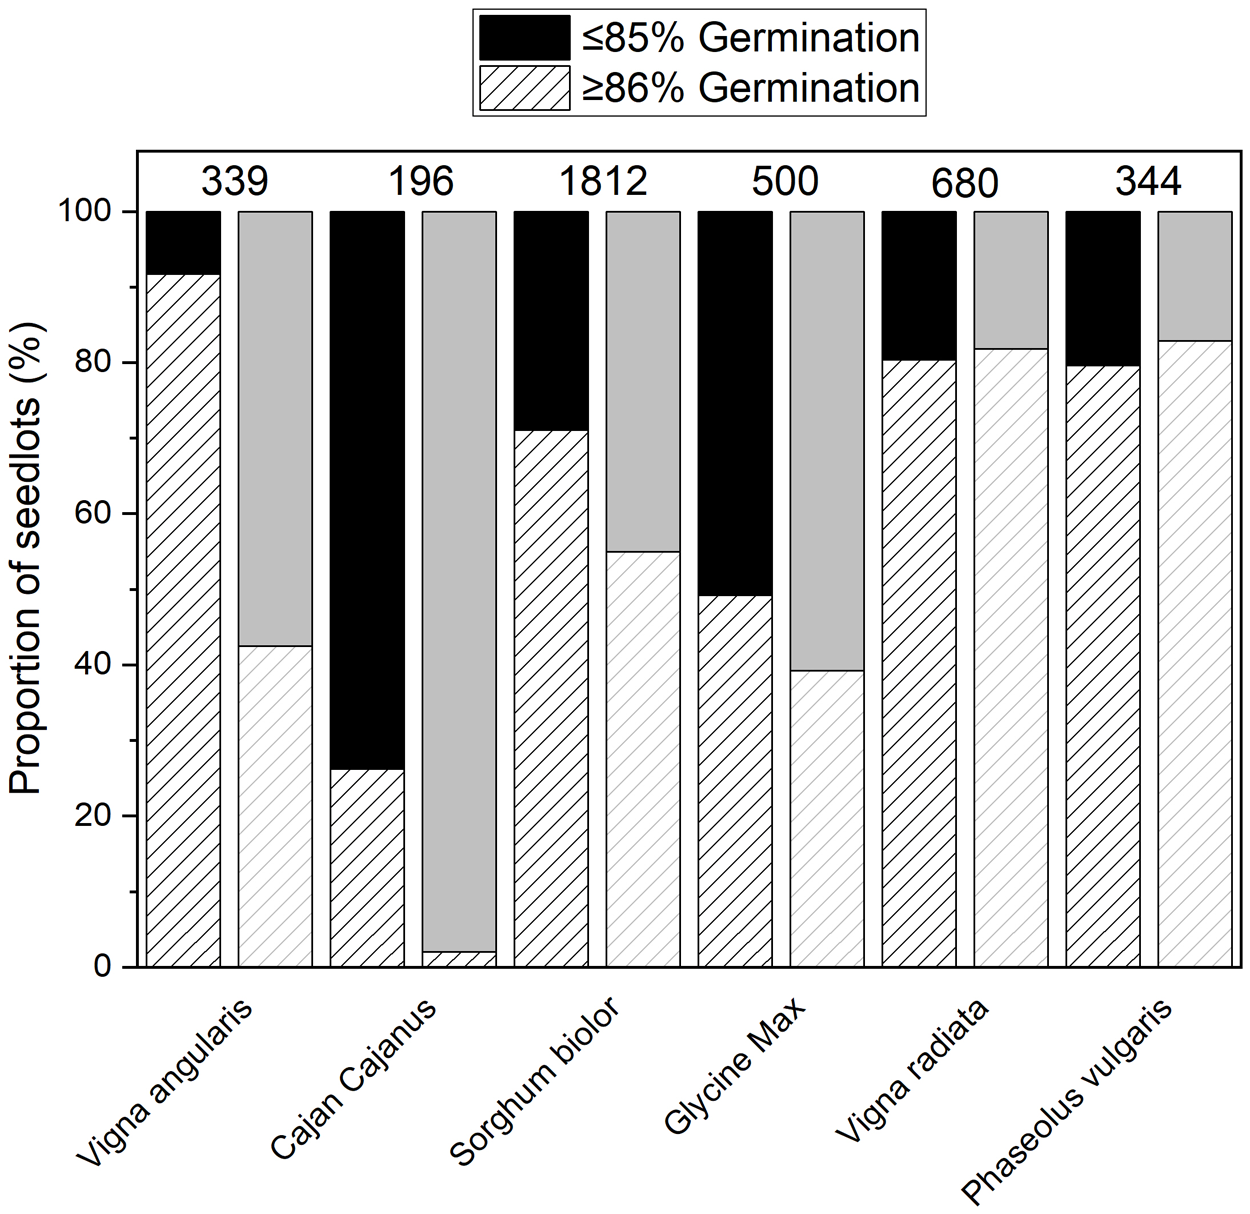
The number of seedlots, for each species, which underwent a germination test in 2024 is recorded in Table 2. These tests provided evidence of seeds showing ≥ 90% viability after at least 25 years under genebank storage, for all species (Table 2). For Sorghum bicolor and Vigna radiata, ≥ 90% viability was recorded in seeds even after 44 years under long-term storage at the AGG. Of those tested in 2024, the proportion which showed above and below the viability threshold of 85% varied between species (Figure 1). Phaseolus vulgaris and Vigna radiata had the greatest proportion of accessions showing above 85% viability when tested in 2024, compared to the other species. In fact, these proportions did not change much, compared with the proportion of accessions showing >85% on the initial test, despite the average storage time of 28.9 and 28.6 years for Phaseolus vulgaris and Vigna radiata, respectively. For all other species, the proportion of seedlots showing a viability below 85% was greater when tested in 2024 compared to their first test – carried out at least 20 years earlier (Figure 1). Based on the 2024 germination result, Cajanus cajan has the greatest proportion of accessions requiring regeneration, with only 4 showing a viability >85% after an average of 36.2 years in storage. For Vigna angularis, Sorghum bicolor and Glycine max; the proportions requiring regeneration following their recent 2024 viability test result are 58, 45 and 61%, respectively (Figure 1). Vigna angularis saw the greatest increase in the proportion showing <85% between the two test results, with only 8% of accessions showing a viability <85% on their first test compared to 57.5%, 24.5 years later.
Proportion of seedlots showing a viability above (pattern) or below (solid) the viability threshold of 85% on their first (black/left) and most recent germination test result, carried out in 2024, (grey/right) for each species. The numbers represent the total number of seedlots tested from each species.
Longevity analysis
All seedlots that had been in storage for a minimum of 20 years, and which had at least three observations (viability results) during storage, were subjected to probit analysis. For Vigna angularis and Phaseolus vulgaris, seedlots with two observations (with the first test carried out within two years of storage and the subsequent test a minimum of 15 years later) were also included. The total number of seedlots analysed for each species is shown in Table 3. All species showed extreme variability, between seedlots, with the change in ability to germinate during storage – some showing an increase in viability and some showing a decrease in viability with storage time (Table 3; Figure 2). There was also evidence of some seedlots maintaining viability during storage (i.e. showing no change in ability to germinate) in all species, except Cajanus cajan. The proportion of seedlots (based on the total analysed) which showed the expected negative trend (decline in viability) during storage was at least 50% for each species; with Cajanus cajan and Vigna angularis showing the greatest proportion of 98 and 85%, respectively (Table 3). Amongst the seedlots analysed for Sorghum bicolor, Vigna radiata and Glycine max, the majority showed shallow slopes (Figure 2) with Sorghum showing evidence of the slowest rate in viability loss of − 0.00146 normal equivalent deviates (NED) year−1 (σ = − 6849.3 years). Contrastingly, amongst the species, the fastest rate of viability loss (σ) varied from − 0.7 years (Glycine max) to − 5.2 years (Cajanus cajan). The variation in slopes differed between species, with seedlots of Sorghum bicolor varying between extremes of loss in viability of − 0.22 normal equivalent deviates year −1 (σ = – 4.4 years) to an increase in the ability to germinate of 0.33 normal equivalent deviates a year−1 (σ = 3.3 years). As another example, for Vigna angularis this variation in ability to germinate ranged from a loss of − 0.42 normal equivalent deviates a year−1 (σ = − 2.4 years) to an increase of 0.14 normal equivalent deviates a year−1 (σ = 7.2 years) (Figure 2).
Variation in slope (1/σ) amongst the seedlots for each of the six target species. Estimates of σ were derived by fitting probit analysis simultaneously to successive germination results carried out during storage at the AGG, for each seedlot.
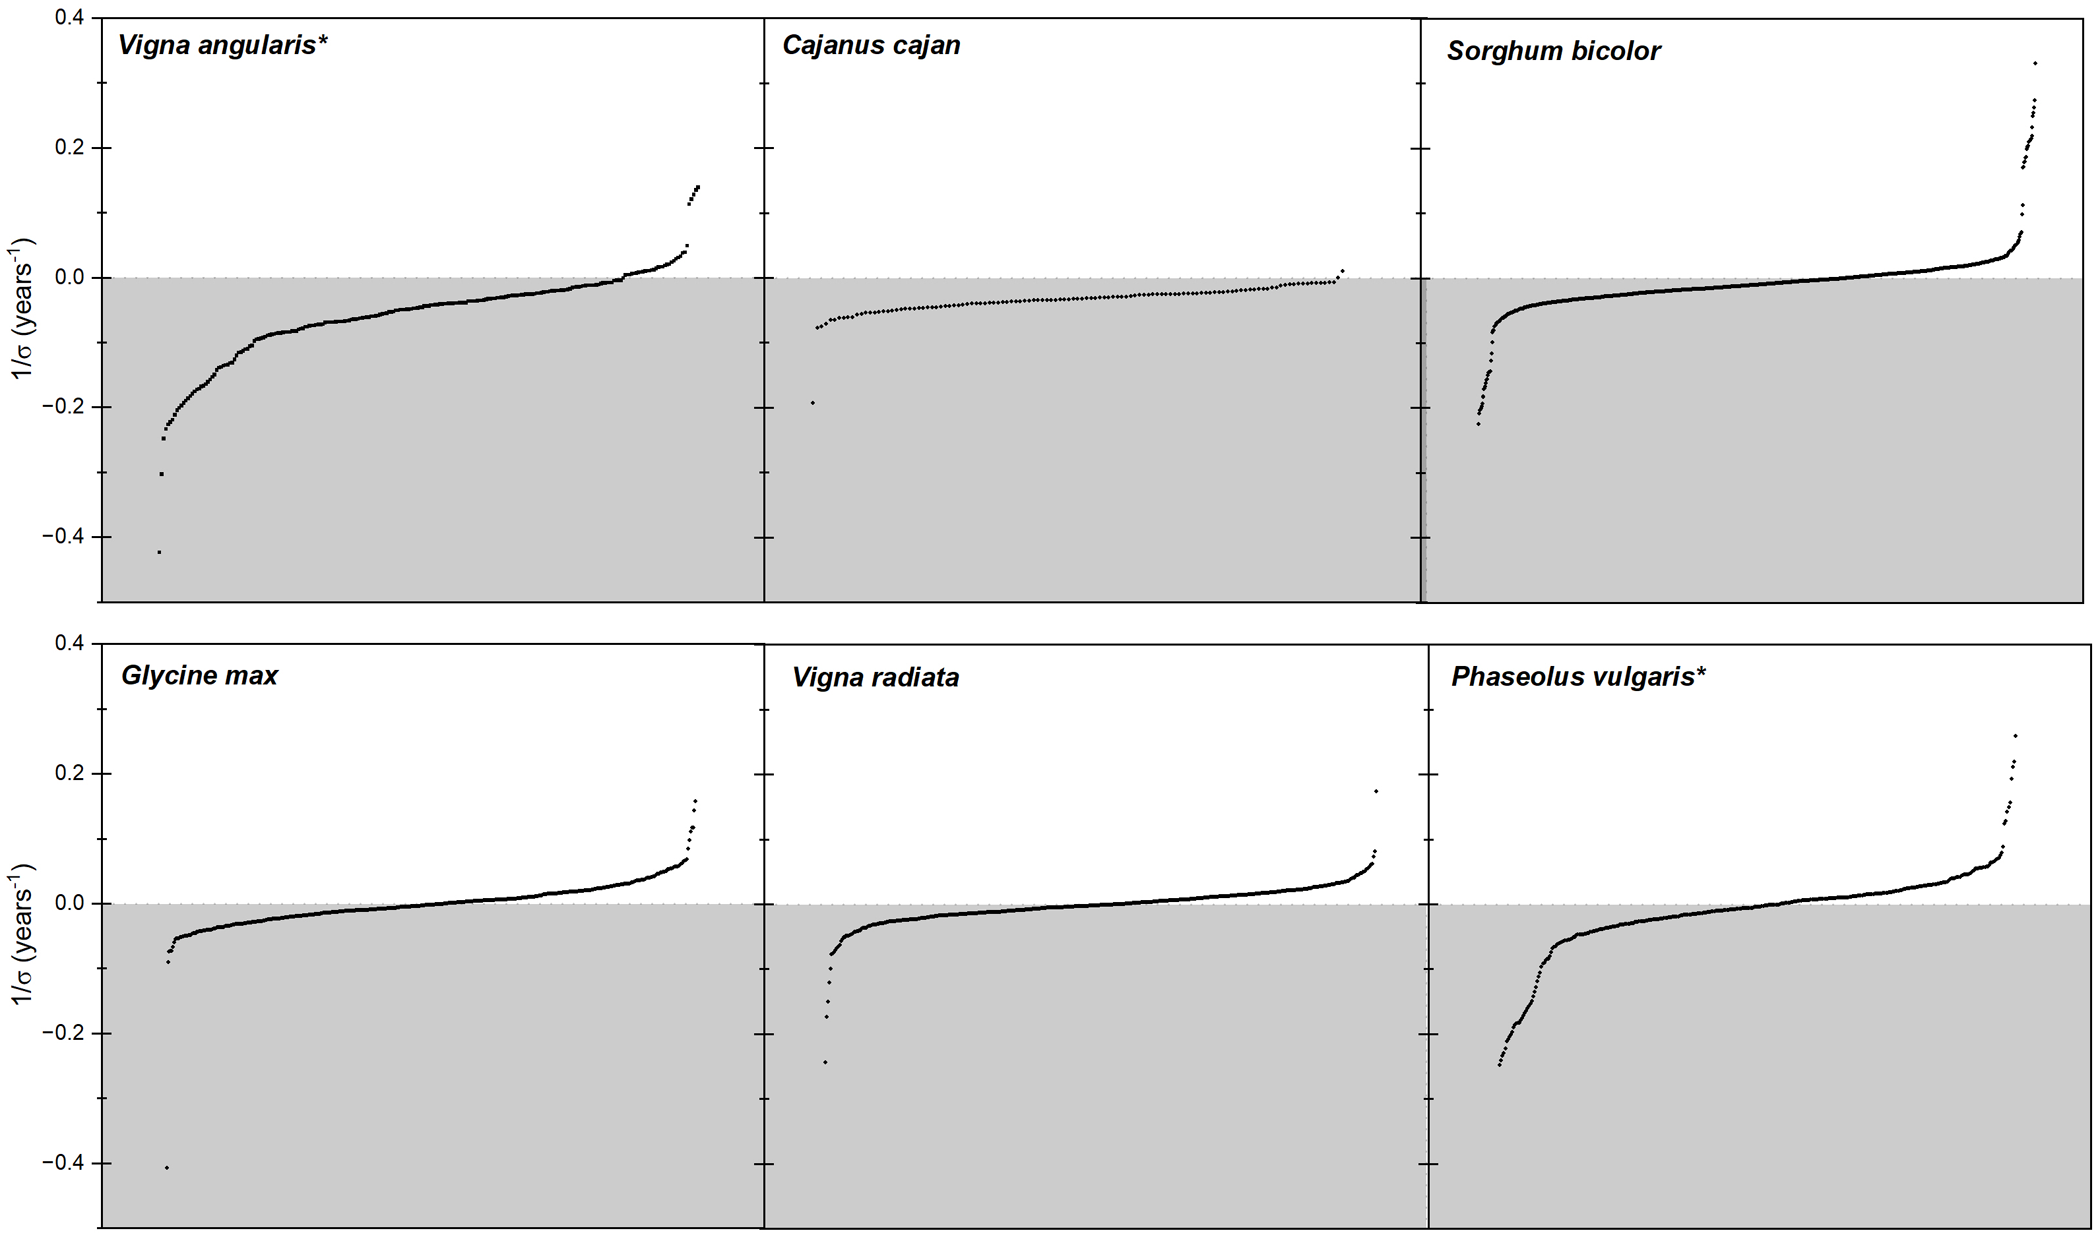
Figure 2 Long description
The image contains six individual line plots arranged in two rows of three. Each plot represents a single species and displays the distribution of 1 over sigma values across seedlots. The species labels are: Vigna angularis asterisk (top left), Cajanus cajan (top centre), Sorghum bicolor (top right), Glycine max (bottom left), Vigna radiata (bottom centre) and Phaseolus vulgaris asterisk (bottom right). The vertical axis is labeled 1 over sigma and is measured in years superscript negative 1. The vertical axis range spans from approximately negative 0.4 to positive 0.4 across all six plots. The horizontal axis represents individual seedlots ranked in order, with no numeric unit label visible. A shaded region occupies the lower half of each plot, below the zero baseline, indicating the negative 1 over sigma range. The zero line is visible as a horizontal reference across all panels. Each plot contains a single continuous curve. The curve in each panel starts near zero or slightly below, remains relatively flat across the majority of seedlots and rises sharply upward at the right end of the horizontal axis. Vigna angularis: the curve remains near zero for most seedlots and rises to approximately positive 0.2 at the far right. Cajanus cajan: the curve stays close to zero with minimal spread and shows a modest rise toward the right end, with values concentrated near zero or slightly negative. Sorghum bicolor: the curve shows a wider spread, with the right tail rising to approximately positive 0.3 and the left end extending to approximately negative 0.2. Glycine max: the curve remains near zero for most of the range and rises to approximately positive 0.2 at the right end. Vigna radiata: the curve is flat near zero for most seedlots and shows a modest upward rise at the right tail, reaching approximately positive 0.2. Phaseolus vulgaris asterisk: the curve shows a steep rise at the right end, reaching approximately positive 0.3, with the left portion near zero. Sorghum bicolor shows the widest overall spread between the minimum and maximum values. Cajanus cajan shows the most concentrated distribution near zero.
Total number of seedlots from each species whose viability monitoring data were analysed by probit analysis, and the pattern for change in the ability to germinate with storage period: no change detected, increase in the ability to germinate or a decline in the ability to germinate, identified
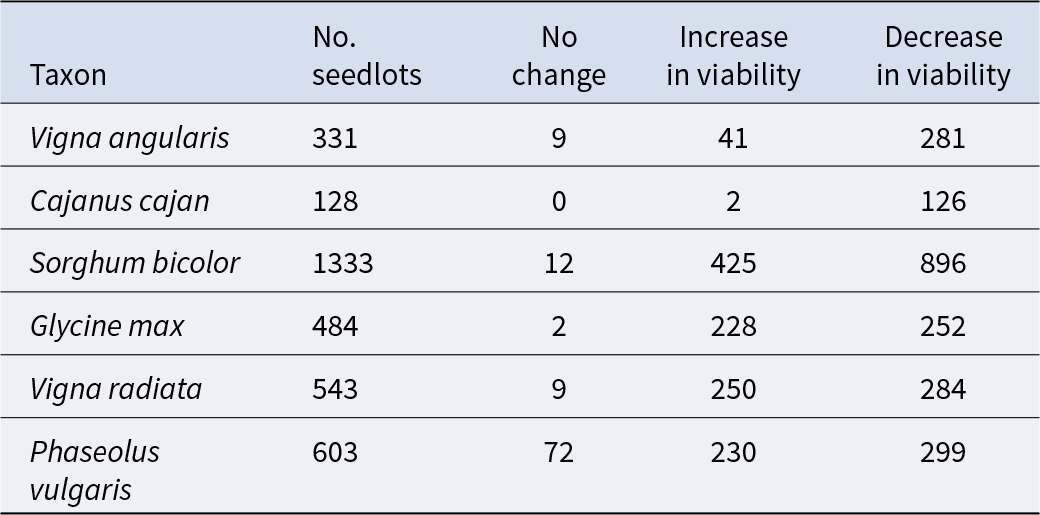
Table 3 Long description
The table summarizes, by species, how many seedlots were analyzed and whether germination ability over storage showed no detectable change, an increase, or a decrease. Declines dominate for every taxon: Vigna angularis has 281 decreases out of 331 seedlots, Cajanus cajan 126 out of 128, Sorghum bicolor 896 out of 1333, Glycine max 252 out of 484, Vigna radiata 284 out of 543, and Phaseolus vulgaris 299 out of 603. Sorghum bicolor has the largest dataset and also the highest count of increases, with 425 seedlots improving, but decreases still outnumber increases. Increases are also notable for Vigna radiata with 250 and Glycine max with 228, while Cajanus cajan shows almost no improvement with only 2 increases and no cases of no change. Phaseolus vulgaris stands out for the highest number of no-change outcomes at 72, compared with 0 to 12 for the other species. Counts reflect detected patterns from the analysis and do not indicate the size of the change or the underlying causes.
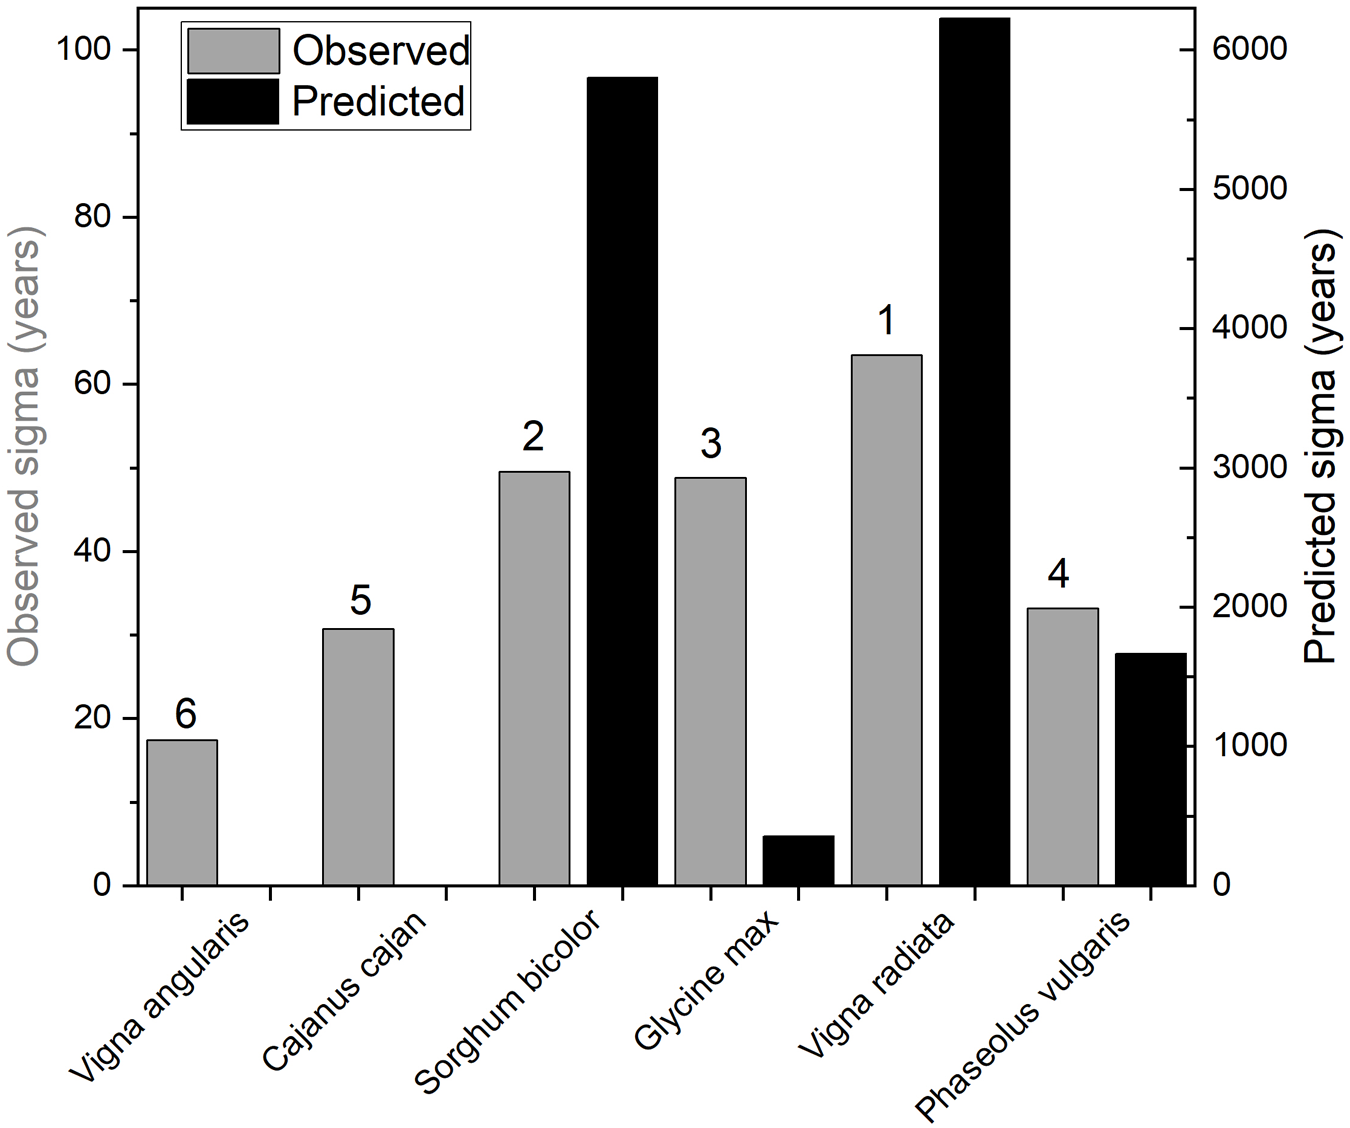
Survival curves for those seedlots, within each species, that showed a consistent decline in viability during storage (Table 3) were fitted by probit analysis, applying both the full and reduced models (Equation 1). For all species, seedlots could be constrained to a common slope (σ) without a significant increase in the residual deviance (P > 0.05) (Figure 3; Table 4), with the survival curve in Figure 3 representing the seedlot with the greatest longevity (i.e. the highest value of Ki and common value for σ – 1). (Figure 3). Despite this, differences in seed longevity were apparent between the species – shown by the different common values in σ (Table 4). The species which showed the greatest longevity under long-term storage was Vigna radiata, with a sigma value (σ = time it takes for viability to fall by 1 probit) of 63.5 years. Sorghum bicolor showed the second highest longevity with a loss equating to − 0.02 normal equivalent deviates year −1 (σ = 49.6 years) (Table 4). These two species, which ranked the highest in terms of observed longevity under genebank storage at the AGG, is consistent with their predicted longevities – estimated using the species-specific viability constants for Sorghum bicolor (Kuo et al. Reference Kuo, Shan and Tseng1990) and Vigna radiata (Ellis et al. Reference Ellis, Hong and Roberts1988), on the seed information database (SER/INSR/RBG Kew 2023) (Figure 4). Based on the predicted longevities, which can also be estimated for Glycine max (Dickie et al. Reference Dickie, Ellis, Kraak, Ryder and Tompsett1990) and Phaseolus vulgaris (Ellis et al. Reference Ellis, Hong, Roberts and Tao1990), Glycine max – with a predicted longevity of 353.9 years – is shorter lived compared with Phaseolus vulgaris (σ = 1667 years) (Figure 4). However, this was not supported by the observed longevity of these species under long-term storage at the AGG (Figure 4), with Glycine max showing a longevity of 48.8 years – close to Sorghum bicolor – and Phaseolus showing a longevity of 33.2 years (Table 4; Figure 3). The inherent longevities for Vigna angularis and Cajanus cajan are unknown thus, longevity predictions were not possible (Figure 4). However, based on the observed longevities, these two species showed a shorter longevity compared with the other four species, with Vigna angularis showing the shortest at just 17.4 years (Table 3; Figures 3 and 4). Interestingly, despite the observed differences in longevities between the species, there was evidence of seeds maintaining high viability (>90%) for the maximum storage period recorded within each species, with exception to Cajanus cajan (Table 4). The longest period of storage Cajanus cajan seeds have shown to remain above 90% is 16 years, out of the maximum 39.2 years, under long-term storage, compared with the remaining species which show evidence of maintaining high viability for at least 29 years (Table 4).
Historical viability data from seedlots of Vigna angularis, Cajanus cajan, Phaseolus vulgaris, Glycine max, Sorghum bicolor, and Vigna radiata which had been in storage for a minimum of 20 years, plotted against storage time. Only those seedlots which showed a decline in viability, across at least three observations (viability results) during storage, were analysed by probit analysis. The asterisk (*) represents the species where seedlots showing two observations (with the first test carried out within two years of storage and the subsequent test a minimum of 15 years later) were also included in the analyses. Probit analysis revealed the rate of loss in longevity (1/σ) did not significantly differ between seedlots (p > 0.05); thus, the survival curve represents the seedlot showing the greatest longevity (highest value of Ki and common value for σ−1). The arrows show the variation in Ki (initial quality) amongst the seedlots. The dashed line represents the 85% viability threshold, below which regeneration is triggered.
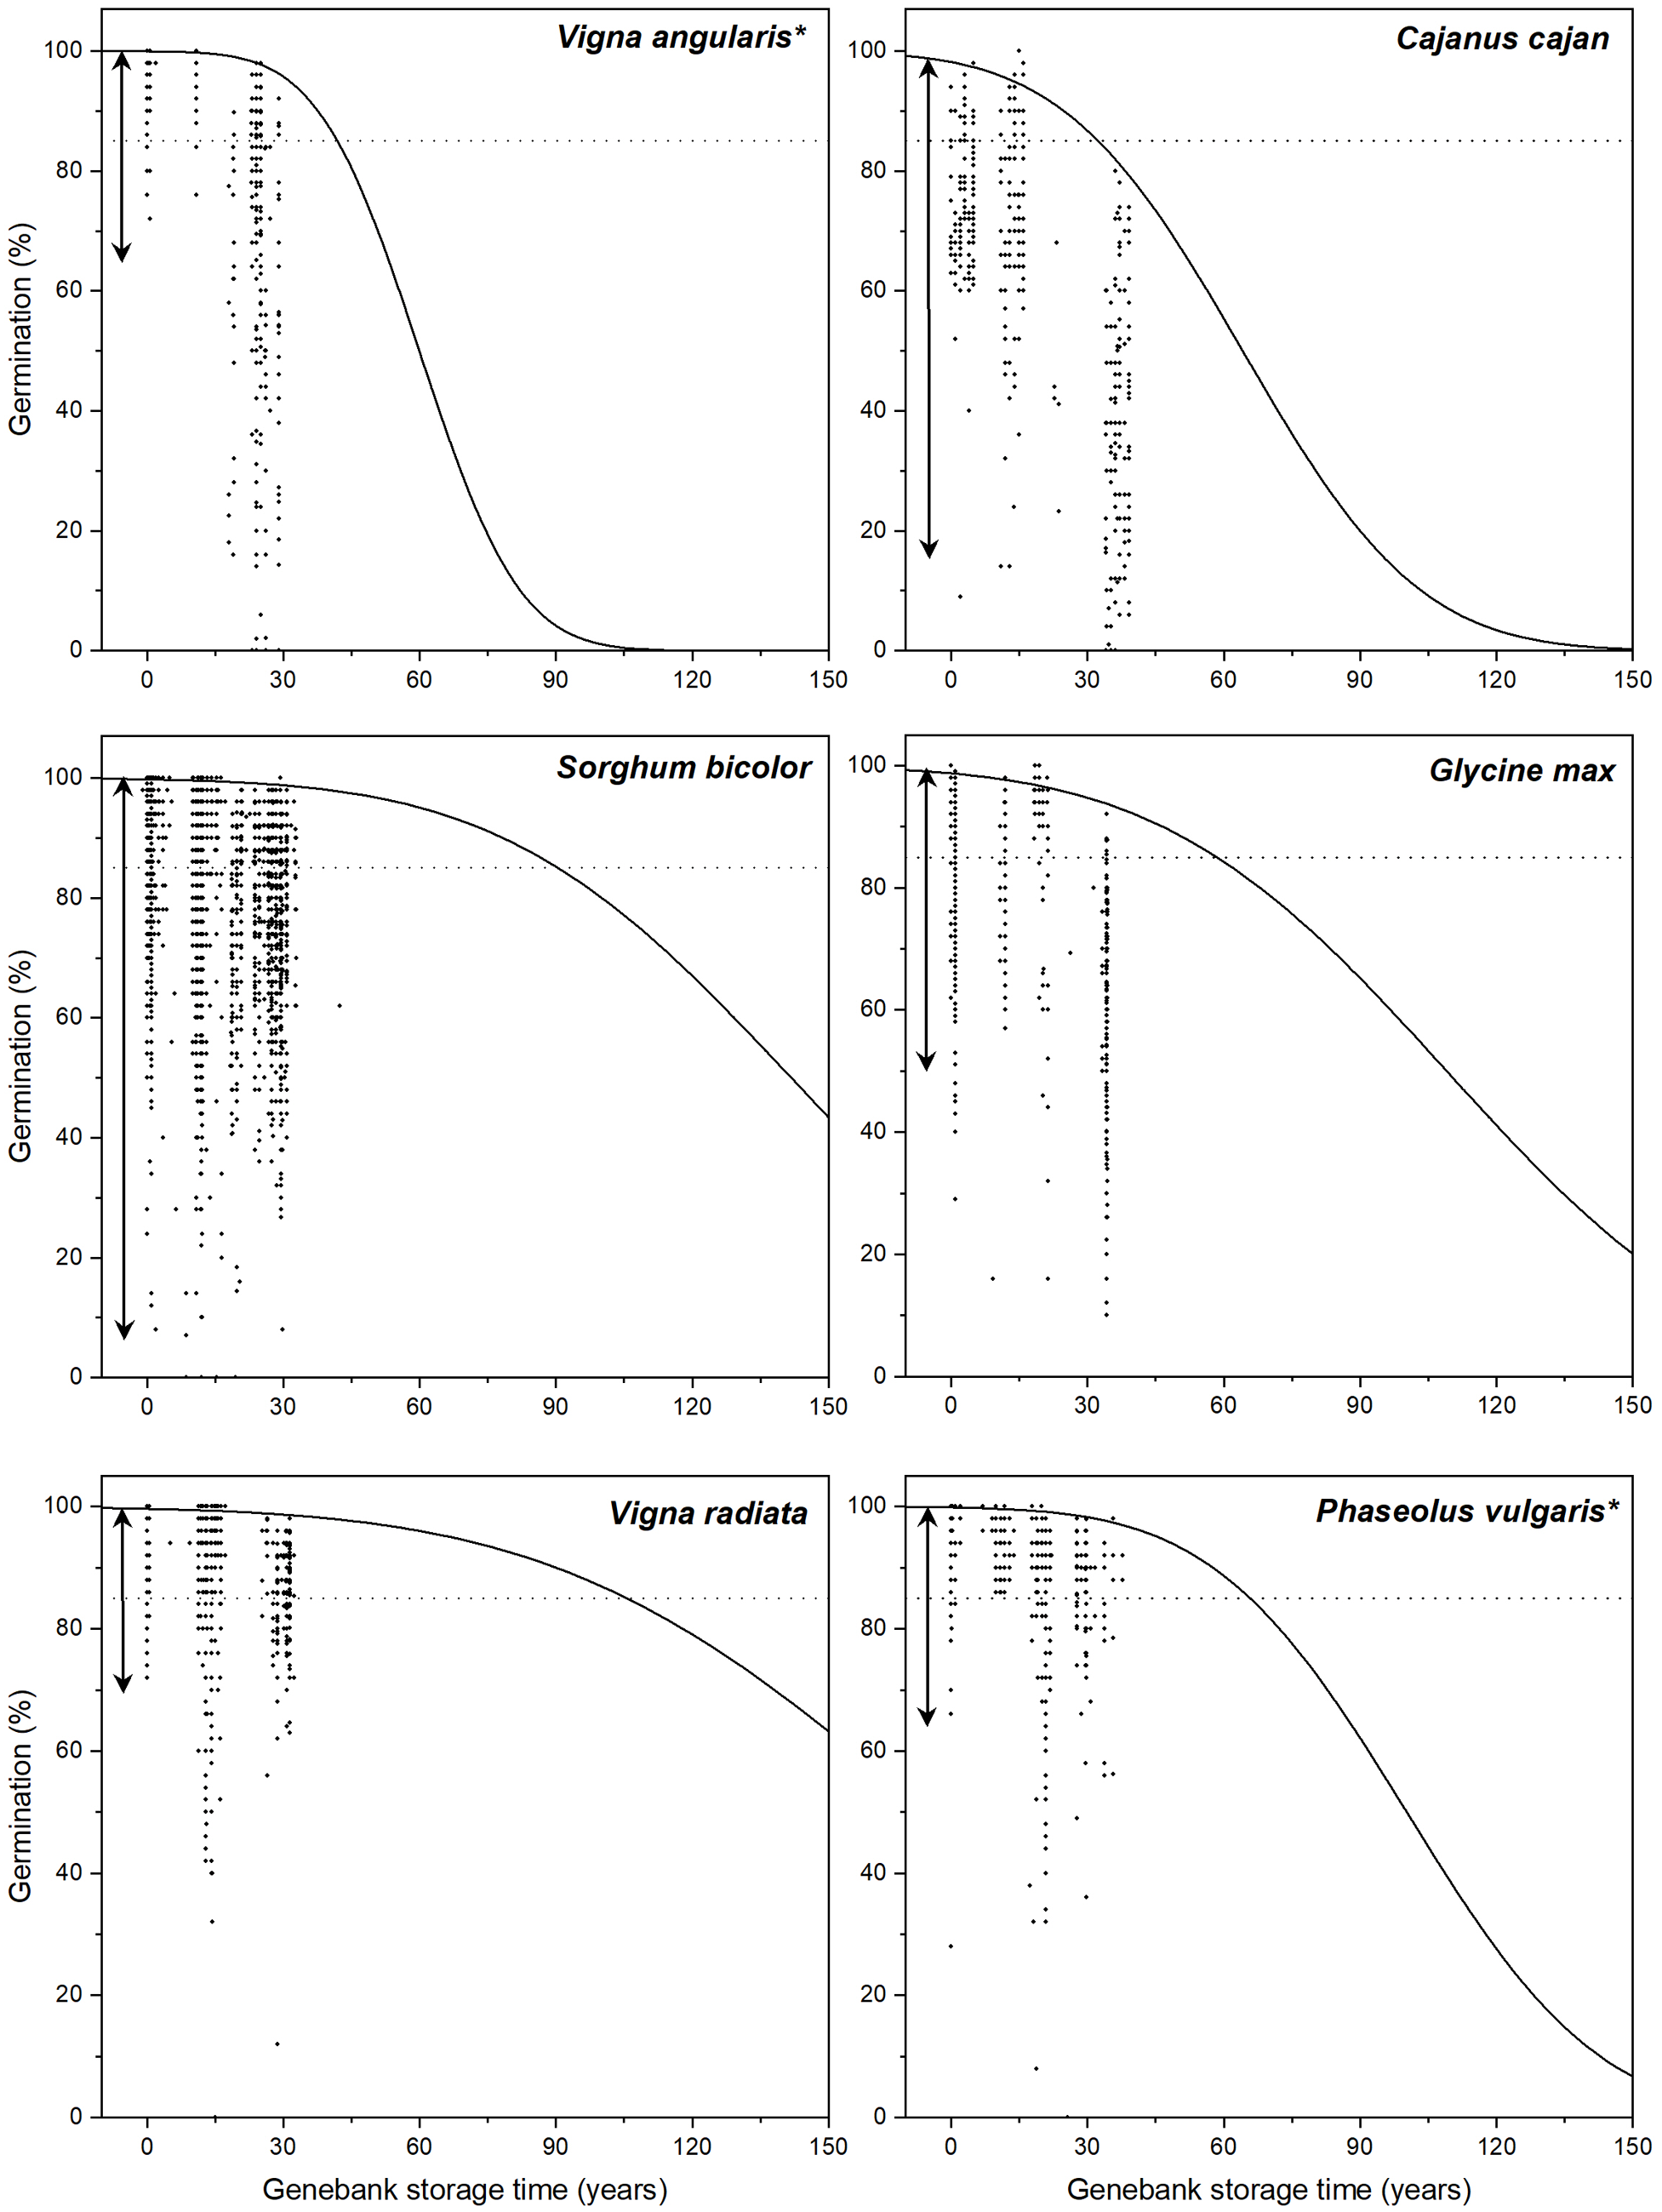
Figure 3 Long description
The image A showing a line graph titled Vigna angularis asterisk. The horizontal axis label is Genebank storage time (years). The horizontal axis range is 0 to 150. The vertical axis label is Germination (percent). The vertical axis range is 0 to 100. A dotted horizontal line is drawn at 85 on the vertical axis. A solid curve starts near 100 at 0 years, stays near 100 until around 40 years, then declines steeply and approaches 0 by around 100 years. Many small point markers are plotted in vertical clusters around about 20 to 40 years, with germination values spread from near 0 up to near 100. Two vertical arrows are drawn near about 0 years. The image B showing a line graph titled Cajanus cajan. The horizontal axis label is Genebank storage time (years). The horizontal axis range is 0 to 150. The vertical axis label is Germination (percent). The vertical axis range is 0 to 100. A dotted horizontal line is drawn at 85 on the vertical axis. A solid curve starts near 100 at 0 years and declines steadily, reaching near 0 by around 140 to 150 years. Many small point markers are plotted in vertical clusters around about 10 to 50 years, with germination values spread from near 0 up to near 100. A vertical arrow is drawn near about 0 years. The image C showing a line graph titled Sorghum bicolor. The horizontal axis label is Genebank storage time (years). The horizontal axis range is 0 to 150. The vertical axis label is Germination (percent). The vertical axis range is 0 to 100. A dotted horizontal line is drawn at 85 on the vertical axis. A solid curve starts near 100 at 0 years, stays near 100 through much of the range, then declines and is around the mid range of the vertical axis by 150 years. Many small point markers are plotted in vertical clusters around about 0 to 40 years, with germination values spread from near 0 up to near 100. A vertical arrow is drawn near about 0 years. The image D showing a line graph titled Glycine max. The horizontal axis label is Genebank storage time (years). The horizontal axis range is 0 to 150. The vertical axis label is Germination (percent). The vertical axis range is 0 to 100. A dotted horizontal line is drawn at 85 on the vertical axis. A solid curve starts near 100 at 0 years and declines gradually, reaching around 20 by 150 years. Many small point markers are plotted in vertical clusters around about 0 to 40 years, with germination values spread from near 0 up to near 100. Two vertical arrows are drawn near about 0 years. The image E showing a line graph titled Vigna radiata. The horizontal axis label is Genebank storage time (years). The horizontal axis range is 0 to 150. The vertical axis label is Germination (percent). The vertical axis range is 0 to 100. A dotted horizontal line is drawn at 85 on the vertical axis. A solid curve starts near 100 at 0 years, stays near 100 through much of the range, then declines and is around 60 by 150 years. Many small point markers are plotted in vertical clusters around about 0 to 30 years, with germination values spread from near 0 up to near 100. A vertical arrow is drawn near about 0 years. The image F showing a line graph titled Phaseolus vulgaris asterisk. The horizontal axis label is Genebank storage time (years). The horizontal axis range is 0 to 150. The vertical axis label is Germination (percent). The vertical axis range is 0 to 100. A dotted horizontal line is drawn at 85 on the vertical axis. A solid curve starts near 100 at 0 years, stays near 100 until around 40 to 50 years, then declines steeply and approaches near 0 by around 140 to 150 years. Many small point markers are plotted in vertical clusters around about 0 to 40 years, with germination values spread from near 0 up to near 100. A vertical arrow is drawn near about 0 years.
Observed, common values of sigma for each species (as presented in Table 4), derived by fitting the Ellis and Roberts (Reference Ellis and Roberts1980) viability equation through probit analysis to successive germination data (grey bars). Predicted values of sigma (σ; years) for the four species where the viability constants are known. These predictions were estimated using the species-specific viability constants for Sorghum bicolor (Kuo et al. Reference Kuo, Shan and Tseng1990), Glycine max (Dickie et al. Reference Dickie, Ellis, Kraak, Ryder and Tompsett1990) Vigna radiata (Ellis et al. Reference Ellis, Hong and Roberts1988), and Phaseolus vulgaris (Ellis et al. Reference Ellis, Hong, Roberts and Tao1990) on the Seed Information Database (SER/INSR/RBG Kew 2023). The numbers represent the level of ranking – from the highest (1) to the lowest (6) observed longevity.
The results of fitting the viability equation (Ellis and Roberts Reference Ellis and Roberts1980; equation 1) to those seedlots where a decline in viability during storage was detected. For all species, seedlots could be constrained to a common value of σ; without a significant increase in the residual deviance compared to the best-fit model (P > 0.05). The slope of the seed survival curve (1/σ) and the time it takes for viability to fall by 1 NED/probit (σ) are transformed in years, and the minimum and maximum K i amongst contrasting seedlots is shown for each species, respectively. Of those seedlots analysed, the maximum storage period observed, as well as the maximum storage period after which seeds showed evidence of ≥90% viability, is reported
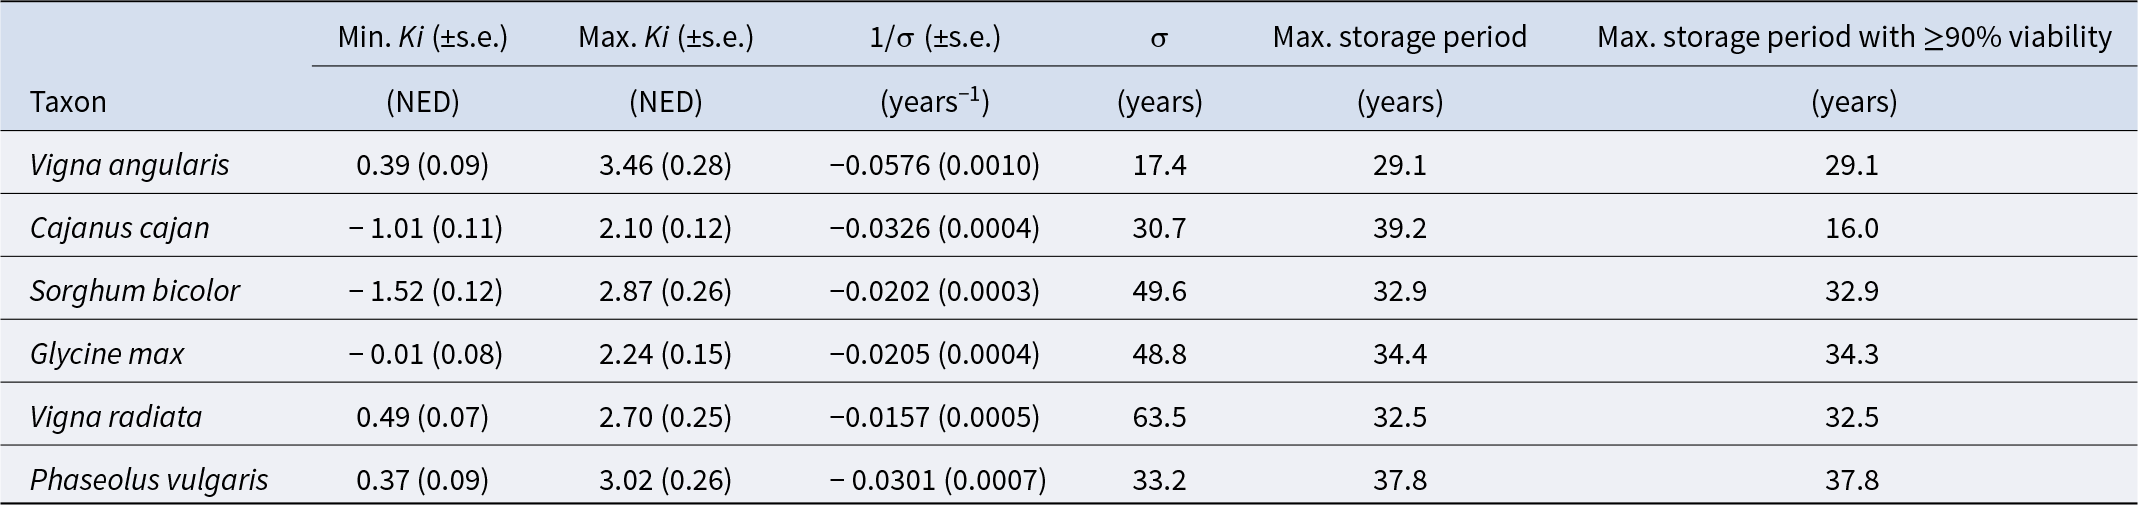
Table 4 Long description
The table summarizes fitted seed viability decline parameters for six crop taxa, reporting the minimum and maximum initial viability values across seedlots, the survival-curve slope per year, the time for viability to drop by one probit unit, and two observed storage-duration measures. The longest decline time is for Vigna radiata at 63.5 years, followed by Sorghum bicolor at 49.6 years and Glycine max at 48.8 years; the shortest is Vigna angularis at 17.4 years. Cajanus cajan and Phaseolus vulgaris are intermediate at 30.7 and 33.2 years, respectively. Slopes are negative for all taxa, indicating viability decreases with time; the steepest decline is Vigna angularis at minus 0.0576 per year, and the shallowest is Vigna radiata at minus 0.0157 per year. Minimum initial viability ranges from minus 1.52 in Sorghum bicolor to 0.49 in Vigna radiata, while maximum initial viability ranges from 2.10 in Cajanus cajan to 3.46 in Vigna angularis. The longest observed storage period is 39.2 years for Cajanus cajan, but its longest period maintaining at least 90 percent viability is 16.0 years; in contrast, Vigna angularis, Sorghum bicolor, Vigna radiata, and Phaseolus vulgaris maintain at least 90 percent viability for their full observed periods (29.1, 32.9, 32.5, and 37.8 years). Glycine max is nearly the same, with 34.4 years observed and 34.3 years at or above 90 percent viability. Standard errors are provided for the initial viability and slope estimates, so comparisons should consider uncertainty as well as the point values.
Observed germination during storage is highly variable between seedlots, even at the beginning of, or prior to, storage (Figure 3). This explains the variation seen in the estimates of Ki (theoretical initial viability) which were determined for each seedlot simultaneously (Table 4; Figure 3). For all species, there is evidence of seeds achieving an initial viability ≥98% (equivalent to 2.0558 NED). However, each species also had seeds which showed a considerably low initial viability, below 85% (equivalent to 1.0364 NED), with the lowest recorded in Sorghum bicolor with an NED equating to an initial viability of approximately 6.4% (Table 3, Figure 3). The current viability of a seedlot (either from an initial, or periodic germination test) can be used, in conjunction with the common values of σ (Table 4), to determine appropriate seedlot-specific monitoring intervals for each species (calculated as per Equation 1) (Table 5). The monitoring intervals have been calculated based on the estimated time for viability to fall to 85% (p 85) – as this is the most widely accepted viability threshold for cultivated crops used by genebanks. Amongst the species, the monitoring interval for seeds showing a high viability (≥98%) ranges from 5.9 years for seeds of Vigna angularis (which showed the lowest common estimate of σ; Table 4) to 21.5 years for Vigna radiata (Table 5). As the viability of the seed’s decline, the monitoring interval becomes more frequent, for all species.
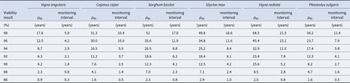
The recommended monitoring intervals (years) for each species, based on the viability result of the last germination test, and estimated using the common value of σ estimated from fitting the Ellis and Roberts (Reference Ellis and Roberts1980) viability equation to the observed germination data, by probit analysis. The monitoring intervals are calculated at a-third of the time it would take for viability to fall to 85%
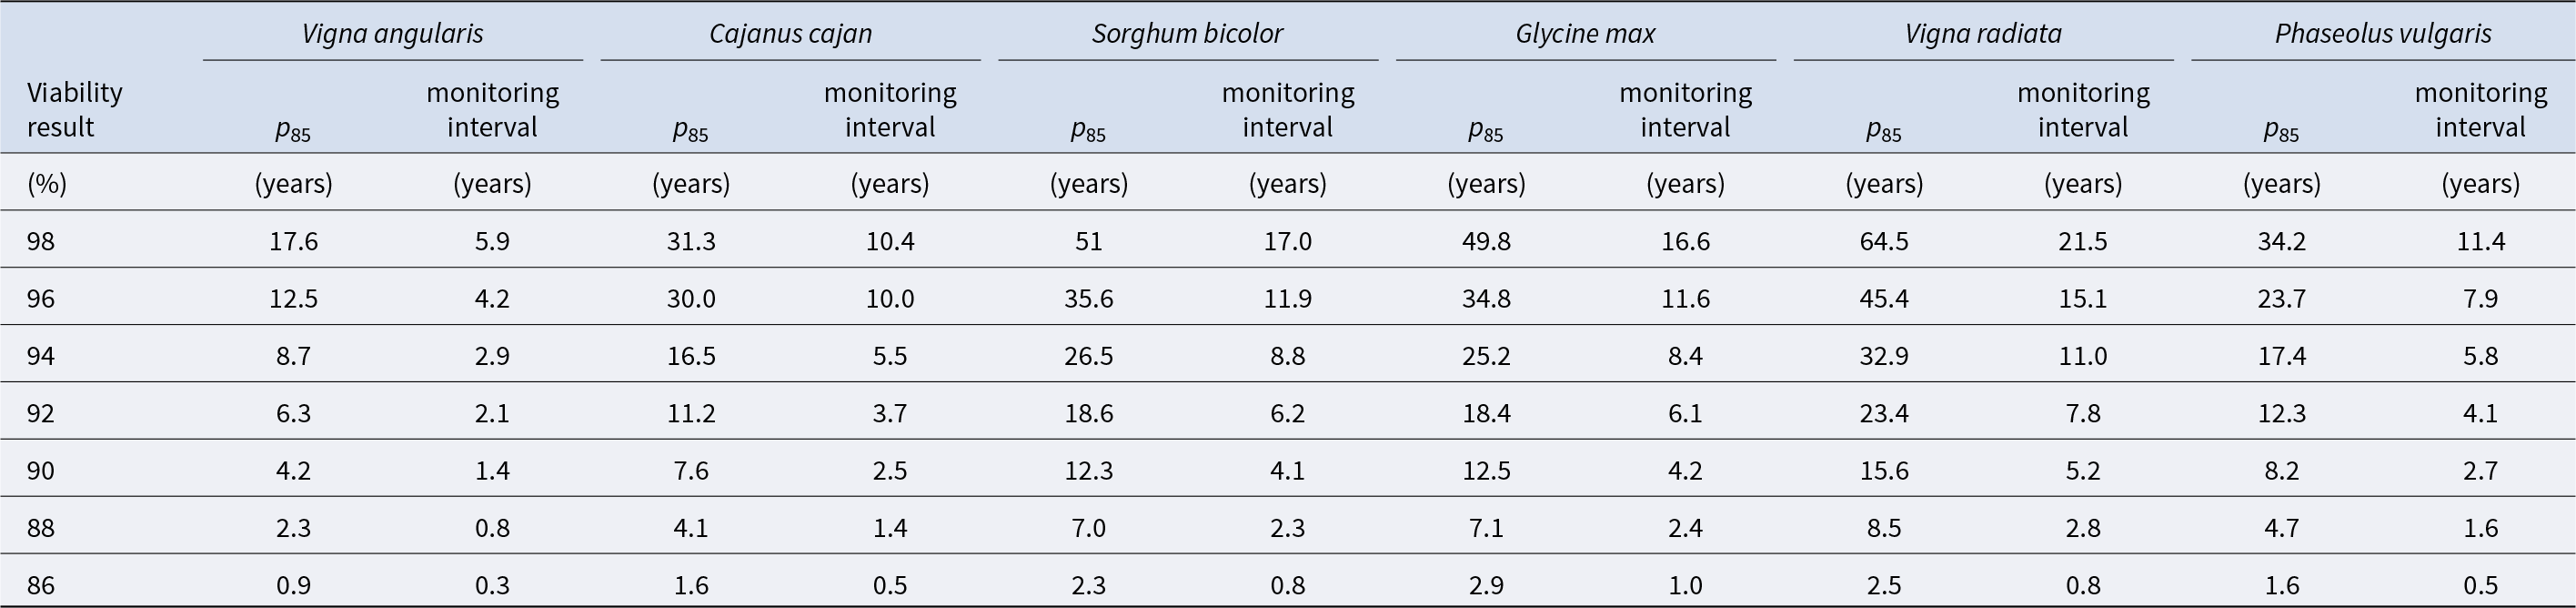
Table 5 Long description
The table lists, for six crop species, the estimated time until viability declines to eighty-five percent and the recommended monitoring interval in years for different last germination test results from eighty-six to ninety-eight percent. For every species, both the time to reach eighty-five percent viability and the monitoring interval decrease as the last-test viability drops. At ninety-eight percent viability, recommended monitoring intervals range from 5.9 years for Vigna angularis to 21.5 years for Vigna radiata, with Sorghum bicolor and Glycine max both around 17 years. At ninety percent viability, intervals narrow to 1.4 years for Vigna angularis, 2.5 for Cajanus cajan, 4.1 for Sorghum bicolor, 4.2 for Glycine max, 5.2 for Vigna radiata, and 2.7 for Phaseolus vulgaris. At eighty-six percent viability, all intervals are short, from 0.3 years for Vigna angularis up to 1.0 year for Glycine max. Across the table, Vigna radiata generally has the longest times and intervals, while Vigna angularis is consistently the shortest. Values are model-based estimates intended for scheduling monitoring, so they should be interpreted as approximate rather than exact predictions.
Discussion
Maintaining high accession viability is a critical management priority for genebanks therefore, it is advised they carry out germination tests periodically to monitor viability during storage to, subsequently, ensure the timely regeneration of material. Whilst the importance of collecting and recording viability data is well known, many genebanks cease testing once a seedlot has been replaced by newly harvested seed and only retain the current (most recent) germination result. It has only recently become apparent how important complete data collection is, not least in terms of assessing longevity, as; without retaining all historical data it is impossible to identify trends with respect to changes over time. Historical viability data highlights many inconsistencies in terms of how the collection was managed over time: from missing/incomplete data, to changes in germination protocols (test procedures, temperature regimes and dormancy-breaking treatments) throughout storage (Ellis et al. Reference Ellis, Nasehzadeh, Hanson and Woldemariam2018, Reference Ellis, Nasehzadeh, Hanson, Ndiwa and Woldemariam2019; Whitehouse et al. Reference Whitehouse, Hay and Lusty2020; Hay et al. Reference Hay, Whitehouse, Ellis, Hamilton, Lusty, Ndjiondjip, Tia D’ Wenzel, Santos, Yazbek, Azevedo, Peerzada, Abberton, Oyatomi, de Guzman, Capilit, Muchugi and Kinyanjui2021). Probit analysis, carried out on all seedlots, within each species simultaneously, revealed a substantial proportion which showed an increase in the ability to germinate during storage (Table 3). This is likely to have resulted from the lack of control of hardseededness, which was not consistently controlled for by scarification in earlier germination test procedures; and/or a result of there being an improvement in the germination protocol which deemed more effective in promoting viable seed germination than previously.
Seedlots from the six target species that showed a decline in viability during the minimum 20-year storage period (Table 3) could be constrained to a common value of σ (p > 0.05), when fitting probit analysis to successive germination results (Table 4; Figure 3). This equated to observed longevity estimates of 17.4, 30.7, 33.2 49.6, 48.8, 63.5 and years for Vigna angularis, Cajanus cajan, Phaseolus vulgaris, Glycine max, Sorghum bicolor, and Vigna radiata, respectively (Table 4; Figure 3). Understanding interspecies differences in seed longevity is critical to the sustainability of genebank collections. There have been many papers in the literature which report inter-species differences in longevity under genebank storage (Walters et al. Reference Walters, Wheeler and Grotenhuis2005; Lee et al. Reference Lee, Jeon, Lee, Lee and Kim2013; Van Treuren et al. Reference Van Treuren, de Groot and van Hintum2013, Reference Van Treuren, Bas, Kodde, Groot and Kik2018; Hay et al. Reference Hay, de Guzman and Sackville Hamilton2015, Reference Hay, Whitehouse, Ellis, Hamilton, Lusty, Ndjiondjip, Tia D’ Wenzel, Santos, Yazbek, Azevedo, Peerzada, Abberton, Oyatomi, de Guzman, Capilit, Muchugi and Kinyanjui2021; Ellis et al. Reference Ellis, Nasehzadeh, Hanson and Woldemariam2018, Reference Ellis, Nasehzadeh, Hanson, Ndiwa and Woldemariam2019; Yamasaki et al. Reference Yamasaki, Domon, Tomooka, Baba-Kasai, Nemoto and Ebana2020) – with some providing longevity estimates/correlates at the genus (Ellis et al. Reference Ellis, Nasehzadeh, Hanson, Ndiwa and Woldemariam2019) and family level (Walters et al. Reference Walters, Wheeler and Grotenhuis2005). At the genus level, the observed longevity for the two species of Vigna analysed in this study were far from similar, with Vigna radiata showing the greatest longevity of the six species analysed, and Vigna angularis showing the lowest longevity (Table 4) – equating to a difference in longevity of 46.1 years between the two species. Similarly, when seeds were stored at a higher temperature and humidity of − 1°C and 30% RH for 30 years, longevity periods (measured by median survival time, estimated by Weibull distribution) of 14 and 26 years were reported for Vigna angularis and V. radiata, respectively (Yamasaki et al. Reference Yamasaki, Domon, Tomooka, Baba-Kasai, Nemoto and Ebana2020). Differences in longevity, due to variation in rate of viability loss (σ) between species, were also reported for five genera conserved under medium-term storage conditions at the International Livestock Research Institute (ILRI) (Ellis et al. Reference Ellis, Nasehzadeh, Hanson and Woldemariam2018).
In comparison to the observed species longevities reported here, Walters et al. (Reference Walters, Wheeler and Grotenhuis2005) who used the Avrami equation to model germination re-test data from 276 species held in the USDA National Plant Germplasm System collection, reported p 50 estimates of 457, 53, 32 and 31 years for Vigna radiata, Sorghum bicolor, Glycine max and Phaseolus vulgaris, respectively (Walters et al. Reference Walters, Wheeler and Grotenhuis2005). In comparison, the highest estimates of p 50 observed for these species at the AGG (calculated from the observed longevity estimates for the seedlot from each species which showed the greatest longevity (i.e. highest value of Ki and common estimate of σ)) were greater for Sorghum bicolor (p50 = 142 years), Glycine max (p50 = 109 years) and Phaseolus vulgaris (p50 = 100 years) (Table 4, Figure 3). However, interestingly, the four species followed the same ranking – from highest to lowest longevity (Figure 4). The lower longevity of seeds stored at the USDA, compared with the AGG, is likely to be a result of the difference in storage conditions as seeds conserved at the USDA were previously stored at a higher temperature (5°C), prior to 1978 when they were transferred to − 20°C (Walters et al. Reference Walters, Wheeler and Grotenhuis2005). Other research from Yamasaki et al. (Reference Yamasaki, Domon, Tomooka, Baba-Kasai, Nemoto and Ebana2020) at the NARO genebank, analysed 30 years of germination monitoring data collated from seedlots of Vigna angularis, Vigna radiata, Sorghum bicolor, Glycine max and Phaseolus vulgaris, using the Weibull distribution. They reported inter-species differences in longevity periods (estimated from the medium survival time; MST) of 14, 26, 25.5, 15.8 and 31 years for each species, respectively, when stored at − 1°C and 30% RH (Yamasaki et al. Reference Yamasaki, Domon, Tomooka, Baba-Kasai, Nemoto and Ebana2020).
Based on a review of the historical viability data from seven of the CGIAR (the Consortium of International Agricultural Research Centres) genebanks, seeds of Cajanus cajan, Sorghum bicolor and Phaseolus vulgaris were reported to have maintained high viability (≥95%) after 32.9, 32.3 and 27.2 years, respectively, under long-term storage conditions (Hay et al. Reference Hay, Whitehouse, Ellis, Hamilton, Lusty, Ndjiondjip, Tia D’ Wenzel, Santos, Yazbek, Azevedo, Peerzada, Abberton, Oyatomi, de Guzman, Capilit, Muchugi and Kinyanjui2021). In comparison, at the AGG, we also saw evidence of Sorghum bicolor and Phaseolus vulgaris seeds showing a similar viability (≥95%) after 30.8 and 35.7 years. However, for Cajanus cajan, we only observed seeds maintaining such a high viability for 16 years at the AGG (Table 4). As the storage conditions are the same at both genebanks, it is likely that the lower longevity of seeds observed at the AGG is likely to be due to poor seed quality at the time of storage. Evidence of this was shown by the large proportion (73.8%) of seeds showing a viability below the 85% threshold on the first germination test, with this proportion increasing to 98% when the same seedlots were retested in 2024 (Figure 1). Considering this evidence and, as the inherent longevity of this species is unknown, we caution that estimated observed longevity of 30.7 years (σ; Table 4) for seeds of Cajanus cajan, is an underestimation of loss in viability under long-term genebank storage.
Species-specific constants for the improved viability equations (Ellis and Roberts Reference Ellis and Roberts1980), quantify the inherent longevity of a species. These have been determined for approximately 70 species, including: Sorghum bicolor (Kuo et al. Reference Kuo, Shan and Tseng1990), Glycine max (Dickie et al. Reference Dickie, Ellis, Kraak, Ryder and Tompsett1990), Vigna radiata (Ellis et al. Reference Ellis, Hong and Roberts1988) and Phaseolus vulgaris (Ellis et al. Reference Ellis, Hong, Roberts and Tao1990). Based on these predictions, Vigna radiata is the longest lived (σ = 6226 years) followed by Sorghum bicolor (σ = 5802.2 years), Phaseolus vulgaris (σ = 1667 years) and finally; Glycine max (σ = 353.9) (Figure 4). The results presented here also confirm Vigna radiata to be the longest lived, compared to the other three species, followed by Sorghum bicolor. This seems to be consistent with other studies relating to observed longevity during genebank storage (Walters et al. Reference Walters, Wheeler and Grotenhuis2005; Yamasaki et al. Reference Yamasaki, Domon, Tomooka, Baba-Kasai, Nemoto and Ebana2020). However, Glycine max showed a higher observed longevity under genebank storage at the AGG compared with Phaseolus vulgaris, which is inconsistent compared with the predictions (Table 4; Figure 4). These observed differences in longevity between the four species, consistent with at the AGG, was also supported by Walters et al. (Reference Walters, Wheeler and Grotenhuis2005). They reported the highest observed longevity in Vigna radiata (p 50 = 457), followed by Sorghum bicolor (p 50 = 53) and Glycine max (p 50 = 32), with Phaseolus vulgaris (p 50 = 31) showing the lowest longevity (Walters et al. Reference Walters, Wheeler and Grotenhuis2005). Further support of this was also reported in more recent research by Ellis et al. (Reference Ellis, Nasehzadeh, Hanson and Woldemariam2018) who also reported Phaseolus vulgaris seeds were longer lived compared with Glycine max, when stored under medium term storage (5°C) at the International Livestock Research Institute (ILRI). Probit analysis fitted to successive germination results for these species resulted in an estimate of longevity of 31.4 and 20 years for Phaseolus vulgaris and Glycine max, respectively (Ellis et al. Reference Ellis, Nasehzadeh, Hanson and Woldemariam2018).
It is important to note that the observed longevity of all four species, with known viability constants, stored at the AGG is lower compared with the predictions (Figure 4). Whilst not disputing the value of the viability equations for making longevity predictions, there is – as with any prediction – error associated with parameter estimates. Not least because these equations rely on the initial germination test as a measure of true viability when, in fact, it is only an estimate (Hay and Whitehouse Reference Hay and Whitehouse2017; Lee et al. Reference Lee, Velasco-Punzalan, Pacleb, Valdez, Kretzschmar, McNally, Ismail, StaCruz, Sackville Hamilton and Hay2019; Hay et al. Reference Hay, Whitehouse, Ellis, Hamilton, Lusty, Ndjiondjip, Tia D’ Wenzel, Santos, Yazbek, Azevedo, Peerzada, Abberton, Oyatomi, de Guzman, Capilit, Muchugi and Kinyanjui2021); but also because of the equations assume σ does not vary amongst seedlots within a species. This is continuously being disputed in literature with research showing variation in the rate of viability loss between seedlots within a species (Hay and Probert Reference Hay and Probert1995; Hay et al. Reference Hay, de Guzman and Sackville Hamilton2015; Whitehouse et al. Reference Whitehouse, Hay and Ellis2015; Whitehouse Reference Whitehouse2016) and/or genotype (Ellis et al. Reference Ellis, Hong and Roberts1992). As a result, it is a challenge for genebank managers to estimate appropriate viability monitoring intervals at the accession/seedlot level, based on the initial germination result, using the viability equations. Furthermore, to put this in perspective, based on the predicted longevity for Sorghum bicolor, Glycine max, Vigna radiata and Phaseolus vulgaris (Figure 4); monitoring intervals (calculated at a-third of the time for viability to fall to 85%) should be set to 2,901, 118, 2,075, 556 years for each species, respectively. Given that we have shown real-time evidence of seeds showing <85% after as early as between 20 and 40 years under optimum, long-term, storage conditions for all species (Figure 1); such extreme, and infrequent monitoring seems risky. Whilst this implies that the species-specific parameters may not be as robust as previously thought (Whitehouse et al. Reference Whitehouse, Hay and Ellis2018; Lee et al. Reference Lee, Velasco-Punzalan, Pacleb, Valdez, Kretzschmar, McNally, Ismail, StaCruz, Sackville Hamilton and Hay2019), it also highlights the importance of maximising the initial quality of seeds prior to genebank storage to subsequently ensure optimal storage longevity – as higher quality seeds have a greater lifespan compared with lower quality seeds (Whitehouse et al. Reference Whitehouse, Hay and Lusty2020 and references therein).
Based on the observed species longevities presented here (Table 4; Figure 3), the monitoring intervals – set at a-third of the time it takes for viability to fall to 85% – depend on the viability result from the most recent germination test (Table 5). This makes monitoring intervals dynamic which will avoid the over-use of seed through too frequent viability monitoring whilst still ensuring the timely regeneration of material and, subsequently, limiting damage to genetic integrity. Thus, incorporating viability equations into the genebank information database – and when inserting the latest viability result – will generate more precise predictions of longevity on a seedlot basis, for that specific crop. This will make it easier to prioritise and schedule viability retests, as well as to address viability backlogs.
The results from real-time, long-term, viability monitoring increases our understanding of the observed longevity of our germplasm which is critical for genebanks to makes evidence-based management decisions; especially for those species where little is known about their inherent longevity. The six tropical species in this report, collectively account for 14,761 active accessions within the AGG however, the global total consists of approximately 427,222 accessions, conserved across a total of 425 genebanks in 250 countries (FAO 2024; Table 1). These results, therefore, have much wider implications on the global management of these species, providing an evidence-based viability monitoring schedule (Table 5) which can be incorporated into the standard operating procedure (SOP) for accession-based viability monitoring; in alignment with FAO Genebanks Standards.
To conclude, analysis of historical viability data, collated through germination tests to monitor seedlot viability at the AGG, has identified the observed inter-species differences in longevity for six tropical species stored under long-term genebank storage conditions (−20°C). The analysis relied on the ability of the germination test procedure to provide a true representation of seedlot viability, with seeds showing a true loss in viability over time (Table 3). Based on those seedlots analysed, observed longevity estimates were determined and subsequently used to set preliminary viability monitoring intervals for each of the species, based on the results of the last germination test. As long as genebanks continue to collect viability data and work in collaboration to share information on seed longevity our understanding of the observed longevity of species will continue to grow, aiding the general prediction models and subsequently optimising species-specific accession-level management – which is imperative to the global conservation of plant genetic resources.
Acknowledgements
We would like to thank the staff at the Australian Grains Genebank, especially Erica Steadman and Brynie Webb, for their assistance in carrying out germination tests. This research was carried out as part of the Australian Grains Genebank Strategic Partnership which is a co-investment between the Victorian Government and Grains Research and Development Corporation (GRDC) that aims to unlock the genetic potential of plant genetic resources for the benefit of the Australian grain growers (project number DJP2206-009OPX).




 Open access

