

INTRODUCTION
Expert elicitation is a process that can be used to generate estimates of a key parameter where the available data are scarce [Reference Burgmann1–Reference de França4]. During the elicitation process, experts use their knowledge and judgement to synthesize relevant information and produce individual estimates. These estimates are then combined statistically to generate an overall distribution for the unknown parameter that reflects the collective view of the group of experts.
Expert elicitation is commonly used to estimate the proportion of illnesses that are acquired through foodborne transmission [Reference Havelaar5, Reference Pires6]. Estimates from these elicitations are crucial to studies that estimate the number of illnesses, hospitalizations and deaths due to contaminated food. These estimates are then used to direct the use of resources for food safety regulation and to prioritize public health policies and interventions [Reference Mead7–Reference Kirk15]. In an earlier foodborne disease estimation study in Australia, circa 2000 [Reference Hall8], we adopted a relatively simple elicitation process involving a single round of data collection. For this elicitation, ten foodborne disease experts were sent a survey to estimate the proportion of transmission that was foodborne, person-to-person or environmental for each relevant pathogen. Estimates of the proportions of the different pathogens were discussed at a teleconference until a consensus was reached and final results modelled as a normal distribution using the mean and standard deviation of the estimates. For our circa 2010 estimates [Reference Kirk15], we conducted the elicitation in a more structured way which included three rounds of data collection, asking experts to generate intervals around their point estimate, providing literature summaries for each pathogen, and conducting a workshop in which the experts discussed their estimates [Reference Vally16]. Our aims in including these additional features were to improve the scientific basis underlying estimates, to better enable uncertainty to be captured by our final distributions, and to assist experts to reach a combined distribution that satisfied them.
In this paper we evaluate the various components of this structured elicitation process to assess how well they achieved these aims, and discuss possible methodological refinements for future studies.
METHODS
Expert elicitation methodology
Experts
Twelve individuals who were considered to have expertise in foodborne disease in Australia were invited to take part in this elicitation. Experts from a range of disciplines made up this group, which included three public health physicians, two microbiologists, two public health veterinarians, three foodborne disease epidemiologists, one food safety officer and one research scientist. One of the public health physicians withdrew after round one of this process and so was excluded from the analysis. Four of the authors of this paper (M.D.K., C.S., M.G.K.V., K.E.F.) were also experts who took part in this elicitation. As the evaluation of the expert elicitation was completed after the expert elicitation itself, and these experts had no conflict of interest, we do not believe that this influenced this evaluation.
Overall data collection strategy
In each of three rounds, experts were given a questionnaire to complete for each of nine pathogens. The questionnaire asked experts to give their ‘best estimate’ of the proportion of illness transmitted by five transmission pathways in Australia: food, the environment, water, animals or person-to-person, ensuring that these estimates added up to 100%. For the purposes of this expert elicitation, transmission from the environment was defined as transmission through direct contact with soil, air or fomites. Although different transmission patterns might be expected for population subgroups or pathogen subtypes, experts were asked to provide an overall ‘weighted’ estimate representing the whole country and the whole bacterial or viral genus. Experts were asked to exclude overseas travel-related illness from their estimates. For the foodborne estimate, experts were additionally asked to give ‘90% certainty intervals’ in order that final distributions could be constructed to reflect expert opinion on the degree of uncertainty. All questions were phrased as natural frequencies, which have been found to improve the quality of estimates [Reference Burgmann1]. A sample questionnaire for Salmonella is provided in Technical Appendix A (see Supplementary material).
Data collection rounds
Round 1: Estimates based on current knowledge
In round 1, experts were given two unrelated preparatory questions designed to familiarize them with the process of converting their knowledge into estimates and certainty intervals. Their responses to these questions were not used in the expert elicitation. They were subsequently sent the pathogen questionnaires by email, and given 1 week to complete them based on their current knowledge of the nine pathogens.
Round 2: Estimates informed by literature searches and available data
One week after the first round of estimates was collected, experts were provided with detailed literature reviews and summaries of Australian data. The aim of these reviews was to ensure that experts had access to the relevant available scientific evidence. Thirteen scientists with expertise in either foodborne disease pathogens or epidemiology were engaged to conduct systematic reviews and to summarise this evidence in structured form. Two reviews were provided for each pathogen: one summarizing ‘human epidemiology’ and another summarizing ‘environmental health’. One of the experts taking part in the expert elicitation was involved in the preparation of two of the ‘human epidemiology’ systematic reviews. Further details of the guidelines for these reviews are provided in Technical Appendix B (see Supplementary material).
In addition to summarizing the literature, national surveillance data and national outbreak data were collated for each pathogen. This comprised a summary of cases and outbreaks between 2004 and 2008, together with the proportion of outbreaks by each possible transmission route. For those outbreaks considered foodborne, the proportion of different food vehicles and locations for each outbreak were also provided.
One week after the circulation of literature reviews and data summaries, experts were asked to complete an identical questionnaire to that in round 1, and to return this by email.
Round 3: Estimates refined by a 1-day workshop
One week after round 2, a 1-day workshop was convened with the aim of assisting experts to reach a combined distribution they found satisfactory. Portfolios containing the systematic reviews and data summaries were provided to assist discussions. Following discussion of each pathogen, experts completed the questionnaire for a third time, and individual estimates were combined into an averaged distribution for each pathogen (see Data analysis section below) that was shown to all experts. This gave experts the opportunity to comment on third-round estimates at the workshop.
Evaluation of the expert elicitation process by experts
Experts were asked a number of direct questions in each round of the elicitation. They were asked to self-assess the relevance and extent of their background to the task and also the availability of evidence for each pathogen at each round using a Likert scale from 1 to 10 (1 = not relevant, 10 = very relevant). After round 3, when experts were presented with visual representations of the final distribution for each pathogen, they were asked to comment on the final distributions on a scale of 1 (unhappy) to 5 (very happy). They were also asked to rate the literature reviews and data summaries, and the workshop (1 = not useful, 5 = very useful), and asked to what extent the summaries and the workshop resulted in them changing their estimates (1 = did not change, 5 = changed a lot).
Data analysis
A three-way analysis of variance test was used to assess changes in the ‘best estimates’ of the proportion of transmission that is foodborne across the elicitation, including factors: Round, Expert and Pathogen. This was followed by pathogen-specific analyses using a paired Wilcoxon signed-rank test to identify changes in the mean of the best estimates, and Bartlett's test to identify changes in the variance of the best estimates.
For some analyses, experts were divided into two groups – those with higher self-reported expertise across all pathogens (mean ⩾6·0) and those with lower self-reported expertise (mean <6·0), with six experts in the higher self-reported expertise group, and five in the lower self-reported expertise group. The division point of 6 was chosen to ensure roughly equal numbers in each group.
Combined uncertainty distributions for each pathogen were generated as described in Vally et al. [Reference Thomas14]; however, a brief description follows. First, best estimates and 90% certainty intervals provided by each expert were used to generate individual distributions for each expert and each pathogen. Two forms of distribution were used in the analysis: modified triangular distributions, and PERT distributions, a form of beta distribution commonly used in expert elicitation [Reference Johnson17]. Modified triangular distributions were generated in Microsoft Excel (Microsoft Corp., USA) and PERT distributions were produced using @Risk version 6 (Palisade Corporation, USA) by computing a point-wise average of the individual uncertainty distributions. These resulting distributions reflect the experts’ degree of belief about the value of the best estimate. Modified triangular distributions were shown to experts during the elicitation, while PERT distributions were used in the foodborne burden-of-disease calculations [Reference Kirk15].
Ethics approval
Ethics approval for this project was given by the Australian National University Human Research Ethics Committee.
RESULTS
Estimates by round
A three-way analysis of variance test including factors for expert, pathogen, and round showed that round had a statistically significant effect on the estimate of the proportion of transmission that is foodborne between rounds 1 and 3 (P = 0·002), providing evidence that estimates changed across the three rounds. This difference was also evident between rounds 2 and 3 (P = 0·03) but not between rounds 1 and 2 (P = 0·2). As expected, the term for pathogen was highly significant in each test (P < 0·001) indicating that there were differences in the proportion of transmission that was believed to be foodborne for different pathogens.
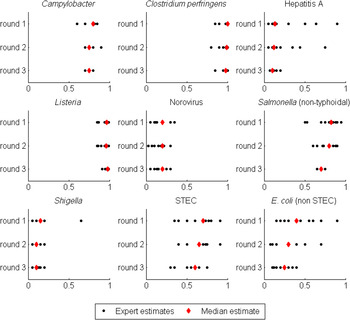
Table 1 presents the median of the ‘best estimates’ of the proportion of illness acquired by foodborne transmission from rounds 1-3 for each of the pathogens, with a visual representation of individual estimates from experts summarized in Figure 1. These data indicate a declining trend in the median percentage foodborne across the rounds, with the largest change seen for non Shiga toxin-producing (STEC) pathogenic E. coli, which decreased from 40% to 25% between rounds 1 and 3, although this difference was not statistically significant. Median estimates for all other pathogens declined from round 1 to round 3 except for norovirus, which remained the same across all of the rounds (at 20%), and Listeria monocytogenes, which increased from 96% to 98% from round 1 to round 3.
Dot plot of the ‘best estimates’ of the proportion of transmission due to food from each expert (black circle) and the median ‘best estimate’ (red diamond) for the nine pathogens across the three rounds. Each pathogen is shown separately, with rounds 1–3 shown from top to bottom of the figure. The horizontal axis shows the proportion of transmission that is due to food, ranging from 0 to 1. E. coli (non STEC) refers to non-STEC pathogenic E coli.
Experts’ ‘best estimates’ of the percentage of transmission that is due to food by pathogen across the three rounds of the expert elicitation

* Significant change in the variance of the ‘best estimates’ from previous round (P < 0·05) using Bartlett's test.
† Significant change in the mean of the ‘best estimates’ from previous round (P < 0·05) using Wilcoxon signed rank test.
Variation in ‘best estimates’ also decreased across the rounds of this expert elicitation (Table 1, Fig. 1). Six of the nine pathogens showed a statistically significant decline in the variance of the ‘best estimates’ between rounds, with five of these changes (Campylobacter spp., hepatitis A, L. monocytogenes, non-typhoidal Salmonella spp., and non-STEC pathogenic E. coli) occurring between rounds 2 and 3, and one of these changes (Shigella spp.) occurring between rounds 1 and 2. Inspection of the individual estimates provided by experts (Fig. 1) shows that the tightening of the ‘best estimates’ for Shigella spp. between rounds 1 and 2 was due to the movement of a single outlier, while the tightening of the other distributions between rounds 2 and 3 was due to a more general convergence of the ‘best estimates’.
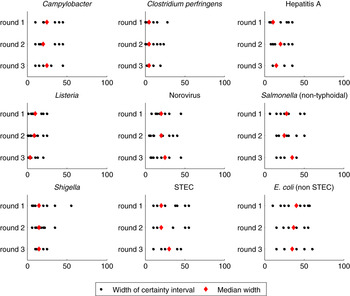
There were no clear patterns in the widths of certainty intervals across the stages of the elicitation. Figure 2 provides a graphical representation of individual intervals by pathogen and round. Certainty intervals were generally narrower for pathogens considered to be almost exclusively foodborne (C. perfringens and L. monocytogenes), and were widest for non-STEC pathogenic E. coli.
Dot plot of the width of the certainty intervals provided by each expert (black circle) and the median width (red diamond) for the nine pathogens across the three rounds. Experts were instructed to specify an interval which they were 90% confident covers the range of possibilities for the proportion of transmission that is due to food. Each pathogen is shown separately, with rounds 1–3 shown from top to bottom of the figure. The horizontal axis represents the width of the certainty interval in percentage points, such that an interval from 25–75% would have a width of 50. E. coli (non STEC) refers to non-STEC pathogenic E coli.
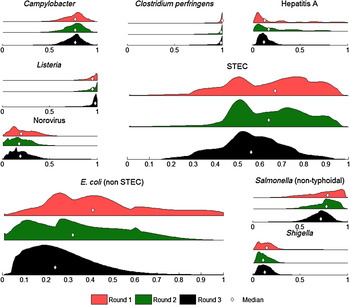
As shown in Figure 3, the combined distributions based on both the ‘best estimate’ and ‘certainty intervals’ given by each expert for each pathogen became smoother over the rounds, with the exception of norovirus. Round 3 was particularly important for STEC, and non-STEC pathogenic E. coli, as the distributions in rounds 1 and 2 for these pathogens were bimodal but these converged to one peak between rounds 2 and 3.
Foodborne distributions for each pathogen after round 1 (red, top), round 2 (green, middle) and round 3 (black, bottom) of the expert elicitation. These distributions were obtained by combining ‘best estimates’ and certainty intervals over all 11 experts. Median estimates of foodborne transmission in each round are indicated by a diamond. E. coli (non STEC) refers to non-STEC pathogenic E coli.
Experts’ perceptions of their expertise and evidence with regard to each pathogen
Experts’ perceptions of their expertise
Table 2 summarizes mean self-reported expertise of experts for each pathogen. There was considerable individual variation, with scores of 1 and 9 (out of 10) reported. Mean expertise across experts for individual pathogens in round 1 varied from 3·5 to 7·0, with experts collectively reporting the lowest expertise for non-STEC pathogenic E. coli (3·5) and the highest expertise for Salmonella (7·0). Experts typically reported either consistently high or low expertise across all of the pathogens. In the first round, five experts rated themselves ⩾6 for ⩾7 pathogens, while another three experts rated themselves ⩾6 for at most one pathogen. A three-way analysis of variance test restricted to the six experts with higher self-reported expertise across all pathogens (mean expertise ⩾6·0) showed a significant change in the ‘best estimates’ between rounds 1 and 2 (P = 0·046), but not between rounds 2 and 3 (P = 0·1). By contrast, the same test restricted to the remaining five experts with lower self-reported expertise (mean expertise <6·0) showed a significant change in the ‘best estimates’ between rounds 2 and 3 (P = 0·02), but not between rounds 1 and 2 (P = 0·27). Inspection of the data suggested that where there were large changes in experts’ estimates between rounds, these changes were often due to estimates from experts with lower self-reported expertise moving towards those of experts with higher self-reported expertise.
Mean self-reported expertise and experts’ view on the availability of evidence for each pathogen over the three rounds (score out of 10), together with the mean of the experts’ satisfaction with the final distributions (score out of 5)

Experts’ perceptions of the level of evidence
The experts’ individual perceptions of the level of evidence available for each of the pathogens varied considerably, with this perception varying both within and between pathogens (Table 2) and across rounds. The mean perceived level of evidence increased across the elicitation, with a mean score of 5·1 in round 1, 5·6 in round 2, and 5·7 in round 3, although the change was not statistically significant. In round 3, non-STEC pathogenic E. coli was reported to have the weakest evidence (mean of 3·5) of all the pathogens, while Campylobacter and L. monocytogenes were scored as having the best evidence available, each with a mean score of 6·9. Experts’ assessment of the level of evidence was generally consistent with the width of the final credible intervals, with wider intervals for those pathogens deemed to have the weakest evidence (STEC, non-STEC pathogenic E. coli), and narrower intervals for those with the strongest evidence (Campylobacter, L. monocytogenes).
Experts’ evaluation of literature reviews and workshop
Experts rated the usefulness of the literature reviews and data summaries quite highly with an overall mean score of 3·9 (out of 5) and seven experts rated them as ⩾4. When asked whether the literature reviews and data summaries caused them to change their estimates, experts indicated that they resulted in moderate changes (mean score of 2·9 out of 5). Experts rated the workshop as very useful (mean score 4·6 out of 5), with 10 experts rating it as ⩾4. Again, experts said that their estimates only changed moderately during the workshop (mean score of 3·0 out of 5). Experts with lower self-reported expertise (mean expertise <6·0) rated both components higher than those with higher self-reported expertise (mean score of 4·2 vs. 3·7 for literature reviews; mean score of 5·0 vs. 4·2 for the workshop).
Experts’ evaluation of final distributions
The experts’ satisfaction with the combined distributions, which were generated using modified triangular distributions and presented to them at the end of the workshop and again 3 weeks after the workshop are summarized in Table 2. Experts were generally happy with these distributions, with satisfaction ranging from a mean score of 4·4 (out of 5) for Campylobacter to 3·5 for non-STEC pathogenic E. coli. Three experts (out of 11) gave a score of ⩽2 for non-STEC pathogenic E. coli, commenting that they had concerns over the paucity of data for this pathogen and that it represents a collection of different pathotypes that are hard to amalgamate. Two experts gave a score of 2 for C. perfringens, commenting that they believed C. perfringens to be 100% foodborne and were unhappy that the final estimate (98% foodborne) allowed for other transmission routes. Collectively, experts were less happy with final distributions for norovirus than most other pathogens, despite little change in the estimated distributions over the rounds. Experts commented on the difficulty in estimating transmission routes for this pathogen, and the need for further research, particularly in outbreak settings.
DISCUSSION
Expert elicitations are commonly conducted for enteric pathogens to quantify the proportion of transmission due to food [Reference Pires6, Reference Ravel18]; however, there is little agreement as to how they should be conducted to provide the most reliable data. Using a three-stage elicitation process, we found that estimates changed significantly across the rounds, with a general decline in the proportion of disease attributed to foodborne transmission. While the width of certainty intervals provided by individual experts did not change appreciably across the rounds, the variance in collective best estimates did reduce significantly, particularly following the workshop in round 3. These two findings suggest that changes across rounds were largely due to experts’ best estimates converging during the rounds as opposed to a decline in the level of uncertainty associated with individual pathogens. This interpretation is also supported by visual representations of the associated distributions, which became smoother across the rounds of the elicitation. The convergence of experts’ estimates and their general satisfaction with final distributions provides us with confidence that this expert elicitation provided sound data to be used in Australian foodborne disease burden estimates [Reference Kirk15, Reference Ford19].
We conduct expert elicitations to obtain estimates where there is no definitive data available [Reference Pires6, Reference Hoffmann20, Reference Davidson21]. Expert elicitations, however, are not a replacement for ‘hard scientific data’ and thus our aims with this elicitation were to produce final estimates that best represented the available evidence and that were also able to capture uncertainty in that evidence. Drawing on prior elicitations for enteric pathogens and the available literature [Reference Havelaar5, Reference Pires6, Reference Lake9, Reference Ravel18, Reference Hoffmann20, Reference Hoffmann22, Reference Henson23], we endeavoured to adopt strategies that we felt would be considered best practice. These included the use of natural frequencies, and requiring experts to provide 90% certainty intervals surrounding their estimates in order to better quantify uncertainty [Reference Ravel18, Reference Hoffmann22]. We also included two key elements to this elicitation. The first of these was the provision of detailed literature reviews and summaries of latest outbreak and surveillance data to experts. The value of these reviews was demonstrated by experts rating this information highly, and that the width of final credible intervals reflected experts’ ratings of the availability of the evidence, with wider intervals for those pathogens for which the evidence was weakest. The second important element of this elicitation was a workshop conducted in round 3. The aim of this workshop was to allow experts an opportunity to interact and to challenge their assumptions and interpretations of the available evidence. This round was particularly highly regarded by experts, and significantly reduced the width of the variance of the ‘best estimates’ for five pathogens. Furthermore, final distributions for a number of pathogens were considerably smoother following the workshop.
The primary reason for including multiple rounds of expert elicitation was to facilitate reflection from experts (both as individuals and as a group). Given the number of experts and the range of relevant disciplines represented, it is not surprising that the level of expertise varied somewhat. When we classified experts into two groups according to self-reported expertise, the more confident experts seemed to be influenced more by the literature reviews and data summaries, while the less confident experts were influenced by the workshop. This may indicate that the literature and data provided were less helpful for the less confident experts, and that this group was better able to assimilate key information at the face-to-face workshop. In contrast, the more confident experts may have been better able to identify relevant data in the literature reviews, and then may have led discussion at the workshop. This finding, which we need to be careful not to over-interpret, provides useful pointers to future expert elicitations with respect to the way information is provided to experts and to the design of workshops. It also raises a possible concern that more confident experts may dominate discussion in a workshop setting, and that familiarising them with the latest data is important to ensure that their views are well-founded. Despite the potential for more assertive experts dominating in a workshop setting, it must be noted that for this particular expert elicitation the experts were generally known to each other which resulted in a collaborative atmosphere in which there appeared to be no inhibition in the communication of views and ideas by any of the experts.
Estimates of the median proportion foodborne showed a general decline across the rounds of this expert elicitation. The estimates were also lower than our previous study [Reference Hall8], which is consistent with reduced foodborne proportions in other studies of foodborne disease [Reference Scallan12, Reference Ravel18]. It may be that examination of current data leads to a greater appreciation of the role of non-foodborne transmission routes for the pathogens under consideration or that improved molecular evidence about the natural history of foodborne pathogens has changed experts’ views [Reference Verhoef24, Reference Sakon25]. Changes to pathogen-specific estimates of the proportion of transmission attributed to contaminated food can have significant effects on foodborne burden-of-disease estimates, particularly when changes occur for common pathogens such as norovirus [Reference Scallan12, Reference Kirk15]. We also know that much of the uncertainty in burden-of-disease studies arises from uncertainty in transmission routes [Reference Glass, Ford and Kirk26]. As noted previously [Reference Hoffmann20], wide distributions not only reflect disagreement between experts, but may also indicate a need for additional data collection and research.
Given the impact of structured expert elicitations in foodborne burden-of-disease studies, it is important to design these so as to generate the best possible estimates. Our findings strongly support the inclusion of direct interaction between experts to resolve differences in opinion and achieve consensus. It is harder to assess the contribution of the literature reviews and data summaries. Although estimates provided by the full group of experts did not change significantly following the provision of these reviews, they appear to have influenced experts with higher self-reported expertise. Further, they may have informed and supported discussion at the workshop. Nevertheless, the production of 18 detailed literature reviews was an extremely time-consuming component of this elicitation. It may be possible to achieve a similar quality of estimates by targeting reviews and data summaries at gaps identified by experts; however changes such as these should be made after consideration of the objective of the study. Our aims with this elicitation were to improve the evidence base, to capture uncertainty, and to produce final estimates that satisfied our experts. We believe that our three-stage process was successful in these aims and strongly advocate for inclusion of relevant information and a workshop, or similar forum, in future expert elicitations.
SUPPLEMENTARY MATERIAL
For supplementary material accompanying this paper visit http://dx.doi.org/10.1017/S0950268815002435.
ACKNOWLEDGEMENTS
This expert elicitation was part of a larger project called ‘Estimating Foodborne Illness in Australia circa 2005’ run by the then Department of Health and Ageing (now Department of Health) and NSW Food Authority. The steering committee for this project were instrumental in organising the expert elicitation. Members of the steering committee were Katie Fullerton (OzFoodNet, DoHA), Craig Shadbolt (NSW Food Authority), Martyn Kirk (OzFoodNet, DoHA), Mark Veitch (Microbiological Diagnostic Unit, Melbourne University), Gillian Hall (National Centre for Epidemiology and Population Health, Australian National University) and Jennie Musto (NSW Health).
Much effort went into the excellent literature reviews that were conducted by Ainslie Butler, Barry Coombs, Alison Dann, Rennie D'Souza, Martyn Kirk, Chawalit Kocharunchitt, Zheng Liu, Rolf Nilsson, Olivia McQuestin, Cathy Moir, Jennie Musto, Bruce Nelan, April Roberts and Polly Wallace.
Experts who participated in the elicitation and gave generously of their time and expertise were John Bates, Duncan Craig, Patricia Desmarchelier, Katie Fullerton, Joy Gregory, David Jordan, Martyn Kirk, Tony Merritt, Andrew Pointon, Jane Raupach, Lisa Szabo and Mark Veitch. Mark Burgman gave insightful comments and feedback on the design of the study. The expert elicitation was funded by Commonwealth Department of Health and the NSW Food Authority.
DECLARATION OF INTEREST
None.


