


1 Introduction
In a series of survey experiments, Hill and Roberts (Reference Hill and Roberts2023) show that acquiescence bias—the tendency of survey respondents to answer True, Agree, or Yes more often than False, Disagree, or No—artificially inflates survey-based estimates of conspiratorial beliefs and misinformation among the mass public. By randomly assigning their respondents to opposite-keyed versions of a set of yes–no questions, the authors show that the magnitude of acquiescence bias can increase the estimated prevalence of some conspiratorial beliefs by upward of 50%. In addition, they show that some groups of respondents are more prone to this bias than others: the effect of question wording was largest among very conservative and very liberal respondents, younger respondents, and those with the lowest education and numeracy. Taken together, these findings suggest that acquiescence bias not only causes researchers to overstate the prevalence of conspiratorial beliefs, but also to mis-estimate the association between conspiratorial beliefs and various demographic characteristics.
Reexamining the study’s data, we reproduce its main findings—acquiescence bias has real and significant effects on estimates of conspiratorial beliefs and misinformation. However, we identify a minor coding error in the original analysis that, once corrected, reverses the estimated association between acquiescence bias and education. Specifically, we find that the eight-category education variable contains several respondents coded as
$-3105$
 (“None of the above”) by the Lucid survey platform in the 2020 survey wave. Although this error affects a relatively small number of respondents (14 out of 2,055 respondents in that survey wave), these outliers have an outsized influence on the paper’s estimated associations because the covariate is coded as a continuous variable. Once those 14 respondents are dropped, the resulting estimates reveal that acquiescence bias is largest among more educated respondents, particularly those with a postgraduate education.
This result is surprising in light of decades of survey research. Over 60 years ago, Campbell et al. (Reference Campbell, Converse, Miller and Stokes1960) warned that research on authoritarian personalities was likely to be undermined by the higher rate of acquiescence among those with less education. A wide range of survey experiments have corroborated this theory, finding that the most highly educated respondents are the least susceptible to question wording effects and acquiescence bias (Narayan and Krosnick Reference Narayan and Krosnick1996; Schuman and Presser Reference Schuman and Presser1981). To the extent that acquiescence bias is driven by inattentiveness, one would expect it to be most prevalent among less-educated respondents, who are on average less attentive to question wording (Berinsky, Margolis, and Sances Reference Berinsky, Margolis and Sances2014; Ziegler Reference Ziegler2022).
After corresponding with the authors of the original study, they promptly issued a corrigendum correcting the error (Hill and Roberts Reference Hill and Roberts2025), expressing surprise at the reversed association between education and acquiescence bias, and urging further study. We designed and preregisteredFootnote 1 two new survey experiments to test several competing theories that could explain the result.
Theory 1: Low-Quality and Fraudulent Responses. The most straightforward explanation is that our surprising result is being driven by “survey trolls” (Lopez and Hillygus Reference Lopez and Hillygus2018), a subset of respondents who are more likely to fraudulently report low-prevalence characteristics (e.g., having a postgraduate degree). The original experiments were conducted on the Lucid survey platform, which in recent years has seen a significant rise in low-quality survey responses (Ternovski and Orr Reference Ternovski and Orr2022). If respondents who misrepresent their educational attainment are more likely to satisfice when responding to other survey questions, it could easily explain the observed association between education and acquiescence bias. To test this hypothesis, we replicate the experiment on both the original platformFootnote 2 and a higher-quality survey panel (Bovitz–Forthright). The Bovitz panel exhibits significantly higher levels of response quality and representativeness (Stagnaro et al. Reference Stagnaro, Druckman, Berinsky, Arechar, Willer and Rand2024), and we are able to validate each respondent’s reported education against their demographic profile maintained by the company.
Theory 2: Deference to Researchers among the Highly Educated. Perhaps the most highly-educated respondents are more likely to make “miseducated guesses” (Graham Reference Graham2023) when responding to survey questions. If more educated respondents are, on average, more politically knowledgeable, then they would be more likely to have heard about and remember the controversies and conspiracies described in the survey. The original Hill and Roberts (Reference Hill and Roberts2023) experiment was administered four years after the relevant controversies occurred, so respondents who did remember them would have been unlikely to have detailed knowledge about their specifics (“Did Clinton say that half of Trump’s supporters were in a basket of deplorables, or some other fraction?”, “Did Trump refuse to say he’d concede in the second debate or the third debate?”). As a result, they may be more susceptible to question wording effects, deferring to the investigators when faced with a specific true/false statement. To test this hypothesis, we include in our replication studies a new set of questions about more recent and high-salience conspiracy theories that circulated during the 2024 presidential election. We should expect to observe a much weaker relationship between education and acquiescence bias for these questions, since the most informed respondents would be better able to recall the correct answer. We also administer a four-item political knowledge scale to assess the relationship between political knowledge and acquiescence, independent of education.
Theory 3: Response Option Effects. A third explanation for the pattern is that more educated respondents are less likely to admit that they are uncertain when presented with political knowledge questions (Jessee Reference Jessee2017; Mondak Reference Mondak1999). This could make them more prone to acquiescence bias than less educated respondents who more frequently responded “Not sure” in the original survey experiment. In the original study, respondents with a high school education or less responded “Not Sure” roughly 45% of the time, compared to 32% of respondents with a postgraduate education. To test this theory, we randomly assign respondents to receive “Not sure” as a response option in our replication studies, and estimate the effect of this design choice on rates of acquiescence bias.
The results we present below offer resounding support for Theory 1. In the larger, higher-quality Bovitz panel, average rates of acquiescence bias are roughly three times smaller, and there is no observed association between education and acquiescence. By comparison, our replication on the Lucid/Cint platform yielded nearly identical results as in the original paper. When asking respondents about recent, high-salience conspiracy theories (e.g., Haitian immigrants eating pets in Springfield OH), the highest rates of acquiescence bias were among respondents on the Lucid/Cint platform with self-reported postgraduate degrees. This evidence strongly suggests that the initial result was driven by inattentive and fraudulent responses, and that attention checks alone are insufficient to weed out these responses. We take this as a cautionary tale about the dangers of over-interpreting conditional effect estimates from low-quality survey platforms, particularly for low-prevalence characteristics.
2 Data and Analysis
The survey experiment was first conducted in December 2020 by Hill and Roberts (Reference Hill and Roberts2023) on a nationally representative sample of respondents using the online survey platform Lucid. Respondents were asked a series of True/False questions about several actual or “fake news” events that occurred during the 2016 U.S. presidential election, drawn from Allcott and Gentzkow (Reference Allcott and Gentzkow2017). For each question, respondents were randomly assigned to either a positive-keyed version of the claim (e.g., “The Clinton Foundation bought $137 million in illegal arms.” and “Pope Francis endorsed Donald Trump.”) or a negative-keyed version of the same claim (e.g., “The Clinton Foundation DID NOT buy millions of dollars worth of illegal arms.” and “Pope Francis DID NOT endorse Donald Trump.”). Because question wording is randomized, the difference between the share of respondents endorsing the positive-keyed version of the claim and the share of respondents rejecting the negative-keyed version of the claim provides a credible estimate of the magnitude of acquiescence bias.
In our reanalysis and replications, we adhere as closely as possible to the data analysis procedures from the original paper, estimating a linear-probability model predicting agreement with the positive-keyed version of each claim.Footnote 3 The magnitude of acquiescence bias is estimated by the marginal effect of the binary variable Pos keyed. Interaction terms capture differences in acquiescence bias by respondent characteristic. In our reanalysis, we drop the 14 respondents whose educational attainment is coded as
$-3105$
 , and recode education as a categorical variable.
Figure 1 illustrates a few questions driving the puzzling relationship between education and acquiescence in the original survey experiment, plotting the percentage of respondents who endorsed four different “fake news” claims, broken down by educational attainment and question wording (see Figure B.2 in the Supplementary Material for the other claims). Strikingly, highly-educated respondents were the most likely to endorse these false or conspiratorial statements, regardless of the statement’s partisan alignment. Acquiescence bias—the gap between red and black points—is consistently largest for the respondents with self-reported postgraduate degrees. When responding to positive-keyed versions of the claims, these respondents were more likely than any other group to endorse both Democratic-aligned misinformation (Mike Pence called Michelle Obama vulgar, Ireland announced that it was accepting American asylum applications) and Republican-aligned misinformation (the Clinton Foundation bought $137 million in illegal arms, the Pope endorsed Donald Trump). The fact that these groups exhibit the largest acquiescence bias regardless of the partisan alignment of the claim suggests that this relationship is not being driven by differences in partisanship.
Percent of respondents who agree with each false claim, broken down by question wording and educational attainment.
Note: Vertical bars denote 95% confidence intervals.

Figure 1 Long description
The four panels share a common structure. The y-axis represents the percentage of respondents agreeing with a claim, ranging from 10 to 50 percent. The x-axis categorizes respondents by Education Group: H S or less, Some college, College, and Postgraduate. Each panel includes a legend where black dots represent Neg keyed wording and red dots represent Pos keyed wording. Vertical lines through each dot indicate 95 percent confidence intervals.
* Top-Left Panel: The Clinton Foundation bought 137 million dollars in illegal arms. For H S or less, Some college, and College groups, agreement is similar between wordings at approximately 20 percent. For the Postgraduate group, Pos keyed agreement rises sharply to approximately 35 percent, while Neg keyed agreement drops to approximately 14 percent.
* Top-Right Panel: Pope Francis endorsed Donald Trump. Agreement is generally lower, between 10 and 25 percent. For the first three education groups, agreement is roughly equal. In the Postgraduate group, Pos keyed agreement is higher at approximately 23 percent compared to 14 percent for Neg keyed.
* Bottom-Left Panel: Mike Pence said that Michelle Obama is the most vulgar First Lady we have ever had. Trends mirror the top-left panel. Agreement is stable around 20 to 25 percent for the first three groups. In the Postgraduate group, Pos keyed agreement spikes to 35 percent while Neg keyed agreement falls below 20 percent.
* Bottom-Right Panel: In May 2016, Ireland announced that it was officially accepting Americans requesting political asylum from a Donald Trump presidency. Agreement for the first three groups is consistent at approximately 15 to 20 percent. For Postgraduates, Pos keyed agreement is significantly higher at approximately 34 percent compared to 18 percent for Neg keyed.
We make four modifications to the survey experiment in our replication studies. First, we add eight new questions about events (actual and conspiratorial) from the 2024 presidential election campaign.Footnote 4 Second, we include a four-item measure of political knowledge, asking respondents to identify the majority party in both houses of Congress, the office held by JD Vance, and the office held by John Roberts. Third, we randomize at the respondent level whether “Not sure” is included as a response option. Finally, we include a mock vignette attention check (Kane, Velez, and Barabas Reference Kane, Velez and Barabas2023),Footnote 5 but do not exclude respondents who fail the check, so we can test the relationship between inattention and acquiescence bias.Footnote 6 This new survey experiment was fielded in August 2025 on the Lucid/Cint platform
$(n = 2,193)$
 and the Bovitz–Forthright panel
$(n=3,036)$
and the Bovitz–Forthright panel
$(n=3,036)$
 .
.
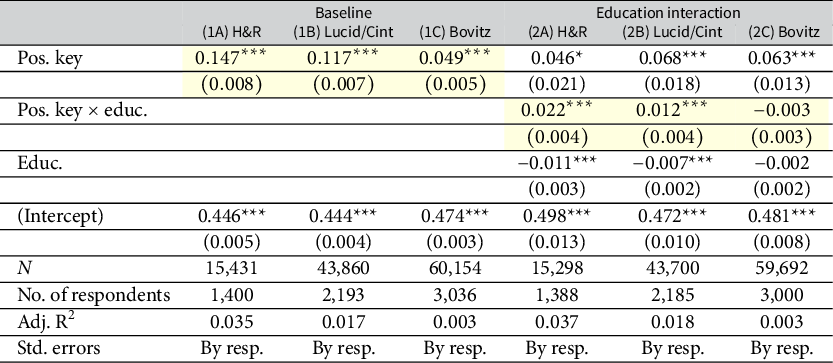
Table 1 reports effect estimates from all three surveys. In both the original survey (H&R) and the direct replication (Lucid/Cint), estimated acquiescence bias has a similar magnitude, between 10 and 15 percentage points on average (columns 1A and 1B), and there is a significant positive association between acquiescence bias and education (columns 2A and 2B). But in the larger, high-quality replication (Bovitz), the estimated average rate of acquiescence bias is roughly 2–3 times smaller (about 5 percentage points), and there is no association between education and acquiescence.
Original results and replications

Table 1 Long description
The table is divided into two main sections: Baseline (columns 1A, 1B, 1C) and Education interaction (columns 2A, 2B, 2C).
Row 1: Pos. key.
- Baseline: 0.147 with three asterisks, 0.117 with three asterisks, 0.049 with three asterisks.
- Education interaction: 0.046 with one asterisk, 0.068 with three asterisks, 0.063 with three asterisks.
Row 2: Standard errors for Pos. key in parentheses.
- Baseline: 0.008, 0.007, 0.005.
- Education interaction: 0.021, 0.018, 0.013.
Row 3: Pos. key multiplied by educ.
- Baseline: Empty.
- Education interaction: 0.022 with three asterisks, 0.012 with three asterisks, minus 0.003.
Row 4: Standard errors for interaction in parentheses.
- Baseline: Empty.
- Education interaction: 0.004, 0.004, 0.003.
Row 5: Educ.
- Baseline: Empty.
- Education interaction: minus 0.011 with three asterisks, minus 0.007 with three asterisks, minus 0.002.
Row 6: Standard errors for Educ. in parentheses.
- Baseline: Empty.
- Education interaction: 0.003, 0.002, 0.002.
Row 7: Intercept.
- Baseline: 0.446 with three asterisks, 0.444 with three asterisks, 0.474 with three asterisks.
- Education interaction: 0.498 with three asterisks, 0.472 with three asterisks, 0.481 with three asterisks.
Row 8: Standard errors for Intercept in parentheses.
- Baseline: 0.005, 0.004, 0.003.
- Education interaction: 0.013, 0.010, 0.008.
Summary statistics:
- N ranges from 15,298 to 60,154.
- Number of respondents ranges from 1,388 to 3,036.
- Adjusted R-squared ranges from 0.003 to 0.037.
- Standard errors are clustered by respondent for all models.
- Significance levels: one asterisk p less than 0.1, two asterisks p less than 0.05, three asterisks p less than 0.01.
Note: *
$p <$
 0.1, **
$p <$
0.1, **
$p <$
 0.05, and ***
$p <$
0.05, and ***
$p <$
 0.01.
0.01.
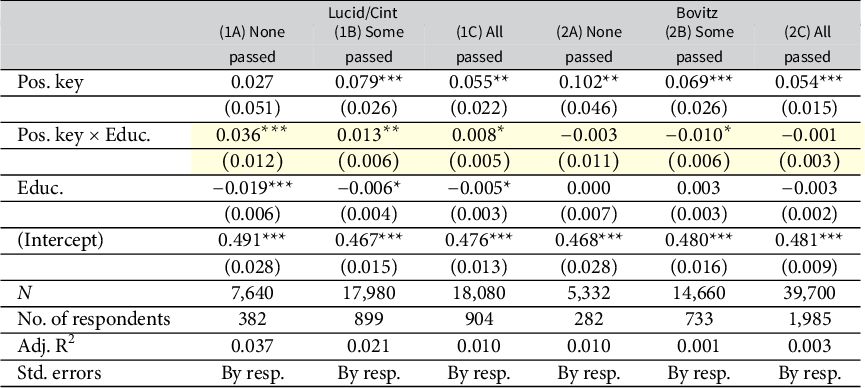
Table 2 examines the relationship between education and acquiescence bias, broken down by how respondents performed on the mock vignette attention check. Notably, the puzzling positive association is present in all Lucid/Cint subsamples (1A–1C). Though passing all attention checks yields a smaller estimate (1C), it is still positive and statistically significant (at the 10% level). Meanwhile, none of the Bovitz subsamples (2A–2C) exhibit the positive association. All in all, this suggests that attention checks, while useful, cannot fully correct the issues of a low-quality sample.
Acquiescence bias and education, by attention check status and survey platform

Table 2 Long description
The table is organized into two main survey platform sections: Lucid forward slash Cint (columns 1 A, 1 B, 1 C) and Bovitz (columns 2 A, 2 B, 2 C). Each section is subdivided by attention check status: None passed, Some passed, and All passed.
Row 1: Pos. key. Values range from 0.027 to 0.102, with varying significance levels.
Row 2: Standard errors for Pos. key in parentheses.
Row 3: Interaction term Pos. key times Educ. Values are 0.036 super asterisks asterisks asterisks (1 A), 0.013 super asterisks asterisks (1 B), 0.008 super asterisk (1 C), minus 0.003 (2 A), minus 0.010 super asterisk (2 B), and minus 0.001 (2 C).
Row 4: Standard errors for the interaction term in parentheses.
Row 5: Educ. Values are minus 0.019 super asterisks asterisks asterisks (1 A), minus 0.006 super asterisk (1 B), minus 0.005 super asterisk (1 C), 0.000 (2 A), 0.003 (2 B), and minus 0.003 (2 C).
Row 6: Standard errors for Educ. in parentheses.
Row 7: Intercept. Values range from 0.467 to 0.491, all significant at the 0.01 level.
Row 8: Standard errors for Intercept in parentheses.
Row 9: N (sample size). Ranges from 5,332 to 39,700.
Row 10: Number of respondents. Ranges from 282 to 1,985.
Row 11: Adjusted R super 2. Ranges from 0.001 to 0.037.
Row 12: Standard errors are clustered by respondent for all columns.
Note: Significance levels are indicated by asterisks: asterisk p < 0.1, asterisks asterisks p < 0.05, and asterisks asterisks asterisks p < 0.01.
Note: *
$p <$
 0.1, **
$p <$
0.1, **
$p <$
 0.05, and ***
$p <$
0.05, and ***
$p <$
 0.01.
0.01.
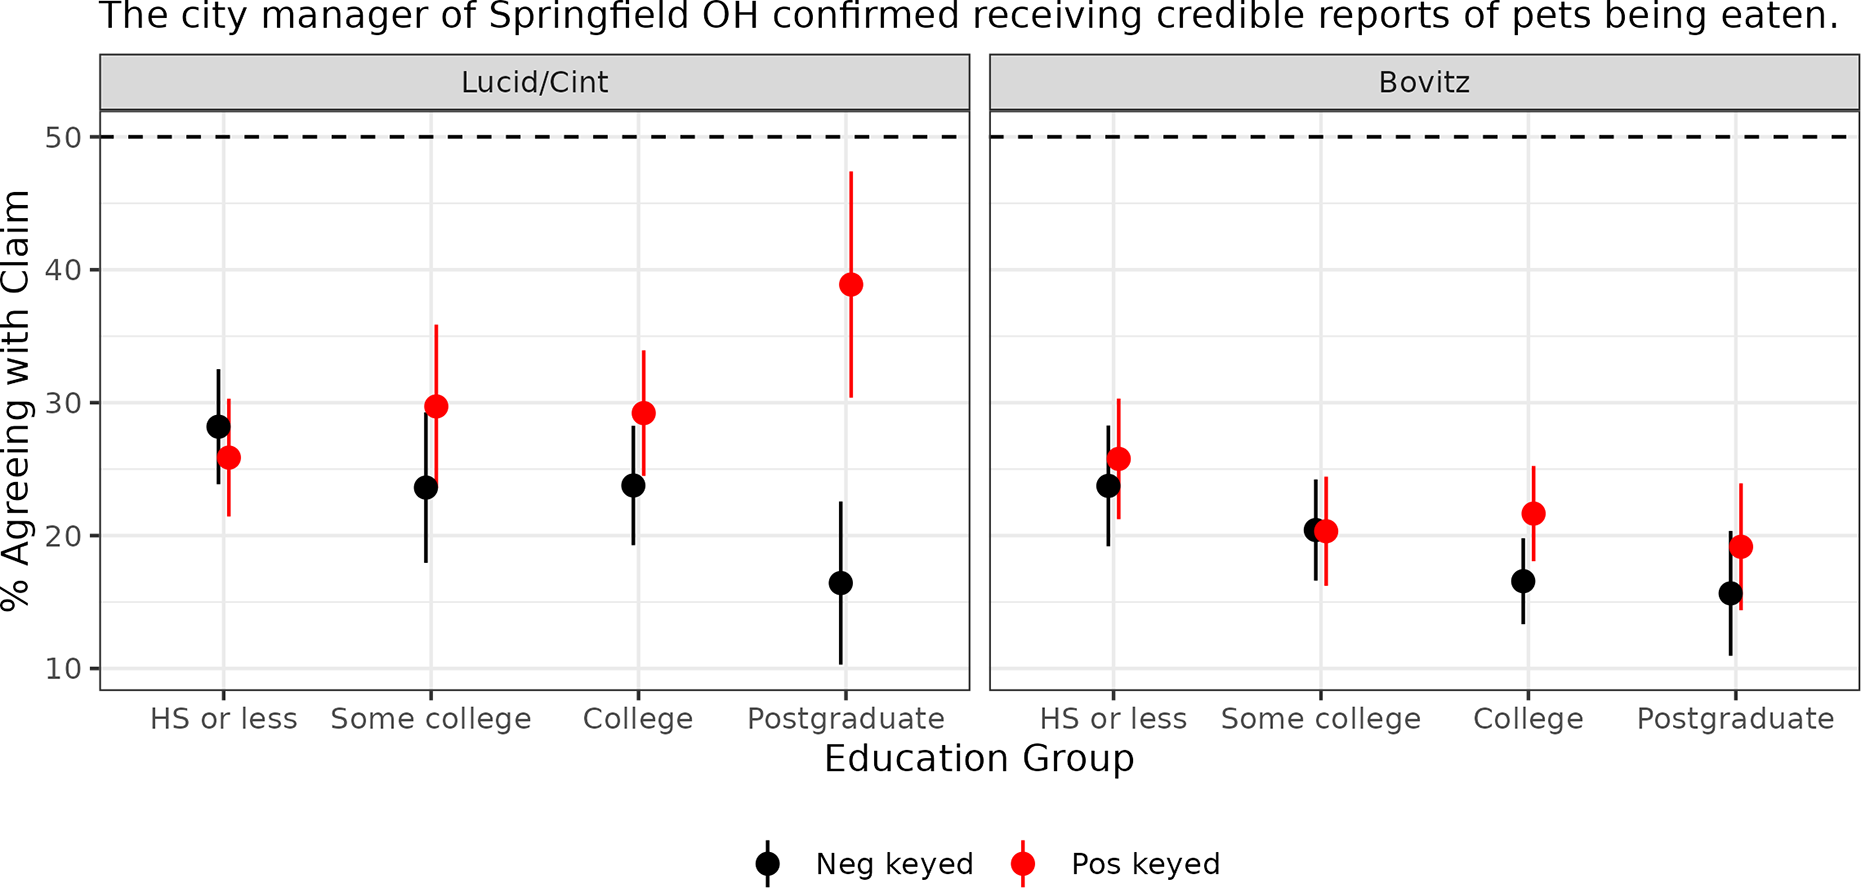
Percent of respondents who expressed agreement with the false claim regarding Springfield OH, broken down by question wording, educational attainment, and survey panel. Note: Vertical bars denote 95% confidence intervals.

Figure 2 Long description
The chart consists of two horizontal panels titled Lucid forward slash Cint on the left and Bovitz on the right. The y-axis represents the percentage agreeing with the claim, ranging from 10 to 50 with a dashed horizontal line at 50. The x-axis categorizes respondents by Education Group: H S or less, Some college, College, and Postgraduate. Data points are color-coded: black dots for Neg keyed and red dots for Pos keyed, each with vertical error bars representing 95 percent confidence intervals.
* In the Lucid forward slash Cint panel, agreement for Neg keyed groups remains relatively stable between 15 and 30 percent, while Pos keyed agreement increases significantly with education, peaking at nearly 40 percent for the Postgraduate group.
* In the Bovitz panel, agreement levels are generally lower and more consistent across education groups, ranging between 15 and 25 percent for both Neg and Pos keyed categories.
* Across both panels, the Postgraduate group in the Lucid forward slash Cint survey shows the largest divergence between Neg keyed and Pos keyed responses.
We find little support for the second theory (highly educated respondents exhibit more deference to researchers), as illustrated in Figure 2. One of our new questions asked respondents whether they agreed with the statement “The city manager of Springfield OH confirmed receiving credible reports of pets being eaten.” This was in reference to a highly-salient piece of misinformation that circulated widely during the 2024 U.S. presidential election. The negative-keyed version of the question was “The city manager of Springfield OH denied receiving credible reports of pets being eaten” (emphasis added). In the Bovitz panel, the percent of respondents expressing agreement with the false claim declines with education, from roughly 35% of respondents with a high school education or less to roughly 25% of respondents with a postgraduate degree. There are no significant differences in agreement across question wording conditions, regardless of education. In the Lucid/Cint panel, however, there is a nearly 25 percentage point difference across treatment conditions, but only for respondents who self-reported having a postgraduate education. We also find no correlation between acquiescence bias and our four-item political knowledge inventory (see Table C.2 in the Supplementary Material). This is not the pattern of responses we would expect if the result was due to respondents deferring to the researchers on specific factual claims.
Finally, we find some evidence that response options affect acquiescence bias, but no evidence that it is responsible for its association with education. Table C.3 in the Supplementary Material breaks down estimated acquiescence bias by survey panel, education, and treatment condition. The results from the Bovitz panel suggest that question wording effects are strongest when “Not sure” is included as a response option, but there is no positive association between education and acquiescence, regardless of which response options are shown to the respondents.
3 Discussion
Taken together, these results strongly support the theory that the positive association between education and acquiescence bias was an artifact of low-quality and fraudulent survey responses. When conducting the experiment on a large, high-quality survey panel, there is in fact no observed relationship between education and acquiescence bias. This highlights the importance of implementing best practices to ensure response quality and truthfulness in survey experiments. And it suggests that scholars should be cautious about over-interpreting conditional effect estimates in low-quality survey panels, particularly for low-prevalence attributes where survey respondents might have a financial incentive to make false claims about their identity (Bell and Gift Reference Bell and Gift2023).
Echoing Hill and Roberts (Reference Hill and Roberts2023), we advise researchers avoid wording questions in a way that induces acquiescence bias, or, if an Agree/Disagree format is deemed necessary, to randomize assignment to positive- and negative-keyed versions of the statement. Approaches like the 2020 ANES survey instrument—which lists both positive- and negative-keyed versions of each belief and asks respondents to select which they believe is more likely to be true—are preferable in most cases. Researchers interested in measuring conspiracy beliefs should give respondents an explicit choice between conspiratorial and conventional explanations, as in Clifford, Kim, and Sullivan (Reference Clifford, Kim and Sullivan2019). Such designs should be paired with careful screening for disengaged survey takers, since random responses can also inflate estimates of controversial or conspiratorial beliefs (Westwood et al. Reference Westwood, Grimmer, Tyler and Nall2022).
Acknowledgments
Thanks to Derek Mikola and Kevin Esterling for organizing the 2024 Polmeth Replication Games, from which this project originated, to Seth Hill and Molly Roberts for their prompt and thorough responses to our questions, and to the anonymous reviewers for their guidance on the replication effort.
Data Availability Statement
Replication materials for this article are available at Cruz, Bouyamourn, and Ornstein (Reference Cruz, Bouyamourn and Ornstein2025). A preservation copy of the same code and data can also be accessed via Dataverse at https://doi.org/10.7910/DVN/ZF32UF.
Competing Interest
The authors declare no competing interest.
Supplementary Material
For supplementary material accompanying this paper, please visit https://doi.org/10.1017/pan.2025.10030.


 Open access