


Introduction
As the epicenter of Lancashire’s – and therefore Britain’s – textile industry, Manchester’s growth was uniquely linked to the Industrial Revolution. Little more than a country town at the start of the eighteenth century, Manchester’s industrialization drew in both rural laborers with the promise of work and industrial magnates with the promise of fortune, and by 1800, it was the country’s second-largest urban area. By the mid-century, it epitomized urbanization in industrial Britain, including the problems that came with it, of disease and overcrowding in particular. The glittering new “palaces of the rich” erected along its central thoroughfares shielded from viewing the dense rows of unsanitary slums beyond, and the temporal rhythms of urban industrial life were such that classes rarely intermingled (Engels Reference Engels1892: 26). While the well-off enjoyed the amenities of the growing city, such as theaters and early department stores, the poor struggled to feed their families and fend off disease. These were conditions recognizable in other Victorian cities: London, of course, was the “eternal slum,” while Liverpool was characterized by ethnic “ghettos”; and in Manchester, social investigators such as James Kay-Shuttleworth condemned “mighty wildernesses of building, in which the incurable ills of society rankled” (Reference Kay-Shuttleworth1970: 11) and foreign observers such as Friedrich Engels denounced their damp, fetid cellars “in whose pestilent atmosphere twelve to sixteen persons were crowded together” (Reference Engels1892: 65) (Engels Reference Engels1892: 65; Kay-Shuttleworth Reference Kay-Shuttleworth1970: 11; Wohl Reference Wohl2017; Pooley Reference Pooley1977).
By the second quarter of the nineteenth century, the dire state of British cities – and that of the working poor within them – stirred cries for both local and national reforms. Reports such as Kay-Shuttleworth’s, who had combined epidemiological and moral considerations in his plea for urban policy, fueled national outrage around what Thomas Carlyle coined the “Condition of England question” (Carlyle Reference Carlyle1842; Kay-Shuttleworth Reference Kay-Shuttleworth1970). From the mid-nineteenth century, government officials began to play a more active role in the growth and structuring of their cities, enacting a series of local and national acts aimed at improving urban conditions. The changes to British cities over the course of the Victorian period have been the subject of study for decades: Manchester, Birmingham, Liverpool, and London have all been analyzed through the lenses of public health, economic and political history, and cultural change; however, histories of urban development, in particular, have mostly highlighted the complexities in patterns of urban change over the nineteenth century (Briggs Reference Briggs1990; Dennis Reference Dennis1984; Dyos and Wolff Reference Dyos and Wolff1978; Harris Reference Harris1984; Hunt Reference Hunt2019; Pooley Reference Pooley and Daunton2001). Research into geodemographic distributions tackling questions of class and ethnic segregation has been forced to weigh scale and accuracy against each other, focusing either on precise but limited areas of study or covering greater urban areas at the expense of overgeneralization.
In recent decades, the digitization of large sets of data has greatly expanded the research potential of scholars of nineteenth-century Britain. The Integrated Census Microdata (I-CeM) project, in particular, has created immense possibilities for historical reconstructions of Victorian cities (Higgs et al. Reference Higgs and Schurer2024). Where previous work had been limited by labor intensiveness, these new tools encourage a revisitation of traditional questions and claims surrounding the growth and development of nineteenth-century cities. Historians and historical geographers have been quick to explore this new potential: parallel progress in machine-learning technologies has motivated a wave of projects seeking to automate demographic georeferencing, introducing impressively wide-scale urban reconstitution projects. While the scope of such projects has been notable, however, scale and accuracy remain a balancing act, and limitations in available spatial datasets have continued to restrict their utility and reliability. A prioritization of scope – or breadth – over scale – or precision – has resulted in the production of databases that aggregate individuals by streets, often disregarding the considerable changes both in the existence of these streets and their internal composition. At present, there is a dearth of research into highly granular patterns of urban distributions in Britain. While Rhodes et al. (Reference Rhodes, Lawrence, Beelen, McDonough, Wilson, Ahnert, Griffin and Lawrence2025) have claimed that greater precision is “historically meaningless,” this article demonstrates that the reconstitution of building-specific data would allow historians to revisit questions around segregation, household compositions, neighborhood dynamics, and the cause and effects of urban policy with absolutely meaningful results, as this has been demonstrated by a multitude of projects on North American and, increasingly, European cities. Manchester, the “shock city” of the British Industrial Revolution, holds potential as a uniquely insightful case study for understanding Victorian urban reform, yet the rapid rate of change in this city has made it an elusive object of study.
This research seeks to explore, in greater depth than has previously been managed, the complexities of urban development and social segregation in Manchester over the second half of the nineteenth century. This article, in particular, presents a method to georeference the highly granular census data at the level of the building in an effort to reconstruct the demographic layer of the city’s complex urban environment. It draws from historical source material such as ordnance surveys (OS), fire insurance plans, and trade directories to digitize the morphology of the township of Manchester, to which I managed to link above 87 percent of all individual records from the censuses of 1851, 1861, 1881, and 1901 by street, with 75 percent of all records linked to the level of the exact building. Using these data, I demonstrate the utility of such accuracy in understanding specific patterns of residential distribution and class relations, and changes to these conditions over time. Finally, I suggest further potential applications of these data, which include quantifications of segregation and cross-referencing against additional primary source material for providing new insights into recurrent historical questions and the generation of new ones.
Mapping British Victorian cities
Mapping segregation, particularly on the basis of “class,” is a practice itself rooted in the Victorian period. As cities struggled to keep up with the country’s widespread urbanization, concerns grew around the “Condition of England,” which linked urban squalor, health, and morality (Driver Reference Driver1988; Kidd Reference Kidd1993: 56). In response, social investigators began to develop an array of empirical methods to catalogue and evaluate the state of their nation’s geography, demography, and economy. Such endeavors included the collection of wage rates and mortality statistics, as well as the first censuses and OS (Chadwick Reference Chadwick1860; Eyler Reference Eyler1976; Goldman Reference Goldman2022; Hewitt Reference Hewitt2010; Lawton Reference Lawton1978). From this movement emerged the first attempts at mapping residential segregation, combining social surveys with cartography. One of the earliest examples of this practice is Abraham Hume’s “Ecclesiastical and Social Map of Liverpool” from 1858, though Hume’s work has since been overshadowed by Charles Booth’s extensive Poverty Maps of London from the final decade of the century (Booth Reference Booth1899; Hume Reference Hume1858). Their work centered around the classification of each street based on the predominant class found in that street’s population, an approach that has been mirrored in certain contemporary studies. By the end of the nineteenth century, this approach to urban study had spread across the Atlantic and became especially popular in contemporary studies of the growing city of Chicago. In 1895, Jane Addams and Florence Kelley reconstructed the composition of Hull House by mapping wage earnings by plot, and three decades later, Park and Burgess published their seminal book The City, which studied the part-to-whole relationship between individuals and the larger urban social structures to which they belong (Addams and Kelley Reference Addams and Kelley1895; Park and Burgess Reference Park and Burgess2019).
The range and richness of Victorian data are an obvious boon to contemporary historians, who have not hesitated to make use of them. In the late 1970s and 1980s, the emergence of urban history as a subfield popularized retrospective approaches to mapping residential segregation largely in response to the questions being raised around the growth of modern cities, especially in Britain (Cannadine Reference Cannadine1977; Dyos Reference Dyos1968; Dyos and Reeder Reference Dyos, Reeder, Dyos and Wolff1963; Ward Reference Ward1975). Such studies, however, largely relied on spatially aggregated data, thus obscuring specific patterns of neighborhood dynamics. Pooley’s work on Liverpool and Ward’s on Leeds, for example, are seminal examples of early retrospective attempts to assess Victorian segregation (Cowlard Reference Cowlard1979; Pooley Reference Pooley1977; Ward Reference Ward1980). Both offered novel insights into the distributions of ethnicity and class, respectively, in their towns of study; however, these were aggregated by ward and enumeration districts due to a lack of granular data and therefore could not evaluate compositions at a smaller scale, which could capture significant micro-segregation. Richard Dennis has warned against conflations of dissimilarity and geographic distance in measuring segregation; furthermore, as spatial generalizations fail to capture important nuances in social and demographic distributions, which geographers have dubbed the “checkerboard” and “modifiable areal unit” problems (Dennis Reference Dennis1984: 206; Reardon and O’Sullivan Reference Reardon and O’Sullivan2004). The pitfalls of this problem are perhaps best exemplified by Carter and Wheatley’s 1980 study on Merthyr Tydfil, which demonstrates the differences in extents of segregation identifiable at various scales: while at the “aggregate, ecological level” the population appeared quite spatially segregated across the town, a closer look revealed noticeable levels of integration within districts, albeit with suggestions of primary-secondary street differentiation (Carter and Wheatley Reference Carter and Wheatley1980). Their conclusion warns that “generalisations [sic] about segregation in the nineteenth-century city are gross simplifications … [and that] it is a great pity that urban historians and even urban geographers seem to have forgotten the critical component of scale” (Carter and Wheatley Reference Carter and Wheatley1980: 57–58).
In the case of Manchester, one of the few quantitative studies of the city has been conducted by Laura Vaughan and Alan Penn (Vaughan Reference Vaughan1999). Their research applies spatial syntax methods to analyze street structures of immigrant neighborhoods in Leeds and Manchester using 1881 census data, and holds rich implications for the study of urban ethnic groups, but the limitation in both the area and period of study leaves much to be expanded upon. High granularity has become essential to studies seeking to provide not only comprehensive but accurate descriptions of the residential patterns of large towns and cities, yet the labor-intensiveness of this type of research and a shortage of granular spatial data have historically restricted the temporal and geographic scopes of such studies.
Fortunately, the digitization of historical source material in recent decades, such as geographic surveys and demographic microdata, has greatly increased the potential for quantitative historical research. For historians of Victorian Britain, in particular, the digitization of nineteenth- and early-twentieth-century censuses through the Integrated Census Microdata (I-CeM) project has been a significant advancement (Higgs et al. Reference Higgs and Schurer2024). This development has enabled the automation of geocoding techniques to bridge geographic and demographic datasets. Since 2019, Tian Lan and Paul Longley have published a series of papers on the mapping of residential differentiation at street level using automated algorithms to process the censuses of England and Wales collected between 1881 and 1901; overlapping with this, Nigel Stephen Walton has produced similar but more granular work for the censuses of 1901 and 1911, covering London and Middlesex (Lan and Longley Reference Lan and Longley2019, Reference Lan and Longley2021; Lan et al. Reference Lan, Dijk and Longley2022; Walford Reference Walford2019). And in early 2025, Joshua Rhodes presented a similar yet refined approach to Lan and Longley’s for British census street-georeferencing, reaching across England and Wales (Rhodes Reference Rhodes2025).
The arguments in favor of semi-manual geocoding, however, remain centered on the points that have plagued historians of residential segregation for decades: scale, scope, and accuracy. The approaches presented by Rhodes and Lan, and Longley have the benefit of coverage across Britain, and this is undoubtedly a substantial development for historians and geographers interested in using I-CeM data for spatial analysis. However, this was only feasible through the use of databases such as the GB1900Gazeteer and the OSAddressBase, which are limited due to the periods they reference (Lan and Longley Reference Lan and Longley2021; Rhodes Reference Rhodes2025). Without specific building-level referencing, answers to some of the key questions in Victorian urban history – around segregation, household structures, neighborhood development – remain elusive. Guillaume Proffit has proposed a method for increasing specificity using AddressBase to link individuals to specific buildings and imputing as many intermediary locations as possible from this baseline (Proffit Reference Proffit2024). While the potential for such an approach is enticing, it still holds substantial limitations, not the least of which is its reliance on GB1900 as one of its earliest spatial source bases for the majority of England. The dynamism of Victorian cities from the mid-nineteenth century onwards leads to considerable discrepancies between street names and house numbering, resulting in notable gaps in georeferencing and coding. The issue increases with time. In Manchester, it is particularly severe given the substantial changes to the city’s urban fabric between the 1840s and the turn of the twentieth century. Proffit’s data, for example, only manages to precisely geocode 45 percent of records from Manchester’s 1851 census, and while he proposes locations for an additional 39 percent beyond that, these are quite broadly approximated and cannot be employed to reliably study specific buildings or neighborhoods since the margins of error range up to several kilometers (Proffit Reference Proffit2024). Walford’s work resembles most closely the method outlined below, but the issues in geocoding the London and Middlesex data from 1901 and 1911 due to discrepancies between spatial and census data are even more prevalent for the earlier period in Manchester (Walford Reference Walford2019). Given these conditions, it is without a doubt that researchers in this area still have much to gain from adopting the perspective of local historians and building intimate relationships with and understandings of Victorian cities and their changing morphologies by bridging traditional techniques and emerging technologies.
North American studies have been more productive in pioneering modern geocoding and referencing techniques over the last three decades and offer useful frameworks and examples for highly granular geocoding. Sherry Olson, Jason Gilliland, and their collaborators’ work on Montreal, in particular, has established a model for demographic mapping to study the city’s patterns of segregation according to such characteristics as occupation, language, religion, and socioeconomic status (Gilliland and Olson Reference Gilliland and Olson1998; Gilliland et al. Reference Gilliland, Olson and Gauvreau2011; Olson Reference Olson1989, Reference Olson2017). Using sources such as tax rolls and city directories, they have reconstructed Montreal’s residential population from the 1860s at a highly granular scale (Gilliland Reference Gilliland1998). This trailblazing work has outlined a framework for individual-level mapping, which has inspired a subsequent series of geodemographic projects on North American cities. In this direct lineage are projects by Dunae, Stone, and Lafreniere who have expanded their topics and questions of study beyond the home to study daily life cycles (Dunae et al. Reference Dunae, Lafreniere, Gilliland and Lutz2013; Stone et al. Reference Stone, Lafreniere and Hildebrandt2022). Schlichting, Tuckel, and Maisel, for example, have proposed a study of residential segregation and the Great Migration of African American populations in early-twentieth-century Connecticut using street segments from the 1990s census in reference to maps from the 1920s (Schlichting et al. Reference Schlichting, Tuckel and Maisel2006). Their findings demonstrated higher rates of racial segregation than would have been identifiable at a larger aggregate scale and offer an early example of the utility of highly granular geocoding. Historians and geographers of the region have used other kinds of geographic and demographic material to geocode individuals for studies of residential segregation, including tax records, electoral maps, and fire insurance plans (DeBats Reference DeBats2008; Dunae et al. Reference Dunae, Lafreniere, Gilliland and Lutz2013). John Logan’s work has involved geocoding microdata from the 1880 census for a series of American cities, including Charleston, Baltimore, Newark, Chicago, and Washington, DC (amongst others), as well as studying the persistence of segregation from the twentieth to the twenty-first centuries (Logan Reference Logan2013, Reference Logan2017; Logan and Martinez Reference Logan and Martinez2018; Logan et al. Reference Logan, Zhang and David Chunyu2015, Reference Logan, Graziul and Frey2018). These approaches to geocoding have set a baseline for what is possible using historical data, and have made him a leading authority in historical microdata geocoding. Such work continues to demonstrate how nuanced residential patterns often are, and reasserts the necessity for studying urban compositions at such a specific scale.
Granular neighborhood geocoding continues to be popular in studies of late-nineteenth and early-twentieth-century North American cities as demonstrated by Gray and Bowman’s study of the Manhattan housing market for 1880–1910 and Swope’s sociological and epidemiological study of Washington, DC, in the early 1900s (Gray and Bowman Reference Gray and Bowman2021; Swope Reference Swope2024). More recently, furthermore, this work has extended to European cities such as in Gabriel Brea-Martinez, Finn Hedefalk, and their collaborators’ work on Landskrona, where they have studied the relationship between residential patterns and long-term outcomes in education and health using geocoded microdata for the Swedish city (Brea-Martinez et al. Reference Brea-Martinez, Hedefalk, Nilsson, de Souza Maia, Dribe, Nilsson and Tegunimataka2024; Hedefalk et. al. Reference Hedefalk, van Dijk and Dribe2025).
These studies have repeatedly asserted the value of performing analyses of segregation at highly granular scales, and present approaches that can be applied to British data, including processes for digitizing historical maps or adapting non-contemporaneous geographic databases. The lack of building-specific material for British Victorian towns and cities appears to have deterred historians and geographers studying the period, yet this digitization of the censuses alongside other sources addressing urban and commercial fabric is making the translation of these approaches to British data both more feasible and enticing. The novelty of the following approach is not, therefore, in the conceptualization of a new framework for geocoding in general, but rather the first demonstration of how British historians and historical geographers can produce new databases with significant potential for studies of residential segregation and urban life-cycles.
This article proposes a methodology for semi-automatic census-geocoding building from both traditional studies of residential segregation from the 1980s and the contemporary attempts to increase both the geographic and temporal scopes of this kind of research. By using a greater range of sources specific to nineteenth-century Manchester, including non-cartographic directories, the work presented in this article covers an urban geography that allows for the geocoding of over 87 percent of records from the censuses of 1851, 1861, 1881, and 1901. The results demonstrate the usefulness of such granular data, which can be studied at the individual level or flexibly aggregated for summary analysis. I illustrate this particular approach by studying two scales of residential conditions – neighborhood (defined using consistent geographic units) versus building compositions – and by providing a visual example of changes in Manchester’s residential patterns between 1851 and 1901.
Sources and methods
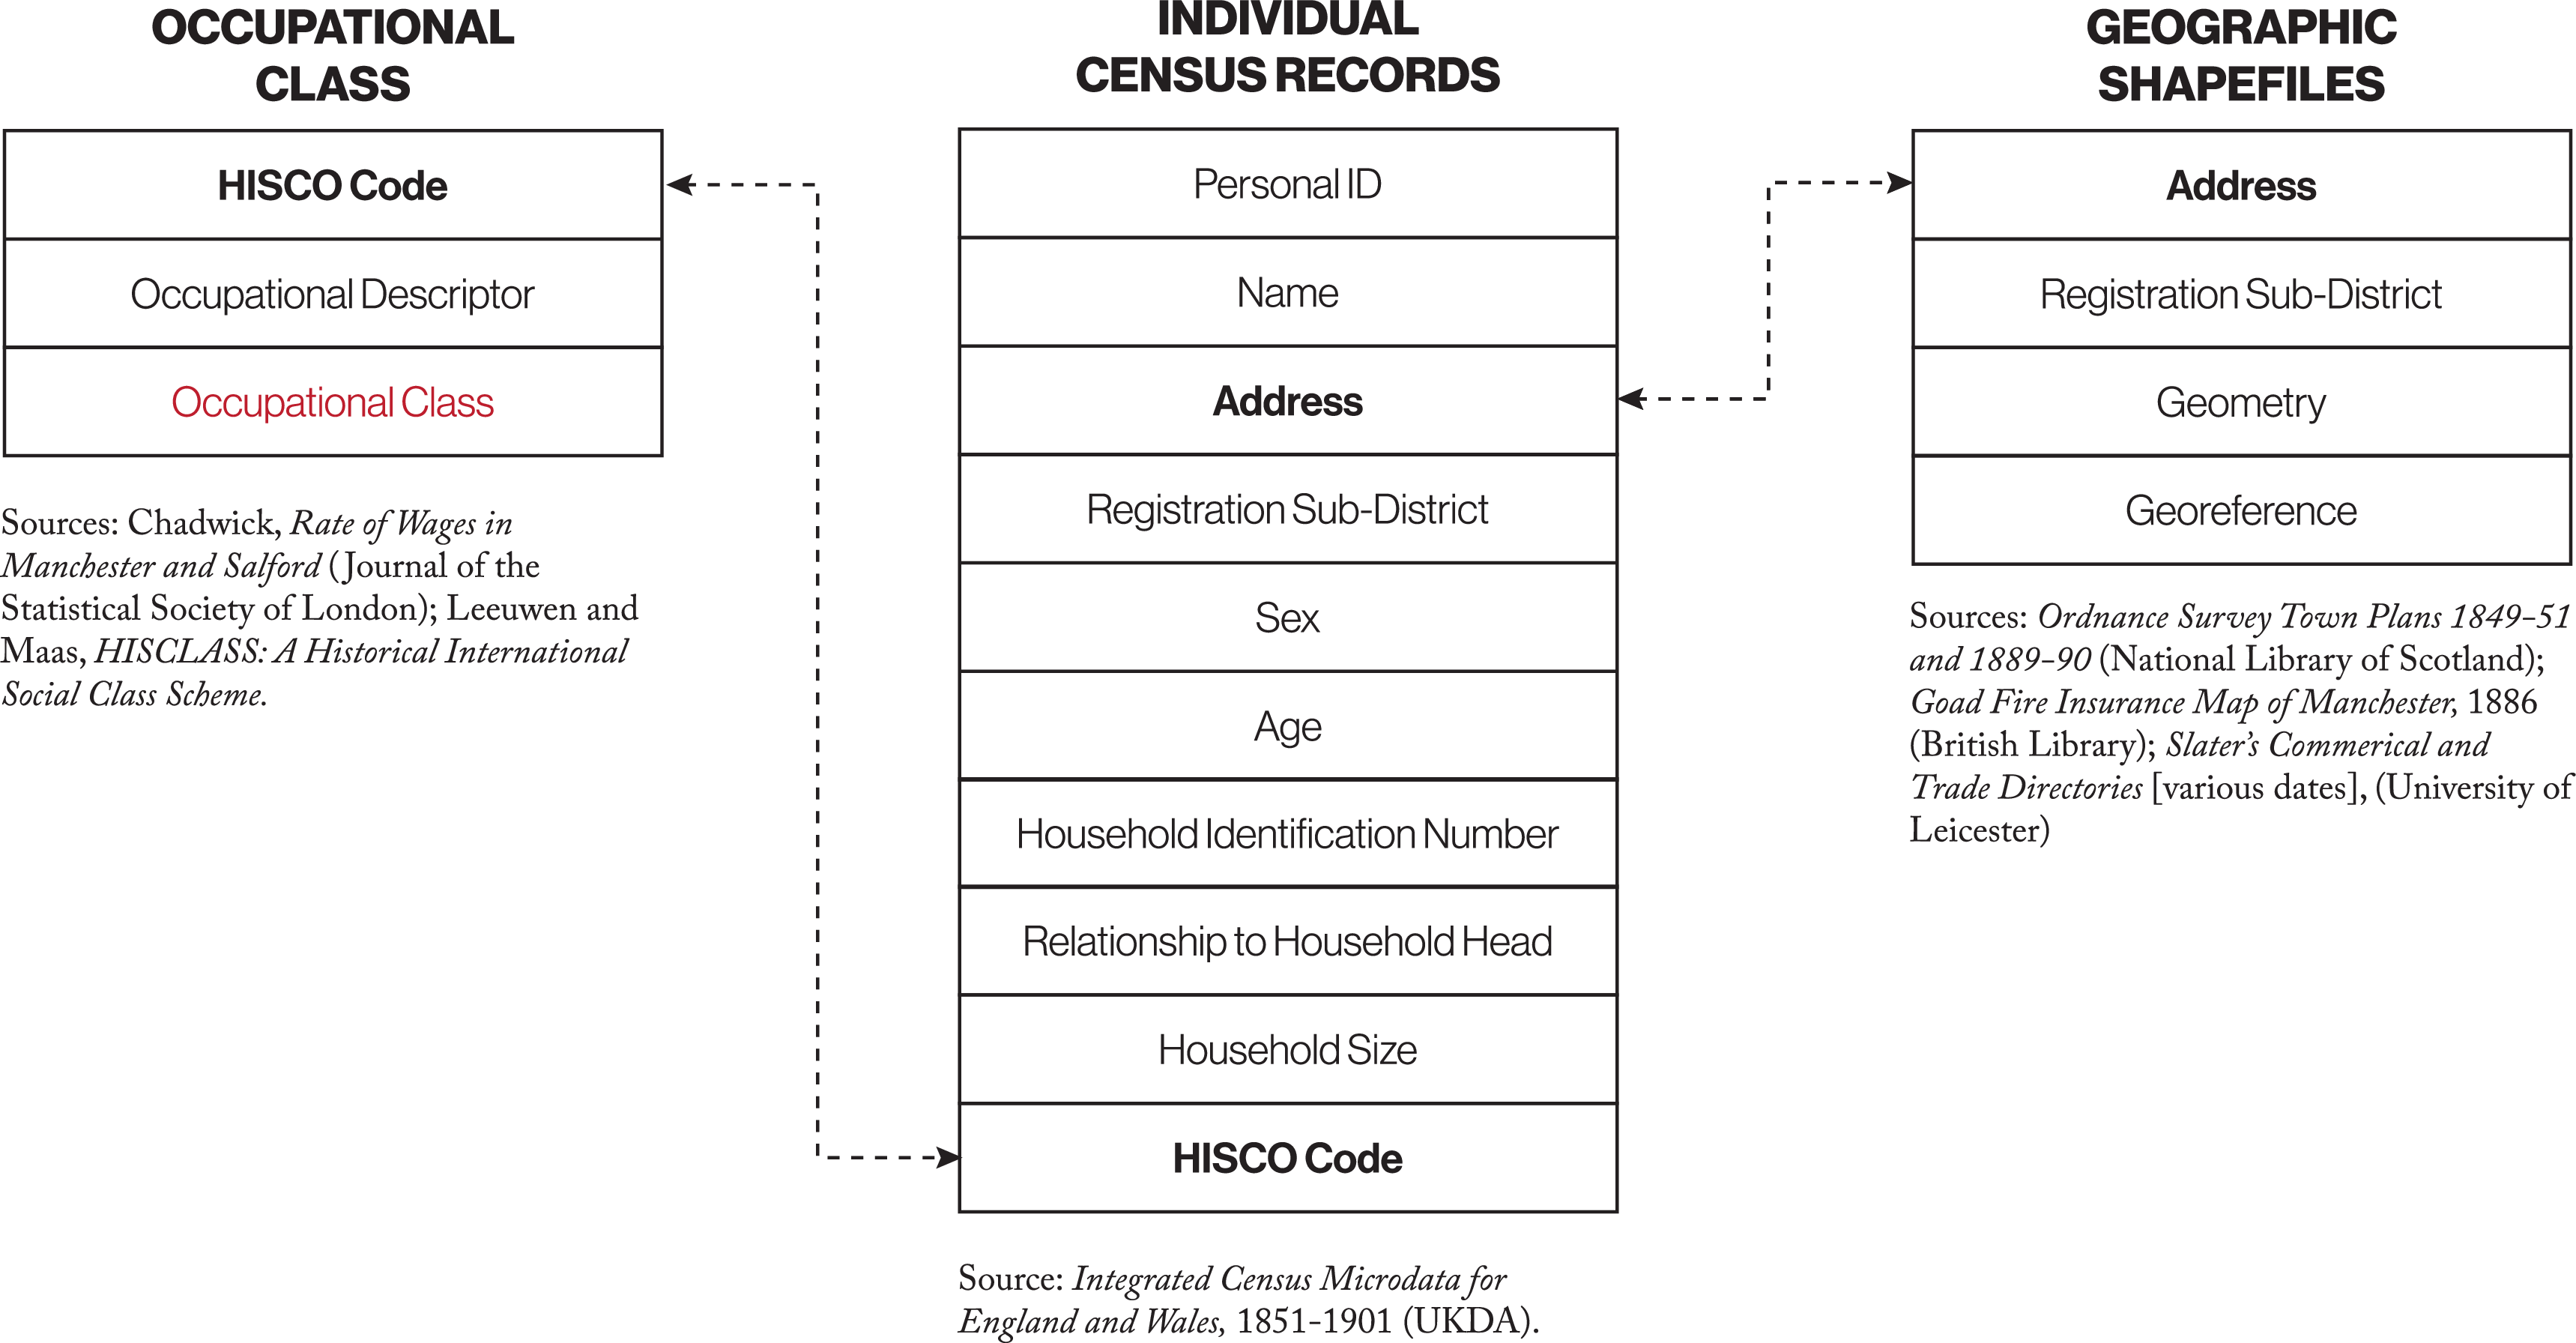
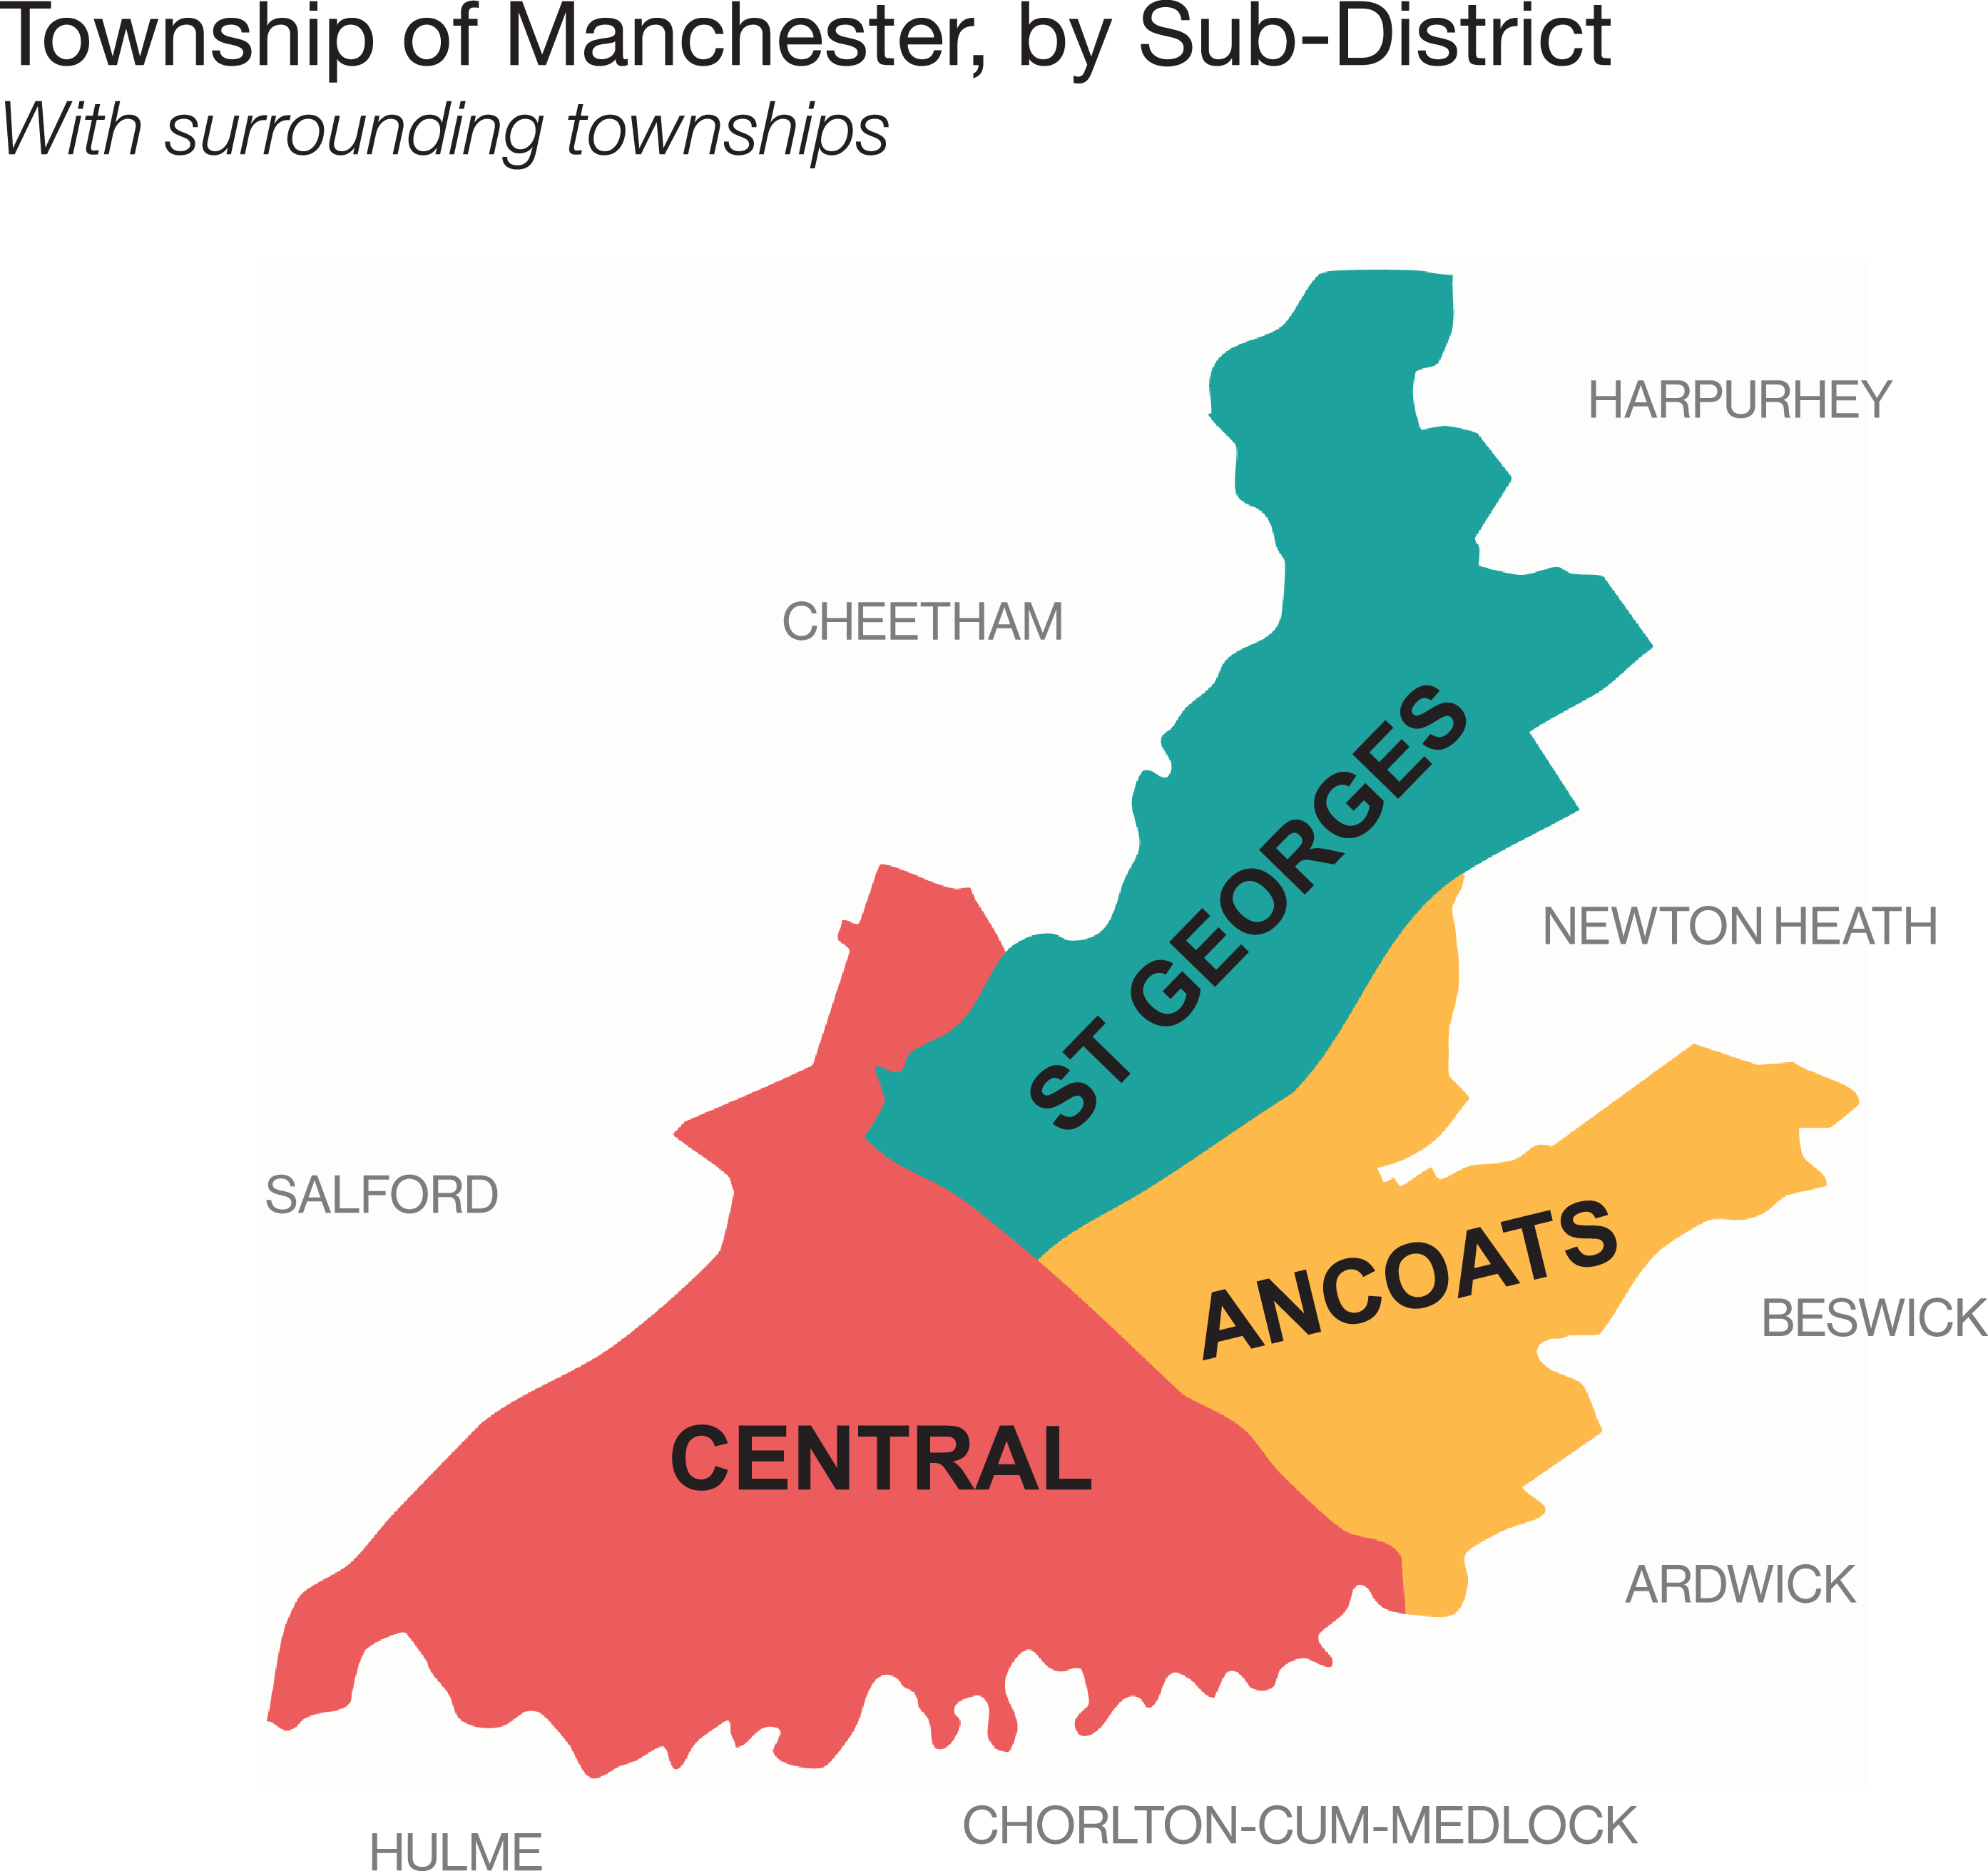
Figure 1 presents the record-linking architecture for the core database produced in this article, which draws on three types of sources: individual-level census data for the years 1851, 1861, 1881, and 1901 provided by the UKDA I-CeM project; historical maps and directories of Manchester for the period of study, including OSs, insurance maps, and trade directories; and wage statistics. The I-CeM project conducted out of the University of Essex under an Economic and Social Research Council grant involved the creation of a digital database of the British censuses from 1851–1921 for use in social science research (Higgs et al. Reference Higgs, Jones, Shürer and Wilkinson2021). The original data were supplied by the platform FindMyPast, who carried out a large transcription campaign to digitize these records, and the I-CeM team carried out extensive work to code and standardize the broad range of demographic, occupational, and geographic variables collected in the original censuses.Footnote 1 The range of demographic variables available from the censuses allows for a multitude of social and economic analyses; however, the work presented here focuses predominantly on occupational data. Geographic and occupational data are related to census records using shared variables, but inconsistencies in these variables resulting from either original completion of documents or errors in digital transcriptions required manipulation for standardization, the process for which is described below. In its current form, the I-CeM contains several place-based variables, the most specific of which are parishes and enumeration subdistricts. These, however, are not only inconsistent over time as boundaries were often redefined between one census and the next, but also too large to provide insight into specific spatial structures. In Manchester, while the parish appears to have remained consistent with the township boundaries over the period 1851–1901, the subdistricts change from one decade to the next as those in the central district were gradually combined. The methods and discussion below make reference to the final and broadest version of these subdistricts (Figure 2).
Database architecture.

Registration Subdistricts of Manchester.

Georeferencing the city
Rather than employing preexisting digital geographic files such as the OSAddressBase or GB1900Gazeteer, the bulk – and value – of this method lies in the production of original spatial reference databases, which include point references for each building in Manchester for the period 1850–1900, generating geographic “shapefiles,” which include character address strings and coordinates for each location. The aforementioned changes to the city’s morphology required several iterations of georeferencing in order to maximize linkage compatibility between urban coverage and census data; fortunately, the availability of OSs throughout this period makes it possible to generate three separate shapefiles corresponding roughly to the periods around the early 1850s, the late 1880s, and the early 1900s.
The granular scale of some of these surveys, particularly the Towns Plans undertaken in the late 1840s/early 1850s and revisited in the late 1880s, provides detailed building footprints for most major towns and cities in nineteenth-century England and Wales (“Ordnance Survey Town Plans: Ten feet to one statute mile, Manchester and Salford.” 1849; “Ordnance Survey Town Plans: 1:500, Manchester and Salford.” 1890; “Ordnance Survey, 25 inch plans of England and Wales.” 1915). These Towns Plans maps include street labels and the names of many public and private institutions. However, the lack of house numbering has been a key hindrance in their use for precise georeferencing, and the opacity of the numbering systems in nineteenth-century cities has been a notable hurdle in this type of work. Fortunately, complementary sources for Victorian Manchester exist to reconstruct the city’s urban geography.
To familiarize myself with the numbering conventions for the city, I began by digitizing the city’s central ward using the Town Plans from the late 1880s in accordance with the Goad Fire Insurance Plans (GFIP) of 1887. The GFIP are a rich source for urban historians and historical geographers as they contain a much more comprehensive level of information for the commercial districts of many cities and towns across Britain than the OS (Goad Reference Goad1887). Originally developed – as the name suggests – for the purposes of insurance valuations, these not only include building numbers, but also details regarding building typology, heights, and construction materials. Two key patterns become clear from this source: odd and even numbers were located on opposite sides of streets (with exception of streets that only had buildings on one side); and each building – with the exception of certain central warehouses and factories – was associated with one single house number, though census records revealed that these were sometimes subdivided in “A” and “B” units or similar subdivision schemes.Footnote 2 The key limitation of this source, however, lies in its scope. The purposes of this series of documents limit the area covered to the commercial center of Manchester’s township, leaving out more than half of the city’s footprint and, particularly in the case of later years, its most populous districts. Expanding the area of study both across space, beyond the limits of the Goad-defined industrial districts, and time, reaching backwards to the early 1850s and forward to the turn of the century, required the use of supplemental sources. For this, I drew on trade directories for the city, which include the addresses for most public and commercial institutions, and in their earlier years, house numbers for addresses located at street abutments (Slater Reference Slater1850, Reference Slater1883, Reference Slater1903). A pub such as a “Red Lion” identified from the OS could be cross-referenced with the trade directories, which recorded the exact street address and number for the same pub, and from such markers, I interpolated house numbers surrounding them. Fortunately for the urban historian, the Mancunian propensity for drink produced a great number of public drinking establishments, allowing for a wide coverage of the city using this method. The enumeration of street abutments was equally helpful for segments that had fewer commercial landmarks. The lessons from the GFIP seem to have held true for the rest of the city, and from this range of sources, I produced shapefiles that contain between 26,000 and 33,000 buildings, identified as point data, across the period of study.
Locating individuals
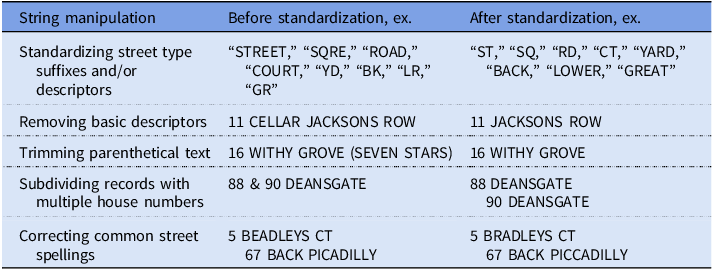
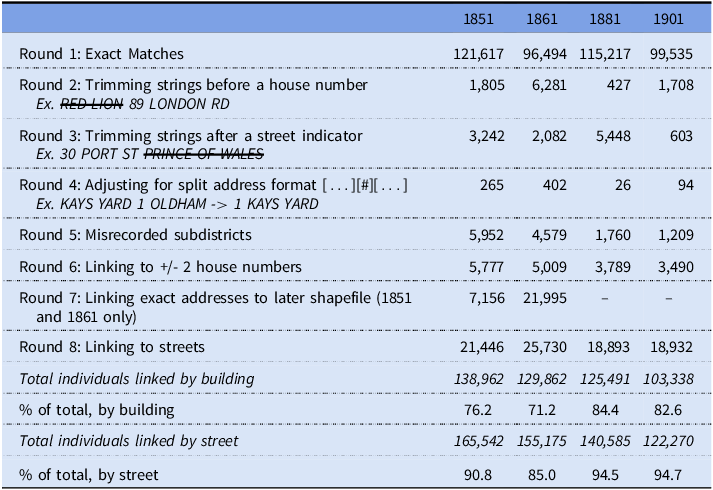
The digitization and standardization of early censuses by the I-CeM project has marked a watershed in demographic research on Victorian and Edwardian Britain. The I-CeM’s database holds individual-level records from the censuses of 1851–1861 and 1881–1921 and includes a wealth of variables.Footnote 3 While this project focuses on the period up to 1901, further possible work drawing on 1911 and 1921 could benefit from the additional information provided in these later censuses, which include more detailed data on fertility and places of work. The variables available in the census microdata include basic demographic information on each individual in every household and include name, sex, and age; occupational descriptors; and household characteristics such as household size, household type, and the individual’s relationship to the household head. The lynchpin of this project, however, is the address variable that allowed me to link individuals to buildings in my shapefiles by narrowing in first on the Manchester parish, then the registration subdistrict, and finally, the house address. Unfortunately, the 1891 data transcriptions omitted house numbers and, for this reason, I exclude this census from my study. To maximize possible links between these demographic records and the shapefiles, addresses from the census required basic standardization before initial attempts at matching, as well as several rounds of syntax manipulation during the matching process. String manipulations and cross-record linking were done through R. Table 1 presents the types of standardizations applied to addresses, while Table 2 indicates the number of individuals in the census data matched to the georeferenced addresses according to the level of syntax manipulation applied.
Standardizing addresses

Geocoding rates

The first several rounds of matching are further practices of syntax manipulation applied to string structures, omitting information preceding a number or following a street indication (e.g., “street,” “road,” “court”), yet later rounds are applied to alternative variables. Several streets shared names across Manchester in this period, yet these tend to be in separate registration subdistricts; therefore, most linking was done by linking individuals by both address and subdistrict; in certain cases, however, certain streets close to the boundaries appear to have been mis-recorded in their subdistrict and were therefore required to be linked only along the address variable and not including sub-districts (round 5). Furthermore, the records from 1851 and 1861 were linked in a first stage to the shapefile based on the 1849–50 OS, but in order to capture changes occurring across these decades and residential expansion, remaining records were additionally linked to the shapefile based on the 1889–90 OS (round 7). It should be noted that certain records were duplicated in the original linking dataset, such as in cases where addresses contained two numbers; for this reason, the sum of links by rounds is greater than the total number of individuals linked. In such cases where individuals were linked twice, only the first instance of a match is retained in the final dataset. A final round of matching was performed by extracting street names. With this final step, over 90 percent of records across all years are attributed a location at least by street, and 85 percent of these are geocoded to the building. For the sake of demonstrating the value of granular geocoding in the subsequent analysis, I have chosen to prioritize specificity over representation, and therefore, the following figures focus on the set of individuals linked by building, though additional studies could be performed on the larger set linked by street.
Unlinked individuals are predominantly the result of missing address data, usually due to illegibility or the incompleteness of the original census sheets, or else addresses whose streets fail to match up to streets in the shapefiles. Of these unlinked records, 30 percent simply had no usable address data either due to illegibility or else lack of street names (e.g., “4 PASSAGE,” “CT,” “26 HOUSE”). The remainders are generally either the result of severe misspellings in street names in census records; errors in which enumerators included streets from surrounding townships, which are therefore not within the geographic scope of the shapefiles; or discrepancies between street directories or maps and the census enumeration. This issue is especially severe for the census of 1861, which is the furthest from a cartographic or directory reference, and therefore had the highest proportion of unlocated streets. Fuzzy-matching functions employing Jaro-Winkler or Jaccard distances were tested on unlinked records in an attempt to remedy some of the cases resulting from misspellings, but a review of the results proved that a majority of resulting links were false positives, and this approach was therefore omitted (“Fuzzy Matching” n.d.). While machine-learning algorithms, such as the one presented by Proffit, have developed workarounds to georeference some of these remaining cases to maximize representation, these involve estimated locations inducing systematic biases that would undermine the specificity of this study (Proffit Reference Proffit2024). Alternatively, the location of these records could be estimated based on enumeration order, but these would also require assumptions that detract from the accuracy of this dataset. Analysis of unlinked data by observing the location of gaps between linked records, furthermore, supports the theory that enumerators included records beyond the bounds of the township, as the largest gaps are consistently found along its periphery.
Ascribing class
Defining class is one of the most contentious issues that British historians face, none more than historians of the Victorian period. Fluctuating cultural and economic conditions not only throughout the nineteenth century but also across Britain’s many regions complicate social categorizations greatly, leading to nearly as many definitions of class as there are papers that employ the concept (Cannadine Reference Cannadine2000; Colley Reference Colley1986; Hall and Joyce Reference Hall and Joyce2018; Neale Reference Neale1968). The associations between class and work, furthermore, are ambiguous in discussions of nineteenth-century Britain. Patrick Joyce, for one, has written extensively on the connection between class and work, and specifically on our period of interest. In Manchester, as in other northern industrial towns, the legacy of the textile industry and its international hierarchies evoked greater notions of both proletarianism and community; where the division between employer and employee remained strong, so too did feelings of solidarity within the laboring class. Joyce (Reference Joyce and Thompson1990), among others, stresses the multifacetedness of class, which includes politics, education, and ethnicity, yet all the same, the strength of ties between work and class enables our comparisons of early Victorian accounts of class segregation with occupation-based spatial differentiation. For the purposes of this article, I employ occupation as a direct proxy, but further work might include a more holistic approach to defining class, such as the Batey and Brown model adopted by Lan and Longley (Batey and Brown Reference Batey, Brown, Longley and Clarke1995; Lan and Longley Reference Lan and Longley2021). The class scheme employed below is derived from the Registrar-General’s social classification of occupations defined for the 1911 census (which was used by the GRO through the end of the twentieth century), with certain adjustments made for the context of Victorian Manchester (Stevenson Reference Stevenson1928; Szreter Reference Szreter1984). Clerks, for example, are placed in a lower social class than in Stevenson’s scheme – “skilled” rather than “professional” occupations – and the status of manual work was arranged in cross-reference with wage data drawn from David Chadwick in 1860 and Arthur Bowley in 1900 (Bowley Reference Bowley1900; Chadwick Reference Chadwick1860). From these sources, I defined the six classes as follows:
-
1. Professional Occupations, including doctors, engineers, national defense officers, and clergymen
-
2. Managerial and Technical Occupations, and Dealers, including shop owners, jewelers, and news agents
-
3. Skilled Occupations, including many employed in the transports, machine and building industries, and clerks
-
4. Partly-Skilled, including service workers, police, and national defensemen, stone miners and quarriers, and laborers in semi-specialist industries (wire, tin, wood)
-
5. Unskilled (General) laborers
-
6. Unskilled (Textiles, Mining, Agriculture) laborers
This categorization captures the range of occupations found in the census, from the upper-middle to the lowest working classes, and assigns them a numerical value from one to six. Individuals with no occupation listed were assigned the class of their head of household, when possible, allowing for the classification of over 95 percent of individuals across each of the censuses. Of such records, 63–71 percent were children under the age of 16, and an additional 23–25 percent were wives. The choice to ascribe class from the head-of-household mirrors the dependence on male wage-earners in industrial Britain under the male “breadwinner” model (Horrell and Humphries Reference Horrell and Humphries1997).
This conversion of a categorical into a continuous variable allows for quantifications of class differences, rather than simple identifications of differences. One of the key limitations of these data is the exclusion of upper-class indicators in the occupational variables. As shown by Nenadic (Reference Nenadic1991), the aristocrats and landed gentry lived predominantly from passive income, which would not have appeared on census forms. Therefore, it is essential to remember that the following discussion focuses on Manchester’s employed population, ranging from the upper-middle class to the lowest working-class, and their households.
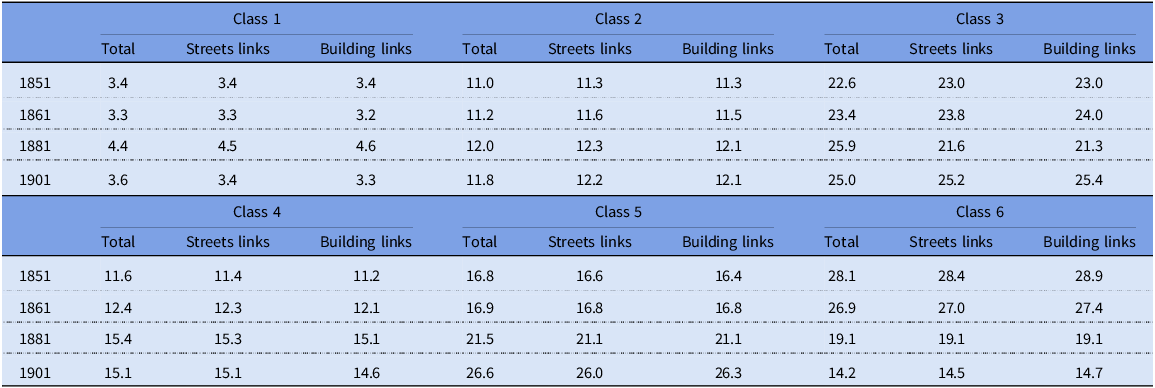
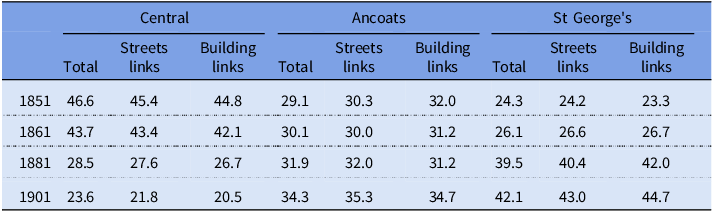
Each approach to georeferencing involves a certain level of bias, skewing the representativeness of the linked data in comparison to the original totals. Tables 3 and 4 present the difference in representation of occupational classes and registration subdistrict between records linked by street and by building and original populations, for each of the four censuses used. A key concern in working with this type of data would be an underrepresentation of the working class – whose addresses may have been less reliably reported; however, this does not appear to have been a significant issue as differences in the proportion of the population in each occupation class were consistently within a one percent difference between sample and original populations. More significant differences exist in observing representation by registration subdistrict (RSD), especially in regard to the Central RSD. Here, we observe underrepresentation between 2–3 percent. This likely reflects the difficulties of georeferencing without exact concurrent maps and census data. As the oldest part of Manchester, this district grew densely and organically, with short, winding streets and scattered back streets and courts wherever space was to be had. As the first targets for urban reform, the neighborhoods in the Central RSD changed the quickest and most drastically over our period, leading to – as discussed above – a discrepancy between maps of the city and the addresses found in the census. In Ancoats and St George’s, this issue is less apparent as streets were straighter and more consistently numbered, with lower levels of renewal and replacement.
Representation of occupational classes in total versus linked populations, as % of population by year

Representation of registration districts in sample versus total populations, as % of total population by year

Visualizing Manchester, 1851–1901
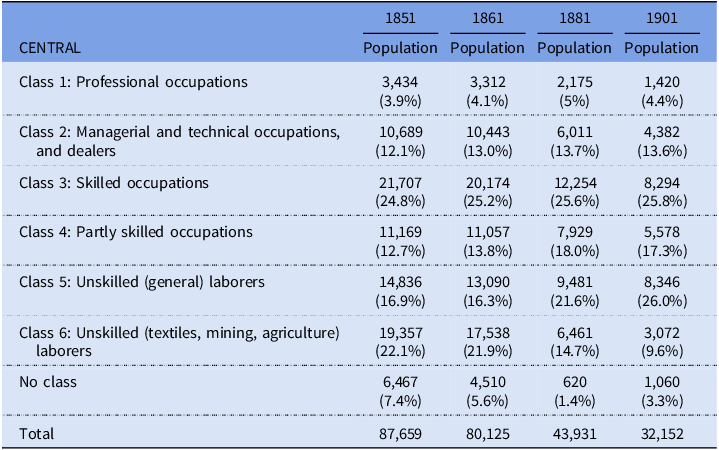
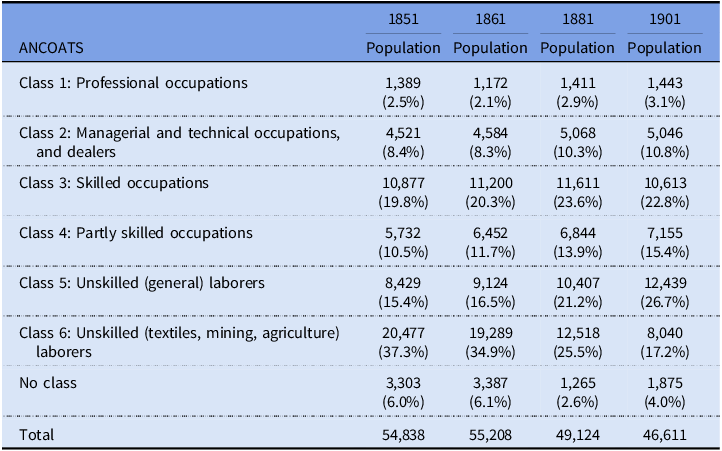
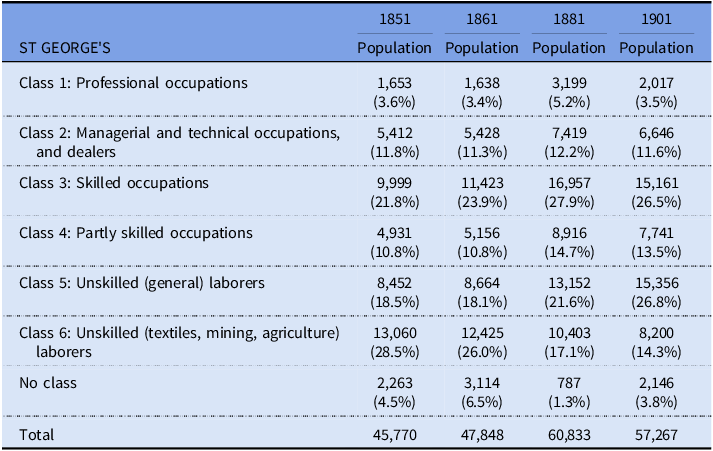
Tables 5–7 display the class distribution for Manchester from 1851 to 1901, for each of its three registration districts. The census data indicate a decline in Manchester’s total population over this period from just over 182,000 inhabitants in 1851 to 129,000 in 1901; however, these tables demonstrate the unevenness of this change across Manchester’s districts. The decline is nearly exclusively the result of an exodus from Manchester’s city center, which was particularly severe in the decades between 1861 and 1881 across all social classes (Table 4). Ancoats, in contrast, experienced a far more moderate decline in its population over this period, though changes there were almost exclusively the result of a sharp decline in the textile classes, which were only marginally offset by an increase in most other classes (Table 5). St George’s, the least populous of all three districts in 1851, was the largest by 1881, having experienced steady growth in the third quarter of the century (Table 6). Like the other two districts, it experienced a decline in the proportion of Class 6 individuals but witnessed substantial increases in the number of individuals in skilled occupations and other unskilled sectors. These uneven changes to the city’s occupational structure call for a more specific spatial exploration of residential patterns over these patterns, in contrast to the generalized discussions that have glossed over this heterogeneity.
Occupational distribution of central district, 1851–1901

Occupational distribution of Ancoats district, 1851–1901

Occupational distribution of St George’s district, 1851–1901

One of the key benefits of such a granular dataset is flexibility in the scale of analysis. As Figure 3 shows, each record linked by address is coded to a specific geographic point reference, and these can be grouped by any unit of choice; for this reason, the following analysis is performed on address-linked records, though further study could be performed on the larger street-linked dataset. For the purposes of this article, results are presented over hexagonal tiles with 150-meter diameters. The reaggregation of highly granular data is a technique that has been used in similar geocoding work for cities such as Montreal with similar justification, to provide consistent, comparable units for analysis (Carr et al.Reference Carr, Olsen and White1992; Gilliland et al. Reference Gilliland, Olson and Gauvreau2011). The 150-meter scale was chosen as a balance between preserving the geographic specificity of the data and improving analytical legibility, and reflects a walking distance of approximately two minutes. Analyses of the demographic and residential data were tested on different tile sizes (75, 150, 200, and 400 m), and 150 m was the smallest unit found that consistently held more than three addresses or ten individuals – smaller units experienced too many extremes as a result of low density, while larger units lost specificity and nuance. Resulting visualizations provide revealing insights into the development of Manchester over the second half of the century, capturing both the northward expansion of the Township and shifts in patterns of building composition and occupational segregation. Figure 4 presents the residential distribution for Manchester, 1851–1901.
Georeferencing example, Ancoats District 1880s. Underlying map (Ordnance Survey, 1889–90) reproduced with the permission of the National Library of Scotland, https://maps.nls.uk/.

Residential density of Manchester, 1851–1901.

The redistribution of Manchester’s population across its three districts is immediately recognizable. In 1851, the population resided predominantly in the southern, central district of the township. As the decades progressed, this area depopulated in favor of new developments in the northern district of St George’s. Across this period, the eastern Ancoats district remained densely populated. Surrounding urbanization further exacerbated the exodus from Manchester’s center, resulting in a 30 percent decline in the township’s total population.
This shift largely reflects the economic and sanitary priorities that emerged in the city in the 1840s, as local officials grappled with the severe living conditions from which their constituents suffered and strived to define and secure their economic position. While the Borough Council had struggled to establish its local authority in the early decades of the century, by the early 1840s it had gained a charter of incorporation and solidified its influence in Manchester. By this point, Manchester’s reputation seemed to be largely at risk: reports of the dire health of the urban classes shocked and dismayed readers across the country, and the rise of other industrial cities threatened its economic standing as a manufacturing town (Maw et al. Reference Maw, Wyke and Kidd2012; Maw Reference Maw2018). In the face of this dilemma, slum clearances seemed an answer to both: razing the worst of the center’s overcrowded areas pushed their residents to find healthier accommodations while clearing the way for new commercial real estate. By the 1880s, rows of dense terrace housing had been replaced by massive warehouses whose proximity to railways and canals facilitated the exportation of goods to the rest of Britain and beyond. The first phase of changes was initiated in 1844 when the Borough Council succeeded in passing three key pieces of legislation that codified and strengthened municipal involvement in the city’s development (Redford Reference Redford1939: II:78–89). These three acts – the Bonding Warehouse Act, the Borough Police Act, and the Manchester Improvement Act – marked a turning point in the city’s administration and the consolidation of its priorities. Together, they secured both the Borough Council’s authority over Manchester and its surrounding townships in determining areas of priority for infrastructural development and improvement, and their financial position by establishing a relationship with the previously municipalized gasworks to fund such projects. Under the flag of public health and sanitary reform, slums were razed and thoroughfares built up, and despite its relative decline in popularity, Manchester was, with these acts, beginning to devise one of the earliest local sanitary codes in the country.
These new priorities were supported by the city’s economic circumstances in the mid-1840s: despite the widespread economic depression raging through the United Kingdom, “money was cheap,” and with profits from the municipalized gasworks, the council took advantage of low rates to purchase land and begin their crusade to build a more moral and healthful city (Cannadine Reference Cannadine2018; Joyce Reference Joyce2013; Manchester Courier and Lancashire General Advertiser 1844; Redford Reference Redford1939: II:87–89). By the late 1870s, however, township expansion slowed as land became more expensive and urban developments began focusing on expanding infrastructure in the borough’s more peripheral townships. While new housing was still being erected at the boundaries of the city through the end of the century, the speed and scope of this construction rapidly declined in the final two decades, though new forms of housing from the mid-1890s began to signal a shift in approach to urban development. The dataset here developed facilitates the visualization and analysis of urban reform in Manchester, both in the transition from residential to commercial real estate in certain districts and in the adoption of new housing standards. These data offer insight not only into the demographic composition of entire districts, but more specifically, of neighborhoods, streets, and individual buildings.
Analysis and discussion
Urban studies of British Victorian cities often wield the term “segregation” to discuss spatial class dynamics and residential structures, yet the types and extents of this condition are often hard to define. Given that this article’s focus is on the methodological construction of a database, the following discussion provides rather straightforward measures for assessing spatial patterns; however, future work will produce further mathematical analysis of segregation using indices popular with geographers such as dissimilarity indices or measures of centrality and clustering (Duncan and Duncan Reference Duncan and Duncan1955; Massey and Denton Reference Massey and Denton1988). Analysis, here, focuses on proximity between different classes at two scales: within 150 m tiles, used as a proxy for “neighborhood,” and within buildings, albeit averaged across the same 150 m tiles for comparison. For the sake of clarity, this discussion employs the terms “diversity” and “uniformity” in regard to neighborhoods or districts, but “heterogeneity” and “homogeneity” in regard to the internal composition of buildings.
Figure 5 presents the class ratios by tile for 1851–1901, calculated as the number of individuals from classes 3–6 per individual from classes 1–2. Patterns of diversity and homogeneity appear to have persisted over time and suggest a cleavage running along the northeast/southwest axis of the township. The lowest ratios were consistently found in the west of the central district and in the northernmost part of St George’s district, with Ancoats and the eastern Central district displaying persistent working-class homogeneity, albeit with minor improvement from 1881. Despite slum clearances and redevelopment projects, patterns of class distribution across the city appear to have remained ingrained throughout our period.
Class Ratios in Manchester, 1851–1901.

Studying building compositions offers supplementary insight into patterns of segregation at an even more precise scale, which captures the nuances of housing reform more effectively. Figure 6 displays the mean class range within buildings across the township, calculated as the difference between the highest and lowest-ranking classes at each address, averaged over each tile. In order to reduce distortion as a result of live-in servants, individuals listed as such in the “relationship to household head” variable were omitted from these calculations, the proportion of which declined over this period from 2.4 percent in 1851 to 1.5 percent in 1901. Residential heterogeneity appears to have been relatively high in the historic center of Manchester in 1851 and 1861, at the heart of the Central district, with variable conditions around the periphery of the township. In 1861, however, this general central heterogeneity was punctuated by a few quite homogenous neighborhoods. By 1881 and 1901, heterogeneity had noticeably declined throughout the city. Not only did high-range buildings decline in previously populated districts, and the lowest rates were now found in the city center, but also as St George’s expanded northwards, these new areas of development were consistently homogenous in their building compositions. This decline in heterogeneity is likely the result of urban policies and housing regulations aimed at reducing overcrowding: lower density buildings – enforced in large part through the closure of cellar dwellings – resulted in a smaller number of households per address and, by association, lower rates of class heterogeneity (Figure 7). This type of analysis not only serves to rectify the historical narrative that early Victorian Manchester was a city marked by segregation – when these figures demonstrate high rates of residential heterogeneity throughout the city – but also provides points of comparison in following years to put these conditions into context.
Class Range by Building in Manchester, 1851–1901

Address Density and Heterogeneity in Manchester, 1851–1901.

Reliance on neighborhood or district ratios is evidently insufficient in order to capture change in Manchester’s residential patterns. Residential reform appears to have been mild in influencing macro-segregation but significant at the micro-level in affecting building compositions; while the former witnessed persistent spatial patterns over time, the latter changed not only in spatial distribution but in overall condition. The dissonance between these two scales reinforces the value of geocoding at a highly granular scale in order to capture small-scale variation in spatial patterns and residential conditions.
The richness and range of variables coded into the I-CeM database, furthermore, could be used for further analysis regarding alternative demographic characteristics. Figures 8 and 9 offer examples of additional types of analysis that could be carried out. Figure 8 uses coded birthplace variables to visualize ethnic diversity across the city to show which areas had the least and most diversity, calculated as the number of unique birthplaces found in the populations of each tile. Reliance on place of birth, of course, obscures second- and third-generation individuals, which undermines the significance of this kind of analysis, but future work on record-linking across census may make a more representative analysis possible. Figure 9 uses the household structure variable to visualize the density of multi-generation households. In both cases, spatial patterns and densities changed over time, and the decline in the diversity and density of both variables is particularly notable in the Central district. While this article has focused on segregation in regard to the city’s occupational structure, alternative approaches might choose to create social class schemes based on a greater combination of demographic factors.
Birthplace Diversity in Manchester, 1851 and 1901.

Density of Multigenerational Households in Manchester, 1851 and 1901.

Conclusion
Geocoding work has been performed on North American cities for several decades, and increasingly for European cities as well, but few historians have begun translating this kind of work for Britain – it has only been in very recent years that quantitative historians and geographers have begun approaching census-geocoding as a tool for urban analysis. To date, however, much of this work on nineteenth-century British cities have relied on geographic references and databases from the very late nineteenth or twentieth centuries and have therefore limited the feasibility and accuracy of coding data from earlier periods and, consequently, the specificity of conclusions that may be drawn from such work. In order to address these issues of scale and scope in studies of British Victorian cities, this article has proposed a model for the maximization of granularity, accuracy, and coverage. The combination of city-specific cartographic and commercial sources makes possible the specific georeferencing of nineteenth-century census records at far more refined scale than has previously been possible. This referencing by address, rather than street or registration district, enables new levels of geodemographic analysis for historians of the period both around spatial patterns and changes over time.
The analysis presented here is largely a proof-of-concept, but it sparks questions around segregation and residential reform in Victorian Manchester that deserve further study. While the granularity of the raw dataset can be unwieldy in drawing spatial conclusions, it makes possible a reaggregation of data at flexible, user-defined geographic levels for smoother summary analysis. The application presented here demonstrates the value of such data manipulation by highlighting neighborhood differentials within the city and across time. Analytical factors can describe neighborhood characteristics, such as class ratios or density, but also household and building characteristics such as household size and class diversity by address. These variables offer greater insight into the composition of Manchester than previously studied – for any British Victorian city, in fact – and hold great potential for broadening our understanding of urban dynamics in nineteenth-century cities. The spatial specificity of this dataset, furthermore, will enable revisitations of traditional arguments surrounding segregation in Manchester through quantification – an approach that has thus far only been exercised with limited application (Vaughan Reference Vaughan1999). Other avenues for research might include studies focusing on ethnicity or household compositions, for example, rather than class, or involve the development of new measures of spatial segregation using this highly granular scale to circumvent issues of unit dependency. The reproducibility of the method for other cities in Victorian Britain could foster meaningful comparative analyses of urban development and differences in local administration for the period by providing quantitative data for work that has thus far remained largely qualitative (Briggs Reference Briggs1990; Englander Reference Englander1998; Hunt Reference Hunt2019). Through its unprecedented specificity, this approach ultimately lays the groundwork for future revisitations of nineteenth-century cities and the traditional claims that have been made around their urban dynamics.
Acknowledgements
I would like to thank the reviewers for their helpful feedback, and all the support I have received from members of CamPop throughout this process, in particular Guillaume Proffit and Alexis Litvine.


 Open access