


Introduction
Large societal problems involve many stakeholders, such as policymakers, citizens, business owners and politicians, and they all have their own perspective on the problem and the desired solution (Hisschemöller and Hoppe Reference Hisschemöller and Hoppe1995). This diversity of perspectives is necessary to realise a socially accepted solution: the combination of diverse ideas and interaction of citizens has been shown to deliver the best solutions to complex societal issues (Surowiecki Reference Surowiecki2005; Steyvers et al. Reference Steyvers, Lee, Miller, Hemmer, Laverty and Williams2009). At the same time, with such variety of perspectives, any given solution can encounter resistance (Reed Reference Reed2008).
When people with different perspectives deliberate, they can learn from each other and expand their ideas (Sunstein Reference Sunstein2002). Deliberation has been described in terms of reciprocity: making arguments that others can accept (Gutmann and Thompson Reference Gutmann and Thompson2009). This can be done in a process of social exchange, in which participants have the opportunity to form, reflect upon, express and discuss their perspectives and values (Kenter et al. Reference Kenter, Reed and Fazey2016). Reflecting on a new situation may change participants’ perspective on the problem (Wiggins Reference Wiggins1975) when this reflection includes perspectives that are different from their own (Gutmann and Thompson Reference Gutmann and Thompson2009).
Formerly, deliberation and participation have been opposed to each other, since optimal deliberation circumstances are described as small scale, whereas public participation requires a large number of people in order to fulfil its representative aims (Rossi Reference Rossi1997; Cohen Reference Cohen2009; Fishkin Reference Fishkin2011; Lafont Reference Lafont2015). However, this tension is alleviated when numerous small-scale deliberations are organised within large-scale participatory events, such as during “citizens’ summits” (Caluwaerts and Reuchamps Reference Caluwaerts and Reuchamps2015) or “mini-publics” (Lafont Reference Lafont2015). During such event, participants join one of the parallel, small-scale deliberations, where they meet other participants face to face, which promotes impartial, substantive and inclusive discussion due to their small size, random composition and freedom from the public gaze (Elster Reference Elster1998). Examples of citizens’ summits that have addressed complex policy issues are the assessment of a province’s electoral system in Canada (Warren and Pearse Reference Warren and Pearse2008) and reforms of national politics in Ireland (Farrell et al. Reference Farrell, O’Malley and Suiter2013). Decisions made at such summits should ideally “reflect the reasoned opinion and openness to persuasion of all those involved and not the power relations in the group” (Caluwaerts and Reuchamps Reference Caluwaerts and Reuchamps2015, p. 5).
To understand the impact of public deliberation, methodical measurements and descriptions are required. For this, voting mechanisms can be used to organise and collect participants’ preferences (Black Reference Black1987). If all votes cast during a deliberation are collected, they can be compared, which allows for further analysis (D’Ambrosio and Heiser Reference D’Ambrosio and Heiser2016).
The aim of the present research is to explore a new measurement that defines how similar the preferences of participants are during public deliberations, in addition to collecting insights to the degree of mutual understanding that participants have reached. The concept group proximity is introduced and explored using a rank correlation to compare group rankings at different times. This enables a quantitative analysis of the early stages of public policymaking processes. For example, comparing the group proximity of a baseline ranking and a ranking at the end of an event can show what impact deliberations have had on participants’ rankings during a public deliberation. The authors had the opportunity to perform large-scale measurements when the organisers of a citizens’ summit were in search for a method to facilitate group deliberations and a method to measure the impact of these deliberations.
The remainder of this article is structured as follows. In the background section we present the relevant background literature, and in Section Context the context of the summit and the value deliberation methodology are described. Then, in the methodology section we describe the concept of group proximity and additional methods of analysis. The results section presents the results of the statistical, survey and content analysis. This is followed by a discussion of the results and our conclusions.
Background
In the early stages of a policymaking process, public deliberations such as a citizens’ summit can be organised to involve all stakeholders (Renn et al. Reference Renn, Webler, Rakel, Dienel and Johnson1993), increase the chance of policy acceptance (Papacharissi Reference Papacharissi2010) or to achieve mutual undestanding among stakeholders (Muro and Jeffrey Reference Muro and Jeffrey2006). A citizens’ summit can be defined as an updated version of the traditional town hall meeting (Moynihan Reference Moynihan2003). Fung (Reference Fung2003) describes three differences from those traditional meetings: (1) diversity in the backgrounds of the participants is one of the aims; (2) in order to represent the diversity in perspectives, there is a willingness to listen to each other and (3) participants are guided in their reasoning by facilitators, to ensure that all contributions during the deliberations are both well considered and well argued. Such public deliberation can lead to an “increase in participants’ knowledge of the issue under discussion, a greater willingness to compromise, more sophisticated and internationally consistent opinions, and movement toward more moderate policy choices” (Carpini et al. Reference Carpini, Cook and Jacobs2004, p. 331). In addition, involving stakeholders in deliberations can increase the chance that a policy is socially accepted (Papadopoulos and Warin Reference Papadopoulos and Warin2007). Luskin et al. (Reference Luskin, Fishkin and Jowell2002) and Warren and Pearse (Reference Warren and Pearse2008) describe elaborate cases that illustrate these statements.
Public deliberation has also received a fair amount of criticism, as described by Rossi (Reference Rossi1997), Mendelberg and Oleske (Reference Mendelberg and Oleske2000), Lindeman (Reference Lindeman, Delli Carpini, Huddy and Shapiro2002), Shapiro (Reference Shapiro2017) and others. The criticism includes the risk of an uneven playing field caused by participants’ unequal levels of argumentative skills; therefore, there is a risk that the more eloquent participants will use these skills as a tool to overrule other participants (Mendelberg Reference Mendelberg2002). As mentioned by Fung (Reference Fung2003), working with well-trained facilitators can stimulate and guide a balanced deliberation instead.
In addition, if a common language can be found that is both understandable and new to all participants, the power differences can be overcome. Deliberating on the values that all participants consider relevant for a topic could serve as this common language (Pigmans et al., Reference Pigmans, Aldewereld, Dignum and Doorn2019). This is because participants are generally not used to reflect on their values. So it is new to all, yet at the same time all participants are capable of explaining why a certain value is relevant to them. Identifying and discussing these values to find a common ground has also been referred to as normative meta-consensus (Dryzek and Niemeyer Reference Dryzek and Niemeyer2006): a consensus, not on the level of solutions, but on an abstraction level higher, the level of values. In this state of normative meta-consensus, the relevance of a value is recognised by all participants, regardless of how values would be prioritised by each participant. Fishkin (Reference Fishkin2011) describes this as “collective consistency”: even if people do not agree on which alternative is best, through deliberation they might come to a meta-consensus on what dimensions or values are important.
Since there are numerous aspects that can be measured and numerous methods to measure those aspects, it can be complex to assess the impact of public deliberation (Carpini et al. Reference Carpini, Cook and Jacobs2004). Citizens’ summits have been assessed both in terms of personal impact during the summit and in terms of follow-up actions that contribute to policymaking. Changes that occurred in the opinions of summit participants have been attributed to deliberative reasoning, in terms of mentioning the common good, refraining from disrespectful behaviour and reflecting on the arguments put forward (Himmelroos and Christensen Reference Himmelroos and Christensen2014).
Fishkin (Reference Fishkin2011) discusses six effects that mini-publics can have: changes in policy attitudes, in voting intention, civic capacity, collective consistency, public dialogue and public policy. To be able to measure such changes, for each type of change, a frame of assessment is needed. The social and political impact of a citizens’ summit in the long run has been assessed by searching for overlap between the outcomes of local citizens’ summits and local political agendas one year later (Michels and Binnema Reference Michels and Binnema2019). Applying such an assessment seems an essential development if the goal of a summit is policy change. In addition, mini-publics have been explained in terms of their internal quality and systemic impact, as a means for evaluation (Curato and Böker Reference Curato and Böker2016).
However, if the goal of a mini-public or other type of deliberative process is to increase mutual understanding among participants, a new frame of assessment is required. For this, impact could be measured methodically by, for instance, including a reference situation or a zero measurement (Cuppen Reference Cuppen2012) during the mini-public, to which the outcomes can be compared. Depending on the setup of the mini-public and the time that is available, more or less time can be spent with the participants on this comparable measurement. If there is enough time, an extended survey would be suitable, as shown by Fishkin (Reference Fishkin1997). If the time with the participants is limited, a voting mechanism can handle these measurements in a precise and systematic way.
How a voting mechanism is set up influences the outcome. For example, 21 people have 3 voting options to choose from, and they vote as shown in Figure 1. Eight participants vote A, B, C, seven vote B, C, A and six vote C, B, A. Multiple outcomes are possible in this situation. If only the most preferred solution is taken into account, solution A would win, because eight people voted A first, only seven voted B first and only six voted C first. However, there are 13 participants who voted B or C rather than A, so if the less preferred options are also taken into account, A would not win [inspired by Black (Reference Black1987)].
Example of voting situation.

Since the voting mechanism influences the outcome, choosing the mechanism is not a trivial matter. For the purpose of assessing mutual understanding, individual rankings are important as these allow for an assessment of intergroup differences. Since the aim is not to identify a winning solution but to measure differences in preferences, in this research, a Borda countFootnote 1 is used to vote for the solutions, to quantitatively compare different aggregated rankings. With a Borda count, each participant ranks all solutions. In addition, getting an outcome after one round of voting is more practical during a large-scale event compared to, for example, needing six rounds, as would have been the case if the Condorcet method would have been used. By choosing for a ranking, rather than an interval scale, participants are forced to make choices with respect to the solutions. By asking participants to make a choice, instead of marking a (possibly neutral) point on an interval scale, they are forced to reflect on why they prefer one solution over another solution.
Furthermore, participatory public policy processes are characterised by stages of divergence and convergence of ideas (Kallis et al. Reference Kallis, Videira, Antunes, Pereira, Spash, Coccossis, Quintana, del Moral, Hatzilacou, Lobo, Mexa, Paneque, Pedregal Mateos and Santos2006; Cruickshank and Evans Reference Cruickshank and Evans2012). The early stage of such processes has been described as a phase of divergence (Kaner Reference Kaner2014): participants have various ideas of what the best solution is and need room to explore their views. Dentoni and Klerkx (Reference Dentoni and Klerkx2015) describe a cycle with divergence, convergence, divergence and then again convergence before a decision can be taken on a policy. Since a citizens’ summit is an early-stage exploration of the attitudes of citizens, intended to make participants listen to each other, both divergent and convergent rankings can be expected to be seen.
Context
G1000 Rotterdam
In the wake of a series of terrorist attacks in Paris, France, in 2016, the mayor of Rotterdam (The Netherlands) wanted its citizens to discuss with each other how to maintain the existing stability in the city, to prevent such incidents from happening there. The city council decided that a citizens’ summit should be organised to start this dialogue. In total 5,500 citizens, randomly but evenly distributed over the city’s neighbourhoods, were invited to participate and 1,145 responded to this invitation. A local NGO, LokaalFootnote 2 , which promotes democratic initiatives in Rotterdam, organised the summit in collaboration with the council on 1 July 2017. The goal was for participants to get more understanding of the different perspectives of citizens of Rotterdam by listening to each other and jointly formulating policy challenges for the city.
In the months prior to the summit, the NGO organised small-scale deliberations in Rotterdam’s neighbourhoods to get citizens involved, to explore what topics should be addressed at the summit and to inform the citizens about the initiative. During these months, five topics were defined as pressing: “education and upbringing”, “social media”, “living together in the neighbourhood”, “identity” and “radicalisation”. The participants selected one of the topics to deliberate on when they registered. At the summit, 100 tables were prepared for the deliberations, with a maximum of 10 participants per group. Each group had a chairperson that was trained in the facilitation of the value deliberation process.
To define per group what the most specific issue was that they would deliberate on later (what their pressing question was that they wanted to address), the Socratic methodFootnote 3 was chosen as a suitable approach by Lokaal to connect the participants rather than to divide them. The group chairs used this method to facilitate the formulation of the pressing question. After this, an 80-minute session was facilitated by the group chairs during which each group deliberated on possible solutions to their question, and on the values they considered relevant to each solution. The method is further explained in the next section.
Value deliberation
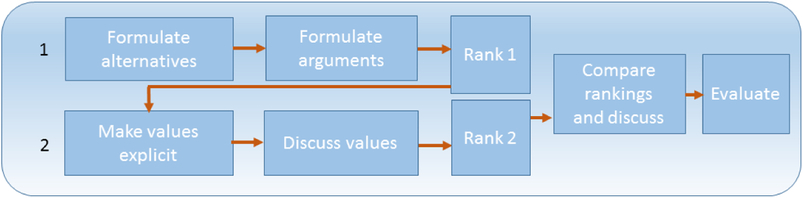
For a systematic comparison of parallel deliberations, the use of a uniform process for deliberation is required. Since a deliberation on participants’ values is considered beneficial (Briggs et al. Reference Briggs, Kolfschoten and Vreede2005; Glenna Reference Glenna2010; Doorn Reference Doorn2016), a process for value deliberation has been used (as depicted in Figure 2), in which all participants of a summit can be facilitated in the same way in groups [as discussed by Elster (Reference Elster1998)].
Value deliberation process.
Earlier, the value deliberation process was tested and analysed on a small scale during two workshops on two specific water governance problems (Pigmans et al. Reference Pigmans, Aldewereld, Dignum and Doorn2019). The outcomes were described in qualitative terms, including group discussion outcomes and written answers to open survey questions. In both workshops, the participants stated that they understood other perspectives better and that their ideas on the problem had changed.
In this methodology, it is assumed that there is a reason for gathering. Therefore, the problem to be deliberated on is considered a given. In the first step, participants formulate solutions to the problem at stake. By requiring the formulation of four different realistic solutions, participants are stimulated to include and reflect on diverse options. Once the participants agree on what could be possible realistic solutions, they proceed to the formulation of pro and con arguments for each solution, to create a basic understanding of the existing ideas regarding the problem. Without this step, participants might not comprehend all solutions. Once the participants have a basic understanding of the proposed solutions, they rank the solutions individually and in secret, from most preferred to least preferred (ranking 1).
After the ranking, the participants identify the values that they consider relevant for each solution. This can be done by offering a list of values (provided by the initiators of the deliberation) and asking participants to add values that they consider relevant that are not listed. The step of making the values explicit is followed by an elaborate discussion of the values, guided by questions including: Who wrote down this value? Why? Does everyone agree with the relevance of this value? Why (not)? Are there other ideas about this value? Subsequently, the solutions are ranked again (Ranking 2). The two rankings are compared, after which the differences or the lack thereof are discussed within the group.
Furthermore, the methodology covered means to prevent certain participants from dominating a deliberation. Explicitly giving all participants a turn to speak in each step, making the rankings a secret vote, and deliberating on values instead of debating interests contribute to a reduction of the chance of power play.
During the summit, participants deliberate in groups with a maximum of 10 members. An online tool has been developed to collect data per group. The group chairpersons use the tool on a tablet computer to enter the question that has been defined during the Socratic dialogue, as well as the formulated solutions to the problem, ranking 1, the values that are identified per solution and ranking 2. Each group has a unique ID, so that the outcomes can be evaluated per group. Furthermore, per group, each participant has a unique ID in order to track their two rankings and the possible differences between them.
When all the rankings of a group are entered, the tool instantly returns the aggregated ranking of the solutions for the group. After entering the second ranking, the tool provides the overview of the two aggregate rankings and the differences between them. The rankings and all other outcomes are collected and saved for further analysis.
For further analysis, in case of double data entries in the tool, the earlier versions are removed, keeping only the latest version. Incomplete entries are not taken into account, for example, participant IDs or group numbers that were not in accordance with the numbering we used, or incomplete entries.
Methodology
In order to be able to define the impact of the summit, five propositions are analysed.
Proposition 1: Measuring group proximity makes groups comparable, both in terms of the impact that the deliberation has had and on the proximity of individual group members.
Measuring the onsite impact of public policy deliberation can give insight in the group dynamics during such event. We analyse to what extent the measure of group proximity benefits the participatory public policymaking process. The concept of group proximity is explained in Section Group proximity and can serve as a measure to define group proximity both in general and per group. Since participants were asked to rank the solutions two times, group proximity can be calculated twice. The comparison of group proximity for ranking 1 and for ranking 2 can serve as a measure for the impact of the used value deliberation process.
Next, analysing the group proximity calculations could give insights in differences between subsets of the summit; therefore, propositions 2 and 3 focus on two subsets.
Proposition 2: The topic of deliberation can influence the degree of group proximity.
Participants could be drawn to their topic of choice for various reasons, for example, the topic education and upbringing seems to be a very different topic than radicalisation, which could influence the motivations for participants to choose a topic. This research does not focus on motivations for choosing a topic of deliberation, but we propose that the variation of the topics could impact group proximity accordingly. For this reason, group proximity will be compared between the topics.
Proposition 3: Group size can influence the degree of group proximity, since it could influence the group dynamics.
Another way to define subsets is by differentiating in group sizes. The group dynamics in a large group, for example, with nine participants, could vary from that in a small group of, for example, four participants. In smaller groups, participants have more time per participant to speak and listen compared with larger groups, so group proximity could be higher in smaller groups. By making a division between large and small groups, this proposition can be analysed.
Proposition 4: Measurement of both group proximity and the level of increased mutual understanding could serve as an onsite impact measurement to define the level of connection.
Another measure to define the level of connection could complement the findings on group proximity. Measuring to what extent mutual understanding has increased can give additional insights into the impact of the summit. Combining the group proximity measure and survey outcomes on increases of understanding among participants could provide insights to decide on approaches for possible follow-up steps for policymaking with the participants.
Proposition 5: The wording that is used in the pressing questions that are formulated during the Socratic dialogue can reflect the willingness to connect.
Each group formulates a question during the Socratic dialogue that serves as the issue that is deliberated on. The wording or phrasing of this question could influence the group process. If the wording is directed towards connection, this might influence the general willingness of participants to search for connection. In order to analyse this, a content analysis is carried out on all Socratic questions that are submitted in the tool.
Group proximity
The main contribution of this article is that we introduce the concept of “group proximity” in the context of public policymaking. Ranking the solutions at different moments of a citizen participation event allows for an impact measurement per group and a comparison of the deliberations. What is of interest is the extent to which the individual rankings within a group are similar to each other, and what changes occur in the ranking behaviour of a group after they have deliberated on values. A proximity measure enables the methodical measurement of how close rankings of a group are. This can show to what extent the group proximity changes after a deliberation on the values that participants consider relevant, and it allows for a comparison of these measurements when they are collected on a large scale.
Dryzek and List (Reference Dryzek and List2003) propose to use the concept of the single-peakedness of a group deliberation, where the solutions are first divided in subtopics, or so-called dimensions, after which they are ranked for each dimension. These rankings of a group are drawn in one figure so that the rankings of all participants of the group have only one peak. If it is possible to draw all rankings with one single peak, then one can state that there is a shared idea, a meta-consensus. However, this measure will only make the distinction single-peaked/not single-peaked, to define if there is a meta-consensus. To what extent the rankings are alike is not measured in more detail, and therefore, a comparison of the two rankings would be approximate rather than precise. In order to compare the deliberations one-to-one, a more precise measure is needed.
This research searches for a measurement that (1) calculates for each group deliberation how similar the participants ranked their preferences, (2) enables a clear comparison of ranking 1 and ranking 2 and (3) allows for an average measurement of the similarity of rankings. Therefore, we need a method to calculate whether the Borda count rankings of a deliberation have become more similar in a second round. This can be done by calculating a median ranking for each group and measuring the average distance of the group participants to this median ranking. In Appendix A, we explain how the median ranking can be calculated and why this approach is chosen.
Finding the median ranking requires a search through all the possible rankings, including those with ties. The number of possible rankings grows rapidly with the number of options being ranked: if the number of options becomes large, it is known that no algorithm can manage these calculations (Gross Reference Gross1962; D’Ambrosio and Heiser Reference D’Ambrosio and Heiser2016). However, for the four solutions that are considered in the citizens’ summit case, it is possible to search through all combinations using the Emond-Mason algorithm (Emond and Mason Reference Emond and Mason2002). We used the implementation of this algorithm from the ConsRank package (D’Ambrosio et al. Reference D’Ambrosio, Amodio and Mazzeo2017) in the R programming language.
First, we want to calculate for each group the average proximity to the median ranking, once the preference rankings are collected. There is a median ranking for ranking 1 and a median ranking for ranking 2: if the rankings differ in the two ranking rounds, the median ranking will also differ, since it is deducted from all the participants’ rankings of a group. With a calculated group proximity for both rankings, the change in group proximity between the two rankings can be compared.
After defining what the average group proximity is, the next step is to zoom in to smaller subsets: topics and group size. The participants chose one of five topics to deliberate on. We want to understand whether the group proximity is different per topic and, if so, how. Furthermore, the groups vary in size, which could possibly affect how a deliberation evolves. Therefore, the group proximity of small groups is compared to that of large groups.
Defining onsite impact by including level of increased mutual understanding
If the level of group proximity is combined with the level of increased mutual understanding, the group dynamics can be better understood and acted upon. For example, if a group has a divergent group proximity and no increase in mutual understanding, a new approach might be needed to facilitate deliberations in this group. If the group proximity is convergent and mutual understanding has increased, the participants of the group might be ready to take a next step in public policymaking, for example, deciding on what is their common ground or deciding on what solution should be implemented.
For this reason, the participants are asked in a short exit survey if they have more understanding of other perspectives after the deliberation. In order to increase the chance of getting responses after an intensive programme of deliberation, the survey consists of five simply formulated questions. To make completing the survey as simple as possible, Likert-type scale answer options are used. See Appendix B for the survey.
Content analysis
The questions collected in the tool as a result of the Socratic method provide additional information for the analysis of group proximity and mutual understanding. All questions are analysed on their phrasing, using the tool Atlasti (https://cloud.atlasti.com) for content analysis.
We search for two codes:
-
– Connection, to emphasise inclusion, building bridges and connecting people. To be coded “connection”, the phrased question should emphasise connection of groups, emphasise connection of people, emphasise a need for connection, suggest a togetherness, a “we”, or suggest efforts to create connection, to build bridges between groups or people. For this, we searched for the use of the word “we” in phrasing the question and/or words such as connection, joint, meeting, connectedness, together, involved, get in touch, dialogue and inclusion.
-
– Exclusion, emphasising differences and distance between groups without mentioning the need to bridge or overcome this. To be coded “exclusion”, the phrased question should emphasise differences between the groups, emphasise differences between people, emphasise exclusion of people or groups, or differentiate between “us” and “them”, all without mentioning a need to bridge or overcome this. We searched for the use of words such as others, us/them and outsider.
Searching for phrasings in the questions along these two codes can demonstrate whether there was a focus on distance or connection before the deliberation.
Results
Given the phenomenon of no-show for an event without registration costs and chair persons that submitted incomplete data, we collected complete and tool-compliant (i.e. correct use of user IDs and group IDs) data of 61 groups. Participants deliberated face to face with three to nine people per group (six people on average). Each of the 61 groups entered a question, resulting in the following data: 61 questions for the content analysis, two rankings (ranking 1 and ranking 2) and the identified values. Furthermore, 380 complete surveys were collected to analyse the propositions, out of a total of 610 participants that filled out any ranking (either complete or incomplete).
Overall, 110 values were identified as relevant. The most discussed values are equality (mentioned in 47 of the 61 groups), accessibility (45 groups), humanity (45 groups) and responsibility (37 groups). The 10 most mentioned values are shown in Table 1. Which values were most discussed per topic is described in Section Zooming in to subsets.
Overall top 10 most mentioned values

Statistical description
In each group, all participants ranked the solutions in their order of preference. These rankings served as input to calculate the median ranking and the group proximity.
Average group proximity
The median ranking for a group can be defined as the ranking with the smallest average distance to the rankings of the participants in the group (Emond and Mason Reference Emond and Mason2002). Group proximity is the average proximity to the median ranking.
For each group, the group proximity was defined based on the rank correlation (as explained in Section Group proximity and Appendix A) and can be between −1 and 1, where larger means more proximity. A group proximity of 1 means that the group has complete agreement: all participants gave the same ranking. A group proximity of −1 is the opposite: maximal disagreement on the ranking order. A flip is switching a solution one place on the ranking. For example, as depicted in Figure 6, if ranking 1 of participant I would be A–B–C–D, and the median ranking of its group would be B–A–C–D, one full flip would be needed to change the first into the second. If group proximity is 0.66, everyone in the group would have to flip (on average) one of their solutions to reach a median ranking. See for the explanation of flips, the median ranking and group proximity, in Appendix A.
A high group proximity of a group during ranking 1 could indicate that there was little diversity in perspectives on beforehand. If participants already agreed to a large extent, one could argue that not a lot of change is expected between the first and the second ranking. In other cases, in which the average group proximity has increased, this could indicate that the value deliberation impacts the participants’ ranking.
In Figure 3, the group proximity of all groups is shown for both rankings. “Nr. of Groups” on the y-axis refers to the number of groups. The figure shows that the group proximity was always above 0. All together, the average group proximity describes the average of all 61 groups, as shown in Table 2.
Group proximity of the rankings.

Average group proximity of ranking 1 and 2
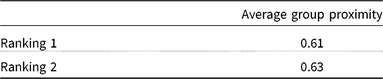
The average group proximity of ranking 1 is 0.61 and that of ranking 2 is 0.63. This shows that there is a positive proximity of a bit less than a full flip on average and that it was slightly higher in the second ranking.
Zooming in to subsets
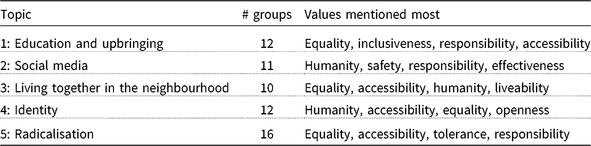
As shown in Table 3, the topics were quite evenly divided over the groups, except for Topic 5, which was the most discussed topic.
Most mentioned values per topic
By defining the average group proximity of both rankings and the average difference per topic, as shown in Table 4 and Figure 4, the overlap and differences between the topics can be described. The difference in group proximity between the two rankings was calculated by subtracting ranking 1 from ranking 2. These differences can be described in terms of the convergence or divergence of the rankings. A group that ranks in a convergent manner (a difference of more than 0) means that the group proximity increased after the values discussion: participants ranked the solutions more alike.
Average outcomes per topic

Group proximity difference per topic=(average group proximity ranking 2)–(average group proximity ranking 1).

For Topic 5 (Radicalisation), the ranking behaviour differed from the other topics in that there was relatively much convergence or unchanged rankings. For the three times that divergence did occur, it was a minor divergence (of between −0.083 and −0.056). Topic 3 (Living together in the neighbourhood), on the other hand, has 6 out of 10 groups that ranked in a divergent manner; nevertheless, divergence was small (between −0.16 and 0.04).
In Topic 4 (Identity), two groups were rather divergent (with differences of −0.33 and −0.28) compared with the other groups. Still, this is less than a flip different from ranking 1. Topic 1 (Education and upbringing) and Topic 2 (Social media) have rather similar differences between the rankings: with comparable numbers of convergent groups, both topics having two groups with unchanged rankings, and four divergent groups.
When the topics are compared with each other, the highest and the lowest group proximity per topic vary considerably: whereas Topic 1 (Identity) had for ranking 1 and ranking 2 an average of 0.52 and 0.53, respectively, Topic 3 (Living together in the neighbourhood) had 0.73 and 0.71, respectively. The average differences range from −0.02 (divergent; Topic 2: Social Media) to 0.06 (convergent; Topic 5: Radicalisation).
The four most discussed values, namely, equality, accessibility, humanity and responsibility, were discussed within each of the topics as shown in Table 3. Other values were more topic-specific: inclusiveness was often discussed within Topic 1 (Education and upbringing), safety and effectiveness within Topic 2 (Social media), liveability within Topic 3 (Living together in the neighbourhood), openness within Topic 4 (Identity) and tolerance within Topic 5 (Radicalisation). The values shown in Table 3 are the top four most discussed values per topic.
Group size
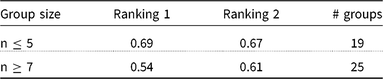
The average group size was six. Small groups are those that are smaller than average (three, four or five participants, with an average of 4.6 participants), while large groups are those that are larger than average (seven, eight or nine participants, with on average 7.5 participants). We leave out the groups of six to allow for a clear separation between the two different groups. There appears to be a difference between small and large groups: in small groups, the group proximity in both rankings is higher than in large groups.
In large groups, the value deliberation seems to have a clear impact, as shown in Table 5. In the next section, these results are discussed.
Average group proximity: small and large groups compared
Survey analysis
In the 380 complete surveys that were collected, participants indicated whether they had gained more understanding of the perspectives of others and whether their ideas had changed because of the value deliberation.
As shown in Table 6, 72% of the participants who completed the survey reported increased mutual understanding because of the value deliberation.
Combining insights on mutual understanding and group proximity – occurance in percentage

Content analysis of the questions
In addition to the rankings and surveys, the questions resulting from the Socratic dialogue were analysed. Since those questions served as the starting point for the values discussion, we analysed whether the questions are phrased in a way that could support the idea of working towards mutual understanding, or whether it amplifies differences between people. We searched for phrasing that represents connection (indicating inclusion) on the one hand and differences (indication exclusion) between groups on the other hand. “Connection” was found in 45 of the 61 questions, while “difference” was found in 3 questions.
In addition, we found that various questions had values embedded in them, including creativity, honesty, flexibility, equality, safety, trust, acceptance, respect, integrity, solidarity, openness, loving, variety and consciousness. Furthermore, the word “value” was used in the questions. A specific value, or the word “values” in general, was mentioned in 23 of the 61 questions.
Discussion
In this section, we reflect on the results of each proposition. Proposition 1 states that introducing group proximity makes group deliberations comparable. The results confirm this: the proximity measure gives each group three figures: group proximity of ranking 1, group proximity of ranking 2 and the difference of these two. In addition to knowing the group proximity of ranking 1 and ranking 2, the impact of the value deliberation can be measured and defined per group. By taking the difference between the two, for each group it can be clearly defined if its rankings diverged, stayed the same or converged after the values deliberation.
“Proposition 2: the topic of deliberation could influence the level of group proximity” is supported by the visible variations per topic regarding how the participants ranked and changed their rankings, as shown in Figure 5. This might, for example, be due to a variable willingness to come to a joint outcome, the degree of diversity in the backgrounds of the members of groups or the ability of group chairpersons to guide the process. For instance, Topic 5 (Radicalisation) was the most popular to chair; all groups for this topic were quickly assigned a chairperson. Another possible explanation is that each topic could attract different crowd. For example, “radicalisation” might attract different deliberators than “education and upbringing”. How they differ, and what caused the difference in groups needs further research.
Group proximity differences per topic.

Proposition 3 (Group size can influence the degree of group proximity) is also supported by the results. Small groups started off with higher group proximity compared with large groups. For small groups, this level of group proximity was largely maintained after the value deliberation. Larger groups ranked less alike in the baseline ranking and more alike after the value deliberation. The higher group proximity in the second ranking can be explained by a stronger need for a structured deliberation in larger groups to ensure that all participants are heard. The value deliberation process accounts for this structure. In small groups, the participants have more time to explain their reflections before the deliberation and during the deliberation, which could result in higher group proximity in both rankings.
Proposition 4 states that onsite impact can be defined by measuring group proximity and mutual understanding. Combining the two concepts indeed allows for analysis on which measures to take the next steps in the public policymaking process. As discussed in the background section, there were groups that ranked divergent and groups that ranked convergent, and there were also numerous groups that did not change their ranking, that were confirmed in their ideas. Furthermore, at the citizens’ summit, all groups had a positive groups proximity, still the degree of proximity differed per group. In addition, we collected data on to what extent participants understand each other better after the values deliberation. When these three measures are taken into account, an approach for the follow-up step per group can be taken more considerately. For example, in case of high group proximity in ranking 2, convergent rankings, together with an increased level of mutual understanding, the next step might be to work towards a decision on a policy. In the case of low group proximity and increased mutual understanding, more time could be needed for the current phase before a follow-up step is taken. With high group proximity in ranking 2 that has slightly diverged and an increased understanding, the next step could still be to work towards a decision on a policy. A group with low group proximity and clear divergent rankings, where participants did get a better understanding, could benefit from new stimuli, for example, formulating additional solutions that combine earlier defined solutions.
The degree of group proximity, the group proximity difference and mutual understanding can provide an onsite impact measurement that support the consideration of approaches for further steps for each group. Which approach is taken depends on the group proximity measures per group, the desired group proximity by the organisers and the available resources to take further steps.
Finally, Proposition 5 stated that the wording of the question that was formulated during the Socratic dialogue could impact the citizens’ summit. Each group deliberated on a question that had been formulated during the first part of the summit. A closer look at all the questions shows that the code “connection” appeared in most of the questions (45 out of 61), by phrasing the questions from a “we” perspective and using words such as connection, social cohesion, meet, contact and dialogue. Where differences were mentioned, in nearly all cases, they were used to emphasise that these needed to be bridged, for example, “How can we stimulate a connection between people who are different (…)?” The emphasis on connection in the questions, that is, in the phase before the value deliberation, is also reflected in the most identified values that were discussed later, namely, equality, accessibility, humanity and joint responsibility. These values seem to emphasise the search for connection between citizens, as opposed to values such as perseverance or weakness, which were mentioned only occasionally. Furthermore, the values seem to transcend the different topics: the values that were most often mentioned were discussed in each of the topics, which makes the topics and, therefore, the deliberations on the topics comparable.
Conclusion
This research explored the use of a rank correlation to define group proximity, a measure to establish how alike participants rank. The measure was applied to the data of 61 parallel deliberative groups during the citizens’ summit in Rotterdam, the Netherlands. The goal of the summit was to make citizens deliberate on how to keep the existing social stability in the city. As earlier described, Fung (Reference Fung2003) argues that such summits should represent diversity. For this reason, citizens were invited equally to spread over the neighbourhoods of Rotterdam, to have a dialogue with other citizens who might have perspectives that are different from their own. Fung further argued that there should be a willingness to listen, which is confirmed for this summit in the reported increase in mutual understanding. Next, the participants were guided by facilitators who were trained in the value deliberation methodology that used the identification and deliberation of values on the issue at stake as a common language. Using this methodology, the facilitators made sure all voices were heard.
We introduced the proximity measure to compare the groups and to define the impact of value deliberations, by comparing group proximity of a baseline ranking with a second ranking after the value deliberation had taken place. The use of the concept of group proximity enabled a precise comparison of how alike participants rank solutions in deliberative groups and enables a comparison per topic or based on group size. Furthermore, group proximity allows for a precise and systematic measure of the impact of value deliberations during citizen participation initiatives.
The comparison of the group proximity of the five topics showed clear differences as well as similarities. In addition, the degree of group proximity also varied between small and large groups: in small groups the group proximity was higher during both rankings than in large groups, and in large groups the value deliberation made a clear difference to the ranking.
The difference in group proximity of ranking 1 and ranking 2 showed if a group ranked convergent or divergent. As stated in the background section, both divergent and convergent rankings could be expected (Kallis et al. Reference Kallis, Videira, Antunes, Pereira, Spash, Coccossis, Quintana, del Moral, Hatzilacou, Lobo, Mexa, Paneque, Pedregal Mateos and Santos2006; Cruickshank and Evans Reference Cruickshank and Evans2012), and indeed occurred. In addition, there were numerous groups with unchanged group proximity. Combined with the increased mutual understanding, this measurement supports the idea of Dryzek and Niemeyer (Reference Dryzek and Niemeyer2006) and Fishkin (Reference Fishkin2011) that even if people do not rank solutions identically, they can still get an understanding of what is important.
The majority of the participants stated that their mutual understanding had increased after the value deliberation. The combination of group proximity with data on changes in mutual understanding can provide insights to define an approach for future steps within a group, to continue the public policymaking process. For instance, groups that had a divergent group proximity and increased understanding of each others’ perspectives might need a different approach than groups that had convergent group proximity and understood each other better.
Finally, the phrasing of questions that served as a starting point for the deliberation was analysed. We searched for codes that either emphasise mutual understanding or amplify the differences between people. We found words related to “connection” in 45 of the 61 questions, whereas words emphasising differences were found in only three questions. This content analysis stresses the participants’ search for connection during the summit and again underlines the statement of Dryzek and Niemeyer (Reference Dryzek and Niemeyer2006) on normative meta-consensus.
In this article, we demonstrated that the measurement of group proximity can contribute to the impact assessment of a citizens’ summit. Further investigation of the concept of group proximity in the context of citizen participation could include larger scale data collection through the facilitation of online deliberations, as well as the alignment with the follow-up steps in public policymaking.
Example: two half-flips.

Acknowledgements
The authors are grateful to the great efforts of Lokaal of setting up and organising the G1000; in particular, we want to thank Liesbeth Levy and Nienke van Wijk, for the fruitful collaboration. Furthermore, we thank the city of Rotterdam for enabling the G1000. We express our gratitude to Tim van Erven for providing statistical support. Finally, we thank the anonymous reviewers for their comments that sharpened the article and we thank Alexia Athanasopoulou for proofreading the manuscript. This work is part of the Values4Water project, subsidised by the research programme Responsible Innovation, which is (partly) financed by the Netherlands Organisation for Scientific Research (NWO) under Grant Number 313-99-316. Replication materials are available at https://doi.org/10.7910/DVN/LAKSVM
APPENDIX Appendix A: Calculating mean ranking and group proximity
The distance between two rankings can be measured by counting the minimum number of times that the order of two solutions has to be flipped in order to transform one ranking into another. This is known as Kendall’s distance (Emond and Mason Reference Emond and Mason2002).
With the proposed value deliberation process, ties are not possible in the individual rankings, since participants have to rank each solution from most preferable to least preferable. However, ties can occur in the median ranking of a group, so a method is required that is able to work with ties. Kendall also proposed a way to extend this distance to handle rankings with ties, in which two solutions are ranked equally high. However, when Kendall’s tau is used to compare the all-options-tied ranking to any other ranking, it gives 0/0, which is not defined, as shown by Emond and Mason (Reference Emond and Mason2002). They further show that the median ranking for Kendall’s tau changes in an undesirable way when adding an irrelevant option that all rankers agree is their last choice, and that the measure 1−τ does not satisfy the mathematical properties of a distance metric.
The Spearman correlation is a commonly used rank correlation, but it has problems when comparing rankings that have ties. For example, like Kendall’s tau, the Spearman correlation is not defined when comparing the all-options-tied ranking to any other ranking.
Kemeny (Reference Kemeny1959) has an axiomatic approach to this distance measure. They state that the way we measure the distance between two rankings should be based on four conditions:
-
1. It must satisfy the basic mathematical requirements of a distance;
-
2. It should not be affected by a re-labelling of the solutions (whether we call one option A and another B, or vice versa, should not matter);
-
3. If two rankings agree on the solution that is most preferred, then their distance should be the same as their distance with this most preferred solution omitted, and likewise if they agree on the solution that is least preferred. For instance, the distance between ranking A, B, C, D and ranking A, C, B, D should be equal to the distance between the rankings B, C and C, B, because A is the most preferred and D is the least preferred by both rankings.
-
4. The minimum positive distance is 1, so a distance cannot be between 0 and 1.
The median ranking for a group can be defined as the ranking with the smallest average distance to the rankings of the participants in the group (Emond and Mason Reference Emond and Mason2002).
Although it is not obvious which distance measure would meet all of Kemeny’s requirements for rankings that may include ties, or even that such a distance exists, Kemeny and Snell show that there is one such distance (Kemeny and Snell Reference Kemeny and Snell1972), namely the Kemeny–Snell distance. We, therefore, base our calculations on the Kemeny–Snell distance to measure whether the order of preferences after the deliberation process has become more similar. The Kemeny–Snell distance can be used to calculate the proximity of an individual ranking to a median ranking.
Compared to Kendall’s tau, 1−τ x for τ x the Kemeny–Snell correlation is a distance metric in the mathematical sense. Consequently, we may interpret the median ranking based on the Kemeny–Snell correlation as a kind of median of the group rankings, whereas no such interpretation is available for the median ranking based on Kendall’s tau.
The proximity is calculated as follows. The Kemeny–Snell distance is the smallest number of half-flips that are needed to change one ranking (1) into another (2). We need this to be able to measure the proximity of an individual ranking (1) to a median ranking (2).
A half-flip makes a tie of two options that are subsequent in the ranking. For example, as depicted in Figure 6, the ranking A, B, C, D is turned into A, B/C, D with a half-flip, where B/C indicates that there is a tie between B and C. Two half-flips are needed to take a full flip, that is, to switch a solution from one place on a ranking. Here we count two half-flips (arrows).
Since we are searching for correlation of the rankings in this research, the Kemeny–Snell distance is used to calculate rank correlation. The group proximity is the average proximity to the median ranking and is calculated from the average rank correlation τ x (Emond and Mason Reference Emond and Mason2002), by computing
 $$1 - \left( {x/6} \right)$$
where x is the number of half-flips. The maximum Kemeny–Snell distance in full flips is 12, when ranking 4 options, as is the case at the summit. Since correlations are defined between −1 and +1, the Kemeny–Snell distance needs to be scaled to comply with this range in order to become a correlation. Turning a distance measure into correlation is a common mathematical concept. The maximum Kemeny–Snell distance between four options is 4*(4–1)=12. So to translate the distance into a correlation, we first divide the Kemeny–Snell distance by 12, after which the distance is expressed in a figure between 0 and 1. We then multiply it by 2, to scale it to the range of 0–2. Then we take 1–x/6 to get a figure of between −1 and +1.
Two half-flips are equal to one full flip. If in a group each participant needs one full flip to arrive at the median ranking, the group proximity would be
 $$1 - \left( {2/6} \right) = 0.66$$
In other words, a group proximity of 0.66 means that everyone in the group would have to flip (on average) one of their solutions to reach a median ranking. For more information on τ x , we refer to Emond and Mason (Reference Emond and Mason2002).
Appendix B: survey
This is the survey that was distributed at the end of the deliberation.
-
1. What was your group number today?
-
2. Did you think the process in the afternoon was clear (Please circle your answer)?
-
1. Very clear
-
2. Clear
-
3. Not clear, but also not unclear
-
4. Unclear
-
5. Very unclear
-
-
3. Did you think the process was useful (Please circle your answer)?
-
1. Very useful
-
2. Useful
-
3. Neutral
-
4. Not useful
-
5. Not at all useful
-
-
4. Did your ideas change after discussing the values? (Please circle your answer)?
Yes No
-
5. Did you gain more understanding of the perspectives of others during the process in the afternoon (Please circle your answer)?
-
1. A lot more understanding
-
2. More understanding
-
3. No difference
-
4. Less understanding
-
5. Much less understanding
-


 Open access

