

In life, loss provokes a search for meaning. In politics, loss of office can signal the end of a career and much contemplation. To take some examples, one Canadian legislator of the Liberal Party confessed about his recent seat loss: “It just ends. It’s over. It’s death” (Shaffir and Kleinknecht Reference Shaffir and Kleinknecht2005, 708). A defeated British MP spoke of the “trauma of rejection” and how his defeat triggered depression (Opik Reference Opik2015). Among defeated presidential candidates in America, Bob Dole, Republican nominee in 1996, said he would lie “awake at night wondering what he could have done to change the outcome” (Dole Reference Dole2012). Meanwhile, Hillary Rodham Clinton (HRC), the Democratic challenger in 2016, admitted about her loss that “there are times when all I want to do is scream into a pillow” (Clinton Reference Clinton2017, xiii). The message: Political loss hurts.
Ethnographic literature exists on how political losers cope with this new outsider status, or role exit, as sociologists refer to it (Fuchs-Ebaugh Reference Fuchs-Ebaugh and Rose1988; Ashworth and Bueno de Mesquita Reference Ashworth and Bueno de Mesquita2008; Drahota and Eitzen Reference Drahota and Eitzen1998). While much research has examined voter’s reactions to their favored party losing (Nadeau and Blais Reference Nadeau and Blais1993; Moehler Reference Moehler2009; Anderson and Tverdova 2001; Craig et al. Reference Craig, Martinez, Gainous and Kane2006), political science’s focus on the losers themselves remains scant. A handful of studies explore what defeated and retired politicians go on to do (Byrne and Theakston 2016; Theakston and deVries Reference Theakston and deVries2012; Roberts Reference Roberts2015), yet there is little systematic exploration of the loss itself from the loser’s perspective, a crucial gap. As noted scholar Ken Shepsle opined: “not enough attention is given to losers. We teach and write political history by focusing on the winners” (Shepsle Reference Shepsle2003, 312). We agree with Shepsle (and Riker before him) that much may be gleaned from the thoughts of defeated candidates (Riker Reference Riker1986). Hence, our contribution sets out to attend to the reasons put forward by Hillary Rodham Clinton (HRC) for her 2016 U.S. presidential loss.
What can we learn from the writings of candidates who lost, specifically from the loser of the 2016 contest? This election was remarkable on many fronts, prompting one broadcaster to proclaim, “the political science books are going to be rewritten” (Scott Pelly on “CBS News Election Night Coverage”, 2016). HRC became the first female candidate nominated for the American presidency by one of the two major parties. Moreover, a controversial businessman, who had never held elected office and ran a renegade campaign, defeated a political veteran, against pundit expectations. Hence, exploring Campaign 2016 from the vantage of HRC offers a novel prism into a historical and unprecedented campaign. However, our original focus offers broader insights. Losing candidates often go on to be party grandees. As Shepsle observes, a losing candidate “invents new dimensions of political conflict and controversy, or reframes old dimensions . . . They are the ones driven by their despair to seek ways to triumph: they are, therefore, the inventors” (Shepsle Reference Shepsle2003, 310). Hence, as they can transform political competition, we can gain a lot from studying their thoughts about loss. In her recent biography, HRC stresses that this “is an important discussion to have. It’s not only about the past—not by a long shot . . . . And Democrats are engaged in a vital debate about the future of our party, which turns in no small part on the question of what went wrong in 2016 and how to fix it” (Clinton Reference Clinton2017, 392–393). Another relevant point concerns whether losing candidates accurately identify the reasons for their defeat. Do they put on rose-colored glasses? Such an inability to grasp the “why” of failure could result in parties and candidates repeating the same mistakes. In essence, we attempt to show whether a defeated candidate “gets it.”
Examining candidate explanations of defeat, we note that losers often ascribe their failure to specific campaign events. For instance, John Kerry mused that his 2004 loss to George W. Bush came partly from the release of a Bin Laden tape days before the election. To Kerry, it encouraged voters “not to shift horses in midstream” (BBC News 2005; Fox News 2004). Former vice president Dan Quayle, of the 1992 Republican ticket, said: “We firmly believe that Perot cost the Republican Party the White House” (Quayle Reference Quayle2010). In Britain, Labor’s Neil Kinnock, reflecting on his infamous cheering at a Rally in 1992, says it destroyed “all of the years in which I’d attempted to sort of build a fairly reserved, starchy persona—for a few seconds they all slipped away” (“Labor: The Wilderness Years”, BBC 1995). He went on to hint that it cost his party votes. This importance ascribed to campaign events builds on the consensus in political science that campaigns can matter. However, the extent of that influence is still a matter of contention (Johnston, Hagen, and Jamieson Reference Johnston, Hagen and Hall Jamieson2004; Farrell and Schmitt-Beck Reference Farrell and Schmitt-Beck2002; Kenski, Hardy, and Jamieson Reference Kenski, Hardy and Hall Jamieson2010). Thus, examining the views of a losing candidate allows us to add to the debate regarding campaign effects.
In her memoir What Happened, HRC tries to explain why she unexpectedly lost. Using ample illustrations of this commentary, we translate these assumptions into testable propositions which we call the Hillary Hypotheses (HH). While HRC herself is not a political scientist, she shows scientific instinct, setting out precise reasons for her defeat. To test the Hillary Hypotheses, we follow her cue, using what she calls “the gold standard” American National Election Studies (ANES) (Clinton Reference Clinton2017, 412; ANES 2017). In addition to her stamp of approval, the ANES offers an objective and comprehensive baseline. Our paper unfolds under different topic headings: Partisanship, the Democratic Base, Cultural Anxiety, Economics, Gender and Personality, and the Campaign.
We first address our research strategy and the complicated task of translating narrative into hypotheses. We then move on to the analysis, beginning each section by offering hypotheses and quotations from the book that generated them. Then, we cross-reference HRC’s observations with relevant political science literature, along with testing the suppositions statistically. Having considered the propositions individually, we move to evaluate the relative importance of each by estimating a well-specified multivariate model. We conclude with an assessment of the overall accuracy of her perceptions, and what they can tell us about the 2016 election and candidate views of loss.
Research Strategy
Our ability to test a losing candidate’s perceptions depends on the account they provide. Many contenders do not go on the record. Others give media interviews, while some, like HRC, resort to a memoir. Memoirs require us to assess their credibility: is it ego-driven and merely an attempt to settle scores? What role for the ghostwriter? What Happened is unusual in that unlike many defeated candidates, HRC shoulders some personal blame, conceding “I couldn’t get the job done, and I’ll have to live with that for rest of my life” (Clinton Reference Clinton2017, xii). She admits: “I’ve tried to learn from my own mistakes. There are plenty, as you’ll see in this book, and they are mine and mine alone” (ibid.) It suggests the memoir is authentic.
Regarding the ghostwriting, it is ethically anathema in most academic research (PLoS Medicine Editors 2009; Leo, Lacasse, and Cimino Reference Leo, Lacasse and Cimino2011; Lacasse and Leo Reference Lacasse and Leo.2010; Moffatt and Elliot Reference Moffatt and Elliot2007). Among political actors though, ghostwriting is common. For example, former president John Kennedy’s Profiles in Courage was ghosted by his advisor Ted Sorenson (Sorenson Reference Sorenson2008). Former president Ronald Reagan was more upfront about his use of a biographer for An American Life, quipping: “I hear it’s terrific. Maybe someday I’ll read it” (Troy Reference Troy2014). While the ethics of this practice are debated elsewhere (Brandt Reference Brandt2007; Auer Reference Auer1984; Bormann Reference Bormann1961, Reference Bormann1984; Haiman Reference Haiman1984), research suggests that the public is aware that politicians turn to ghostwriters (Riley and Brown Reference Riley and Brown1996). After all, many advisors have written about their experiences of ghosting for high profile politicians (Frum Reference Frum2003; Noonan Reference Noonan1985; Sorenson Reference Sorenson2008).
HRC acknowledges she had help, noting: “What Happened wouldn’t have happened without the help and support of another great team . . . This starts with Dan SchwerinFootnote 1, Megan RooneyFootnote 1, and Tony CarrkFootnote 1, who spent many hours with me around my kitchen table in Chappaqua” (Clinton Reference Clinton2017, 466). While we cannot be definitive as to how much HRC herself wrote, we take this hands-on involvement at face value. More importantly, however, for our study is whether the words represent HRC’s genuine view. As Deborah Brandt’s study of ghostwriting observes: “the politicians’ status brings status to the writing; they are connected to it by name . . . words are made significant not by having been written but by the status of the official issuer” (Brandt Reference Brandt2007, 550). Thus, in evaluating What Happened, the crucial thing is whether HRC owns the account. In the book itself, HRC flatly declares: “This is my story of what happened. It is the story of what I saw, felt, and thought during two of the most intense years I’ve ever experienced” (Clinton Reference Clinton2017, xi). If these are not always her direct words, HRC gives them unquestioned status.
We are engaging in an unorthodox task, at least for most political scientists. We translate narrative—by its nature long, discursive, sometimes unclear—into stated hypotheses fit for quantitative testing. Based on the memoir, we identified sixteen reasons, encompassing six themes. While some may appear trite to political scientists, we need to remember that HRC does not claim to be a political scientist (nor are her assistants). Our overriding goal reduces to analyzing the election from her prism, including instances when she highlights dimensions that are the prevailing narrative for political scientists.
Our data comes from the ANES, primarily its 2016 study.Footnote 2 Importantly, the 2016 data measure the respondents’ attitudes before and after the election, enabling us to capture campaign dynamics. While these superior data do not allow us to delve into claims of Russian interference in the election (Clinton Reference Clinton2017, chap. “Trolls, Bots, Fake News, and Real Russians”; 423), voter suppression (418–20), or whether Democrats' quest for a third successive term in the White House was a cause (409), they do allow us to test thirteen of HRC’s hypotheses.
Our analysis takes place at the level of the individual voter. We know that HRC received 48.2% of the total popular vote but failed to capture the Electoral College (losing 306 to 232).Footnote 3 Thus, in our assessments of voter behavior, we try to locate variables that likely moved her support up or down and accordingly changed the outcome. These counterfactuals, while not occurring, can nevertheless enlighten us as to the causes of the HRC defeat.
Partisanship: The Elephant in the Room
Hillary Hypothesis (HH) 1: Republican partisans were more likely to vote for Donald Trump (DT) in the 2016 election.
HRC believes that: “probably the biggest factor pushing Trump skeptics into his camp was pure partisanship” (Clinton Reference Clinton2017, 408). She becomes even more emphatic: “The R next to [Trump’s] name was more important than anything else” (ibid.). In this belief, she concurs with a political science axiom: those who identify with a political party are likely to vote for that party or a candidate standing for it (Campbell et al. Reference Campbell, Converse, Miller and Stokes1960; Lewis-Beck, et al. Reference Lewis-Beck, Jacoby, Norporth and Weisberg2008). However, we should not lose sight of the fact that HRC is not an academic, and despite the conventional wisdom that America is exceptionally polarized, this insight is still notable from a non-academic who may not be saturated by the concept of party identification.
Surveying the evidence, we see that most voters identified with one of the two main parties, Democrats having a lead over Republicans (49% to 42%—refer to table C1 in the online appendix). This Democratic advantage has held in every presidential election since 1952 (Lewis-Beck et al. Reference Lewis-Beck, Jacoby, Norporth and Weisberg2008). If voting strictly followed party lines, the Democratic candidate would almost always win. Of course, we know that party identification, though powerful, cannot in itself guarantee candidate success.
The bivariate relationship between partisanship and reported vote is strong. We see that 87% of Democratic identifiers voted for HRC, while 86% of Republican identifiers voted for Donald Trump (DT), confirming HRC’s assertion (refer to figure C1 in the online appendix). The defection rates are interesting: both candidates had about the same percentage of defectors—8%. Put another way, the Republicans stayed with DT, as much as Democrats did with HRC. As HRC sensed, Republican partisanship prevented many voters from casting a vote for her because she was a Democrat. Thus, there is support for HH1. In appreciation of its strength, we look at HRC’s other assertions by controlling for partisanship statistically.
The Democratic Base
HH2a: Midwestern voters were not less likely to vote for HRC.
HH2b: Midwestern voters were not mobilized less by the HRC campaign.
HH2c: Democrat partisans and primary voters were as likely to vote for HRC as previous Democratic candidates.
HH2d: Working-class voters were not less likely to vote for HRC.
Accusations dogged HRC that her campaign failed to appeal to the Democratic base: Midwestern states, the working class, and progressives, as represented by Bernie Sanders. The Midwestern supposition is simple: HRC failed to attract the expected support from states like Michigan, Pennsylvania, and Wisconsin, all carried by Democrats in the previous six presidential elections. On its face, it seems plausible.
However, HRC rejects the Midwest critique. She declares: “Some critics have said that everything hinged on me not campaigning enough in Midwest . . . . But let’s set the record straight. We always knew that the industrial Midwest was crucial to our success, just as it had been for Democrats for decades, and contrary to the popular narrative, we didn’t ignore these states” (Clinton Reference Clinton2017, 394). For instance, she insists she invested more resources in Michigan and Pennsylvania than the 2012 Obama campaign and that her team campaigned heavily in the region (ibid. 394-398). She concludes that her problem was not lack of mobilization in the Midwest and that voters there were not exceptional.
This discussion highlights the idea of a regional voting dimension to American presidential elections, and the necessity for campaigns to mobilize supporters to win, all of which is familiar to scholars (D.P. Green and Gerber Reference Green and Gerber2008; Lewis-Beck and Bargan Reference Lewis-Beck, Bargan., Sisson, Zacher and Cayton2006; Robinson and Noriega Reference Robinson and Noriega2010; Lewis-Beck et al. Reference Lewis-Beck, Jacoby, Norporth and Weisberg2008, 137, 151–55). So was the Midwest exceptional and the root of HRC’s problems? Let us examine how Midwesterners reported their vote in the ANES (refer to table C2 in the online appendix).Footnote 4 We found that fewer Midwest voters (41%) reported voting for HRC compared to non-Midwesterners (50%; refer to table C2 in the online appendix), but the difference becomes statistically insignificant when partisanship is considered (refer to table C3 in the online appendix). So, Midwest voters were not all that exceptional in their support for either candidate, when compared to the rest of the country and once we factor in partisanship.Footnote 5
Moreover, Midwesterns were more likely to say they were contacted by the Democratic party, compared to the rest of the country (32% to 26%, respectively; refer to table C4 in the online appendix). To the extent that HRC failed in the Midwest, it does not come from lack of campaign mobilization; she and her people were there. In sum, Midwesterners were not exceptional in 2016 vis-à-vis the rest of the country, offering support to HH2a and HH2b.
Another criticism of the HRC campaign claims she failed to get the working class and progressives. She addresses this critique in different ways. She highlights trips she made to “coal country” (Clinton 2017, chap. “Country Roads”). Moreover, while she acknowledges trouble in connecting with the white working class, she maintains this was a decades-old problem for Democrats (ibid., 273). She rejects criticisms from progressives that these voters have turned away from Democrats because of the party’s embrace of Wall Street (ibid., 276). She also dismisses the idea “some supporters of Bernie Sanders have argued that if I had veered further left and run a more populist campaign, we would have done better in the Rustbelt. I don’t believe it” (ibid., 411). Finally, she takes issue with the idea that “Trump was the tribune of the working class while I was the candidate of the elites” (ibid., 410). She contends that income differences show lower income voters supported her (ibid.). In sum, HRC believes voters who traditionally have voted Democratic stuck with her, hence HH2c and HH2d.
To test this, we first return to the partisanship measure. We know that 87% of Democrats voted for HRC in 2016. The top-left quadrant of figure 1 shows that this haul was somewhat fewer than for Barack Obama or John Kerry. However, HRC obtained the same proportion of Democrat support as her husband in 1996 and as Al Gore in 2000, and a little more than Mike Dukakis in 1988, and significantly more than Bill Clinton in his 1992 victory. This comparative evidence does not support the conclusion that most Democrats did not stick with her.
Support for HRC in the 2016 presidential election among the traditional Democratic base
Source: ANES 2017; ANES Times Series Cumulative Data File 2017; ANES 1992 Time Series Study (1993) and ANES 2008 Time Series Study (2015).
Notes: Data in the bottom-left quadrant may not sum to 100 due to rounding. Predicted probability estimates for bottom-right quadrant generated from model detailed in the online appendix in table C5. Diamonds represent the point estimates and the horizontal lines represent 95% confidence intervals.
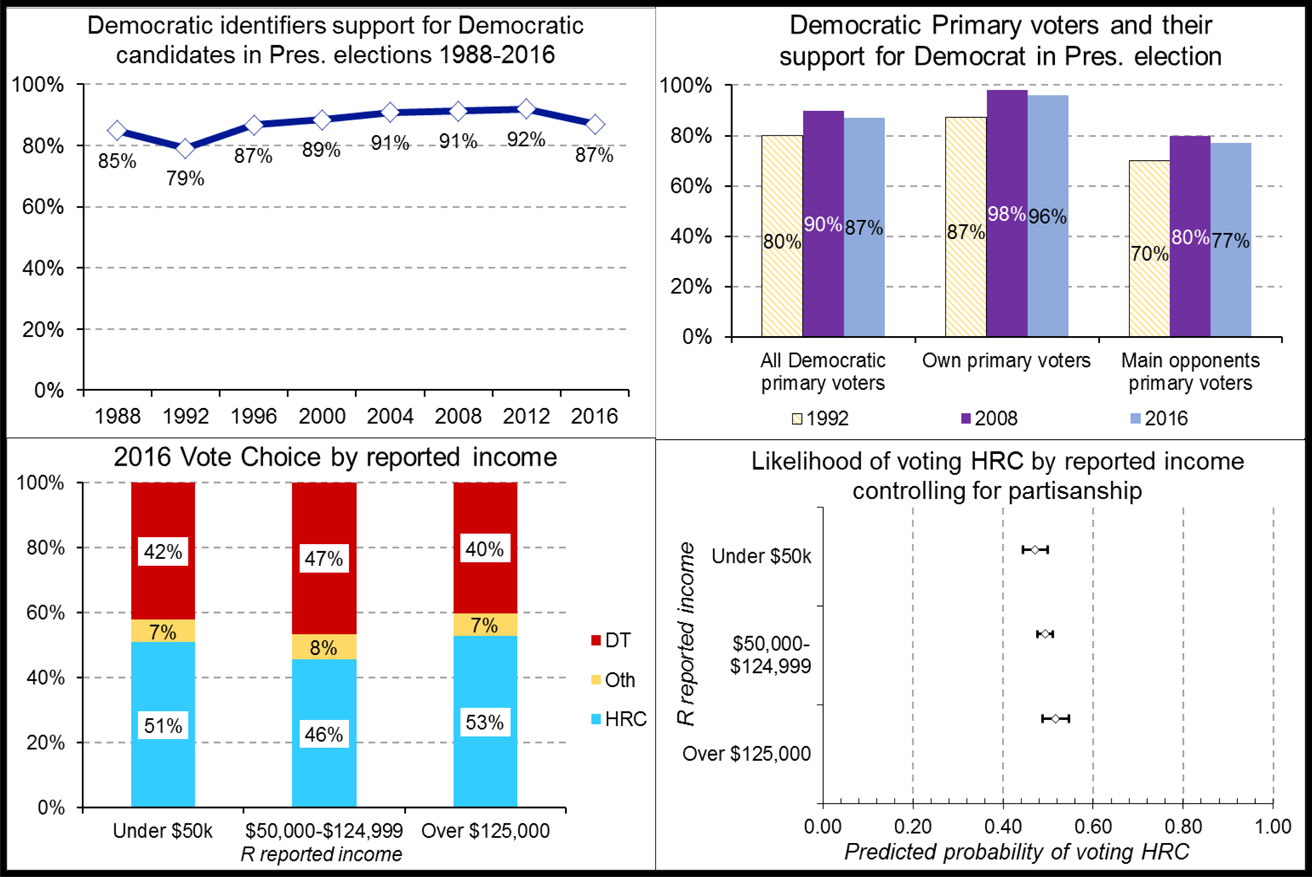
Further evidence comes from examining how well HRC attracted Democratic primary voters.Footnote 6 The top-right quadrant of figure 1 shows that HRC obtained the votes of 87% of Democratic primary voters overall, suggesting that progressives stuck with her. Similar to the Obama retention rate in 2008, it is even more than Bill Clinton took in 1992. Also, we see that HRC retained nearly all of those voters who supported her in the primary (95%), similar to Obama in 2008 and again more than her husband in 1992. Interestingly, she got 77% of Bernie Sanders supporters, a share similar to the HRC supporters that said they voted for Barack Obama in 2008, and far more than the proportion of Jerry Brown supporters who voted for Bill Clinton in 1992. Taken together, HRC appears correct: she got most of the Sanders vote and as many Democrat primary participants as could be expected.
Turning to class (as measured by income), the idea that it influences vote choice has been widely recognized in the voting literature, although debate exists about the effect size (Evans and Tilley Reference Evans and Tilley2017; Stonecash and Mariani Reference Stonecash and Mariani2000; Lewis-Beck et al. Reference Lewis-Beck, Jacoby, Norporth and Weisberg2008, chap. 12). The traditional expectation says that lower-income voters are more likely to support the Democrats (Lewis-Beck, et al. Reference Lewis-Beck, Jacoby, Norporth and Weisberg2008, 341–43). To investigate this, we explore how voters who earn different amounts voted. We categorize income into three groups: “lower” (those who earn under $50,000), “middle” ($50,000 to $124,999) and “upper” ($125,000 and above). As the bottom-left quadrant of figure 1 shows, HRC gets slightly more than half of the lower income group (51%). Among the middle group, she gets 46%. Then, for the upper-income group, she gets 53%. Thus, HRC gets slightly more votes among the lower income group, implying support for her argument, although the pattern is statistically insignificant (p=0.196). Controlling for partisanship, this pattern remains (p=0.52; refer to table C5 in the online appendix), with income not influencing the likelihood of voting for either candidate (refer to the bottom-right quadrant of figure 1).
In sum, we conclude that Midwest voters were not exceptional in their response, and were with her as she expected (so supporting HH2a and HH2b). Further, the Democratic partisans in general, and Democratic Progressives, in particular, were with her (so supporting HH2c). Finally, the working class were not against her, when compared to other classes (so supporting HH2d). However, the acceptance of that last hypothesis appears something of a hollow victory, since the working class were not really “for her” either, given the essentially equal support coming from the lower and upper-income groups.
Cultural Anxiety: Anger at Immigrants and Minorities
HH3a: Voters who had negative attitudes toward blacks and Hispanics were less likely to vote for HRC.
HH3b: Voters who had negative attitudes about immigrants were less likely to vote for HRC.
HRC gives significant attention to what might be termed cultural issues, conceptualized in the form of race, ethnicity, and immigration. She says that “voters were worried about people of color—especially blacks, Mexicans, and Muslims—threatening their way of life” (Clinton Reference Clinton2017, 413–14). HRC believes hostility towards President Obama partly drove this. She notes that “racial attitudes aren’t static and they don’t exist in a vacuum” (ibid., 414) and cites academic Chris Parker’s observation that “every period of racial progress in this country is followed by a period of retrenchment. That’s what the 2016 election was about” (ibid.) She acknowledges that because she “spoke positively throughout the campaign about racial justice, immigration, and Muslims” (ibid., 415)—“some white voters may have decided I wasn’t on their side” (ibid.). She concludes that “anger at immigrants and other minorities for cutting in line and getting more than their fair share” drove voters away from her (ibid., 416).
The weight HRC gives these issues comes as no surprise. After all, these subjects were clarion calls for DT’s campaign. Scholars will recognize that they fit into a broader strand of literature highlighting “culture wars.” Recently, this has manifested itself among American voters via subjects like abortion and religious observance (Abramowitz Reference Abramowitz1995; Howell and Sims Reference Howell and Sims.1993; Layman and Carmines Reference Layman and Carmines1997; J.C. Green and Guth Reference Green and Guth1991). However, with changing demographics, current research suggests that sentiments towards immigration and racial change are becoming more prominent in voters’ calculus (Hajnal and Rivera Reference Hajnal and Rivera2014).
We test HRC’s belief that attitudes towards minorities played their role by exploring voters’ feelings towards the African American and Hispanic communities. To tap such sentiments, we turn to two questions in the ANES asking people about whether they think blacks and Hispanics are “hardworking or lazy” and “peaceful or violent.” We combine responses (using principal components analysis; refer to online appendix B) into two scales, one measuring attitudes to blacks and the other to Hispanics (the higher the scale score, the more hostile).
Looking at the distributions (refer to tables C6 and C7 in the online appendix), we see greater negativity towards blacks than Hispanics. The scale scores show 36% of ANES 2016 respondents openly expressed negative attitudes toward African Americans. For Hispanics, the comparable rating is 10%. How does this break down in voting terms? Figure 2 shows that voters who harbor these negative attitudes towards both minorities appear distinctly less likely to support HRC. In the top-left quadrant, this relationship seems especially pronounced among those who are hostile to blacks. For example, among those most hostile, HRC garners 30% of the vote. Among those least hostile, she gets 73%. For Hispanics (refer to the bottom-left quadrant of figure 2), such a dramatic effect only occurs at the highest level of resentment, HRC garnering 57% of that vote, compared to 43% among those most hostile. Even taking into account partisanship (refer to the top-right quadrant of figure 2), attitudes towards blacks remains a robust predictor of HRC support. The likelihood of voting HRC rises by about sixteen points, as the hostility scale on perceptions of the African American community goes from maximum hostility to minimum hostility. The relationship for Hispanics takes a similar direction but is lower with an eight-point difference (refer to the bottom-right quadrant of figure 2). In sum, these results certainly support the HRC view that antipathy towards the black and Hispanic communities (HH3a) cost her votes.
Support for HRC in the 2016 presidential election by attitudes to minorities
Base: Voters only.
Source: ANES 2017.
Notes: Data in the top-left and the bottom-left quadrants may not sum to 100 due to rounding. Predicted probability estimates for top-right quadrant and bottom-right quadrant generated from models detailed in the online appendix in table C8. Diamonds represent the point estimates and the horizontal lines represent 95% confidence intervals.
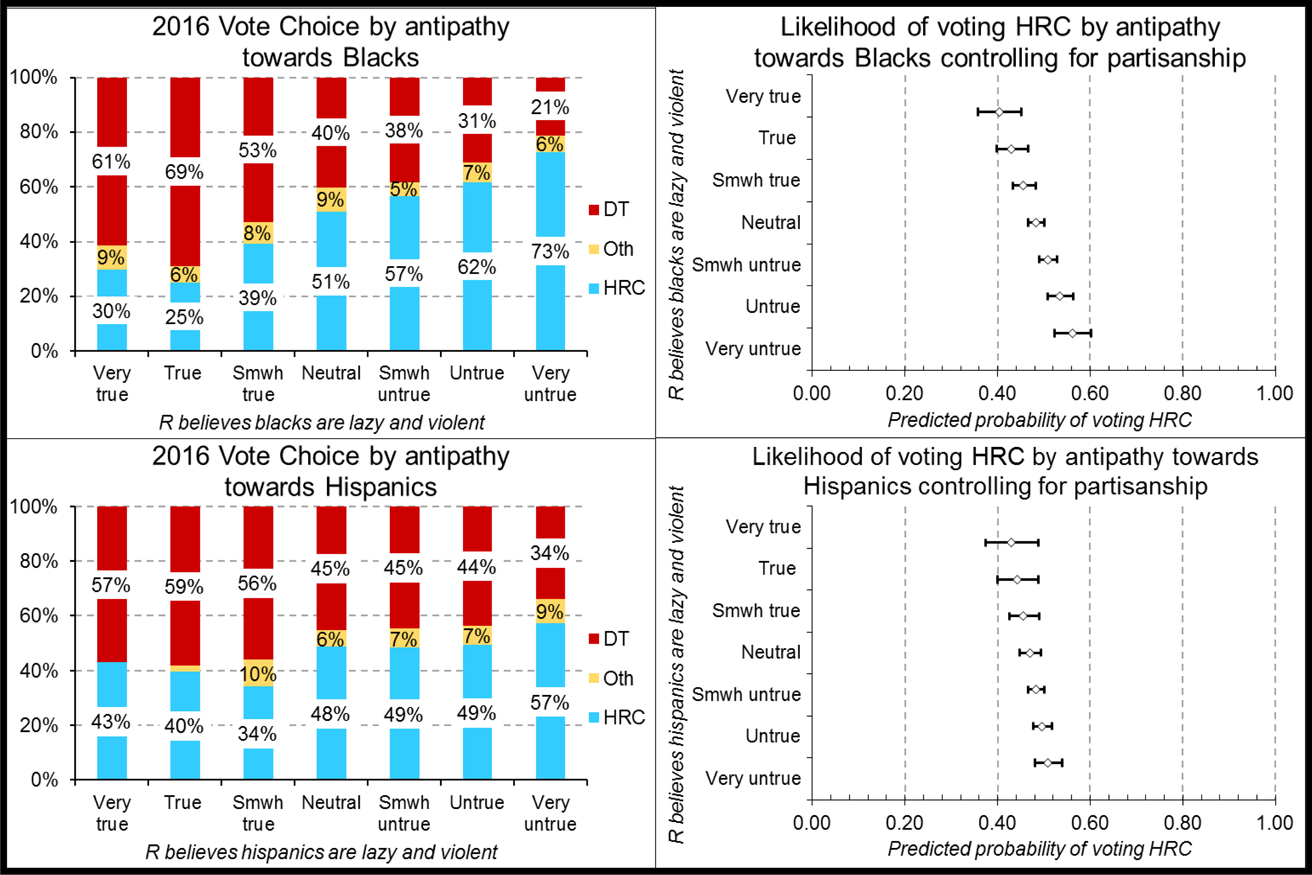
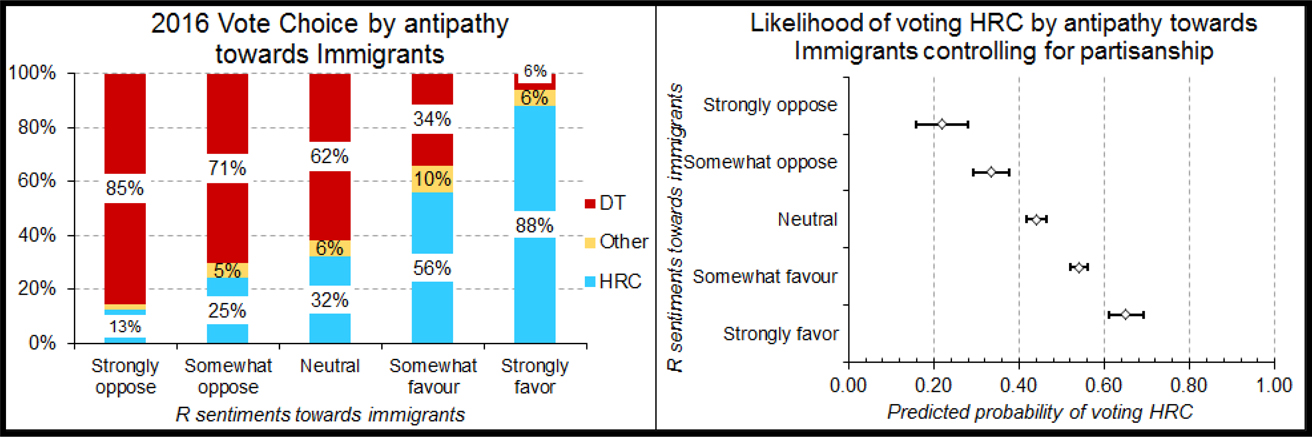
Turning to HRC’s claims on immigration, we again analyze (via principal components) three five-point Likert agreement/disagreement scales tapping attitudes to immigrants:
1) “Immigrants are generally good for COUNTRY’s economy”,
2) “America’s culture is generally harmed by immigrants”, and
3) “Immigrants increase crime rates.”
The higher a respondent’s score on the index, the more hostile they are to immigrants. Most voters are not hostile towards immigrants, with just over 50% expressing positive sentiments (refer to table C9 in the online appendix). A sizeable proportion (33%) have a neutral position, while 17% exhibit elements of hostility. Looking at the relationship with the vote, figure 3 (left side) shows a strong correlation. Among voters positively disposed towards immigrants, 88% report voting for HRC, while among those with strongly negative views, she only garnered 13% of their vote. Controlling for partisanship (figure 3, right side), the relationship decreases but still exhibits strength, with the likelihood of supporting HRC increasing by 43 points if we compare the probability of the most anti-immigrant supporting her (0.22) to the most pro-immigrant (0.65). Thus, attitudes to immigrants also mattered to vote choice, as HH3b posits.
Support for HRC in the 2016 presidential election by attitudes to immigrants
Base: Voters only.
Source: ANES 2017.
Notes: Data in the left segment may not sum to 100 due to rounding. Predicted probability estimates for the right segment generated from model detailed in the online appendix in table C10. Diamonds represent the point estimates and the horizontal lines represent 95% confidence intervals.
It’s the Economy, Stupid!
HH4a: Voters with more favorable views of the economy were more likely to vote for HRC.
HH4b: Voters who favored free trade were more likely to vote for HRC.
HRC assumed economic opinions mattered in 2016. However, she dismisses claims that “I lost because I didn’t have an economic message” (Clinton Reference Clinton2017, 395-396) or that had she embraced the economic message of her primary opponent Bernie Sanders she would have done better (ibid., 411). Instead, HRC says, “the story on the economy is a lot more nuanced than the post-election narrative would have you believe” (ibid., 410-411). She articulates that there were multiple strands to the issue, from voter anxiety over “the decline of manufacturing jobs” (ibid., 416) to concerns regarding voters getting “their fair share” (ibid., 416). She concludes that while economics was important, concerns should not be “overstated,” and that the issue worked in her favor (ibid., 411).
In articulating the view that the economy shapes vote choice, HRC concurs with scores of research that has found voter perceptions of economic performance (Lewis-Beck Reference Lewis-Beck1990; Lewis-Beck Reference Lewis-Beck1988; Lewis-Beck and Paldam Reference Lewis-Beck and Paldam2000; Lewis-Beck and Stegmaier Reference Lewis-Beck and Stegmaier.2000; Lewis-Beck et al. Reference Lewis-Beck, Jacoby, Norporth and Weisberg2008, chap. 13) and their attitudes to economic policy (Costa-Lobo Reference Costa-Lobo2013; Lewis-Beck, Nadeau, and Foucault Reference Lewis-Beck, Martini and Roderick Kiewet2013; Stubager, Lewis-Beck, and Nadeau Reference Stubager, Lewis-Beck and Nadeau2013; Lewis-Beck and Nadeau Reference Lewis-Beck and Nadeau.2011) influence whom they vote for. Accordingly, for some political scientists, an economic vote may seem indubitable, although the potency of the economic vote is challenged by some scholars (Evans and Anderson Reference Evans and Anderson2006). Nonetheless, as we noted earlier, HRC is not a political scientist. Moreover, her premise regarding the 2016 economic vote challenges a commonly held view, and thus merits analysis.
While we cannot address all the nuances that HRC identifies, voter perceptions of the economy gives us the “big picture” answer. If, as HRC assumes, economics worked for her, we would expect to see voters who thought the economy was improving would support her more, hence HH4a (Clinton Reference Clinton2017, 411). The standard survey item asks voters whether they believe the nation’s economy has gotten better, worse, or stayed the same in the past year. Voters were split on the economy: About three in ten thought it had gotten better and nearly as many thought it had gotten worse (27%) with the remainder opting for the neutral category (refer to table C11 in the online appendix). Voters who saw the economy performing better as compared to worse were more likely to support her candidacy (refer to the top-left quadrant of figure C2 in the online appendix). We see that HRC and DT split the voters in the neutral category (the modal response to economic performance). Moreover, when we control for partisanship (refer to the top-right quadrant of figure C2 in the online appendix), the relationship holds. Its overall strength, as measured by percentage differences, suggests that HRC fared about the same as recent predecessors (Lewis-Beck et al. Reference Lewis-Beck, Jacoby, Norporth and Weisberg2008, 373). We find support for HH4A.
The other economic argument throughout Campaign 2016 was that globalization was threatening the industrial workforce. To tap this, we looked at the ANES positional economics question on the hot-button issue of free trade, a position HRC clung to, and DT rallied against. The HRC assumption is that her position on this policy didn’t cost her votes (HH4b). We see that more people favored Free Trade than opposed it (40%–21%; refer to table C12 in the online appendix). The bottom-left quadrant of figure C2 in the online appendix shows that HRC got more from those who favored the policy—she won 61% of this vote compared to just 31% among those who opposed. But the critical point from HRC’s perspective is that more people favored Free Trade, so the issue worked for her, even when controlling for party attachment. Thus, while some voters did voice economic anxiety, these data suggest that voters were split evenly on economic performance and thus the issue was hardly detrimental to her. Regarding policy, the Free Trade issue worked for HRC more than against her, thus supporting HH4a and HH4b.
Gender and Personality: “Dinged”
HH5a: Voters with more traditional views on a woman’s role in society were less likely to vote for HRC.
HH5b: Voters who disliked HRC because of her personality were less likely to vote for her.
HRC gave a good deal of thought to how her biology and personality impacted her chances: these two dimensions made it “safe to say that I got a whole other level of vitriol flung my way” (Clinton Reference Clinton2017, 126). Regarding her gender specifically, she opines: “my experiences as a woman in politics have been complex and disappointing at times” (ibid., 111). She worries about successful women being held to a different standard—“the balancing act women in politics have to master is challenging at every level, but it gets worse the higher you rise” (ibid., 119); and concerning the role itself she laments that “it is not easy to be a woman in politics...it can be excruciating, humiliating. The moment a woman steps forward and says ‘I’m running for office’, it begins: the analysis of her face, her body, her voice, her demeanor; the diminishment of her stature, her ideas, her accomplishments, her integrity. It can be unbelievably cruel” (ibid., 116). She believes “women’s advancement has set into motion vast changes that inspire intense feelings of all kinds. Some of us are exhilarated. Others feel a whole lot of rage” (ibid., 128). Speaking about the antipathy towards her, she maintains it is “partly because I am a woman . . . I suspect for many of us—more than we might think—it feels somehow off to picture a woman sitting in the Oval Office or the Situation Room” (ibid., 120-121), concluding that “sexism and misogyny played a role in the 2016 presidential election’” (ibid., 114).
HRC’s view that gender serves as a barrier to political success has received considerable attention from scholars but the results do not point in one direction. Some studies have shown that being a female, along with gender stereotyping by the electorate, can cost a candidate votes (Sanbonmatsu Reference Sanbonmatsu2002; Koch Reference Koch2002; Whitaker Reference Whitaker2008; Lawless Reference Lawless2004; Huddy and Terkildsen Reference Huddy and Terkildsen1993). Others, however, have concluded that gender, in itself, is ballot neutral (McElroy and Marsh Reference McElroy and Marsh2010; Hayes and Lawless Reference Hayes and Lawless2015; Dolan and Lynch Reference Dolan and Lynch2016; Dolan Reference Dolan2014a, Reference Dolan2014b), and can in some situations be advantageous (Dolan Reference Dolan2004; Lawless Reference Lawless2004). These preceding analyses, however, were not carried out on a presidential contest. Thus, the 2016 race with HRC as candidate affords essential direct field evidence of the extent of gender bias.
How to measure this bias? This is no easy task, as there exists little consensus on how to do it. Our approach is multifaceted. We start by looking at the subjective evidence available from the ANES. Respondents who expressed a dislike of HRC as a candidate were asked to provide a verbatim reason for this dislike. We conducted a content analysis of these responses, grouping them into different categories, one of which captured respondents who specifically mentioned HRC’s gender as a reason for their dislike of her.Footnote 7 We find that less than 1% of voters who expressed a dislike of HRC directly cited her gender. On its face, this might suggest that gender bias was not an issue.
However, if we look at the more objective measures, we obtain a different picture. Objective items are less likely to fall prey to social desirability bias and we look at two. The first examines attitudes towards women in work and its impact on the family. This measure appears a less obtrusive way of tapping into sentiments about gendered divisions of labor, relevant, we argue, considering HRC’s candidacy for the highest political office. In the ANES, we have two pertinent three-point scales, both addressing women in the workplace and its impact on the family, and working mothers’ ability to form bonds with their children. These are combined into a dichotomous index using principal components analysis. We classify the response scores as representing “traditional” versus “non-traditional” views of women’s role in society. The evidence is clear cut. Most people take a non-traditionalist view—breaking about 7 to 3 (refer to table C14 in the online appendix). Concerning the vote, the more progressive a respondent’s view, the more likely they were to favor HRC (refer to figure 4, top-left quadrant). She got 55% the non-traditionalist vote but only 32% of the traditionalist group. Moreover, this effect remained significant and substantive even controlling for partisanship, with the probability of voting HRC 0.41 among traditionalists but 0.51 among non-traditionalists (refer to the top-right quadrant of figure 4).
Support for HRC in the 2016 presidential election by attitudes to women in work and its impact on family and sexist attitudes
Base: Voters only.
Source: ANES 2017.
Notes: Predicted probability estimates for top-right quadrant and bottom-right quadrant generated from models detailed in the online appendix in table C16. Diamonds represent the point estimates and the horizontal lines represent 95% confidence intervals.
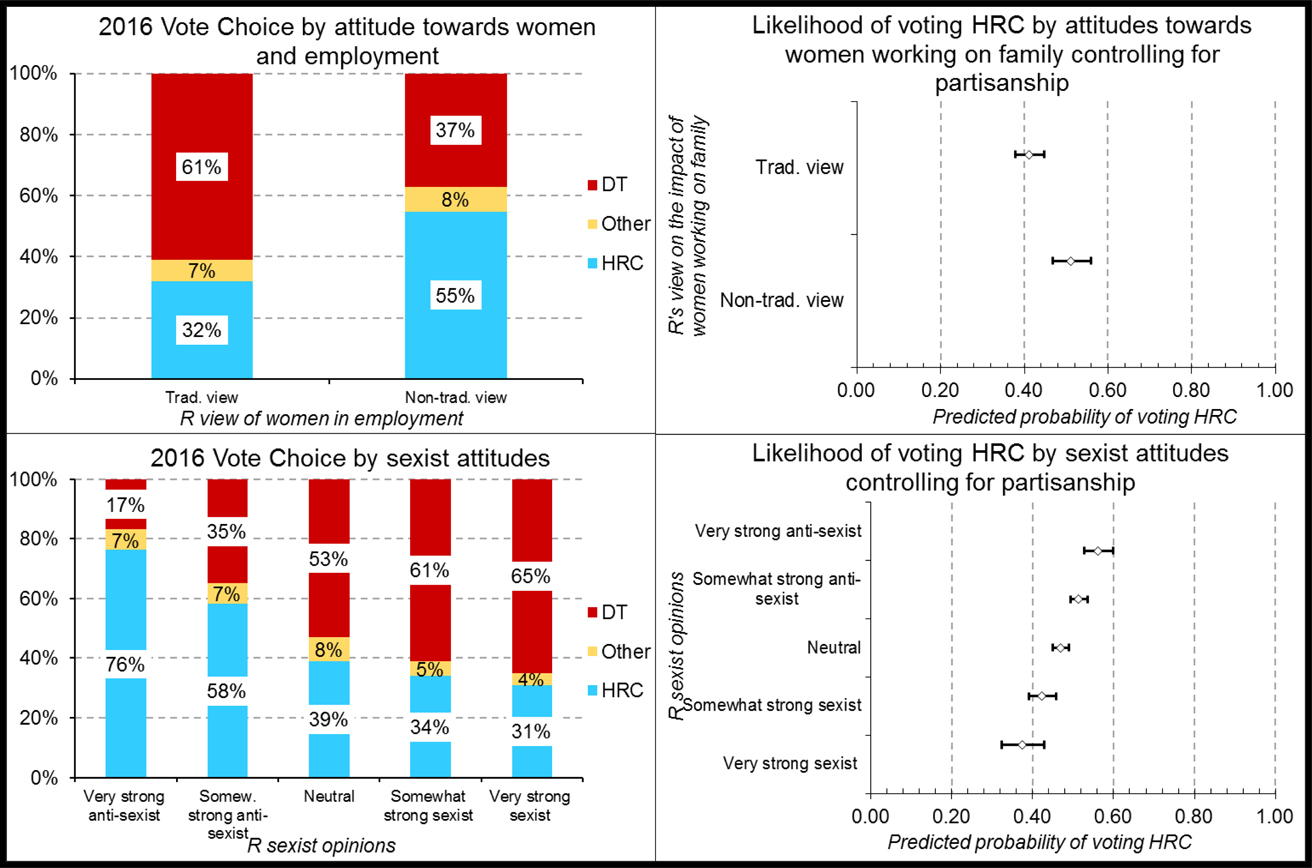
Another relevant test available in the ANES comes via two 5-point agree-disagree Likert-scale items for testing hostile sexism—prejudice by gender. We combine these into an index using principal components analysis, with the more positive scale score indicating the more sexist attitude. While only 14% of voters score high on the scale (refer to table C15 in the online appendix), there is a robust monotonic link between sexist attitudes and reported vote for HRC. Figure 4 (bottom-left quadrant) shows that among those with the lowest hostile sexism scores, HRC gets 76% support, while among the most sexist group, she only gets 31%. The relationship holds even when we control for party attachment (refer to figure 4, bottom-right quadrant). The preliminary evidence implies that negativity towards women—be it gendered prejudice or conservative values on the gendered division of labor—was linked to vote choice.
HRC also acknowledges her personality cost her votes and that she had to “come to terms with the fact that a lot of people—millions and millions of people decided they just didn’t like me” (Clinton Reference Clinton2017, 126). She says that “a significant number of Americans questioned my authenticity and trustworthiness” (ibid., 111). Further, she cites the image damage from her primary opponent: “Bernie routinely portrayed me as a corrupt corporatist who couldn’t be trusted” (ibid., 119). She laments she was “dinged” as having many negative character traits, i.e., “boring!”, “not inspiring!”, “sellout!”, and “the establishment candidate!” (ibid., 116), bemoaning that “I never quite shook the false perception that I was a defender of the status quo . . . . For a change-hungry electorate, it was a harder sell” (ibid., 128). These sentiments lead to the formulation of HH5b.
Considerable research has explored the idea that feelings towards the candidate influence vote choice (McAllister Reference McAllister, Dalton and Klingemann2007, Reference McAllister2016; Fridkin and Kenney Reference Fridkin and Kenney2011). The results can depend a good deal on measurement. Do we measure character traits such as honesty, competence, leadership? Alternatively, do we look at general dispositions like popularity or warmth? Are the items asked in a closed-ended or open-ended fashion? We opt to measure personal attitudes towards HRC using the ANES open-ended question, as it offers a richer picture, perhaps better suited to the complexity of the concept. Thus, we return to our content analysis of the verbatim responses of interviewees who expressed a dislike of the candidate. One of the categories recorded responses relating to HRC herself—her person. Typical answers included respondents referring to her age, her ethics, and personal conduct, to whether she was a suitable candidate or fit to be president.
Figure 5 (top-left quadrant) shows that a majority of voters disliked HRC for some reason (61% to 39%). Breaking this down by issue, we find the modal response (39%) is a dislike for HRC personally (refer to the top-right quadrant of figure 5). Among those professing a dislike, this equates to 64%—i.e., nearly two-thirds of voters disliking HRC cited her personality or personal characteristics as the reason. It far outstrips the other reasons that we coded. For example, about 13% dislike HRC because she was a Democrat or her policy stances while only 3% (among all voters) disliked her because of the Benghazi affair or her qualifications (or lack thereof). This evidence strongly supports the HRC assertion—many voters just did not like her.
Support for HRC in the 2016 presidential election by attitudes to her
Base: Voters only.
Source: ANES 2017.
Notes: Predicted probability estimates for bottom-right quadrant generated from model detailed in the online appendix in table C17. Diamonds represent the point estimates and the horizontal lines represent 95% confidence intervals.
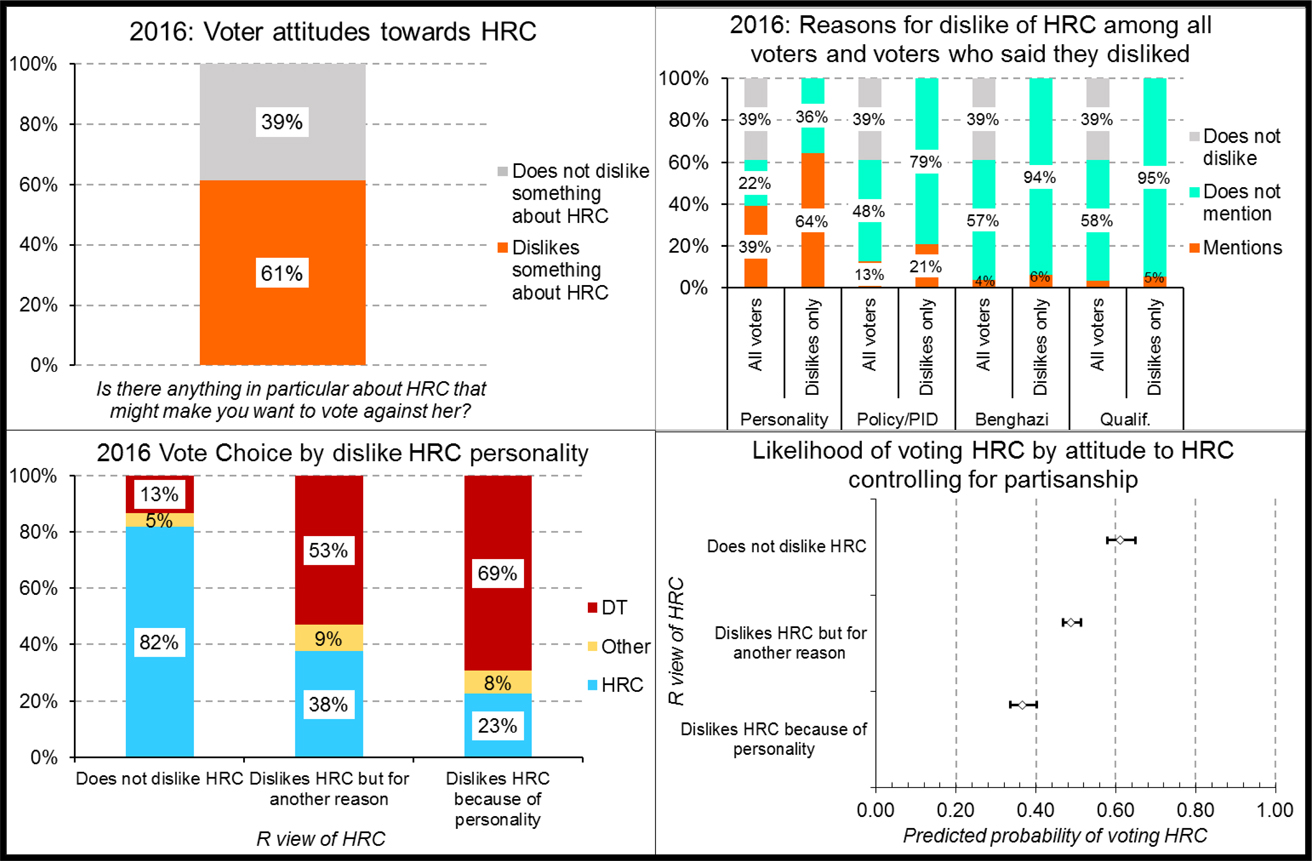
Unsurprisingly, these attitudes to HRC robustly map on to vote choice (refer to figure 5, bottom-left quadrant). Among those who did not dislike HRC, she garnered 82% of the vote. Meanwhile, among those who expressed a dislike, but for a reason besides the HRC personality/character, 38% reported voting HRC. The potency of the personal dislike is evident in that she only garnered 23% of the vote among those who said they disliked her personally (a substantial 59-point gap compared with those who didn’t express a dislike). These patterns remain statistically significant when controlling for partisanship (refer to figure 5, bottom-right quadrant). Among people who didn’t express a dislike for HRC, the likelihood of supporting her was 0.61. However, it is only 0.37 among those who have antipathy towards HRC. Thus, HH5b also receives support.
The Campaign: E-mails and Comey
HH6a. Voters who paid attention to HRC’s use of e-mail were more likely to vote against HRC.
HH6b. Voters who paid attention to the Comey intervention were more likely to vote against HRC.
HRC insists that the most critical issue explaining her loss was the e-mails. The matter first surfaced in spring 2015, regarding the use of a private e-mail server rather than official State Department servers. Some charged that it violated security, with claims that she mishandled classified material, prompting investigations from Congress, the Department of Justice, and the FBI. In July 2016, while an FBI report was highly critical, no criminal charges were filed. However, referring to a “maddening saga” (Clinton Reference Clinton2017, 291), HRC acknowledges that “my e-mails were the story of 2016” (ibid., 322). She accepts that “the original decision to use personal e-mail was on me. And I never figured out how to make people understand where I was coming from or convince them that I wasn’t part of some devious plot” (ibid.), concluding that “no matter what, I never found the right words” (ibid., 292) However, HRC insists that “the whole thing was just a convenient political piñata” (ibid., 322), admitting that while “it was a dumb mistake” (ibid., 292), it was an “an even dumber ‘scandal’” (ibid.). She also hits out at the media for its coverage of the issue, observing that “coverage of my e-mails crowded out virtually everything else my campaign said and did. The press acted like it was the only story that mattered” (ibid., 319), and ruefully conceding that “I failed to convince the press that economics was more important than e-mail” (ibid., 236).
While e-mail was omnipresent throughout the campaign, it took on renewed vigor on October 28, ten days before Election Day. In a letter to Congress, FBI Director James Comey announced that the Bureau was examining additional e-mail correspondence. While Comey later announced that the FBI had not changed their earlier conclusion, HRC believes this intervention was critical. She characterizes it as “unprecedented” (ibid., 391) and says “I felt I’d been shivved” (ibid., 290). She contends that “the final week of the 2016 campaign was dominated by swirling questions about my e-mails” (ibid., 318), leading to “a week of wall-to-wall negative coverage . . . in six out of seven mornings from October 29 to November 4, it was the lead story in the nation’s news cycle,” as well as in huge ad spends by Republicans in battleground states (ibid., 403). HRC says it made the narrative “‘something shady must be going on with her’, fueling the much-discussed phenomenon of Clinton fatigue.” (ibid., 301). She notes that “even if Comey caused just 0.6 percent of Election Day voters to change their votes, and even if that swing only occurred in the Rust Belt, it would have been enough to shift the Electoral College from me to Trump . . . if not for those decisions, everything would have been different” (Ibid., 406).
In assuming that campaign events count for elections, HRC accepts political science orthodoxy that campaigns can matter; but, as we noted earlier, she follows the tradition of many losers in ascribing their loss to particular campaign events. However, scholars remain divided about what campaign activity matters and in what circumstances (Farrell and Schmitt-Beck Reference Farrell and Schmitt-Beck2002; Kenski, Hardy, and Jamieson Reference Kenski, Hardy and Hall Jamieson2010).
In assessing the e-mails, we first look at a potential indirect effect, then secondly a direct effect. HRC was particularly critical of the media coverage of the e-mail scandal, believing they gave it too much attention. It suggests, then, that those who paid more attention to such media coverage were less likely to vote for her since it was so negative. The ANES allows us to test this possibility indirectly, with its question about how closely respondents followed politics in the media (refer to table C18 in the online appendix for the distribution). Figure 6 (top-left quadrant) shows that HRC appears to get more support from voters who paid more attention to the e-mail news, garnering 54% of the vote among those who followed politics in the media very closely but only 37% among those who didn’t follow it closely at all. Further, when we control for partisanship, this apparent effect becomes negligible. These findings cast doubt on her notion that the news media’s coverage negatively impacted her vote.
To test the direct impact of the e-mail scandal, we return to our content analysis measuring the reasons why a respondent said they disliked HRC. We located respondents who mentioned the e-mail scandal explicitly as a reason for their dislike of HRC. If e-mail was as prominent as HRC assumes, we might expect many voters to say this. As we noted earlier, a majority of voters reported disliking HRC. Yet figure 6 (top-right quadrant) shows only 6% among all voters (and 10% among those who expressed dislike) mention e-mail as the reason. It is much fewer than mentioned by HRC herself or policy/partisanship as a reason for their dislike. Despite the media blitz about these e-mails, that news stayed mostly at the elite level, not penetrating the public mind.
Support for HRC in the 2016 presidential election by attention to media and e-mail
Base: Voters only.
Source: ANES 2017.
Notes: Data in the top-left quadrant may not sum to 100 due to rounding. Predicted probability estimates for bottom-right quadrant generated from model detailed in the online appendix in table C17. Diamonds represent the point estimates and the horizontal lines represent 95% confidence intervals.
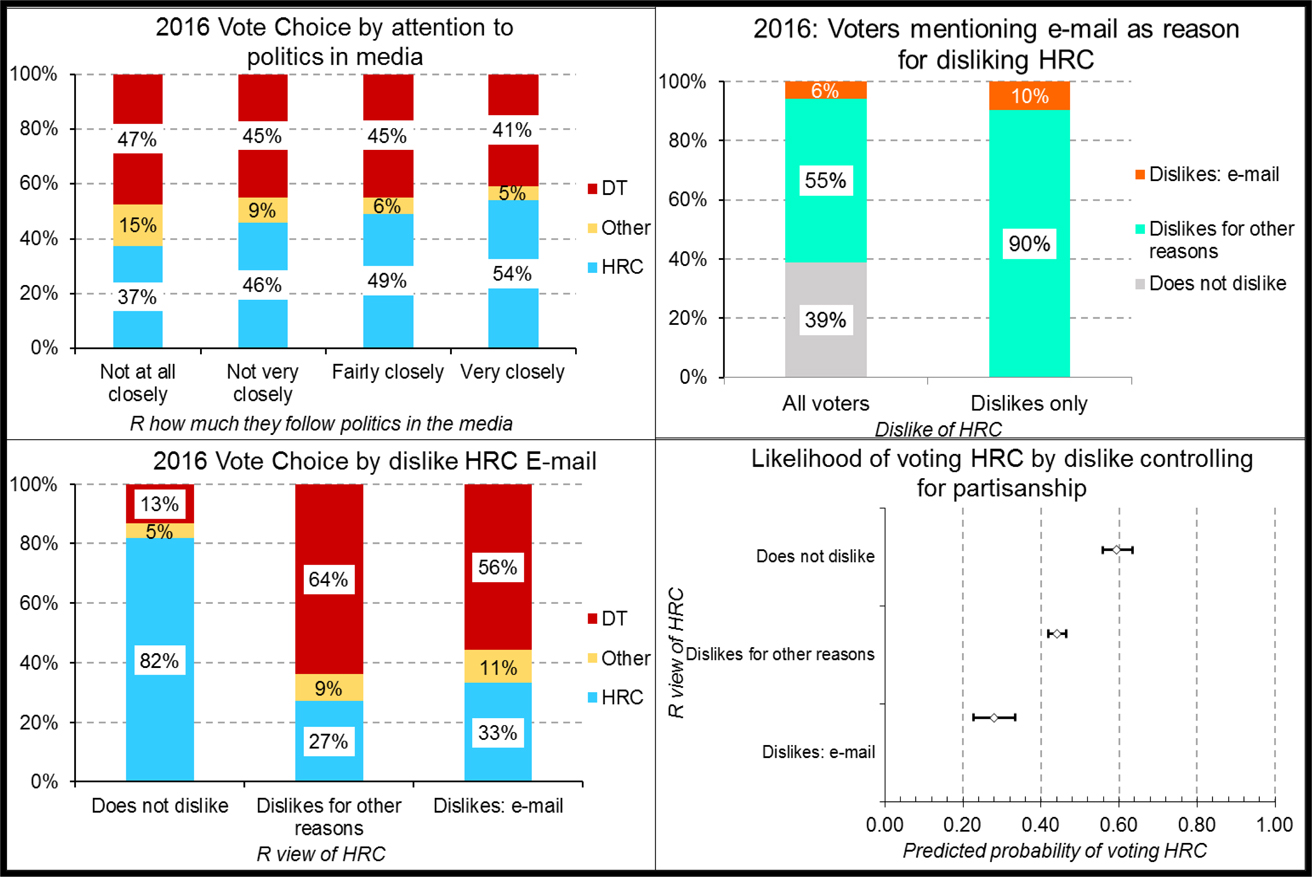
The bivariate relationship with vote choice does not provide substantial evidence for an adverse e-mail effect, with HRC obtaining slightly more votes from those who disliked her because of e-mail than among those who disliked her for other reasons (refer to the bottom-left quadrant of figure 6). However, when we factor in partisanship, we do observe the expected HRC effect (refer to the bottom-right quadrant of figure 6). The likelihood of supporting HRC is lower among those citing e-mail (0.28) compared to those who disliked her for another reason (0.44). Thus, this evidence supports HRC’s view that e-mails might have been a direct factor (HH6a). However, we must keep in mind that everyday folks, except for a small number, did not pay attention to e-mails, at least if we take them at their word.
With e-mail seeming to have some, albeit limited effect, the next question concerns the Comey intervention. The question centers on what if there had been no Comey intervention? Testing that counterfactual experimentally is impossible. Statistical controlling on the observational data also poses problems, given the continually evolving news cycle that could represent the independent variable(s). In response, our investigation looks at multiple indicators that might be influenced by a Comey intervention. We begin with a question: when did voters make up their minds? We categorized the ANES data on this metric into three different groups: voters who decided before October, those who chose in the first three weeks of October, and those decided in the final week of the election (including the last of week of October when the Comey effect would be visible).
Figure 7 (top-left quadrant) shows that among voters deciding before October, HRC won 52% of this group. However, among voters deciding in October and after, HRC fared much worse, garnering between 34% and 37% of the vote. Thus, the evidence shows that more late deciders did opt for DT or other candidates. However, this drop is the same for pre-Comey (the first three weeks October) and post-Comey (the last week of October and after). In other words, the drop is observable both pre- and post-Comey implying that the Comey intervention is moot. Thus, these pre/post intervention findings flatly fail to support a Comey effect. Instead, they suggest HRC was losing support before his intervention, which agrees with aggregate level analysis conducted by AAPOR (Kennedy et al. Reference Kennedy, Blumenthal, Clement, Clinton, Durand, Franklin and McGeeney2017) and Wright and Wright (2018).
Support for HRC in the 2016 residential election pre- and post-Comey intervention.
Base: Voters only.
Source: ANES 2017.
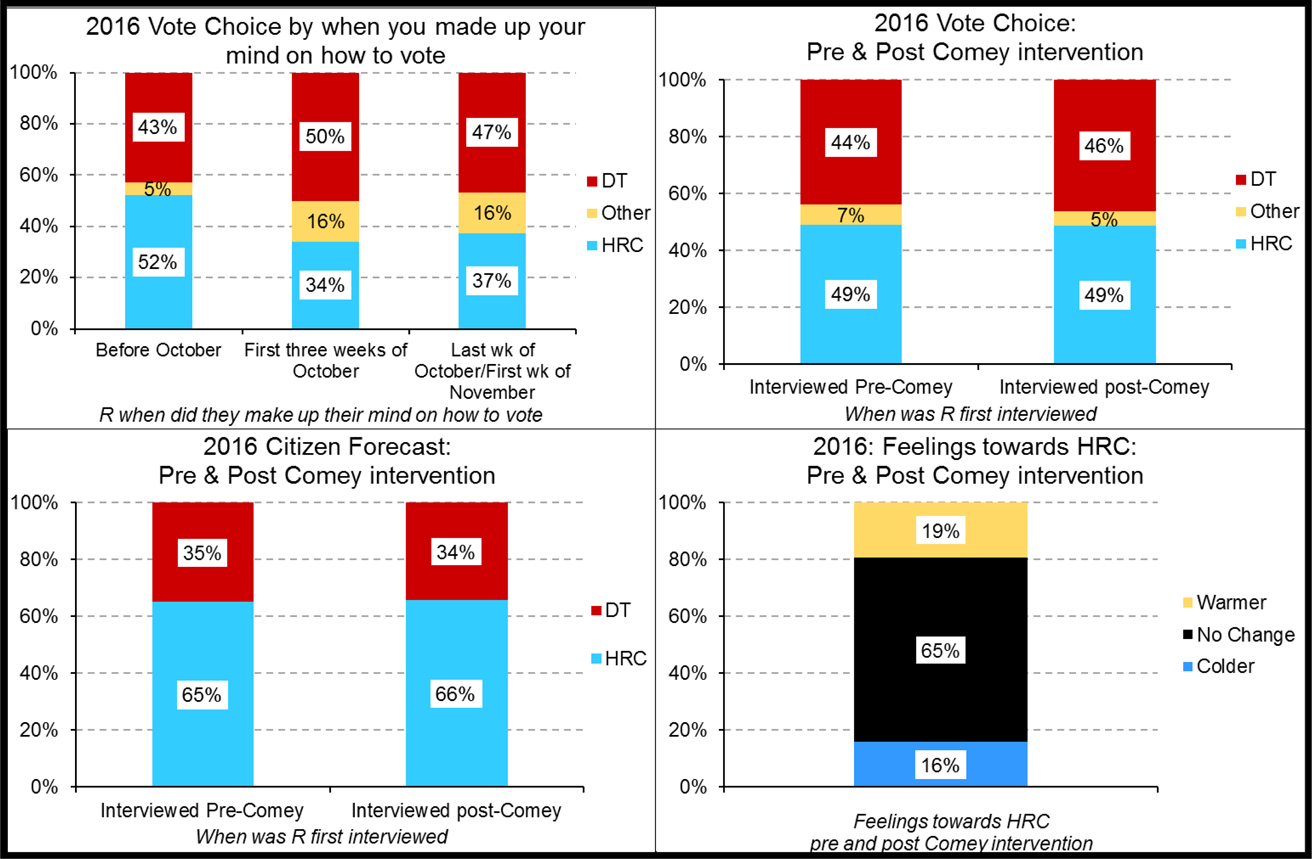
Given the previous results and the late intrusion of his intervention, we were encouraged to split the data into two: respondents interviewed before the October 28 intervention and respondents interviewed after.Footnote 8 If the Comey intervention was decisive, we should see meaningful differences between these two groups on a range of metrics. In figure 7, the top-right quadrant looks at reported vote. It shows 49% of those first interviewed pre- the Comey intervention reported voting HRC while 49% of those first interviewed post- the Comey intervention reported likewise (the DT vote is marginally up post-Comey, 46% versus 44%. However, the statistical evidence suggests no significant difference between the two groups – p=0.653).
In the bottom-left quadrant of figure 7, we see that the citizen forecasts of these voters (Murr Reference Murr2011; Lewis-Beck and Tien Reference Lewis-Beck and Tien.1999) about whom they think will win both pre- and post- the Comey intervention. Both distributions show that HRC was favored to win—65% before Comey and 66% afterward. If Comey had been decisive, we would expect to see expectations for an HRC victory less than before his letter. Meanwhile, the bottom-right-quadrant of figure 7 taps whether feelings towards HRC changed pre-Comey or post-Comey. We might infer that if Comey was decisive, we would see more people having a less favorable view of her after his intervention. However, we find that about two out of three voters had no better or worse a view of her. The remaining one-third split between those who became warmer and colder towards her. In other words, views towards HRC did not noticeably alter one way or another pre- or post-Comey. Taking the evidence together, we see no evidence of a Comey effect. We do not deny that late deciders may have opted away from HRC, but there is no firm evidence to conclude that it was because of James Comey’s intervention. Rather, the evidence suggests a move away from HRC before his October 28 letter, and thus we conclude no support for HH6b.
Hillary Hypotheses : Relative Importance
To accurately weigh the Hillary Hypotheses (HH), a multivariate strategy is required. Thus, we turn to multiple logistic regression to explain the vote for HRC (confining our analysis to voters in both waves of the ANES 2016 study, yielding a final N of 2,137).Footnote 9 We estimate five models sequentially, beginning with more long-term forces like party identification and standard socio-demographics (i.e., age, education, gender, race), and also control on a respondent’s ideological self-placement. Concerning the independent variables offered by HH, as measured, we include those that were statistically significant at conventional levels in the earlier analyses. This fuller specification of her arguments puts them to a sterner test.Footnote 10
In table 1, we present our most elaborated model, which offers a good account of vote choice, with a pseudo-RFootnote 2 of 0.62. Looking at the impact of the HRC variables, the crucial importance of partisanship stands out, as HH1 assumes. Examining marginal effects (last two columns of table 1), when the independent variable shifts from minimum to maximum values, we observe that the likelihood of voting for HRC rises from 0.36 for non-Democratic identifiers to 0.63 among Democratic partisans. Given that 2016 was an unexpected result, we might have assumed that such traditional determinants mattered less. However, the classic explanatory variable of vote choice, as HRC expected, was crucial for many opting for DT. Meanwhile, the inclusion of a variable for Midwest residence confirms HRC’s belief that the voters of the region were unexceptional, sustaining HH2a.
Logit model of 2016 U.S. presidential explaining vote choice based on the Hillary Hypotheses
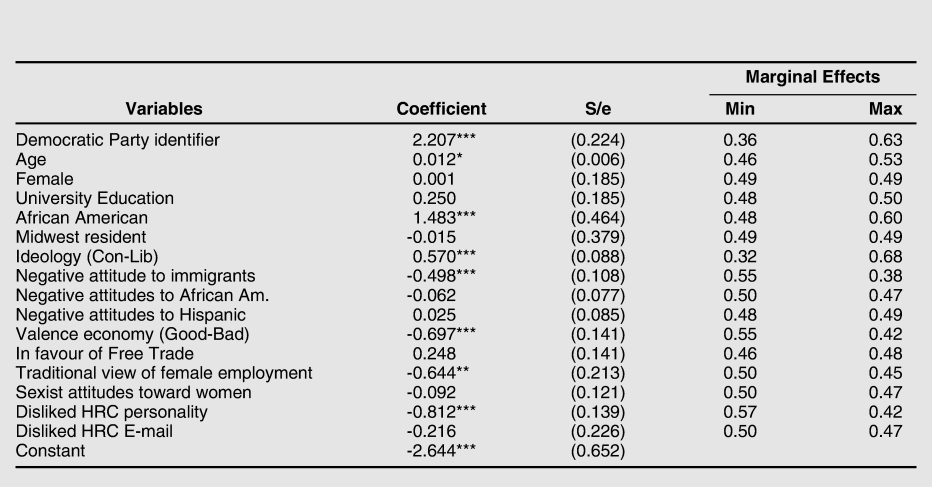
Notes: Dependent variable: Reported vote for HRC in 2016 U.S. presidential election
N=2,137; Pseudo R2=0.616; N Strata/PSU=132/265. Design d/f=133, F=26.63***.
Data weighed analyses using Taylor Series calculation of sampling error recommendation of ANES Codebook. For marginal effects, other variables in the model held constant at their mean values. We detail other models (early sequential models and robustness checks) in tables C19, C20 and C21 in the online appendix.
* p≤0.05; ** p<0.01; *** p≤0.001. S/e= Standard error.
Source of data: ANES 2017.
When it comes to cultural anxiety, perhaps surprisingly, negative attitudes toward blacks or Hispanics never show a significant effect. It casts doubt on HRC’s view that antipathy towards minorities mattered (HH3a). We recognize that we cannot rule out their indirect effect passed on to the voter via other paths, nor the possibility that collinearity has undercut their significance. Nonetheless, we can say that they are not shown to directly influence her support, once we consider other factors. Relatedly, we find that negative attitudes toward immigrants worked against her, with the coefficient stable across multiple specifications. It supports HH3b, with the likelihood of voting HRC at 0.55 among those most positively disposed to immigrants, falling to 0.38 among those least disposed. In sum, cultural anxiety mattered in the form of immigration.
HRC’s view that the economy didn’t work against her receives some support (HH4a). Slightly more people thought the economy was doing better, and this group was significantly more likely to favor her. However, our other economic variable, free trade, seems unimportant now, failing to achieve statistical significance.Footnote 11 As HRC claimed, the economic arguments were there, but overplayed, and the issue was more to her benefit.
We find support for HRC’s view that attitudes towards her influenced her support. Those who did not like her personally often voted against her, as HRC predicted (HH6b). Voters who disliked her because of her personality were about fifteen points less likely to support her compared with those who liked her, a potent variable considering its distribution. Looking at gender, the evidence is more nuanced. The survey’s biological measure of gender (coding respondents female or male) revealed no statistically significant difference. Moreover, the direct measures of sexist attitudes failed to achieve statistical significance, other things being equal. However, a gender dimension emerges regarding attitudes to female employment. Those who held more non-traditional views concerning the impact of women working on family life, at least as measured, were about five points more likely to vote HRC than those who held traditional beliefs. Thus, gender was a factor in 2016, as HRC posits (HH6a), but perhaps not in as direct a way she assumes.
Our analysis showed little support for a fundamental HRC assumption that e-mail was a key factor. This variable falls far from a conventional level of statistical significance. Despite the fervor generated in elite political and media circles, these results strongly suggest that it did not have a direct effect on the vote. As we noted earlier regarding racial animus, we cannot rule out that e-mail somehow had an untapped indirect effect. However, we find no evidence to sustain HRC’s claim that the issue decisively contributed to her loss.
The Hillary Hypotheses Scorecard
Table 2 offers an assessment of HRC’s success in judging the outcome of Campaign 2016. Overall, the ANES evidence backs her up on nine out of the thirteen hypotheses (a 69% success rate). Whether one sees that rate as “good” or “bad’ depends but HRC shows, more often than not, that she is on the money. She correctly identified the partisan tenor of Campaign 2016, knew that economics, for the most part, played to her strength but was not as crucial as assumed. She saw that immigration concerns were there and accepted that personal dislike of her mattered. She was also right that the Democratic base was on her side and that Midwesterns were not exceptional. We might deduce these correct calls show political losers can identify the reasons for their defeat. However, HRC’s central assertion—e-mails and the Comey interventions were definitive to her downfall—receives little support, demonstrating that candidates do not always get it right, and that campaign occurrences are overstated.
Support and strength for the Hillary Hypotheses based on descriptive and multivariate analysis
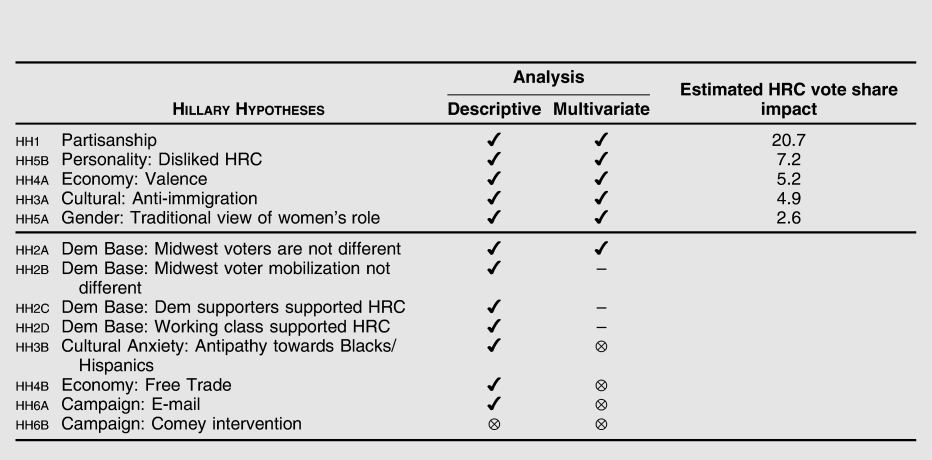
Note: ✔ = Support for HH ⊗ = No support for HH– = Not tested
The question arises about what factors had a more significant impact on the overall outcome. To extrapolate how individual-level changes impact the overall vote share of HRC, we apply a linear probability model to estimate the national-level impact of the statistically significant HH variables in table 2.Footnote 12 In the last column, we observe the expected change in her vote share if that variable score changed one standard deviation. For example, take the economy: if evaluation scores had altered one standard deviation (i.e., 0.76) in the direction of “bad,” HRC would have lost about 5.2 percentage points of vote share. Arguments may exist over the extent to which these attitudinal variables are actionable. However, most would agree that, at least in the short run of a campaign, long-term forces like partisanship are not usually open to manipulation. This weighed heavily on vote choice in 2016. We estimate that party identification is among the strongest of all the forces (20.7 points).
What about the variables that might be considered “actionable”? As noted, had economic perceptions altered one standard deviation (i.e., 0.76) towards a more positive assessment, HRC could have gained over five percentage points, enough to change the result. However, views differ as to how easy (or hard) it is to manipulate opinion on this issue (Evans and Anderson Reference Evans and Anderson2006; Lewis-Beck, Martini, and Kiewet Reference Lewis-Beck, Martini and Roderick Kiewet2013). Other attitudes are perhaps more open to change. We estimate that the public’s negative personal perception of HRC cost her dearly. A one standard deviation shift (i.e., 0.88) in her favor could have gained her an additional seven percentage points. A change of this size might have been difficult in practice, but shows that her image looms large in understanding her defeat.
Perhaps the variable most susceptible to alteration might have been attitudes towards immigration. While HRC’s position on the issue chimed with a majority of voters, we estimate that a one standard deviation shift toward a more open immigration policy could have netted her about five percentage points more. In sum, the 2016 results could have been different, if some of the attitudinal variables HRC correctly identified had played otherwise. Of course, since this is counterfactual, it should be regarded with caution.
Conclusion
Our novel study looks at the 2016 U.S. presidential election from the viewpoint of the losing candidate—Hillary Rodham Clinton. Usually, political science does not give much credence to the thoughts of the defeated candidate, but HRC stands out being the first woman nominated for president of a major political party. Further, she offers a long and detailed account in her memoir, What Happened. The leading reasons she has put forward we formulate as hypotheses for testing. In doing so, we break new ground with a systematic examination of loser perceptions of a political defeat, thereby providing an original analysis of the extraordinary 2016 election.
Let us deal with the lessons learned. Our study suggests HRC was more right than wrong. Her 69% success rate in identifying many of the factors that significantly helped or hurt her bid for votes demonstrates considerable insight. Her prediction success suggests that losers are not incapable of identifying reasons that contributed to their support or defeat. However, we also see that political losers can miss the mark. We find little evidence to support HRC’s primary assertion—that the e-mails controversy and James Comey’s intervention in particular were critical in swinging the election. While the e-mail scandal was, undeniably, a prominent media issue, our analysis detected no direct effect on vote when other factors were controlled for. While we cannot rule out an indirect effect, HRC gives the issue such prominence that it is reasonable to assume a direct effect should be visible. Neither did we find any evidence supporting the notion that the Comey intervention shifted opinion, indicating that while it might have dominated news coverage, it did not resonate in the hearts and minds of voters.
HRC is not alone among political losers in ascribing defeat to campaign events, implying that this may be a particular characteristic of losers. However, the belief that the campaign is the be all and end all perhaps represents an occupational hazard. Moreover, what comes across from the memoir, and supports the limited research on losers, is that loss hurts, a feeling echoed best by HRC: “I’ll keep replaying in my head for a long time what went wrong in this election . . . it’s going to be painful for quite a while. None of the factors I’ve discussed here lessen the responsibility I feel or the aching sense that I let everyone down” (Clinton Reference Clinton2017, 425).
What does the study say about the 2016 election? HRC asserts that the election was a close contest (ibid., 394). In a historical sense, the 2016 result was not as tight as might first appear and indeed not as close as the 1976, 2000, or 2004 contests, or 1948 on HRC’s own metric (refer to table C22 in the online appendix, ibid.). More interestingly, the 2016 election has a degree of familiarity—economics, the personalities of the candidates, and above all partisanship were important, much as they have been previously. Thus, in many aspects, the election was not all that remarkable. However, the saliency of immigration and traditional feelings towards women in shaping vote choice did signify a new departure. These issues mattered, and although these sentiments were not extensive among the electorate, had HRC been able to shift opinion on these, things might have been different. However, we should not lose sight of the widespread dislike of HRC. While extensive antipathy was also something DT faced, it is hard to conclude that the dislike of her was not a big part of her defeat.
Turning to the implications of our findings, as a continuing leader of the Democratic Party HRC still has sway. Despite her incisive and mostly accurate characterization of the 2016 race, her conclusion that the fault primarily lies at the door of James Comey seems a limited view. Accepting this narrative could take the Democrats down a road they might better “not travel,” as it implies the fundamentals of the party’s appeal were unproblematic. This interpretation overlooks some hard facts: in 2016 the economy probably helped it more than hurt it, the partisan balance was in its favor, and it was facing a highly controversial political novice—yet still failed to win the White House or Congress. Also, our data show that the traditional notion of the Democrats as the working-class party has lost traction. In sum, uncritical acceptance of the interpretations of political losers, especially ones who are still dominant, may not always be the recipe for electoral redemption.
Supplementary Materials
Appendix A. Variable Classifications and Survey Questions
Appendix B. Summary Stats and Factor Analysis
Appendix C. Data Referred to in the Paper and Supplementary Analysis
To view supplementary material for this article, please visit https://doi.org/10.1017/S153759271800347X


 Open access