


Introduction
In representative democracies, voters control public policy by voting for the party that stands closest to their ideal point (Downs Reference Downs1957a, Reference Downs1957b). When parties and voters stand apart, space for new parties opens up. We can observe this quite directly. When asked about his policy platform, Pablo Iglesias, founder of the left‐wing populist party Podemos, responded that his party mobilises on a social democratic program to fill the ideological space left open by the social democratic PSOE's Third Way course (Amón Reference Amón2016). Similarly, one month before announcing the entry of the radical right‐wing populist Forum voor Democratie, its leader, Thierry Baudet (Reference Baudet2016), complained on Twitter that the liberal–conservative Volkspartij voor Vrijheid en Democratie (VVD) had moved too far to the left, expressing the sentiment that, at least for himself, the VVD could no longer adequately represented his views. And before launching his centrist En Marche, Emmanuel Macron distanced himself from the left wing of the Parti Socialiste. He no longer declared himself a socialist in an attempt to win unattended French centrist voters (Raulin Reference Raulin2016).
These examples illustrate how new parties play a key role in a representative democracy. They give new alternatives to voters who the established parties do not serve. However, despite the crucial function of new parties, the proposition that they enter and are rewarded for filling representational gaps has not yet been rigorously tested. This is even more striking given that the underlying spatial model is among the classics of political science (Downs Reference Downs1957a; Enelow & Hinich Reference Enelow and Hinich1984).
On the one hand, cross‐national large‐N empirical studies have provided important insights into how structural and institutional features of a polity affect new party entry (Harmel & Robertson Reference Harmel and Robertson1985; Hug Reference Hug2001; Tavits Reference Tavits2008). This literature has also begun to consider more dynamic elements like voter discontent (Sikk Reference Sikk2012; Tavits Reference Tavits2008), slack in the issue agenda (Lowery et al. Reference Lowery, Witteloostuijn, Péli, Brasher, Otjes and Gherghina2013), party collapse (Laroze Reference Laroze2019), voter turnout (Lago & Martínez Reference Lago and Martínez2011), or the effective number of parties (Kselman et al. Reference Kselman, Powell and Tucker2016). Nonetheless, how short‐term electoral market dynamics affect entry has remained underexposed. And to our best knowledge, the role of ideological mismatch between voters and parties has never been addressed thus far in a large‐N context.Footnote 1 On the other hand, one important merit of the small‐N literature on political opportunity structure (POS) is that it puts party–voter incongruence at centre stage in explaining the entry and electoral breakthrough of new parties (Kitschelt Reference Kitschelt1988; Kitschelt & McGann Reference Kitschelt and McGann1997; Rydgren Reference Rydgren2004). However, authors here have only focused on specific parties or party families, like left‐libertarian and radical right parties. Hence, we do not know whether their findings extend to new parties and new party voters in general.
This article fills this void by examining how party–voter incongruence affects new party formation and support. We explain both phenomena by means of a joint theoretical framework. According to spatial models of elections with an entry decision (Besley & Coate Reference Besley and Coate1997; Kselman & Tucker Reference Kselman, Tucker, Schofield and Caballero2011; Osborne & Slivinski Reference Osborne and Slivinski1996) and agent‐based models that are built on their assumptions (Laver & Sergenti Reference Laver and Sergenti2011), new parties will enter when voter preferences along the left–right dimension are being left unattended. Voters, in turn, will vote for these new parties if they stand closer to their ideal point. Hence, this article consists of two studies: our first study tests whether aggregate party entry rates increase with party–voter incongruence (H1); the second study lies at the level of the individual voter and examines whether voters are more likely to support new parties, the closer they stand to them as compared to the established parties in the system (H2).
Our research design has two important strengths. First, Study 1 (on party entry; H1) relies on a new dataset that is the most comprehensive attempt thus far to include all new parties. Based on this data collection effort, we can most clearly isolate new party entry from new party success. Second, where it comes to Study 2 (new party support; H2), our selection of new parties is bounded by data availability in election studies. This means that we cannot test H2 on each new party that respondents could ever vote for. Nonetheless, we test H2 based on the largest dataset of new party voters hitherto available. By examining the individual‐level support for new parties, we move beyond previous work that either studied the aggregate support for new parties in general (e.g., Harmel & Robertson Reference Harmel and Robertson1985; Tavits Reference Tavits2006), for specific families (Kitschelt Reference Kitschelt1988), or the individual‐level support for a specific new party (e.g., Passarelli & Tuorto Reference Passarelli and Tuorto2018; Van der Brug Reference Van der Brug2003).
Study 1 covers elections from 17 Western European countries between 2000 and 2016, while Study 2 relies on a subset of 11 of these countries between 1996 and 2015. We find firm empirical evidence for both hypotheses. This has important implications for spatial models of elections, studies on strategic entry and research on POSs.
Theory and hypotheses
In advance, several clarifications are useful to make. First, while this article consists of two empirical studies, game theoretic spatial models with an entry decision (Besley & Coate Reference Besley and Coate1997; Bol et al. Reference Bol, Matakos, Troumpounis and Xefteris2019; Kselman & Tucker Reference Kselman, Tucker, Schofield and Caballero2011; Osborne Reference Osborne2000; Osborne & Slivinski Reference Osborne and Slivinski1996) form the common theoretical framework underpinning both of our hypotheses. These spatial models involve two types of agents: citizens and politicians, whose policy preferences can be situated along a left–right dimension. They predict that new parties are more likely to emerge when the incongruence between established parties and voters increases. Voters, in turn, will reward the new party by voting for it if it stands closer to its ideal point.
Although these spatial models focus on the utilities of individual voters and potential party founders, we can only examine new party voting at the individual level of analysis. Ideally, we would also have examined party entry at the individual level but unfortunately, an observational design at that level of analysis is impossible: Studying whether citizens become candidates or political groups materialise into parties would require data on the full population of eligible citizens (where a negligibly small share decides to become a candidate) or the entire pool of political groups that could potentially become parties. Both designs are virtually impossible. Hence, we follow the state‐of‐the‐art (Cox Reference Cox1997; Hug Reference Hug2001; Tavits Reference Tavits2006) in studying party entry with the aggregate count of new parties in an election. As explained by Hug (Reference Hug2001: 69), we cannot directly observe the process that leads to the formation of new parties or that fails to produce a newcomer. Therefore, counting the number of successful outcomes is an appropriate aggregate measure. The game theoretical models focus on explaining the probability of party formation, which finds as a natural equivalent the probability of an event occurring in our methodological framework of event counts.
That our party entry analysis is based on aggregate entry rates and our new party voting analysis on individual voters is also reflected in how we conceptualise incongruence. At the aggregate level (H1), it corresponds with the degree of overlap between the distribution of voters’ left–right self‐placements and the distribution of their placements of parties along this dimension. Hence, platform change by existing parties and changing voter preferences shapes the potential gap for new parties. Gaps materialise at the flanks if extant parties converge towards the centre and non‐centrist voters adhere to their preferences. A gap emerges in the centre if extant parties polarise towards the flanks while centrist voters stick to their preferences. Likewise, a gap for new parties can emerge if, for instance, voter preferences change from a normal to a bimodal (polarised) distribution with two nodes at the extremes while extant parties all stay in the centre. In turn, our analyses at the individual voter‐level (H2) considers how close the closest new party stands to the voter as compared to the most proximate established party. Hence, also this second measure captures that representational gaps can emerge at the extremes (or among extremist voters) as well as in the centre (or among centrist voters). Consequently, we can potentially explain the entry and voting for any type of new party regardless of its family. Regarding the relationship between our two measures, we note that if a new party A enters in election t to cater to unattended voter preferences it observed in election t – 1, the individual‐level incongruence experienced by the voters in this niche will be lower at t and in election t + 1 if A survives. In turn, the aggregate party–voter incongruence at t that we will use to explain entry rates at t + 1 will be lower if no larger representation gaps are present at other locations in the system at t than the gap that has just been filled by A.
Finally, we define new parties as those that contest lower house elections for the first time (Cox Reference Cox1997; Hug Reference Hug2001; Tavits Reference Tavits2006). Thus, parties move from the category ‘new’ to ‘established’ when they pass the threshold of authorisation for the first time (Pedersen Reference Pedersen1982). Additionally, we consider the origin of parties. We employ a broad definition where any new party, except for a name change, is defined as new and a narrow definition which excludes mergers and divisions.
The entry of new parties
Will political parties be more likely to enter the fray if party–voter incongruence is high? The answer from the game theoretic literature on party entry is ‘yes’. In their revision of this literature, Kselman and Tucker (Reference Kselman, Tucker, Schofield and Caballero2011: 374) explain that spatial models with an entry decision fall into two types. A first class of models builds upon the Downsian (Reference Downs1957a, Reference Downs1957b) spatial model. It assumes that new parties ‘can announce policy positions anywhere in the policy space’ (Kselman & Tucker Reference Kselman, Tucker, Schofield and Caballero2011: 373−374). This is consistent with Downs’ (Reference Downs1957b: 96) central hypothesis that parties strictly formulate policy as a means of gaining votes. They do not seek office to carry our preconceived policies. Although the traditional Downsian model treats the number of parties as exogenously determined, extensions of his model, so‐called entry‐deterrence models, incorporate the threat of entry. Specifically, they predict that parties often chose positions that diverge from the median voter position where they could maximise their votes. This is because they attempt to close off the ideological space for newcomers (Greenberg & Shepsle Reference Greenberg and Shepsle1987; Osborne Reference Osborne2000; Palfrey Reference Palfrey1984). Assuming that voter preferences are normally distributed, Osbourne (Reference Osborne2000: 43), for instance, argues that a party that ‘moves too close to the centre invites the entry of the third player, who, by taking a position slightly more extreme […] can win with sufficiently high probability to justify her entry’. Hence, this line of reasoning suggests that new parties are started by political elites that will enter at any location where voter preferences are left unattended to maximise their chances of electoral success.
A second branch of models assumes that new party elites are policy‐seeking instead of office‐seeking. This type includes the original ‘citizen–candidate models’ (Osborne & Slivinski Reference Osborne and Slivinski1996), extensions of the aforementioned models (Bol et al. Reference Bol, Matakos, Troumpounis and Xefteris2019; Kselman & Tucker Reference Kselman, Tucker, Schofield and Caballero2011) and agent‐based simulation studies (Laver & Sergenti Reference Laver and Sergenti2011). Although these models differ in certain aspects, their common denominator is that they assume that new party founders are policy‐motivated, that is, they are energised by the prospect of pulling government policies closer to their ideal points (Bol et al. Reference Bol, Matakos, Troumpounis and Xefteris2019; Kselman & Tucker Reference Kselman, Tucker, Schofield and Caballero2011: 374). Hence, contrary to the Downsian entry models where new party elites can place a party anywhere along the spectrum, the policy‐seeking new party leaders will always adopt their most preferred position as a campaign platform. Notwithstanding this fundamental difference, both models predict that new parties will emerge when party–voter incongruence increases. For example, let us say that right‐wing voters are being left unattended by extant parties: a new party with an office‐seeking motivation will enter on the right‐side of the political spectrum in a single‐minded pursuit of office. A policy‐motivated new party, in turn, would be the result of right‐wing citizens wanting to bring government policy closer to their sincere ideological preferences.
Although party responsiveness to incongruence is a key expectation in the game theoretic literature, it has not yet been empirically tested on a large scale. Arguably, the most comprehensive attempt thus far to theoretically and empirically explain the entry of new parties in general is the theory of strategic entry (Cox Reference Cox1997; Tavits Reference Tavits2006, Reference Tavits2008). The theory's core assumption is that new parties are started by instrumentally rational elites who must maximise their vote share in the short‐run to enjoy the spoils of office and/or to influence policy (Tavits Reference Tavits2006: 102). Therefore, new parties will only enter if the benefits (b) of political office times the probability (p) of election are equal or higher than the costs (c) (b × p ≥ c). Strikingly, the role of party–voter incongruence is not discussed in light of this cost–benefit analysis. Above we have argued that both policy and office motivated new parties would have an incentive to enter when party–voter incongruence is high. Notably, other large‐N studies than the theory of strategic entry do include time‐variant variables like voter turnout (Lago & Martínez Reference Lago and Martínez2011) that could serve as indirect proxies for ideological mismatch between parties and voters. Still, the direct effect of party–voter incongruence has thus far not been addressed.
In contrast, party–voter incongruence plays a key role within the literature on the role of the POS in explaining the entry and electoral breakthrough of specific parties or party families like the greens (Kitschelt Reference Kitschelt1988, Reference Kitschelt1994) or radical right (Kitschelt & McGann Reference Kitschelt and McGann1997; Rydgren Reference Rydgren2004). An important element of POS is whether a discrepancy exists between the policy preferences of certain segments of the electorate and the ideological choices on offer. This perspective assumes that political entrepreneurs have sincere policy demands and that they will only start new parties if existing parties fail to represent their policies (Kitschelt Reference Kitschelt1988). Thus, these studies echo the rationale behind game theoretic models with policy‐seeking new parties. Yet, since POS models focus on the opportunities for specific parties or party families, the question arises whether their findings extend to new parties in general.
In sum, both the game theoretic as well as the empirical literature distinguishes between office‐seeking and policy‐seeking party founders. However, from all of these approaches we can derive that party founders respond to party–voter incongruence either to increase their electoral support or to pull government policy closer to their ideal point. Hence, we hypothesise:
-
H1 (New Party Entry Hypothesis): Party entry rates in elections will be higher when party–voter incongruence is higher.
Voting for new parties
Although the spatial models differentiate between the policy‐ and office‐seeking incentives of party leaders, they agree that voters will vote sincerely (Kselman & Tucker Reference Kselman, Tucker, Schofield and Caballero2011: 377; Besley & Coate Reference Besley and Coate1997: 92; Greenberg & Shepsle Reference Greenberg and Shepsle1987: 528; Osborne & Slivinski Reference Osborne and Slivinski1996: 67; Osborne Reference Osborne2000: 44). This means that they will not vote strategically, but engage in proximity voting and support the new party if it stands closest to their ideal point. So, while we have already derived from game theoretic models that new parties will enter when there are representational gaps, they should also be supported by sincere voters situated in those gaps, which we formalise in our hypothesis below.
Although the proposition that voters engage in proximity voting has found widespread empirical support (Blais et al. Reference Blais, Nadeau, Gidengil and Nevitte2001; Westholm Reference Westholm1997), the empirical literature on proximity voting for new parties has some gaps. On the one hand, the POS literature theorises that the electoral breakthrough of radical right and left‐libertarian parties is more likely if mainstream parties have converged to the centre in the eyes of the public (Kitschelt Reference Kitschelt1988, Reference Kitschelt1994; Kitschelt & McGann Reference Kitschelt and McGann1997; Rydgren Reference Rydgren2004). Notably, there is also mixed empirical support that mainstream party convergence increases the electoral success of parties that are not necessarily new like radical right (Van der Brug et al. Reference Van der Brug, Fennema and Tillie2005; but see Arzheimer & Carter Reference Arzheimer and Carter2006; Spies & Franzmann Reference Spies and Franzmann2011), anti‐establishment (Abedi Reference Abedi2002) or niche parties in general (Spoon & Klüver Reference Spoon and Klüver2019). Still, despite some notable exceptions (Spoon & Klüver Reference Spoon and Klüver2019), this literature tends to focus on specific party families and their aggregate success. Furthermore, since POS focuses on a party's external environment, only the positions of established parties are considered but not of the (new) party itself.
Case studies on the support for specific new parties, on the other hand, tend to focus at the individual level and do consider how the policies proposed by new parties like Italy's Movimento 5 Stelle (Passarelli & Tuorto Reference Passarelli and Tuorto2018) and the Dutch Lijst Pim Fortuyn (Van der Brug Reference Van der Brug2003) have affected their electoral support. The vast majority of these studies concludes that it would be too limited to consider new party supporters only as protest voters (Bergh Reference Bergh2004). Rather they vote for new parties because they support their policies (Passarelli & Tuorto Reference Passarelli and Tuorto2018; Van der Brug Reference Van der Brug2003). Yet, despite their relevance, these studies only focus on specific new parties, which raises the question whether their findings extend to new parties in general. Also, these studies focus on the perceived policy distance of voters to the new party, but the positioning of the other parties in the system is not taken into account.
In sum, what we lack is individual‐level evidence for proximity voting across a large range of new parties where one considers the positioning of both the new and established parties. That is, proximity voting theory posits that the utility of voting for a party is determined by the policy position of the party relative to other alternatives (Blais et al. Reference Blais, Nadeau, Gidengil and Nevitte2001; Westholm Reference Westholm1997). Thus, we expect that voters will be more likely to opt for a new party if it stands closer to them than the established parties:
-
H2 (New Party Voter Hypothesis): Voters will be more likely to vote for a new party, the closer they perceive the most proximate new party stands to them compared to the closest established party.
Data, methods and model specifications
Our article consists of two studies: the first looks at the conditions under which new parties enter elections; the second at the conditions under which voters vote for these new parties.
Study 1: Testing the New Party Entry Hypothesis (H1)
We examine the New Party Entry Hypothesis based on a sample containing data between 2000 and 2016 for 17 Western European party systems. We have uninterrupted time series on party entry from 1945 onwards but the resulting sample is smaller because the Comparative Study of Electoral Systems (CSES) data from which we derive party–voter incongruence is only available for a subset of these elections. We focus on consolidated European democracies only. First, in newer democracies, owing to a lack of electoral history, prospective party founders and voters are less likely to have stable expectations about where established parties stand, which they need to identify ideological niches and to engage in proximity voting (Tavits Reference Tavits2008). Even though at the beginning of our study the newer democracies of Central Eastern Europe (CEE) already experienced one decade of democracy, research shows that party competition remains unpredictable (Bértoa Reference Bértoa2013). Second, in his analysis of successful new parties in CEE democracies, Sikk (Reference Sikk2012) argues that instead of mobilising distinctive policy positions, they exploited voter discontent by promising a ‘new way’ of doing politics. Hence, electoral niches may be less important in the explanation of the success of new parties in CEE.
Our dependent variable in this study, Party Entry, varies by elections and counts the number of parties contesting lower house elections for the very first time (Cox Reference Cox1997; Tavits Reference Tavits2006). Our new dataset provides the most comprehensive attempt, thus far, to include each new party. Extant work on party entry either employs a threshold (Tavits Reference Tavits2008: 123), endeavours to include any new party but reports difficulties in finding all of them (Hug Reference Hug2001; Tavits Reference Tavits2006: 116), or explicitly confines itself to viable new parties (Bolleyer & Bytzek Reference Bolleyer and Bytzek2013: 774; Lago & Martínez Reference Lago and Martínez2011: 13). This new dataset was collected by the first author as part of his ‘Survival of the Fittest. Party entry and exit in Western Europe’ project funded by FWO and F.R.S.‐FNRS. It contains information (e.g., name, vote share, type of entry, party family) on all the parties that contested the postwar elections in all Western European countries. Information was collected from a wide range of sources including reference books on elections (Nohlen & Strover Reference Nohlen and Strover2010), extant databases such as ParlGov (Döring & Manow Reference Döring and Manow2015), online resources and national election authorities. We include entrants regardless of the number of electoral districts they contested. Yet, in our analyses we control for party system nationalisation to consider that in systems with greater regional diversity, entry counts can be inflated due to the large number of new parties entering only in one or very few districts.
As argued above, we consider two definitions of new parties. We begin with a broad definition where any type of origin (i.e., genuinely new parties, splinters, divisions and mergers) is coded as new except for party name changes. This includes parties formed by people without ties to established parties, and new parties formed by merger or division. The latter two form an opportunity for politicians to reposition themselves and this is why we code them as new. Nonetheless, we also test whether our results hold when we do not count mergers and divisions as new parties. This second, narrow definition, is in line with the literature on strategic entry, that only considers genuinely new parties (those started without help from members of existing parties) and splinters from existing parties as new (Hug Reference Hug2001; Tavits Reference Tavits2006: 106).
We measure our key independent variable, Party–voter incongruence t – 1 by calculating the overlap between the distribution of voters’ left–right self‐placements on the one hand and their weighted (see below) placements of the left–right positions of the parties on the other hand. So, if many respondents place themselves in the centre and political parties at the extremes, incongruence will be high. In that case there is a representational gap in the centre and room for a centrist party. Similarly, there is room for extremist parties when voters are polarised but parties offer centrist policies. Because our measure considers the positions of all the voters and all the parties, we have a so‐called many‐to‐many incongruence measure. If we would only have focused on the parties’ distances to the median voter (a many‐to‐one relationship) we would have ignored all the information on the distribution of citizens’ preferences. That is not what we want to do (Golder & Stramski Reference Golder and Stramski2010: 93). Following other research, we weight the parties’ perceived positions by the seat share that they obtained in these elections (Golder & Stramski Reference Golder and Stramski2010: 98; Lupu et al. Reference Lupu, Selios and Warner2017: 107−108). Hence, our measure captures how well voter preferences are translated into legislative seats in an election.Footnote 2 So, even if voters placed many parties to the left in the previous elections, if the left only won very few seats, there is still a representational gap on the left. When calculating the overlap between the distribution of voters’ left–right preferences and the weighted distribution of their placements of the parties’ positions, we follow Lupu et al. (Reference Lupu, Selios and Warner2017) in calculating the ‘Earth Mover Distance’ (EMD). Conceptually, it ‘computes the minimum ‘work’ required to transform two distributions so that they are identical’ (Lupu et al. Reference Lupu, Selios and Warner2017: 96). The EMD has important methodological advantages over other incongruence measures like Golder and Stramski's (Reference Golder and Stramski2010).Footnote 3 Lastly, in the analyses we lag our incongruence measure, as party entry rates at t should be explained with the incongruence observed in the previous elections.Footnote 4
For data we rely upon the CSES. The latter asks respondents to place themselves and all the relevant parties competing in the election on a general left–right scale. They consider parties as relevant if they either have parliamentary representation, or a large chance thereof. We focus on voter placements of parties rather than expert surveys or manifesto data for theoretical reasons. Models with policy‐seeking entrants assume that new parties are started by citizens who experience ideological incongruence with the current electoral choices on offer that matters (Besley & Coate Reference Besley and Coate1997; Bol et al. Reference Bol, Matakos, Troumpounis and Xefteris2019; Laver & Sergenti Reference Laver and Sergenti2011; Osborne & Slivinski Reference Osborne and Slivinski1996). Hence, it is the citizen's perception of the policy space that matters. Also, in case of office‐seeking elites, we can expect them to act upon the perception of voters rather than their own perception or that of political experts. To be successful, they should promote the policies that voters want. Downs (Reference Downs1957a: 140) proposed that parties send out representatives to sound out the electorate and discover their desires. French president Macron, for instance, conducted extensive market research before the launch of his new party En Marche (Chwalisz Reference Chwalisz and Youngs2018). Nonetheless, in the Supporting Information, we do show that our findings are robust when we use expert survey data to measure party positions (Supporting Information, 4.1). Throughout the article, we also employ a second indicator of incongruence that compares the distribution of the citizens’ self‐placements with the distribution of party placements by respondents with at least a completed secondary education (also see Golder & Stramski Reference Golder and Stramski2010). Arguably, these alternative operationalisations come closer to testing whether new parties mine ‘objective’ niches in the party system.
Our models also control for the variables deemed important in the literature. These include rules on new party establishment at t, the degree of corporatism at t, average district magnitude t, the effective number of electoral parties t – 1 (Kselman et al. Reference Kselman, Powell and Tucker2016), voter turnout t – 1 (Lago & Martínez Reference Lago and Martínez2011) and party system nationalisation t – 1 (Jones & Mainwaring Reference Jones and Mainwaring2003).Footnote 5 Our research period (1996–2016) includes periods of relative economic and political stability and change. In particular it includes the Great Financial Crisis of 2008, the ensuing Eurozone Crisis and the refugee crisis. Evidence suggests that these crises have an effect on party system change (Casal Bértoa & Weber Reference Casal Bértoa and Weber2019; Hobolt & Tilley Reference Hobolt and Tilley2016; Vidal Reference Vidal2018). We gauge their impact by controlling for economic growth (e.g., Casal Bértoa & Weber Reference Casal Bértoa and Weber2019) and dissatisfaction with democracy (e.g., Sikk Reference Sikk2012; Vidal Reference Vidal2018) in each of our models. For the operationalisation of the controls we refer to Table A2 of the Supporting Information. Because we have relatively few cases (47 elections), we prefer models with no more than three independent variables. Our focus lies on how mismatch between public demand and the political supply affect party entry. Hence, in each model we include party–voters incongruence t – 1 and dissatisfaction with democracy t – 1. Below we only present the results if we control for average district magnitude. Yet, in the Supporting Information (Tables A7–A10 of the Supporting Information) we show that the findings hold if we include all the controls mentioned above, each in turn as well as simultaneously.
The dependent variable, the number of new parties, has a higher standard deviation than mean. To correct for overdispersion, we specify a Poisson model with robust standard errors (Gould Reference Gould2011). We also cluster the standard errors at the level of countries because elections from the same country are not independent observations. The model specifications, descriptive statistics and case selection are displayed in Tables A1–A4 of the Supporting Information.
Study 2: Testing the New Party Voter Hypothesis (H2)
For our voter‐level study, we again rely on the CSES data. As we explain below, due to data limitations we could only include a subset of 11 of the 17 countries that were included in Study 1. From these countries we have data from 21 elections between 1996 and 2015. We only include respondents in the analysis if they placed the party for which they voted. Otherwise their distance to the most proximate new party (in case of new party voters) or established party (in case of established party voters) is likely biased, as the party that was voted for cannot emerge as the most proximate option.
The dependent variable is measured at the individual level and equals 1 if the person voted for a new party and zero if they supported a non‐new party.Footnote 6 Those who did not vote receive a missing value on the dependent variable and are thus not included in the analysis. In addition, we excluded voters that supported a party subsumed under the ‘Other’ category, as we cannot know whether these are actually new or extra‐parliamentary parties. We employ the same two definitions of entry as in our entry analyses above: the broad definition captures voting for any new party (except party name changes), while the second excludes divisions and mergers.
Since H2 is examined at the level of individual voters, the many‐to‐many EMD incongruence measure used to evaluate H1 is not suitable. Hence, we developed a measure where we calculate the difference between the respondent's perceived absolute distance to the most proximate non‐new party and her absolute distance to the most proximate new party. So, a positive score indicates that the most proximate new party stands closer than the most proximate established alternative, a negative score indicates the reverse, while a value of zero depicts that both stand equally close.Footnote 7 It is expected that the propensity of voting for a new party will be high when a new party stands closer to the respondent than the closest established party. Three important remarks are in place. First, since only a subset of election studies within CSES asks respondents to place new parties, we could only evaluate H2 on a subset of the countries included in our analysis of H1. Nonetheless, H2 is evaluated on a sample ranging between 18,323 and 23,338 voters: 1,550 of which supported 22 unique new parties in cases of the broad definition and 1,204 if we use the narrow definition. For the case selection, see Table A4 of the Supporting Information. Importantly, we show in Section 3.1 of the Supporting Information that our conclusions hold on a larger sample of elections and new party voters (55 unique new parties in total) where we only consider the distance to the non‐new parties as a driver of new party support. Second, when elections studies contain placements of new parties, these tend to be parties with a large chance of acquiring representation. We acknowledge that this could make it easier to confirm H2, as these new parties are unlikely to be defeated by strategic voting (and hence, evaluated based on their policies). Nonetheless, we provide evidence below that new party voting is poorly understood from a strategic voting perspective. Third, we focus on the distances that respondents perceive, since in spatial theory, individuals take decisions on the basis of their own expectations of their individual, subjective utility (Blais et al. Reference Blais, Nadeau, Gidengil and Nevitte2001; Westholm Reference Westholm1997). Still, we test if our findings are robust when we calculate the distance between respondents’ self‐placements and the nearest non‐new and new party based on the mean placement of parties by (1) all respondents and (2) all respondents that have at least completed secondary education (like above). It could be that new party voters will place the parties for which they did not vote further away to rationalise their decision (Blais et al. Reference Blais, Nadeau, Gidengil and Nevitte2001). If so, voting for a new party would cause incongruence rather than the other way around. Hence, these two additional measures exogenise the party positions. This allows us to test whether voters also manage to ‘objectively’ maximise their utility by voting for a new party when established parties ‘actually’ (according to the average voter or highly educated voters) stand further away.
As for the controls, we consider a person's dissatisfaction with how democracy works in their country and the state of the economy. We consider several sociodemographic variables like party attachment (e.g., Campbell et al. Reference Campbell, Gurin and Miller1954), gender (e.g., Eckel & Grossman Reference Eckel and Grossman2008), age (e.g., Schmitt‐Beck et al. Reference Schmitt‐Beck, Weick and Christoph2006) and education (e.g., Dalton Reference Dalton, Dalton and Wattenberg2002). Finally, we consider strategic voting by including the number of seats to be won in the respondent's electoral district and the institutionalisation of the party system (voters have more information to act strategically in institutionalised party systems). For more detail about the operationalisations, we again refer to Table A2 of the Supporting Information.
The dependent variable is binary. Therefore, we run logistic regression models with clustered standard errors at the election level. The model specifications, descriptive statistics and case selection are displayed in Tables A1, A2 and A5 of the Supporting Information.
Results
Descriptive statistics
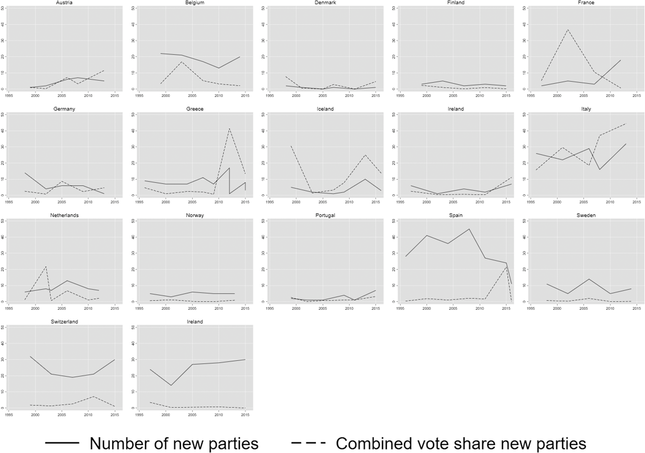
Figure 1 depicts the number of new parties and their combined vote share throughout the joint time span (1996–2016) and across the countries included in either one or both of our studies. As shown, party entry and new party success remain highly relevant phenomena, also in consolidated democracies. Importantly, the amount and success of new parties differs between countries and periods. Below we examine to what extent this variation is due to party–voter incongruence.
Number of new parties and their combined vote share, 1996–2016.
Source: Own calculations.

Study 1: Do new parties respond to party–voter incongruence?
Because our estimators are nonlinear, for continuous independent variables we report the increase in the expected number of new parties if the independent variable increases along its interquartile range. The Poisson regression coefficients on which these effects are based can be found in Tables A7–A10 of the Supporting Information (Model 3). As explained above, due to the small number of cases, we evaluate the effect of party–voter incongruence and democratic dissatisfaction by only controlling for average district magnitude. Yet, in Tables A7–A10 of the Supporting Information, we show that we reach the same conclusions if instead of district magnitude, we add the other controls to the model each in turn. The results also hold if we simultaneously add all controls.
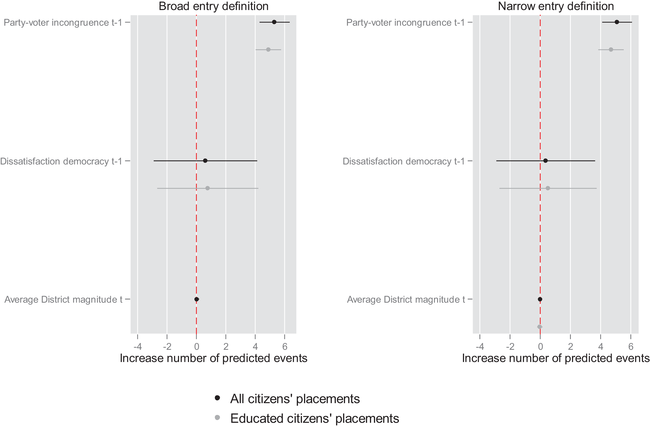
Figure 2 depicts the results for our New Party Entry Hypothesis (H1), which states that party entry will increase with party–voter incongruence. The graph on the left shows the results based on our broad entry definition, while the graph on the right focuses on the narrow definition. We find strong support for H1: the effect of party–voter incongruence is positive and statistically significant in each model. Thus, the findings hold for both the broad and narrow definitions of entry and regardless of whether we use the party placements of all respondents or only of higher educated respondents to measure incongruence. Hence, party entry rates increase in response to the incongruence experienced by the electorate as a whole, but they also respond to a measure that might come closer to the actual situation in the party system.
Explaining the number of new parties (H1). [Colour figure can be viewed at wileyonlinelibrary.com]
Note: Values represent the change in the number of new parties if the independent variable shifts from its sample 25th to 75th percentile based on the regression coefficients reported in the Appendix in the Supporting Information (Tables A7–A10, Model 3). In the Appendix in the Supporting Information, we also show that our findings hold if instead of district magnitude, we control for party system institutionalisation, GDP growth, voter turnout, ENEP, party system nationalisation, rules on new party establishment or for the degree of corporatism. The lines reflect 95% confidence intervals based on robust clustered standard errors at country level N = 47.

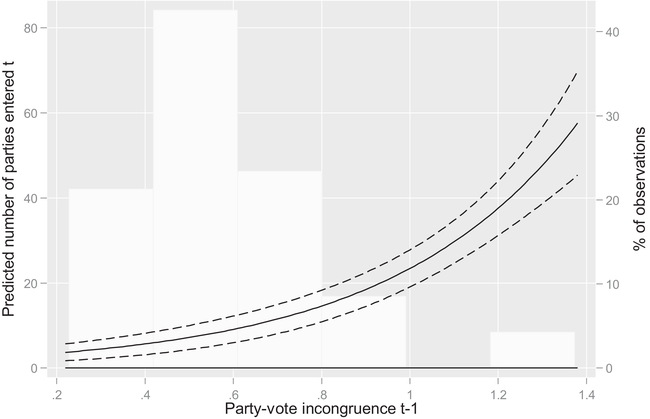
To illustrate effect size, if party–voter incongruence increases along its interquartile range (i.e., from 0.44 to 0.70 along a scale which ranges from 0.2 to 1.4), the number of new parties increases with 5.32 (Broad definition). Figure 3 graphs the predicted number of new parties along the entire range of incongruence based on Model 1 (Figure 2, left graph). As shown, the effect is clearly nonlinear and the very strong effect at very high levels of incongruence is not supported by many cases in the data (see histogram in the back). Nonetheless, an increase of party–voters incongruence from its 25th (0.44) to its 75th percentile (0.70) would increase the number of new parties from 6.22 to 11.54 parties, which roughly corresponds with an increase from its 50th to its 70th percentile. This is a significant shift.
Predicted margins entry (H1).
Note: The y‐axis depicts the predicted number of new parties alongside increasing values of party–voter incongruence (x‐axis) based on the regression coefficients reported in the Appendix in the Supporting Information (Table A7, Model 3). 95% CI.

As for the controls, we find no evidence that dissatisfaction with democracy increases party entry rates. Hence, contrary to new democracies (see Sikk Reference Sikk2012), capitalising on political discontent is not a systematic mobilisation strategy in consolidated democracies. Also, the effect of district magnitude is insignificant. Thus, a disproportional system does not discourage new parties from entry.
Study 2: Does the relative positioning of the new party affect the new party vote?
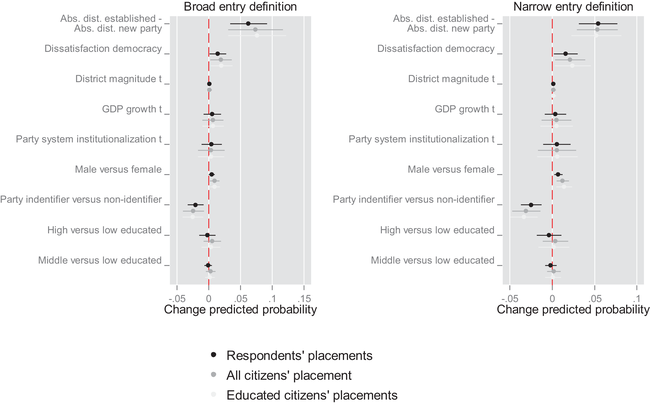
Our New Party Voter Hypothesis (H2) explores how the relative positioning of the most proximate new party to the most proximate non‐new party affects the new party vote. For continuous independent variables, we show how the predicted probability of new party voting increases if the variables increase along its interquartile range. For binary variables, we simply depict the difference in the predicted probability between said category and the reference category. As shown in Figure 4, for an interquartile shift (i.e., from −4 to −1 on a scale ranging between −10 and 10) of distance reduction in favour of the most proximate new party, the probability (between 0 and 1) of voting for the new party increases with 0.06, p < 0.01, Model 1, Broad definition). This effect again holds against our broad and narrow definition of entry and regardless of whether we use only the party placements of the respondent, all respondents or highly educated respondents. Hence, also H2 is firmly supported.
Explaining new party support (H2). [Colour figure can be viewed at wileyonlinelibrary.com]
Note: Values represent the change in the predicted probability that a person will vote for a new party based on the regression coefficients reported in the Appendix in the Supporting Information (Tables A11–A16, Model 10). In case of continuous variables, the value depicts the effect of a shift from its sample 25th to 75th percentile, while in case of binary variables, it compares the difference in the predicted probability between the two categories. The lines reflect 95% confidence intervals based on robust clustered standard errors clustered at the respondent level. Throughout the different models the N ranges between 18,323 and 23,338.

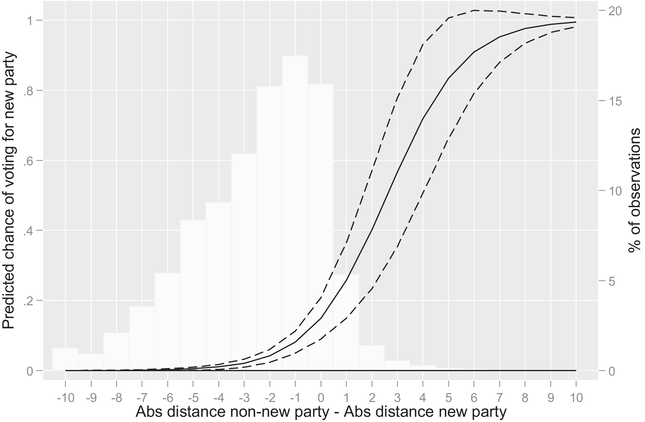
Figure 5 displays the predicted probabilities. If we move from a situation where the closest established party stands four units closer than the new party (the 25th percentile) to a situation where the established party only stands 1 unit closer (the 75th percentile), the probability of voting for the new party increases from 0.01 to 0.07. This is an effect of considerable size. Nonetheless, the results also signal that voters are still much more likely to support an established party when both stand equally close (zero on the x‐axis): in that case the probability of voting for a new party is 0.15. Why is that so? One plausible explanation offered by spatial modellers holds that in addition to ideological proximity, voters also incorporate a valence term (i.e., the parties’ scores on dimensions like reputations for handling policy) in their utility functions (Adams & Merrill III 2009; Schofield Reference Schofield2003). If two parties have the same policy position, voters will support the party with the strongest valence. It seems not too farfetched that they will generally ascribe higher valence to established parties than to new ones. They have no information from previous elections whether the new party will be able to acquire representation and what it will do if elected. Thus, owing to this valence disadvantage, to benefit strongly from sincere voting, new parties must offer a left–right position that clearly distinguishes them.
Predicted probabilities voting for new party (H2).
Note: The y‐axis depicts the predicted probability of voting for a new party as opposed to a non‐new party alongside increasing relative proximity of the most proximate new party as compared to the most proximate non‐new party (x‐axis) based on the regression coefficients reported in the Appendix in the Supporting Information (Table A11, Model 10). (95% CI).

As for the controls, contrary to new party entry (H1), new party support is driven by dissatisfaction with democracy. Thus, new parties are not only supported because of policy reasons (see above), but also because voters wish to cast a protest vote. Yet, a shift along the interquartile range of ideological distance has a much larger effect than such a shift on dissatisfaction with democracy (Figure 4). Thus, policy reasons are much more important than protest attitudes. Regarding the sociodemographic controls, there is strong support across all models that new party support decreases with an individual's level of party identification. Also, all but one of the models suggest that men appear more likely than women to take the risk of voting for a new party. Finally, analogous to the party entry analyses, district magnitude does not deter individuals from supporting a new party. Hence, new party voters are sincere rather than strategic.
Sensitivity analyses
In the Supporting Information, we show that our results for H1 hold when we use different estimators (Poisson, OLS with logged dependent variable and negative binominal) and approaches to calculate the standard errors (independent, clustered and jackknifed) (Supporting Information, 2.1), when we calculate party–voter incongruence with Golder and Stramski's (Reference Golder and Stramski2010) formula (Supporting Information, 2.2), and when we interact incongruence with party system nationalisation (Supporting Information, 2.3). We also justify our assumption that party–voter incongruence should be calculated by weighting the perceived party positions by their seat shares (Supporting Information, 2.4). As for H2, the findings hold if we only consider the distance of respondents to the non‐new parties (Supporting Information, 3.1). Also, we demonstrate that new party voters were significantly more likely to vote for the new party because it stood closer to their ideal point compared to all other alternatives in their choice set (Supporting Information, 3.2). Furthermore, concerning both H1 and H2, we reach the same conclusions if we calculate incongruence based on expert survey data (Supporting Information, 4.1) and when party–voter incongruence is interacted with electoral system proportionality (Supporting Information, 4.2). Finally, we provide more details on the new parties included in our analysis of H1 (Supporting Information, 4.3) and our results hold if we measure the impact of crisis with dummy variables (Supporting Information, 4.4).
Conclusion and discussion
In this article, we examined whether new parties enter when open space in the party system emerges and whether voters will reward new parties for doing so. Studying this is important, as these ideas form the core of representative democracy. Our studies on party entry and new party voting jointly cover 17 advanced democracies between 1996 and 2016 and provide firm empirical evidence that aggregate party entry rates indeed increase with party–voter incongruence (H1). At the level of individual voters, the propensity of new party voting increases the closer the new party stands compared to the established parties (H2). Hence, new parties emerge when there is ideological incongruence, or open space, in the system. New party voters, in turn, are primarily policy voters that look for a way to reduce their incongruence.
Our article provides several important contributions. First and foremost, we were the first to provide systematic empirical evidence for one of the main building blocks of spatial theory, namely that new parties will emerge when voter preferences are left unattended and that new party voters will reward them for doing so. This is highly relevant for game theoretic models that have been, and are being, developed based on this assumption (Besley & Coate Reference Besley and Coate1997; Bol et al. Reference Bol, Matakos, Troumpounis and Xefteris2019; Greenberg & Shepsle Reference Greenberg and Shepsle1987; Kselman & Tucker Reference Kselman, Tucker, Schofield and Caballero2011; Osborne Reference Osborne2000; Osborne & Slivinski Reference Osborne and Slivinski1996; Palfrey Reference Palfrey1984), for agent‐based modellers who build their models based on this assumption (Laver & Sergenti Reference Laver and Sergenti2011) and for the literature on new party entry that predominantly focuses on how structural and institutional features of a polity shape affect entry (e.g., Harmel & Robertson Reference Harmel and Robertson1985; Hug Reference Hug2001; Tavits Reference Tavits2006). Recently, this literature has also begun to consider more dynamic elements like voter discontent (Sikk Reference Sikk2012; Tavits Reference Tavits2006), party collapse (Laroze Reference Laroze2019), voter turnout (Lago & Martínez Reference Lago and Martínez2011), slack in the issue agenda (Lowery et al. Reference Lowery, Witteloostuijn, Péli, Brasher, Otjes and Gherghina2013), or the effective number of parties (Kselman et al. Reference Kselman, Powell and Tucker2016). Nonetheless, how short‐term electoral market dynamics affect entry has remained underexposed. Also, these studies do not directly tap into the mismatch between voters’ ideological demands and the policies offered by parties. We show that new party elites are able to directly respond to party–voter incongruence. Future studies on strategic entry are thus well‐advised to incorporate party–voter incongruence in their models.
Second, we contribute to the literature that studies why people support new parties. Existing studies focus on individual new parties (e.g., Van der Brug Reference Van der Brug2003), or on the aggregate support for a specific (new) party family (Abedi Reference Abedi2002; Arzheimer & Carter Reference Arzheimer and Carter2006; Kitschelt Reference Kitschelt1988; Spies & Franzmann Reference Spies and Franzmann2011). These studies find that these parties are supported because of their policy proximity to the respondent (Passarelli & Tuorto Reference Passarelli and Tuorto2018; Van der Brug Reference Van der Brug2003) or because established parties have converged to the centre (e.g., Kitschelt Reference Kitschelt1988, Reference Kitschelt1994; Spies & Franzmann Reference Spies and Franzmann2011). Based on the largest sample of new party voters hitherto available, we show that voters consider their own policy positions and those of new and established parties in their choice for a new party. This requires a high level of information and rationality from voters. Hence, we cast new light on the political knowledge literature. While after a review of this literature, Luskin (Reference Luskin and Kuklinski2002: 282) concludes that compared to elites, ‘citizens think and know jaw droppingly little about politics’, we find that the most important reason why voters cast their ballot for a new party is that it stands closer to their ideal point. This result holds if we move beyond voters’ own perception of where the parties stand. As such, new parties should not be discouraged by pessimistic accounts on the political knowledge and rationality of voters. That said, our finding that voters prefer an established party over a new party when both stand equally close suggests that established parties do enjoy a valence advantage (see also Adams & Merrill III Reference Adams and Merrill2009; Schofield Reference Schofield2003).
This article also has limitations, which raise questions for further research. First, a drawback of using voter perceptions of party positions is that the number of elections in the CSES is limited. Therefore, we could only test H1 based on a sample of 47 elections. We stress that these elections took place in a large number of different party systems in a timespan of nearly two decades. Furthermore, our findings hold when we jackknife the data (Supporting Information, 2.1), or test H1 on a different sample of 74 elections where expert survey data are used to measure party positions (Supporting Information, 4.1). Still, we should be careful to generalise across time and space.
A second weakness applies in particular to our analyses on new party voters. Although our study on new party entry looked at all new parties, in our voter dataset there are more respondents that voted for electorally successful new parties. Since the CSES works with a sample representative of the population, one will always end up with very few respondents that vote for new parties without electoral success. Thus, we must be aware that voters for successful new parties carry a higher weight in our analysis of H2.
Finally, while we provide a systematic test of spatial models with an entry decision, we are well aware that other models of elections exist that combine spatial and saliency‐based competition (e.g., Meguid Reference Meguid2008). Constructing a measure of incongruence that simultaneously considers a mismatch between positions and issue priorities lies beyond this study's scope but would be a worthwhile endeavour. We hope that we have set an important first step by providing a systematic empirical test of how incongruence on the general left–right dimension affects party entry and new party support.
Acknowledgements
This research was supported by postdoctoral research grants from the Research Foundation Flanders ‘FWO’ (Grant number: FWO16/PDO/198) and the Fund for Scientific Research (F.R.S.‐FNRS) (Grant number: 28091302). We would like to thank Raimondas Ibenskas, Zach Warner, the participants in the GASPAR seminary and ECPR General Conference 2018 panel ‘The study of party entry and exit in old and new democracies’ and the two anonymous reviewers for their insightful comments. We thank Sigrid van Trappen for her excellent research assistance.
Online Appendix
Additional supporting information may be found in the Online Appendix section at the end of the article:
Table A1. Definitions and model specifications.
Table A2. Descriptive statistics, operationalisations and data sources.
Tables A3–A4. Case selection H1.
Tables A5–A6. Case selection H2.
Tables A7–A10. Regression coefficients H1.
Tables A11–A16. Regression coefficients H2.
Table A17. Conditional logit model.
Tables A18–A22. Measuring crisis with dummy variables.
Figures A1–A9. Alternative model specifications for H1.
Figures A10–A21. Results for other robustness tests.


 Open access