


1 Introduction
1.1 Background
The above-average effect refers to the tendency to perceive oneself as better than the average person across different aspects. Reference KrugerKruger (1999) was the first to present instances of the opposite – a below-average effect – the tendency to view oneself as worse than the average person, and he proposed that this opposing effect depends on the difficulty of the ability domain. The above-average effect was observed when self-perceived skills in an ability domain were high, whereas the below-average effect occurred when self-perceived skills were low. Hence, Kruger identified the two effects’ underlying mechanism to be the egocentric nature of comparative ability judgments and suggested an anchoring-and-adjustment account. Individuals anchor onto their own skills and then adjust away from their own anchor when judging the skill of others. Therefore, when considering easy activities, people perceive their ability/skill as high and display the above-average effect, thus failing to account for the “true” distribution curve of such abilities/skills which includes others who are also highly skilled. When activities are difficult and hence absolute domain ability is generally low, a below-average effect results from the failure to consider that others are also not highly skilled.
This result was first operationalized in Study 1 in Reference KrugerKruger (1999) using a questionnaire in which participants first compared themselves with their peers on four relatively easy and four relatively difficult ability domains (or activities). Participants then answered a series of questions concerning: 1) estimates of their own and classmates’ absolute abilities (termed “comparative ability”); 2) desirability; 3) ambiguity of each ability; and 4) past experience of each ability. A strong negative correlation between domain difficulty and participants’ comparative ability judgments supported both above and below-average effects (Reference KrugerKruger, 1999). The study demonstrated correlational evidence for the egocentric nature of comparative ability judgments, in the form of a strong positive correlation between participants’ ratings of their own and their comparative abilities. For all ability domains, participant judgments of their own absolute abilities better predicted their comparative ability judgments than did participants’ judgments of their peers’ skills. Additional experimental studies (2 and 3 in Reference KrugerKruger, 1999) used a situation in which participants received either a very easy or a difficult test, leading to similar results as in Study 1. The anchoring-and-adjustment account was deemed consistent with the fact that cognitive load increased bias during comparative ability judgments.
We conducted a close replication and extensions of Reference KrugerKruger (1999) with two main goals; 1) test the robustness of above- and below-average effects, and 2) examine extensions to test whether ambiguities regarding domain difficulty may moderate this effect. Two between-subject conditions were added to the original design to test whether an easier or more difficult version of Kruger’s original ability domains would moderate the effects. Furthermore, we added an additional dependent variable to assess the phenomenon using ratings of perceived domain difficulty more directly. We begin by introducing the literature on above-and-below-average effects and the choice of target article for replication, then provide information on the original findings, and outline our added extensions.
1.2 Above-and-below-average effects
In the 1980s, researchers began to assess subjects’ self-evaluations in relationship to their peers with the results showing over-estimations of own chances for positive outcomes compared to the average population (e.g., Reference WeinsteinWeinstein, 1980, Reference Weinstein1983). Focusing on comparisons with others, the phenomenon became later known as above or better-than-average effect (Reference KrugerKruger, 1999). Research picked up quickly on the above-average effect, testing boundary conditions such as culture (Reference Heine and LehmanHeine & Lehman, 1997) or self-appraisal (Reference Wilson and RossWilson & Ross, 2001). Reference KrugerKruger (1999) was the first to add that there is not only an above- but also below-average effect.
1.2.1 Underlying mechanisms
Throughout the last decades, a range of different underlying mechanisms was proposed to explain the above-average effect (less research focused on the below-average effect), such as informational differences (i.e., knowing more about oneself than others), focalism (i.e., focussing on oneself during comparative judgments), naïve realism, and egocentrism (Reference BrownBrown, 2012). The final mechanism was also used in the chosen study for replication (Reference KrugerKruger, 1999); when people assess how they compare with their peers, they may focus egocentrically on their own skills and insufficiently account for the skills of the comparison group. However, Reference KrugerKruger (1999) reported not only an above-average effect, but also a below-average effect, both explained by egocentrism.
1.2.2 Theoretical grounding
Originally, the above-average effect has been described as motivated by self-enhancement needs (i.e., to induce positive affect towards oneself) or a byproduct of motivated reasoning (Reference AlickeAlicke, 1985; Reference BrownBrown, 1986; Reference KundaKunda, 1990; Reference Taylor and BrownTaylor & Brown, 1988). Self-enhancement enables the maintenance of a global self-concept allowing for both positive attributes under personal control and negative attributes resulting from factors beyond personal control (Reference AlickeAlicke, 1985).Footnote 1 Self-verification can be used as another explanation for the above-average effect (Reference Zell, Strickhouser, Sedikides and AlickeZell et al., 2020). Expanding on self-enhancement, the self-verification theory describes that both self-enhancement and exposure to information which creates and strengthens a biased view of oneself can lead to phenomena such as the above-and-below-average effects (Reference Zell, Strickhouser, Sedikides and AlickeZell et al., 2020). In that sense, higher self-esteem has been linked with stronger above-average effects (e.g., Reference Bosson, Swann and PennebakerBosson et al., 2000; Reference Chung, Schriber and RobinsChung et al., 2016). Support for the motivational perspective and the ubiquity of the above-average effect was provided by those objectively being below-average in certain characteristics displaying the above-average effect (e.g., Reference Sedikides, Meek, Alicke and TaylorSedikides et al., 2014). For instance, prisoners comparing themselves with non-prisoners on pro-social characteristics rated themselves as above-average in most characteristics (Reference Sedikides, Meek, Alicke and TaylorSedikides et al., 2014). Another explanation can be found in social comparisons during which people evaluate their social position compared to relevant peers – with the tendency of positioning oneself as higher-standing (Reference Gerber, Wheeler and SulsGerber et al., 2018). An example of both effects applying during social comparisons is when Democrats and Republicans compare their own warmth and competency with the average person of their in- and out-group (Reference Eriksson and FunckeEriksson & Funcke, 2013). In-group comparisons lead to below-average ratings for warmth among Democrats and above-average effects among Republicans, which reversed for outgroup comparisons (Reference Eriksson and FunckeEriksson & Funcke, 2013). Above-and-below-average effects have also been found to vary across ages, with egocentrism accounting for age differences (Reference Zell and AlickeZell & Alicke, 2011). Young, middle-aged, and older adults displayed an above-average effect for most ability and trait dimensions, whereas a below-average effect was observed for older adults with clear deficiencies (Reference Zell and AlickeZell & Alicke, 2011).
1.2.3 Follow-up research
Due to the large number of citations of Kruger’s (1999) findings, it is difficult to generalize the publication’s impact. However, focusing on follow-up research on the above and below-average effects’, more recent studies provided information about the effects’ wide applicability and boundary conditions, with a large body of work supporting the original findings (e.g., Reference Aucote and GoldAucote & Gold, 2005; Reference Burson, Larrick and KlaymanBurson et al., 2006; Reference Johansson and AllwoodJohansson & Allwood, 2007; Reference Sweeny and ShepperdSweeny & Shepperd, 2007). For example, building on the original findings, Reference Giladi and KlarGiladi and Klar (2002) demonstrated that individual items within a positive group tend to be rated as above-average and individual items within a negative group tend to be rated as below-average. These effects can be reversed depending on the timing of the denotation of the target item, which affects the direction and size of the comparative biases (Reference Windschitl, Conybeare and KrizanWindschitl et al., 2008b).
Much subsequent research also continued to explore underlying mechanisms, such as motivations and debiasing factors influencing egocentrically biased comparative judgments. Reference Epley and CarusoEpley and Caruso (2004) discussed how unconscious, automatic features of human judgment result in egocentric judgments that appear objective to the judges themselves. Reference Windschitl, Rose, Stalkfleet and SmithWindschitl et al.’s (2008a) experiments attempting to debias over-optimism for easy tasks and under-optimism for hard tasks through feedback was only successful under restrictive conditions. Yet, their results support the pervasiveness of egocentric biases as participants failed to generalize non-egocentric tendencies to new contexts.
1.3 Choice of study for replication
Reference KrugerKruger’s (1999) work made an important contribution to the field by introducing the below-average effect and conditions in which occurs, which adds to the understanding of a highly prevalent effect with importance to daily reasoning. A recent meta-analysis of better-than-average-effect studies found the effect to be robust across studies, yet, with the effect being smaller for abilities compared to personality traits (Reference Zell, Strickhouser, Sedikides and AlickeZell et al., 2020). Problematically, definitions and measurement of skill are incongruent which leads to biased assessment and operationalizations differ strongly between studies testing above-and-below average-effects, generally (Reference Zell, Strickhouser, Sedikides and AlickeZell et al., 2020), and in specific contexts such as drivers’ overconfidence in their driving skills (Reference SundströmSundström, 2008). Hence, despite the prolific literature that followed, the above-average effect’s robustness has been repeatedly called into question (Reference SundströmSundström, 2008; Reference Zell, Strickhouser, Sedikides and AlickeZell et al., 2020).
However, some studies failed to conceptually replicate mechanisms and boundary conditions originally reported by Kruger, such as the relationship of estimates about others in relationship to estimates about oneself. For example, Reference Moore and KimMoore and Kim (2003) found mixed evidence for the relationship between comparative ability and the evaluations of others’ ability. This was also shown in a practical context by Reference Walsh and AytonWalsh and Ayton (2009). After presenting an imaginary scenario in which a doctor provides information about a serious diagnosis applying to the participant and how that affects others’, own happiness estimates by participants were indeed influenced by information about others’ happiness.
We chose Reference KrugerKruger’s (1999) study for replication based on the following factors: impact, open questions about boundary conditions of the above and below-average effects, and absence of direct replications. To the best of our knowledge, no direct replications of Reference KrugerKruger (1999) have been publshed. Yet, the article has had a significant impact on several scientific and practical fields, including management (Reference Bazerman and MooreBazerman & Moore, 2012), economy (Reference DellaVignaDellaVigna, 2009; Reference Koellinger, Minniti and SchadeKoellinger et al., 2007), medicine (Reference Stewart, Brown, Weston, McWhinney, McWilliam and FreemanStewart et al., 2013), education, or the workplace in general (Reference Dunning, Heath and SulsDunning et al., 2004). At the time of writing (May 2021), there were 1178 Google Scholar citations of the article and many important follow-up theoretical and empirical articles (Reference Chambers and WindschitlChambers & Windschitl, 2004; Reference Moore and SmallMoore, 2007; Reference Moore and CainMoore & Cain, 2007; Reference Moore and SmallMoore & Small, 2007; Reference Whillans, Jordan and ChenWhillans et al., 2020; Reference Windschitl, Conybeare and KrizanWindschitl et al., 2008b). We chose Study 1, as it was the first demonstration of the core phenomenon. We aimed to revisit this classic phenomenon in a well-powered preregistered close replication (e.g., Reference Brandt, Ijzerman, Dijksterhuis, Farach, Geller, Giner-Sorolla and VeerBrandt et al., 2014).
1.4 Original hypotheses in target article
In the original study, participants compared themselves to their peers on eight ability domains of varying difficulty. Kruger proposed that (Horig1:) compared to judgments of their peers’ abilities, people’s judgments of their own abilities account for more variance in their comparative ability judgments.
Past research on reasons for people’s tendency to focus on their own ability when comparing themselves to others offers insight on why comparative ability judgments are egocentric in nature. One’s own skills are more likely to be assessed first when comparing the self to others (Reference Srull and GaelickSrull & Gaelick, 1983), are easier to conceptualize than skills of the average person (Reference Higgins, King and MavinHiggins et al., 1982; Reference Higgins and BarghHiggins & Bargh, 1987; Reference Srull and GaelickSrull & Gaelick, 1983), and have a larger database to refer to than others’ skills (Reference Ross and SicolyRoss & Sicoly, 1979). These explanations formed the basis of Kruger’s primary hypothesis. When comparing one’s own ability to peers’ ability, assessments are predominantly based on the perception of one’s own skills and less on the perceptions of peers’ skills, and therefore, perceptions of one’s own absolute ability better predict comparative ability judgments.
Based on that, Kruger proposed that (Horig2:) people tend to perceive themselves as above average when considering easy abilities, and that (Horig3:) people tend to perceive themselves as below average when considering difficult abilities. We merged the dichotomized hypotheses to propose that the more difficult the ability domain is perceived to be, the more likely a person is to shift from perceiving oneself as above average to perceiving oneself as below average.
1.5 Original findings in target article
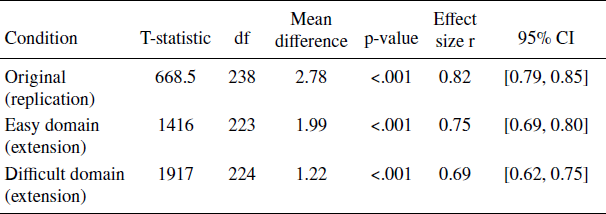
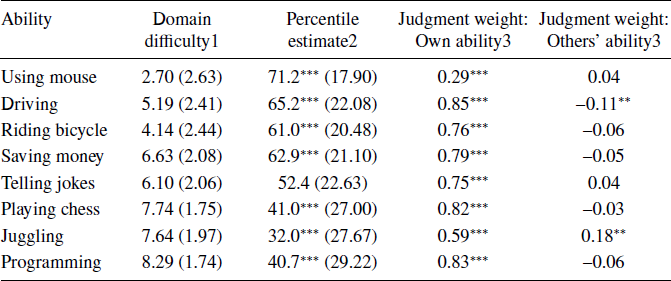
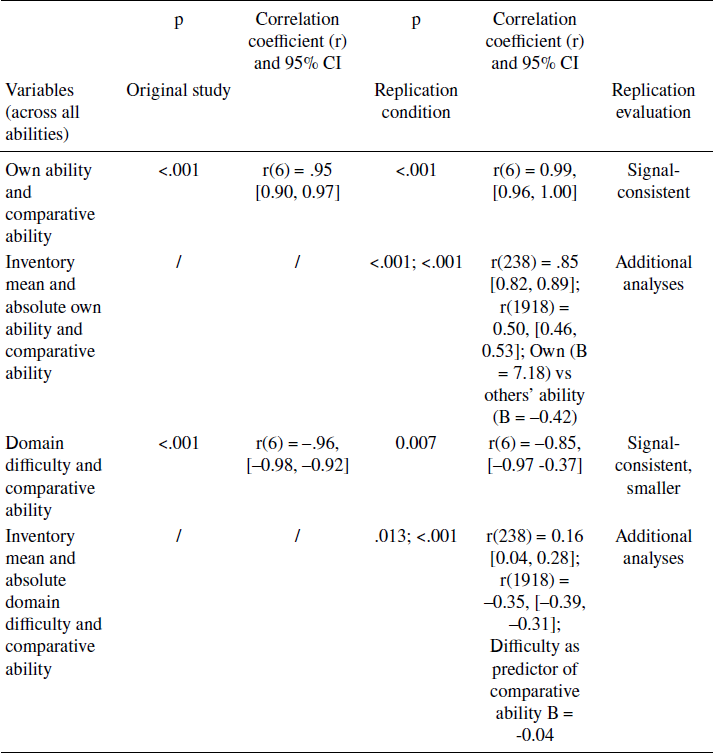
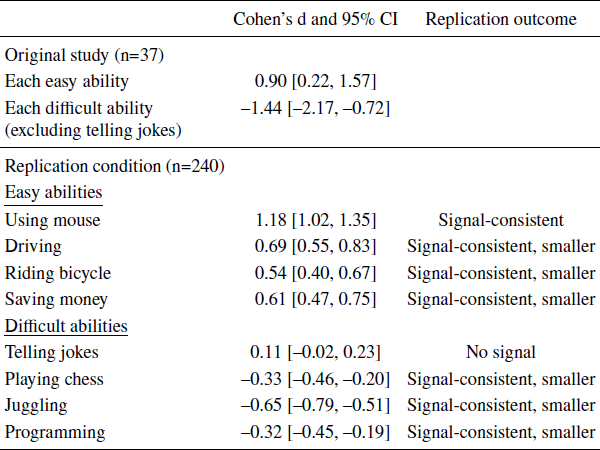
Reference KrugerKruger (1999) used a combination of correlational studies, one-sample t-tests, and multiple regression and found support for all hypotheses (Table 1). Above and below-average effects were prevalent for all but one difficult item: telling jokes. He observed an inverse association between the domain difficulty and comparative ability: as ability domains increased in difficulty, the perception of their comparative ability decreased. Participants believed to be above average for easy abilities and below average for difficult abilities.

1 Higher numbers reflect greater difficulty.
2 Mean percentile estimates above 50 reflect an above-average effect, estimates below 50 reflect a below-average effect.
3 Standardised betas from multiple regressions predicting participants’ comparative ability (percentile) estimates from their estimates of their own absolute ability and the absolute ability of their peers, respectively.
* p < .05.
** p < .01.
*** p< .001.
**** p < .0001.
To examine the relationship between one’s own absolute ability and comparative ability judgments, we conducted multiple regressions predicting comparative ability from their own ability, and others’ ability for each of the eight abilities. Participants’ perception of their own ability better predicted their comparative ability judgments. Participants anchored onto their own absolute ability, as opposed to their peers’ absolute ability when comparing themselves to others across ability domains. Here we summarize effect sizes and power analysis for the original study results in the sections “effect size calculations of the original study effects” and “power analysis of original study effect to assess required sample for replication” in the OSF supplement.
1.6 Extensions to the Original Study Design
1.6.1 Extension 1: Manipulating domain difficulty
We aimed to extend the replication study by considering the ambiguities in the definitions of easy and difficult used in the domains of the original study. The ability domains in the target article were only succinctly described (see Table 2). Each ability domain may connote different meanings, depending on how participants interpret the domains. For instance, the ability “saving money” was categorized as an easy ability. Yet, the amount of money saved was not specified, and that may matter for perceived difficulty, as saving 3% of income per month is likely to be perceived as easier than saving 20% of income per month.
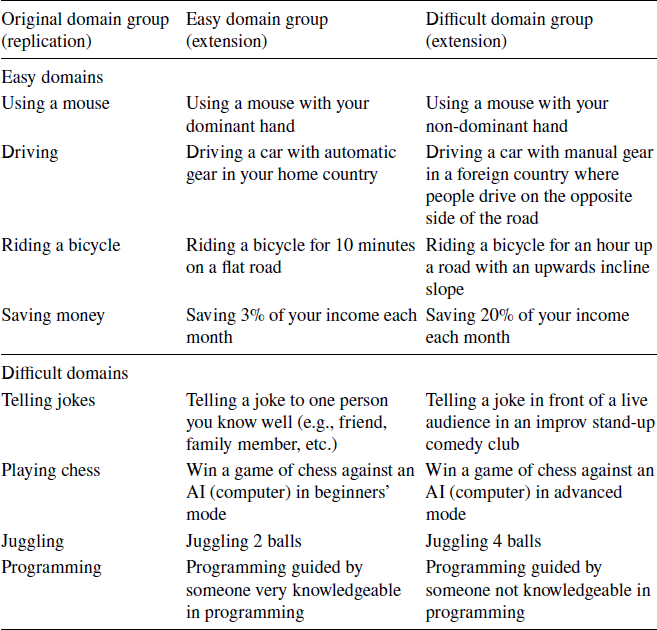
Therefore, we manipulated domain difficulty. In our replication, we randomly assigned participants to one of the three conditions receiving different definitions of the ability domains, either: 1) original domain condition (replication); 2) easy domain condition (extension) with an easy reinterpretation of the original domains; or 3) difficult domain condition (extension) with a difficult reinterpretation of the original domains (Table 2).
For the two extension groups, the extension domains aim to be specifically defined in measurable terms. More context is provided for the domains to be more specific, such as the hand used (dominant versus non-dominant hand) for using a mouse, the location and type of car (home country and automatic gear car versus foreign country and manual gear car) for driving, and the help received for computer programming (someone very knowledgeable versus someone not very knowledgeable), which is an ability domain most participants may not have experience with. Additionally, an objective measure should be quantitatively determined in units that can be measured (e.g., length of time, amount of money) or counted (e.g., number of people; Reference Roth, Schroeder, Huang and KristalRoth et al., 2008). Therefore, the extension domains also use criteria such as time (10 minutes versus 1 hour), number of people (one person versus a live audience in an improv stand-up comedy club), and difficulty (beginner mode versus advanced mode).
1.6.2 Extension 2: Measuring domain difficulty
For the second extension, we added an additional dependent variable measuring domain difficulty. In the original study, domain difficulty was determined in a pretest by a separate group of participants (n = 39). They rated their absolute ability – the extent of how skilled they are – on the eight abilities on a 10-point scale (higher number indicates higher skill level): “For this ability, please rate your own ability from 1 (very unskilled) to 10 (very skilled)“. The ratings were then reverse-scored and higher numbers indicated greater domain difficulty. The four ability domains lower than the midpoint of the scale were categorized as easy domains, whereas the four ability domains higher than the midpoint of the scale were categorized as difficult domains.
Due to problems associated with categorizing the continuous variable of the difficulty level of ability domains into easy domains or difficult domains, in the current replication, we measured domain difficulty on a continuous scale: “Please rate the difficulty of this ability from 1 (very easy) to 10 (very difficult)”. Details on the adjustment can be found in the section below “adjustments to the original study”. In contrast to the original study, domain difficulty ratings were scored on a similar scale as comparative ability, (own and others’) comparative ability, desirability, and ambiguity.
We examined difficulty ratings across all domains to assess whether perceived difficulty was as expected in the original and conditions in which difficulty was manipulated. For the easy domain condition, we hypothesized that easy interpretations of the original domains would result in lower domain difficulty ratings across all abilities compared to ratings of the original domain group. For the difficult domain condition, we hypothesized that difficult interpretations of the original domains would result in higher domain difficulty ratings across all abilities compared to original domain group ratings. We expected the ambiguity ratings for both easy and difficult conditions to be lower than that in the original’s domains. Additionally, we tested whether comparative ability would be influenced by our easy/difficult manipulations.Footnote 2
1.7 Hypotheses
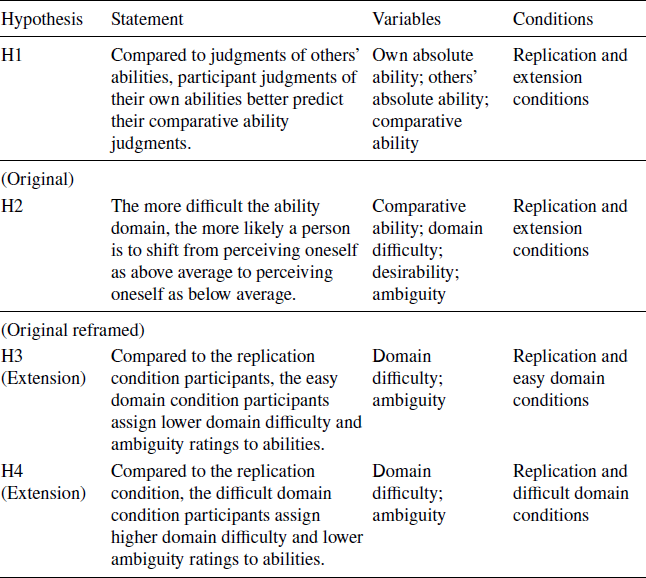
Based on the original study and the current extension hypotheses, this replication aims to test four central hypotheses (Table 3).
1.8 Adjustments to the original study
In the original study, the eight ability domains were divided into two categories: four easy domains and four difficult domains. On a 10-point scale from very easy to very difficult, easy domains had domain difficulty ratings below 5 (the midpoint of the scale), and difficult domains above 5, respectively. The above-average effect was tested for the easy domains, whereas the below-average effect was tested for the difficult domains.
Yet, several issues may arise from treating continuous variables as categorical. First, the categorization of continuous variables, especially dichotomization of placing variables into two groups, might lead to misclassifications, loss of information and power (Reference Naggara, Raymond, Guilbert, Roy, Weill and AltmanNaggara et al., 2011). Second, the loss of power by dichotomizing variables at the median is equal to discarding one-third of the data (Reference CohenCohen, 1983; Reference MacCallum, Zhang, Preacher and RuckerMacCallum et al., 2002). Third, variation between categorized groups may be underestimated as close response scores divided into different groups are defined as being very different instead of very similar. It has thus been suggested to keep variables continuous using methods such as linear regressions instead of t-tests (Reference Altman and RoystonAltman & Royston, 2006).
For the above reasons, we did not assign ability domains to specific dichotomic easy/difficult categories. The above- and below-average-effects were tested on a continuous scale: instead of using one-sample t-tests, correlations were used to test the relationship between domain difficulty and comparative ability in three different ways: item-wise, compiled items in a vector (but not averaging across them), and row-wise averaged for the three conditions. Applying this method is a more direct assessment of perceived difficulty with the same sample. For a full overview of differences between the current and the original study see the OSF supplement, section “Comparisons and deviations”.
1.9 Pre-registration and open science
Before data collection, the experiment was pre-registered (see the OSF supplement). Pre-registrations, power analyses, materials, data, exclusions, manipulations, power analyses, and other details and disclosures are available in the OSF supplement. Data collection was completed before analyses.
2 Method
2.1 Participants and power analyses
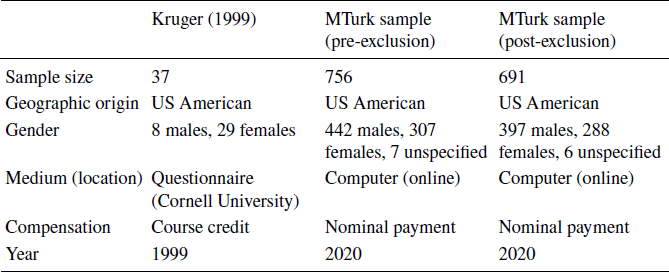
We conducted power analyses in R using the pwr package (Reference Champely, Ekstrom, Dalgaard, Gill, Weibelzahl, Anandkumar and RosarioChampely et al., 2018). The power analyses suggested a sample size of 160 to be sufficient for reaching 95% power with an alpha-level = .05 assuming an effect size of f² = 0.099 (informed by Reference KrugerKruger, 1999) for a 2-factor multiple linear regression analysis (see OSF supplement, section “Power analysis of original study effect to assess required sample for replication”). We tried to exceed this estimate (following replication recommendation such as Reference SimonsohnSimonsohn, 2015) and added extensions thereby leading to the recruitment of 756 Amazon MTurkers. A total of 65 participants failed to meet the pre-registered inclusion criteria and were excluded, resulting in a total of 691 included participants (see Table 1 in the OSF supplement for sample comparison and exclusion details).
2.2 Design
The original study used a within-subject design with one-sample analyses conducted for each condition (easy versus difficult domains), yet in the current replication, we used a 3 (between difficult conditions: original, easy, difficult) x 2 (within difficulty conditions: easy, difficult) mixed-design. All participants were presented with eight items (within-subjects; see Table 2). We used the same methods as in the original study for within-group analyses and added additional analyses for the between-group comparisons (see the OSF supplement for more details and full measures).
2.3 Procedure
Participants were recruited through MTurk on TurkPrime/CloudResearch (Reference Litman, Robinson and AbberbockLitman et al., 2017) and completed questionnaires via a provided “Qualtrics” link after giving consent. Participants were randomly assigned to one of three conditions: 1) Original domains (8 original domains; 4 easy and 4 difficult domains), 2) Easy domains extension (easy reinterpretations of the 8 original domains), or 3) Difficult domains extension (difficult reinterpretations of the 8 original domains).
Based on the categorization in the original study, of the eight ability domains, four were categorized as easy and the other four as difficult (see Table 2), presented in randomized order.
2.4 Measures
The original study had six dependent variables and the current study added an additional dependent variable of perceived domain difficulty. Across all conditions, the dependent variables were measured as participant ratings for each of the eight ability domains (Table 2). We computed Cronbach’s α -scores for the original and extension eight-item scales, first for all domains together, and then divided using the original’s categorization of easy and difficult domains, being αall >.63, αall >.46, α all>.47 (see the OSF supplement section “Reliability for domains across conditions”).
2.5 Exclusion criteria
The following exclusion criteria were pre-registered: 1) low proficiency of English (less than 5 on a scale of 1 to 7); 2) not being serious (less than 4 on a scale of 1 to 5); 3) correctly guessing one of the hypotheses; 4) having seen or done the survey before; 5) failure to complete the survey; and 6) not in or from the United States, to keep sample characteristics as close to the original study as possible.
2.6 Evaluation criteria for replication findings
We compare the replication effects with the original effects in the target article using the criteria set by Reference LeBel, Vanpaemel, Cheung and CampbellLeBel et al. (2019) (See the OSF supplement sections “Criteria for evaluation of replications” and “Replication evaluation”).
We categorized the current replication as a “close replication” and provided details in Table 5. Variables and questions were the same as in the original, with the addition of extensions and adjustments to fit the MTurk sample, instead of Cornell university students.

3 Results
We analyzed the data using R v3.6.3 (R Core Team, 2020), with analyses conducted both on a participant- and an item-level. To allow for a broader assessment of the data, we conducted preprocessing by both calculating mean scores (Table 6 for correlation matrices for each condition), and compiling the values for variables’ eight items (abilities) in their raw form, resulting in 8 rows per participant (see “Correlations per condition” subsection in the OSF supplement for correlation matrices for each condition). For analyses conducted on an item level, participant ratings for each of the eight abilities were examined.
* Ambiguity scores were reversed to indicate increasing ambiguity from 1 to 10.
3.1 Domain difficulty comparisons by conditions
We conducted paired-sample Wilcoxon tests comparing difficulty ratings between the grouped 4 easy and 4 difficult replication/original and extension domain items and found domain difficulty ratings to be higher for difficult abilities across all comparisons (summarized in Table 7, ps < .001), supporting Reference KrugerKruger’s (1999) original categorization.Footnote 3 Hence, all conditions were analyzed as in the original study, including correlations between the variables across the eight domains, and one-sample Wilcoxon-tests testing for the above-average effect in easy ability domains and the below-average effect in difficult ability domains (Tables 8.1–8.3 in the OSF supplement).
3.2 Replication: original domain condition
We conducted all analyses in this section on the original domain condition (n = 240).
3.2.1 H1: Relationship between absolute and comparative ability
In a linear regression model, own and others’ absolute ability ratings predicted mean comparative ability judgments (F(2, 237) = 323.9, p < .001, R adj2 = .73, 95% CI [0.68, 0.79]).Footnote 4 However, we found support only for participants’ judgments of their own absolute ability as predictors of their comparative ability judgments (β = 0.90, t(239) = 19.93, p < .001).
On an item level, we conducted multiple regressions for each of the eight abilities to examine how participants’ estimates of both own and others’ absolute abilities predict comparative ability estimates (see Table 8 for standardized betas). Own absolute abilities were generally better in explaining changes in comparative ability judgments than others’ skills, which supports H1.
Note: Tablepresented as in original study (Reference KrugerKruger, 1999, Table 2) encompassing descriptive statistics, one-sample t-tests, and regressions.
1 Mean (SD) scores for item-wise domain difficulty. Higher numbers reflect greater difficulty.
2 Mean (SD) scores for item-wise comparative ability/percentile estimates. Scores above 50 reflect an above-average effect, estimates below 50 reflect a below-average effect. See supplementary tables 8.1 and 9.1 for test statistics and CI’s.
3 Standardised betas from multiple regressions predicting participants’ comparative ability (percentile) estimates from own absolute ability and peers’ absolute ability, respectively.
** p < .01.
*** p < .001.
For the relationship between absolute and comparative ability ratings across all abilities (240 participants * 8 items), we found a strong relationship between comparative ability estimates and others’ ability ratings (r(6) = 0.94, p < .001, 95% CI [0.71, .99]); and between comparative ability estimates and own ability ratings (r(6) = 0.99, p < .001, 95% CI [0.96, .99]). Reference HotellingHotelling’s (1940) t indicated these correlations to be different from each other (t(5) = 4.66, p = .006).
3.2.2 H1: Additional correlation analyses for the relationship between absolute and comparative ability
When adding two modes of analysis, namely, vector-compiled scores and inventory mean scores Footnote 5, Pearson’s rs, calculated for vector-compiled scores of comparative ability estimates and other’s absolute ability, were r(1918) = 0.50 (95% CI [0.46, 0.53]); and between comparative ability estimates and own absolute ability were r(1918) = 0.81 (95 % CI [0.79, 0.82]); with these correlations being different from each other (Reference HotellingHotelling’s (1940) t(1917) = 27.61, p < 0.001). For inventory mean scores, correlations between comparative ability estimates and other’s absolute ability were r(238) = 0.53 (p < .001, 95% CI [0.43, 0.62]); and between own and comparative ability r(238) = 0.85 ( p < .001, 95% CI [0.82, 0.89]); with these correlations being different from each other (Hotelling’s t(237) = 11.75, p < 0.001).
However, when using a mixed-effects model with random intercepts at the level of participants to explain comparative ability, positive changes in own ability explained positive changes in comparative ability and the relationship between others’ and comparative ability being the opposite (Table 9). The findings from both replicated and the new analyses present strong support for H1.
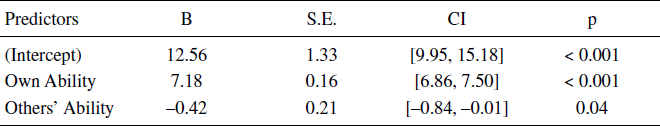
Note. The table presents the fixed-effects coefficients with all the model predictors. See supplementary section “Mixed Models” for step-wise regression results.
3.2.3 H2: Relationship between comparative ability, domain difficulty, and desirability
We conducted one-sample t-tests to examine domain-wise comparative ability ratings using the 50th percentile estimates of comparative ability to classify above and below average effects (as in Reference KrugerKruger, 1999). Similar as in Reference KrugerKruger’s (1999) findings, participants indicated to be above-average for all easy ability domains (ps < .001) and below-average for three of the four difficult ability domains (ps < .001; see Table 8 column 2 for descriptive statistics, and tables 8.1 and 9.1 in the OSF supplement for test statistics and CI’s). For the above and below-average effects across all abilities, we found a strong negative correlation between comparative ability estimates and domain difficulty (r(6) = –0.85, p = .0073, 95% CI [–0.97 -0.37]).Footnote 6 Item-wise comparative-ability-domain-difficulty correlations are provided in the supplementary under ‘Replication condition: Item-wise correlations between domain difficulty and comparative ability ratings for each ability domain’.
When comparing desirability ratings between easy (M = 8.731, SD = 1.01) and difficult ability domains (M = 7.58, SD = 1.40), a paired-samples Wilcoxon test revealed easy abilities to be more desirable (M difference= 1.16, Z(238) = 9.42, p < .001, r = 0.66, 95% CI [0.59, 0.73]). One-sample Wilcoxon tests revealed that all domain-specific desirability scores were higher than the scale midpoint (ps < .001; supplementary Table 9.4). That corresponded with a strong positive relationship between comparative ability and desirability (r(6) = 0.72, p = .0448, 95% CI [0.03, 0.95]).
3.2.4 H2: Additional Analyses for the relationship between comparative ability, domain difficulty, and desirability
Similarly, we found a negative association between comparative ability and domain difficulty ratings when using vector-compiled scores (r(1918) = –0.35, 95% CI [–0.39, –0.31]).Footnote 7 However, when using inventory mean scores, opposite to the original study, we found a positive association between comparative ability and mean domain difficulty ratings (r(238) = 0.16, p = .013, 95% CI [0.04, 0.28]).Footnote 8 As this inventory mean scores correlation did not correspond to the other results, we conducted an exploratory analysisFootnote 9, revealing a small positive correlation between comparative ability and domain difficulty ratings in easy (r(238)= 0.03, 95% CI [–0.10, 0.15], p = .70); and a small negative correlation in difficult ability domains (r(238)= –0.10, 95% CI [–0.23, 0.02], p = .11). Using mixed models with random intercepts at the participant level, H2 was not supported as difficulty did not predict changes in comparative ability (Table 10).
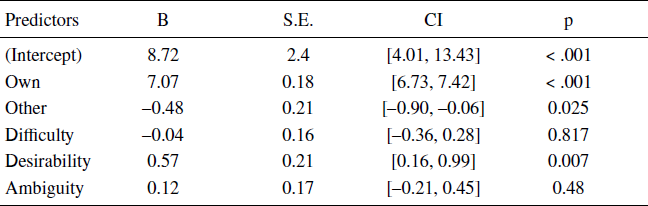
Note. The table presents the fixed-effects coefficients with all the model predictors. See supplementary section “Mixed Models” for step-wise regression results.
The original analysis’ methods provided support for H2. Additionally, a Simpson’s paradox can be observed when averaging all eight domains into one score over various manipulated factors for each participant and then correlating them.Footnote 10
3.3 Extension: Easy domain and difficult domain conditions
3.3.1 Comparative ability for easy and difficult items by conditions
We conducted paired-sample Wilcoxon tests comparing difficulty ratings between the easy and difficult replication/original and extension domains and found comparative ability to be estimated higher for easy abilities across all comparisons (summarized in Table 7, all p < .001).
3.3.2 Relationship between absolute and comparative ability
We conducted multiple linear regression analyses to test how ratings of both own and others’ ability predict comparative ability judgments across all abilities. Models in both conditions predicted variance in comparative ability judgments (F easy(2, 222) = 246.6, p < .001, R adj2 = .69, 95% CI [0.62, 0.76]; and F difficult(2, 223) = 342.9, p<.001, R adj2 = .75, 95% CI [0.70, 0.81]). Yet, the only significant predictors of participants’ own absolute ability were comparative ability judgments in both the easy (β = 0.86, t(222) = 17.32, p < .001) and the difficult domain condition (β = 0.90, t(223) = 15.61, p < .001).
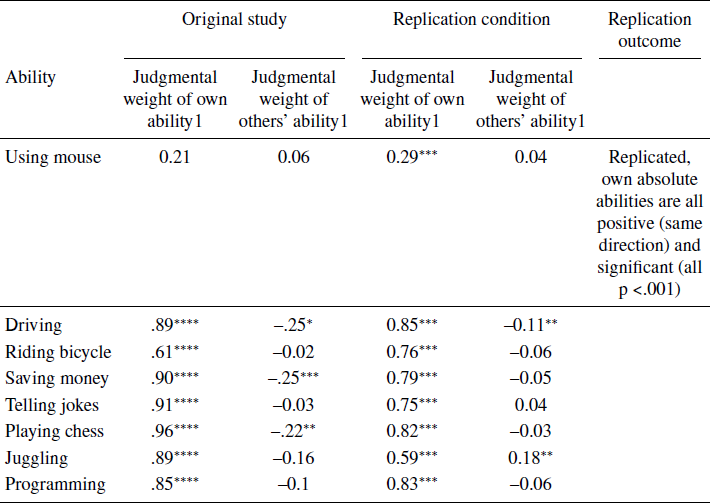
Item-wise multiple linear regression analyses showed, consistent with the original study and replication condition, that extension condition participants weighted own ability estimates stronger than others’ ability estimates when assessing their comparative abilities (Table 11). All standardized betas (β ) of own absolute abilities were positive and ps <.001 (for all abilities), whereas β s of others’ absolute abilities were bi-directional and smaller.
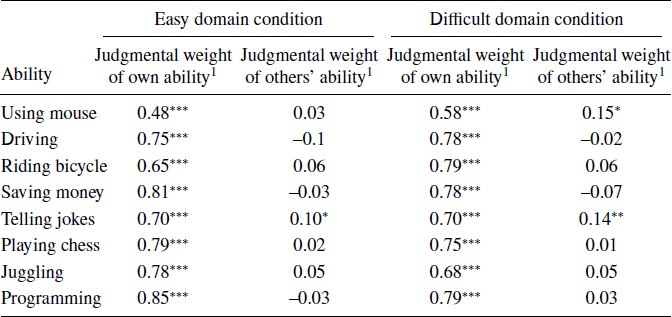
1 Standardised betas (β ) from multiple regressions predicting participants’ comparative ability (percentile) estimates from their estimates of their own absolute ability and the absolute ability of their peers, respectively.
* p < .05.
** p < .01.
*** p < .001.
For the easy domain condition, the correlation between own ability and comparative ability was r(6) = 0.99 (p < .001, 95% CI [0.97, 0.999]); and the correlation between others’ and comparative ability was r(6) = 0.96 (p < .001, 95% CI [0.78, 0.99]); and these correlations were different from each other (Reference HotellingHotelling’s (1940) t(5) = 2.85, p = 0.037). For the difficult domain condition, the correlation between own ability and comparative ability was r(6) = 0.97 (p < .001, 95% CI [0.85, 0.995]); and the correlation between others’ and comparative ability was r(6) = 0.92 (p = .001, 95% CI [0.60, 0.99]); with weaker support found for these correlations as being different from each other (Hotelling’s t(5) = 2.24, p = 0.075).
3.3.3 Additional Analyses: Relationship between absolute and comparative ability
The vector-compiled score correlation for the easy domain condition between own and comparative ability was r(1798) = 0.78 (95% CI [0.76, 0.80]); and between others’ and comparative ability was r(1798) = 0.47 (95% CI [0.43, 0.51]). For the difficult domain condition correlations between own and comparative ability was r(1806) = 0.78 (95% CI [0.76, 0.80]); and between others’ and comparative ability was r(1806) = 0.45 (95% CI [0.41, 0.48]).
Additionally, also mixed models indicated that own ability was a better predictor of comparative ability than others’ ability (Table 12).
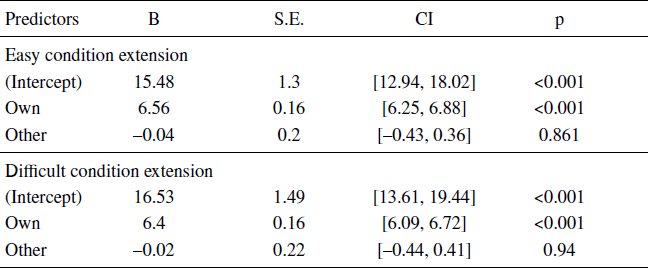
Note. Fixed-effects coefficients with all model predictors. Participants represented the random effect. See supplementary section “Mixed Models” for step-wise regression results.
Inventory mean score correlations for the easy domain condition between own and comparative ability was r(223) = 0.83 (p < .001, 95% CI [0.78, 0.87]); and between others’ and comparative ability was r(223) = 0.52 (p < .001, 95% CI [0.42, 0.61]). In the difficult domain condition the correlation between own and comparative ability was r(224) = 0.87 (p < .001, 95% CI [0.83, 0.90]); and between others’ and comparative ability r(224) = 0.70 (p < .001, 95% CI [0.62, 0.76]).
3.3.4 Relationship between domain difficulty and comparative ability
As indicated above, one-sample t-tests indicated above-average-effect for the easy and below-average effect for the difficult condition (Table 13 for mean scores and SD’s,and Tables 9.2–9.3 in the OSF supplement for test statistics). However, the below-average-effect was not expressed in the easy extension condition, and the above-average-effect was not clearly expressed in the difficult extension condition. Item-wise correlations between comparative ability and domain difficulty for each ability are provided in the OSF supplement under ‘Extension conditions: correlations between comparative ability and domain difficulty ratings for each ability domain’. The easy domain condition contains mixed results of medium to no associations (p <.936), whereas the difficult domain condition contains negative associations for all abilities (p <.001). Congruent with original and replication findings, there were negative relationships between domain difficulty and comparative ability in the easy r(6) = –0.90 (p = .002, 95% CI [–0.982, –0.537])Footnote 11; and difficult conditions (r(6) = -0.75, p = .033, 95% CI [–0.951, –0.092]).Footnote 12
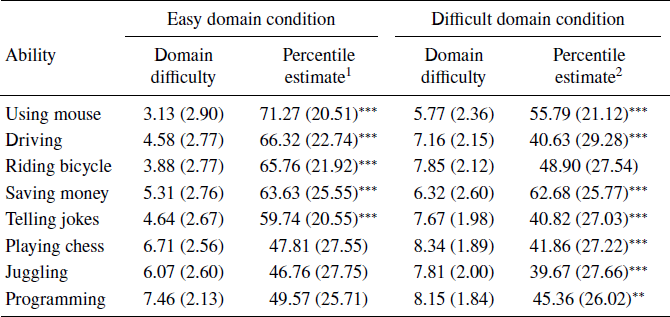
* p<.05
** p<.01
*** p<.001.
Note: Scores are displayed with the following structure: Mean (SD).
1 Scores above 50 reflect an above-average effect, estimates below 50 reflect a below-average effect. See Table 9.2 in supplementary for test statistics and CI’s.
2 See Table 9.2 in supplementary for test statistics and CI’s.
3.3.5 Additional analyses for the relationship between domain difficulty and comparative ability
Congruent with both original and replication findings, correlations between comparative ability and mean domain difficulty were negative for vector-compiled score in the easy (r(1798) = –0.27, 95% CI [–0.31, –0.22]) and difficult (r(1798) = –0.31, 95% CI [–0.35, –0.27]) conditions. When averaging across the inventory (inventory mean scores), this relationship changes to r(223) = 0.32 (p < .001, 95% CI [.19, .43]) in the easy condition and r(223) = –0.13 (p = .0498, 95% CI [–0.26, –0.0002]) in the difficult condition – showing the possibility of a Simpson’s paradox, just as in the replication condition.Footnote 13 Different from the replication data, in both easy and difficult conditions, with decreasing difficulty, comparative ability increases (Table 14).
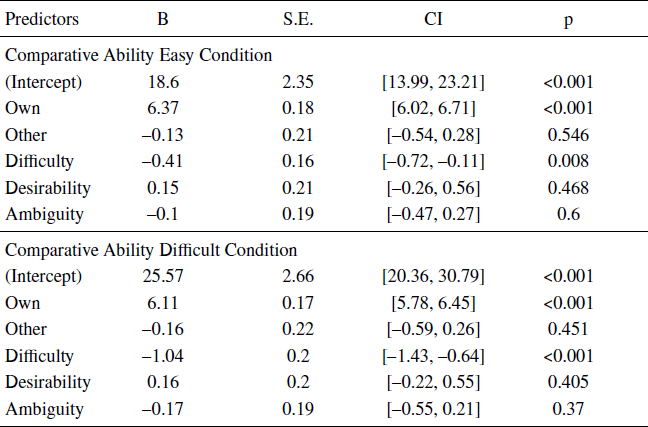
Note. The table presents the fixed-effects coefficients with all the model predictors. Participants represented the random effect. See supplementary section “Mixed Models” for step-wise regression results.
3.3.6 Comparisons of ambiguity and difficulty ratings between the three conditions
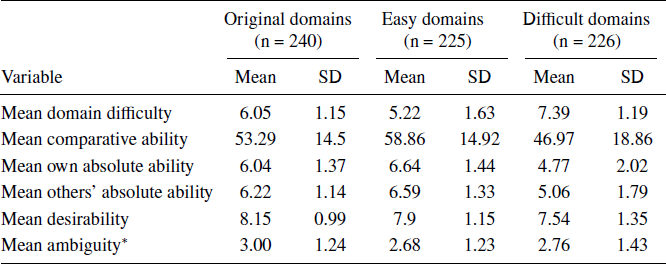
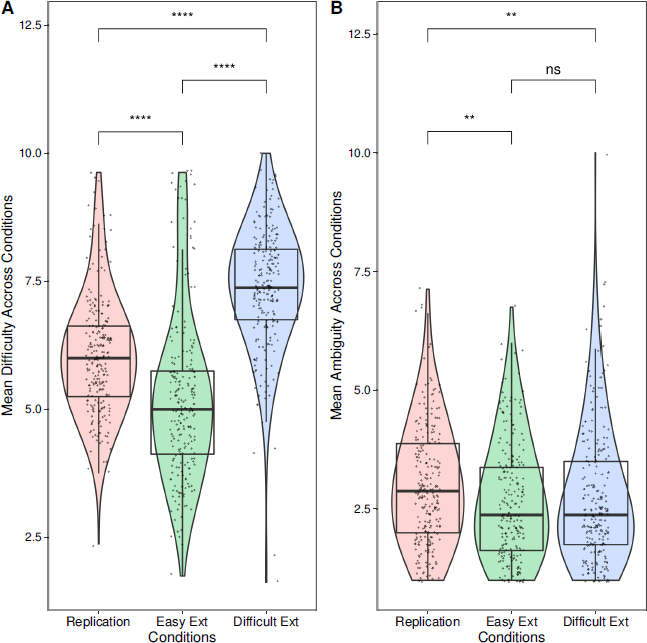
As parametric assumptions were not metFootnote 14, to test whether different domain definitions from the original domains would result in different domain difficulty and ambiguity ratings, we first conducted a Kruskal-Wallis test that showed differences in difficulty scores across conditions (H(2) = 237, p < .001, η 2 = 0.34; Figure 1). Supporting the first part of H3–4, post-hoc Bonferroni corrected Mann-Whitney tests showed that, compared to the replication condition (Mdn replication = 6.00, M replication = 6.05, SD = 1.15), participants in the easy domain condition (Mdn easy = 5.00, M easy = 5.22, SD = 1.63) rated lower domain difficulty (p < .001). Participants in the difficult domain condition (Mdn difficult = 7.78, M difficult = 7.39, SD = 1.19) rated higher domain difficulty than in the other conditions (ps < .001; Figure 1A). We conducted a second Kruskal-Wallis test and found differences in participants’ ambiguity ratings between the three conditions (H(2) = 11.47, p = .003, η 2 = 0.014; Figure 1B). As predicted in the second part of H3–4, post-hoc Bonferroni corrected Mann-Whitney tests showed replication condition ambiguity ratings (Mdn replication = 2.88 M replication = 3.00, SD = 1.24) to be lower than both the easy extension condition (Mdn easy = 2.38, M easy = 2.68, SD = 1.23; p adj = 0.01) and the difficult extension condition ambiguity ratings (Mdn difficult = 2.38, M difficult = 2.76, SD = 1.43; p adj = 0.01). We found no support for differences between easy and difficult extension conditions’ ambiguity ratings, (p adj ≈ 1.00).
Box and violin plots of domain difficulty and ambiguity ratings across replication, easy extension, and difficult extension conditions with uncorrected p-values for group-wise comparisons and overall models. Panel A: Mean difficulty across conditions. Panel B: Mean ambiguity across conditions. nsp>.05, *p<.05, **p<.01, ***p<.001, ****p<.0001.
3.3.7 Relationship between comparative ability, and domain difficulty and desirability (examining H2 in the extension conditions)
In the following section, the easy (n = 225) and difficult (n = 226) extension conditions results are analyzed in the same way as reported above for the replication condition. For the above- and below-average effects across all abilities, we found a strong negative correlation between comparative ability estimates and domain difficulty in both extension conditions (see above). Item-wise comparative-ability–domain-difficulty correlations are provided in the OSF supplement ‘Extension conditions: correlations between comparative ability and domain difficulty ratings for each ability domain’.
When comparing desirability ratings between easy and difficult ability domains via Wilcoxon signed ranks test, in the easy extension condition easy (M = 4.23, SD = 2.13) abilities to be more desirable than difficult abilities (M = 6.22, SD = 1.56; Z(223) = –10.62, p < .001, r = 0.75, 95% CI [0.70, 0.80]), as well as in the difficult extension condition easy abilities (M = 6.78, SD = 1.44), difficult (M = 7.99, SD = 1.30; Z(224) = –9.26, p < .001, r = 0.69, 95% CI [0.62, 0.75]). One-sample Wilcoxon tests revealed that all domain-specific desirability scores were higher than the scale midpoint (ps < .001; OSF supplement Tables 9.5–9-6). Moreover, correlations between comparative ability and desirability in easy (r(6) = 0.66, p = .074, 95% CI [–0.08, 0.93]) and difficult extension conditions (r(6) = 0.15, p =.72, 95% CI [–0.62, 0.77]) remain uncertain.
3.3.8 Extension H2: Additional Analyses for the relationship between comparative ability, and domain difficulty and desirability
Similarly, we found a negative association between comparative ability and domain difficulty ratings when using vector-compiled scores in the easy extension condition (r(1798) = –0.27, 95% CI [–0.31, –0.22])Footnote 15 as well as in the difficult extension condition (r(1806) = -0.31, 95% CI [–0.35, –0.27])Footnote 16. Similar to our findings for the replication condition, when using inventory mean scores, we found a positive association between comparative ability and mean domain difficulty ratings in the easy extension condition (r(223) = 0.32, p < .001, 95% CI [0.19, 0.43])Footnote 17 and a negative association in the difficult extension condition (r(223) = –0.13, p = .05, 95% CI [–0.26, –0.0002])Footnote 18.
3.3.9 Exploratory Analysis: comparative ability across conditions
In an exploratory analysis using a 3 (Condition) x 2 (Difficulty) mixed design, an aligned rank-transform nonparametric factorial ANOVA showed both main effects of condition (F(2, 1376) = 47.03, p < .0001, η 2G = 0.064) and difficulty (F(1, 1376) = 302.17, p < .0001, η 2G = 0.169), as well as the interaction effect (F(1, 1376) = 15.23, p < .0001, η 2G = 0.022), were significant.Footnote 19
Comparative ability across conditions. Panel A. Mean easy and difficult mean comparative ability ratings by condition. Panel B. Mean comparative ability ratings by difficulty. Panel C. Mean easy and difficult mean comparative ability ratings by condition with SD.nsp<.05, *p>.05, **p<.01, ***p<.001, ****p<.0001.
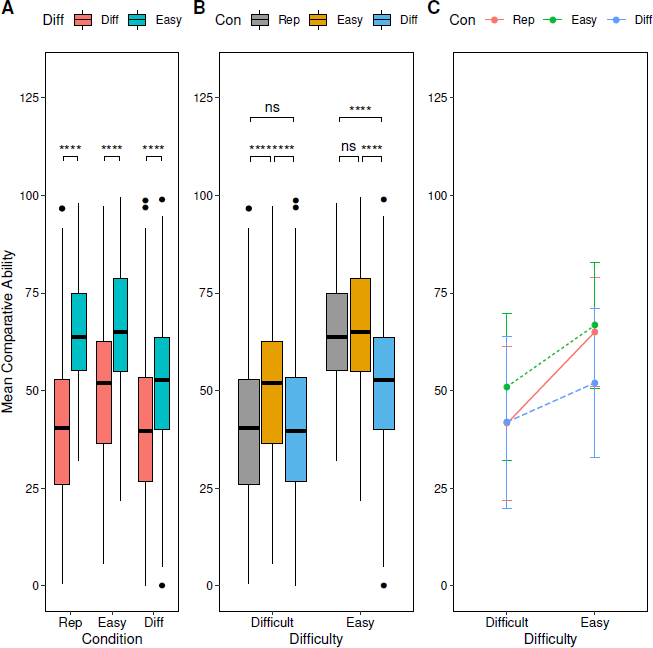
Post-hoc multiple comparisons revealed significant differences between all comparisons at Bonferroni corrected ps <.001, except the comparison between easy items in replication compared to easy items in the easy extension, difficult items in the replication compared to difficult extension, and difficult easy-extension compared to easy difficult-extension (as expected from power-simulations), with ps ≈ 1.00.
3.4 Replication Evaluation
The following section compares the original study and current replication based on the replication evaluation criteria by Reference LeBel, Vanpaemel, Cheung and CampbellLeBel et al. (2019). We found clear support for replication hypotheses H1 and H2. Both correlations between own absolute ability and comparative ability across all abilities displayed as conducted in the original study and additional analyses detected strong effects in the same direction as the original, but we found no support for difficulty as a predictor of comparative ability in a mixed-effects model using the replication data (Table 15). Positive and significant standardized betas for all own absolute abilities, and predominantly negative and non-significant standardized betas for others’ absolute abilities were replicated (Table 16). The strong evidence bolsters Kruger’s research on egocentrism as comparative ability judgments are based on participants’ own levels of ability instead of their perceptions of others’ level of ability (Reference KrugerKruger, 1999; Reference Kruger and BurrusKruger & Burrus, 2004). An underlying mechanism might be focalism, a complementary bias on people’s tendency to place more judgmental weight on the target (self) and less weight on the referent (others) when making direct comparisons between the two (Reference Krizan and SulsKrizan & Suls, 2008). An alternative explanation is that people simply have more information about themselves than they do about others. Paired with expectations about distributions of values of luck and skills, participants might have rationally judged, based on their best guess, that their own abilities are higher compared to others’ abilities when tasks were easy and vice versa when tasks were difficult (Reference Moore and HealyMoore & Healy, 2008).
Note. The original study only provided the standardized betas and p-values. The transformed R 2 and F 2 values would only represent the effect size of one predictor instead of the overall regression, so only the p-values and directions were compared.
1 Standardised betas from multiple regressions predicting participants’ comparative ability (percentile) estimates from their estimates of their own absolute ability and the absolute ability of their peers, respectively.
* p < .05.
** p < .01.
*** p< .001.
**** p < .0001.
Above and below-average effects (H2) replicated with a slightly smaller effect. Additional analyses revealed a smaller effect in the same direction, but when averaging the entire inventory for each participant and thereby reducing the variability in responses, a Simpson’s paradox seems to occur. Additionally, we found no support for difficulty as a predictor of comparative ability in a mixed regression model using the replication data, but we found support in both extensions. Participants tended to indicate higher rather than lower comparative ability in both the replication and the easy conditions, where difficulty ratings were normally distributed. This was not the case for the difficult condition, where difficulty ratings were right-skewed. In other words, the Simpson paradox was produced by the above-average-effect being stronger than the below-average-effect in the replication and the easy conditions. Overall, this shows the contextual effects of the inventory’s difficulty on participants’ ratings of tasks difficulty and comparative ability. Using both one-sample Wilcoxon and t-tests, both above-and-below-average effects replicated with smaller effects, whereas above-average effect sizes replicated closer to the original study (Table 17). Despite smaller effect sizes, the observed results support above-and-below-average effects. The prevalence of the below-average-effect also demonstrates that motivated reasoning to see oneself as superior fails to account for certain situations, such as for difficult abilities in the replication.
4 Discussion
We replicated and extended the findings in Reference KrugerKruger’s (1999) Study 1. Both the replication and the extension results provide strong support for above- and below-average effects, depending on difficulty. In addition, we present important boundary conditions. First, above-and-below-average effects appear stronger the more difficult the domain abilities are (compare Tables 8 and 11). Second, the difficulty of different activities (ability domains) might provoke or suppress below -or above-average-effects; we observed a below-average-effect when the presented abilities were difficult, and vice versa, an above-average effect when the presented abilities were easy. In that context, we observed an interaction effect between manipulations (making the original scale easier or more difficult) and item-group difficulty (easy vs difficult items), looking at comparative ability. Ambiguity was low across conditions with additional information introduced in the extensions decreasing ambiguity.
4.1 Replication outcomes
Egocentrism is a compelling, yet only one of many explanations for above-and-below-average-effects (Reference Zell, Strickhouser, Sedikides and AlickeZell et al., 2020). Alternatively, judgments might be rationally based on differential access to information influencing predictions (Reference Moore and SmallMoore & Small, 2007). In other words, by having more information about the own than others’ performance in different activities, others’ performance is evaluated less extremely than the own performance (Reference Moore and HealyMoore & Healy, 2008).
Moreover, the replication advances our understanding of the conditions in which the above or below-average effects are more pronounced, i.e., when abilities’ difficulty and supplied information about them differ. It complements a recent meta-analysis on the above-average-effect (Reference Zell, Strickhouser, Sedikides and AlickeZell et al., 2020), showing a larger effect when using the direct (compare oneself to others on a single scale with the midpoint defined as average) rather than indirect testing method (assess oneself and the comparison group independent from each other, with the average being defined as the difference between the two values). Fewer research center on the below-average-effect, yet success in replicating the effect suggest that the same conditions may also be applicable in strengthening the below-average effect.
On the other hand, the replication’s smaller effect sizes challenge the influence of certain established factors on the effects. For instance, people showed the strongest biases in comparative ability judgments when the comparison group was abstract instead of concrete, and no specific information and contact with the comparison group contributes to that abstractness (Reference Alicke, Klotz, Breitenbecher, Yurak and VredenburgAlicke et al., 1995).
A notable discrepancy between the original and replication is the comparison group: original study participants compared themselves to other students from their psychology course, which was much more concrete than replication participants comparing themselves to others of the same age, gender, and socioeconomic background. The replication’s smaller effects suggest that in contrast to past explanations, people may not display tendencies to choose vulnerable comparison targets to compare themselves with when given an abstract referent group (Reference Chambers and WindschitlChambers & Windschitl, 2004). As people display preferences in selecting representative targets, they might choose comparison targets of varying ability depending on task difficulty, and the availability of information and cognitive resources (Reference Nisbett, Krantz, Jepson and KundaNisbett et al., 1983). This may have been the case for the current replication and is a promising direction for future research.
4.2 Outcomes of the extensions to the original study
Both H3 and H4 were supported. We found lower domain difficulty ratings in the easy domain condition than the replication condition (d = 0.59) and higher domain difficulty ratings in the difficult domain condition than the replication condition (d = 1.15) supporting the first part of the extension hypotheses (H3–4) on differences in domain difficulty. As interpretations of easy or difficult abilities contribute to different perceptions of domain difficulty, the observed results provide insight on how this affects participant interpretation of “average” ability. In a study by Reference Kim, Kwon and ChiuKim et al. (2017), people construed below-median averages and showed above-average effects for abilities perceived as easy, and construed averages at or above the median for abilities perceived as difficult. For accurate assessments of comparative ability judgments, researchers not only need to ascertain how people interpret “average” ability, but also place efforts in lowering variations in the perceived difficulty of abilities. Hence, the original domain definitions may have been open to interpretation, influencing the results.
Moreover, we found support for the second part of H3–4, that ambiguity was lower in the replication conditions. Eventually, more information provided might have led to clarification and hence decreased perceptions of ambiguity. Previous research showed a tendency to view oneself as above-average for ambiguous abilities (Reference Dunning, Meyerowitz and HolzbergDunning et al., 1989), and to select favorable, self-serving definitions amongst ambiguous traits describing a wide variety of behaviors (Reference GilovichGilovich, 1983; Reference KundaKunda, 1987), which could not be reflected from our data. Finally, comparing comparative ability scores across conditions (replication vs extensions) and by the difficulty of the items (easy vs difficult), show an interaction effect. That indicates that both domain difficulty and ambiguity might influence comparative ability ratings and thereby above-and-below-average-effects. However, despite the presented extensions potentially presenting the influence of abilities’ difficulty and their definitions’ ambiguity on the effects, more research is needed to address above-and-below-average-effects’ boundary conditions.
4.3 Limitations and future directions
Deviating from the original study, in our replication we measured the continuous relationship between variables and analyzed data on participant and item levels. Moreover, possible inferences from comparisons between added and original study correlations between domain difficulty and comparative ability are limited. Our tests supported original ability categorizations as easy or difficult, all original study tests (including one-sample tests and correlations of ratings across all abilities) were also carried out for the replication condition. While we recommend future replications testing the continuous relationship between variables to avoid limitations in performing study comparisons, misclassification, and issues in categorizing continuous variables, we also caution of low reliability when using the presented scale and particularly the suggested (easy and difficult ability) subscales (Table 5).
Furthermore, the replication’s ability domain definitions are all based on Reference KrugerKruger’s (1999) original domains. Yet, these domains may not be as accurate and widely applicable at present. For example, a recent survey indicated that the easy ability “saving money” is challenging for the majority, with 69% of Americans having less than $1000 in their savings accounts (Reference HuddlestonHuddleston, 2019). For future tests, the current ability domains can be updated and pretested. Although Reference Kim, Kwon and ChiuKim et al. (2017) found the above-average-effect, most of the 14-items they used were general abilities such as written or spoken expression. More relevant and comprehensive items can be included in future studies and bigger pretest samples (original study: n = 39) used to select ability domains and validate the instrument.
How do people assess task difficulty? This question goes beyond the scope of the current investigation yet is a critical open question if difficulty serves as a moderator between the above and below average effects. Difficulty has been described in previous research to increase as a function of cognitive and/or physical load, with those loads being rather additive than interactive components in making difficulty (Reference Feghhi and RosenbaumFeghhi & Rosenbaum, 2019). Different factors might be linked to such perceptions, such as error probability, weights of errors (one error is worse than another), attention demands or potentially a cost-benefit calculation determining judgments of difficulty (Reference Feghhi and RosenbaumFeghhi & Rosenbaum, 2019).
The underlying mechanisms of task difficulty judgments remain unclear, yet in our extension’s stimuli, we attempted to embed quantitative numerical information regarding load constructed to be perceived as more and less difficult. We found that these were indeed rated as more and less difficult by the participants. This allows for the use of a quantifiable latent concept such as load as a predictor of difficulty. The operationalization of such latent concepts requires systematic testing in future research.
Together with many past studies, the present replication only establishes the ubiquity of the above and below-average effects. Much less is known about the effects’ impacts, especially for the below-average effect. The directionality of the above-average effect’s impacts is still debated. Tendencies to see oneself as better than others can serve a wide variety of affective, cognitive, and social functions such as temporary boosts in task performance, longer life expectancy, and well-being (Reference Bopp, Braun, Gutzwiller and FaehBopp et al., 2012; Reference Ehrlinger and DunningEhrlinger & Dunning, 2003; Reference Taylor and BrownTaylor & Brown, 1988; Reference Zell, Strickhouser, Sedikides and AlickeZell et al., 2020). But it can also result in harmful long-term consequences of having unrealistic expectations, heightened disengagement, and decreased self-esteem (Reference Polivy and HermanPolivy & Herman, 2000; Reference Robins and BeerRobins & Beer, 2001). In contrast, less research has been conducted on the below-average-effect’s impacts, predominantly focusing on its negative consequences, such as lower grades (Reference Mattern, Burrus and ShawMattern et al., 2010), or worse subjective well-being (Reference Goetz, Ehret, Jullien and HallGoetz et al., 2006). Other research suggested that the below-average-effect can also induce positive motivational and behavioral consequences in the long run (Reference Whillans, Jordan and ChenWhillans et al., 2020). This highlights the need for continued research on the below-and-above-average-effects’ consequences.
5 Conclusion
We closely replicated Reference KrugerKruger’s (1999) study, showing the above- and below-average effects to be robust. Manipulating the difficulty of (easy and difficult) ability domains participants were to compare themselves with others, which showed that easier items might provoke the above-average effect but dampen the below-average effect and vice versa for more difficult items.


 Open access