

The Twins Early Development Study (TEDS) follows the development of a large cohort of twins born in England and Wales between 1994 and 1996. The initial aims of TEDS were to consider genetic and environmental influences on cognitive and behavioral development, and in particular to recruit a large representative sample to allow the investigation of common developmental difficulties in the context of typical development. A unique aspect of TEDS has been its focus on language, cognition, and academic achievement, but we have also collected data on adjustment and some information about health. It is a momentous time for TEDS as we transition from a childhood to an adult sample. Here, we update the previous descriptions of TEDS (Oliver & Plomin, Reference Oliver and Plomin2007; Trouton et al., Reference Trouton, Spinath and Plomin2002) to include information about our latest assessments in adolescence and early adulthood.
TEDS From Recruitment at Birth to Adulthood
Twin births between January 1994 and December 1996 were identified through birth records. The UK Office for National Statistics contacted these families after screening for infant mortality, and 16,810 families responded to acknowledge their interest in taking part in the study. The TEDS team made their first contact with these families when the twins were about 18 months of age to collect general demographic information, including zygosity and information about pregnancy and birth. Since initial enrolment the families have been invited to take part in studies when the twins were aged 2, 3, 4, 7, 8, 9, 10, 12, 14, and 16 years of age. In addition, there was a subsample of twins who were assessed in their homes at 4½ years (see below for more details), and the whole sample is being contacted as the twins turn 18 to collect information on the adult destinations of the twins as they move from school to university and the workplace. Zygosity was assigned using a parent-reported questionnaire of physical similarity, which is over 95% accurate when compared to DNA testing (Price et al., Reference Price, Freeman, Craig, Petrill, Ebersole and Plomin2000). For cases where zygosity was unclear, DNA testing was conducted.
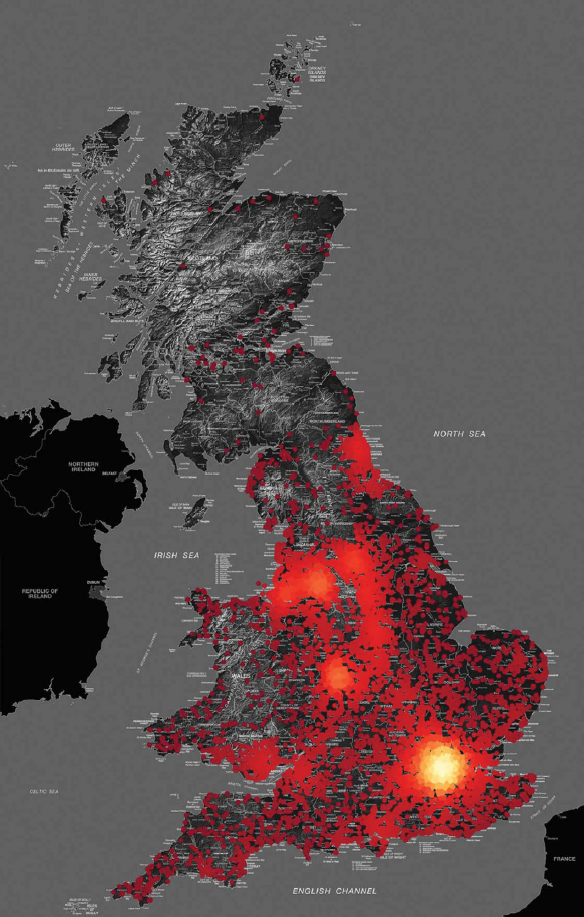
Table 1 includes information about the sample size from first contact to adolescence, and details of the continued representativeness of the sample. At first contact almost 14,000 families provided data; these families were highly representative of the general UK population (Table 1). For example, 91.7% of the families at first contact self-reported as white, compared to 93% in the general population at that time (Walker et al., Reference Walker, Maher, Coulthard, Goddard and Thomas2001). The percentage white has remained very stable from early childhood (92.9%), into middle childhood (93.2%), and adolescence (92.8%). FIGURE 1 shows the approximate location of the twins in adolescence, which is representative of the distribution of the general population in England and Wales. Although all of the twins were born in England and Wales, over the years a small number of families have spread out across the United Kingdom and abroad.
Representativeness of the TEDS Sample at First Contact, Early Childhood, Middle Childhood, and Adolescence

The equivalent UK population percentages for this generation are 93% white; 32% for A-levels or higher; 49% for mother employed; and 89% for father employed (Walker et al., Reference Walker, Maher, Coulthard, Goddard and Thomas2001). Early childhood refers to families who provided any data when the twins were aged 2, 3, or 4 years. Middle childhood refers to families who provided any data when the twins were aged 7, 9, or 10 years. Adolescence refers to families who provided any data when the twins were aged 12, 14, or 16 years. A-levels are the national educational qualification taken at 18 years of age in the UK, and refer to parental educational qualifications. % female relates to the sex of the twins. MZ = monozygotic twins. These percentages for MZ twins match the expected distribution of twin births in the United Kingdom.
Geographical distribution of TEDS. Note: Plotting the local density of 10,000 TEDS families on a map of the United Kingdom — using a color scale from dark red (low density) to yellow (high density) — shows that they are distributed in the same way as the general population in England and Wales. Only a small proportion of the initial sample has migrated outside the United Kingdom (253 families). For these families, the main destinations have been Australia (44), New Zealand (33), the United States (33), Canada (30), the Republic of Ireland (21), and France (20). The underlying map was provided by Ordnance Survey OpenData (www.ordnancesurvey.co.uk).
Informed consent has been collected from the parents for each assessment, and informed assent was collected from the twins in adolescence. Not all of the families are invited to take part at all ages; for example, due to budget constraints the 1996 birth cohort has not been included in all of the assessment waves. Families are always given the option to withdraw from the study, or simply to not participate in a particular stage of the study. The TEDS research team works extremely hard to retain the study families, including sending handwritten birthday cards, annual newsletters, and conducting competitions and prize draws. As the twins have grown up, we have also been providing work experience and career advice, and have set up twin advice panels called the TEDS Ideas Panels (TIPs). Information about the prize draws and our latest research news can be found on our website: www.teds.ac.uk.
Measures
FIGURE 2 represents the timeline of assessments in TEDS, including information about the measures included at each age, and example TEDS publications. More detailed information about the measures is available from the TEDS team on request. These main TEDS assessments have been made possible by 20 years of continuous funding from the UK Medical Research Council.
Timeline of TEDS assessments. This figure represents the main TEDS assessments and major measures. More detailed information is available from the TEDS team on request. Following are examples at each age of papers reporting twin analyses of TEDS data. The papers were selected from over 300 in order to represent the diversity of authors and measures in TEDS. Examples of other TEDS twin analyses and DNA analyses are included in the text. First contact: Koeppen-Schomerus et al. (Reference Koeppen-Schomerus, Eley, Wolke, Gringras and Plomin2000); Price et al. (Reference Price, Grosser, Plomin and Jaffee2010); Ronald et al. (Reference Ronald, Happé, Dworzynski, Bolton and Plomin2010b). 2 years: Dale et al. (Reference Dale, Simonoff, Bishop, Eley, Oliver, Price and Plomin1998); Dionne et al. (Reference Dionne, Dale, Boivin and Plomin2003); Hayiou-Thomas et al. (Reference Hayiou-Thomas, Dale and Plomin2012); Petrill et al. (Reference Petrill, Saudino, Wilkerson and Plomin2001). 3 years: Davis et al. (Reference Davis, Haworth and Plomin2009); Gregory et al. (Reference Gregory, Eley, O'Connor and Plomin2004); Iervolino et al. (Reference Iervolino, Hines, Golombok, Rust and Plomin2005); Spinath et al. (Reference Spinath, Price, Dale and Plomin2004). 4 years: Asbury et al. (Reference Asbury, Wachs and Plomin2005); Eley et al. (Reference Eley, Bolton, O'Connor, Perrin, Smith and Plomin2003); Knafo & Plomin (Reference Knafo and Plomin2006); Larsson et al. (Reference Larsson, Viding, Rijsdijk and Plomin2008). 4½ years: Hayiou-Thomas et al. (Reference Hayiou-Thomas, Kovas, Harlaar, Plomin, Bishop and Dale2006); Oliver et al. (Reference Oliver, Dale and Plomin2004); Viding et al. (Reference Viding, Spinath, Price, Bishop, Dale and Plomin2004). 7 years: Arden & Plomin (Reference Arden and Plomin2006); Harlaar et al. (Reference Harlaar, Dale and Plomin2007); Saudino et al. (Reference Saudino, Ronald and Plomin2005); Viding et al. (Reference Viding, Blair, Moffitt and Plomin2005); Walker et al. (Reference Walker, Petrill, Spinath and Plomin2004). 8 years: Greven et al. (Reference Greven, Asherson, Rijsdijk and Plomin2011); Loat et al. (Reference Loat, Haworth, Plomin and Craig2008); Ronald et al. (Reference Ronald, Happe, Bolton, Butcher, Price, Wheelwright and Plomin2006). 9 years: Hanscombe et al. (Reference Hanscombe, Haworth, Davis, Jaffee and Plomin2010); Haworth et al. (Reference Haworth, Dale and Plomin2009a); Oliver et al. (Reference Oliver, Pike and Plomin2008); Trzaskowski et al. (Reference Trzaskowski, Zavos, Haworth, Plomin and Eley2012); Wardle et al. (Reference Wardle, Carnell, Haworth and Plomin2008). 10 years: Asbury et al. (Reference Asbury, Almeida, Hibel, Harlaar and Plomin2008); Davis et al. (Reference Davis, Kovas, Harlaar, Busfield, McMillan, Frances and Plomin2008); Greven et al. (Reference Greven, Harlaar, Kovas, Chamorro-Premuzic and Plomin2009); Kovas et al. (Reference Kovas, Haworth, Harlaar, Petrill, Dale and Plomin2007b). 12 years: Dale et al. (Reference Dale, Harlaar, Hayiou-Thomas and Plomin2010b); Davis et al. (Reference Davis, Haworth, Lewis and Plomin2012); Greven et al. (Reference Greven, Rijsdijk, Asherson and Plomin2012); Haworth et al. (Reference Haworth, Asbury, Dale and Plomin2011); Haworth et al. (Reference Haworth, Kovas, Harlaar, Hayiou-Thomas, Petrill, Dale and Plomin2009b); Robinson et al. (Reference Robinson, Koenen, McCormick, Munir, Hallett, Happé, Plomin and Ronald2011). 14 years: Dale et al. (Reference Dale, Harlaar, Haworth and Plomin2010a); Hanscombe et al. (Reference Hanscombe, Trzaskowski, Haworth, Davis, Dale and Plomin2012); Haworth et al. (in press).

In-person cognitive testing of the large, geographically dispersed TEDS sample has not been feasible; instead, we have used a variety of innovative methods to collect data on the largest sample possible. In early childhood (ages 2, 3, and 4), we used booklets sent to the twins’ parents. These included measures of cognition and language ability, as well as questionnaire measures of behavior for the parents to complete. Our early parent-administered cognitive measures have been validated in a subsample, as reported elsewhere (Oliver et al., Reference Oliver, Dale, Saudino, Petrill, Pike and Plomin2002; Saudino et al., Reference Saudino, Dale, Oliver, Petrill, Richardson, Rutter and Plomin1998). We used telephone testing for the first time when the twins were 7 years of age, which provided data highly comparable to more traditional in-person cognitive testing (Petrill et al., Reference Petrill, Rempell, Oliver and Plomin2002). We used telephone testing again at 12 years for a short reading test. Telephone testing is expensive and time consuming for the broad battery of tests we wanted to include, so we returned to postal booklets for our main assessments at 9 years, which were completed by the twins under the parents’ supervision. In 2004, by the time the twins were 10 years old, we had developed a diverse battery of web-based cognitive tests, including reading, mathematics, and general cognitive ability. These tests have been updated and expanded to include a battery of language and scientific enquiry tests, and used for cognitive testing online when the twins were 12, 14, and 16 years of age. We successfully validated our web-based tests by comparing the results for a subsample with more traditional paper and pencil in-person tests (Haworth et al., Reference Haworth, Harlaar, Kovas, Davis, Oliver, Hayiou-Thomas and Plomin2007). For the most recent web assessments at 16 years, we found an average correlation of 0.72 between online and offline versions of our language, reading, and general cognitive ability tests administered 2 months apart, providing further support for the validity and reliability of our web-based cognitive tests in adolescence.
Although cognition has been a major focus of TEDS, we have also collected questionnaire data on behavioral problems, health, and home and school environments. Parents completed questionnaires at first contact and when the twins were aged 2, 3, 4, 7, 8, 9, 12, 14, and 16 years. These questionnaires included measures of the home environment, parenting, and behavioral problems, such as anxiety, depression, conduct problems, autistic spectrum, and attention-deficit hyperactivity disorder (ADHD). The twins completed questionnaires when they were 9, 12, 14, and 16 years of age, including measures of behavioral problems and environmental experiences in the home and at school. We have also collected academic achievement data and behavioral problem measures from the twins’ teachers at ages 7, 9, 10, 12, and 14 years. However, it became increasingly difficult to get teacher reports when the twins moved to secondary school where they often have a different teacher for each subject. For this reason, we phased out the teacher reports when the twins were 14 years old, and began collecting academic achievement data from the TEDS families, based on the National Curriculum levels reported to them by the schools. We are now in the process of matching TEDS to the UK National Pupil Database, which is a government-administered repository of school quality and achievement in the United Kingdom. The twins and their parents have provided exam results for the General Certificate of Secondary Education (GCSEs), which are the exams taken at 16 years at the end of compulsory schooling. We are now also collecting A-level results for the national exams taken by those twins who remain in education at 18 years in the United Kingdom.
Collaborations
In addition to these main TEDS assessments, there have been subsample studies (e.g., in-home testing of cognition and language for more than 800 pairs at 4½ years), and numerous spin-off projects have been funded. For example, TEDS has provided access to samples for the Environmental Risk (E-Risk) study, spin-offs on eating behavior, anxiety, ADHD, attachment, wellbeing, schizotypy, and myopia to name but a few. The TEDS family of researchers and collaborators continues to grow. Over the past 18 years, more than 25 students have completed PhDs that primarily focused on TEDS data, and many more have included TEDS data as part of their doctoral dissertations. Now ‘students of students’ are completing PhDs, resulting in a multigenerational family of TEDS collaborators. To date, around 300 research papers have been published using TEDS data, involving more than 300 authors. In addition, large portions of the raw data have been released and are freely available for analyses. For example, we have released all of the cognitive and academic achievement data collected on TEDS when the twins were 7, 9, and 10 years of age, to accompany a monograph that summarizes our findings in middle childhood (Kovas et al., Reference Kovas, Haworth, Dale and Plomin2007a).
DNA Studies in TEDS
Only a small proportion of the heritability of common disorders and complex traits has been accounted for despite enormous research efforts (Plomin, Reference Plomin2012). Nonetheless, as some genes are identified, large, multivariate, longitudinal phenomes like TEDS will be increasingly valuable. TEDS collected DNA from more than 14,000 twins (7,000 pairs) and has been at the forefront of molecular genetic research in the cognitive domain, for example, conducting the first genome-wide association (GWA) study of cognitive ability before DNA microarrays were available (Plomin et al., Reference Plomin, Hill, Craig, McGuffin, Purcell, Sham and Owen2001). With the advent of DNA microarrays, we developed the cost-effective SNPMaP (SNP Microarrays and Pooling) method to facilitate the first array-based GWA studies of cognitive abilities (Butcher et al., Reference Butcher, Davis, Craig and Plomin2008; Davis et al., Reference Davis, Butcher, Docherty, Meaburn, Curtis, Simpson and Plomin2010; Docherty et al., Reference Docherty, Davis, Kovas, Meaburn, Dale, Petrill and Plomin2010; Meaburn et al., Reference Meaburn, Harlaar, Craig, Schalkwyk and Plomin2008) and behavioral problems such as psychopathy and autism spectrum disorders (Ronald et al., Reference Ronald, Butcher, Docherty, Davis, Schalkwyk, Craig and Plomin2010a; Viding et al., Reference Viding, Hanscombe, Curtis, Davis, Meaburn and Plomin2010).
TEDS now has 2 million DNA microarray genotypes (Affymetrix 6.0 GeneChip) for 3,500 individuals (one member of a twin pair). Because effect sizes of associations for complex traits are so small, we now know that samples of tens, or even hundreds of thousands are needed to achieve adequate power to detect reliable associations after correcting for multiple testing in GWA analyses. For this reason, TEDS is involved in several collaborations that aim to achieve the necessary power to detect associations of small effect size through meta-analyses across many studies. These DNA microarray genotype data also make it possible to use any genes or polygenic predictors identified in the literature to follow up at the DNA level on our twin results investigating developmental, multivariate, and gene–environment interplay issues (Harlaar et al., Reference Harlaar, Butcher, Meaburn, Sham, Craig and Plomin2005; Haworth et al., Reference Haworth, Carnell, Meaburn, Davis, Plomin and Wardle2008). We are also conducting analyses of copy number variants using the 1 million non-polymorphic DNA markers on the Affymetrix 6.0 GeneChip that are especially useful for these analyses. Another new development that relies on DNA microarray genotype data is genome-wide complex trait analysis, which is a quantitative genetic technique that is based solely on DNA rather than familial relatedness as in twin studies, and which we have shown to verify twin study estimates of heritability for cognitive abilities (Plomin et al., in press). Finally, the next major development is whole-genome sequencing, which can identify all DNA polymorphisms throughout the genome; whole-genome sequencing is ongoing for the 150 most cognitively impaired individuals in TEDS.
Future Directions
The large family of TEDS collaborators provides a lasting legacy for TEDS research. TEDS will continue to capitalize on the longitudinal data collected over the past 18 years, and link this to measured genetic variants and specific measures of the environment to understand the developmental interplay between genes and environments in creating individual differences in cognition and behavior. Twin analyses still have a prominent role to play in understanding nature and nurture (Haworth & Plomin, Reference Haworth and Plomin2010), and a key strength for TEDS is in combining our twin and DNA approaches (e.g., Harlaar et al., Reference Harlaar, Butcher, Meaburn, Sham, Craig and Plomin2005; Haworth et al., Reference Haworth, Carnell, Meaburn, Davis, Plomin and Wardle2008; Plomin et al., in press). It is our hope that TEDS can continue to capitalize on advances in genetic technology; for example, as mentioned above, we already have a project underway in whole genome sequencing; we are also conducting research on biomarkers and a study on DNA methylation in identical twins discordant for autism spectrum disorder. New phenotypic measures collected in emerging adulthood and beyond will add considerable value to our well-characterized sample, facilitating lifespan approaches to individual differences in behavioral and cognitive outcomes.
Acknowledgments
The authors are enormously grateful to the twins, parents, and the twins’ teachers who have supported the Twins Early Development Study (TEDS) for the past 18 years. TEDS has also benefited from an exceptionally gifted group of researchers and support staff. The authors would especially like to thank the current TEDS team, including Rachel Ogden, Andrew McMillan, Kathryn Carter, Francesca Lewis, Neil Harvey, Rae Gardner-Kimball, and Louise Webster, for their enduring dedication to the project. TEDS has been continuously supported by the UK Medical Research Council since 1995 (G9424799, G0500079, and now G0901245). The authors' work on environments and academic achievement is also supported by grants from the US National Institutes of Health (HD044454, HD046167, and HD059215). The authors' molecular genetic research has been partly supported by grants from the NIH (HD049861), Wellcome Trust (GR075492, WT084728), Autism Speaks (4743), and John Templeton Foundation (13575). CMAH is supported by a research fellowship from the British Academy; OSPD is supported by a Sir Henry Wellcome Fellowship (WT088984); RP is supported by a research professorship from the UK Medical Research Council (G19/2) and a European Research Council Advanced Investigator Award (295366).


