


1. Introduction
Live cattleFootnote 1 markets and marketing methods have changed dramatically over the past two decades and continue to evolve (Parcell, Tonsor, and Schroeder, Reference Parcell, Tonsor and Schroeder2016). One of the most notable changes has been the decline of live cattle sold in the cash market via negotiation. Many industry participants and analysts have expressed concern that the price discovery work in negotiated markets is essential to connecting prices to economic fundamentals and that the decline of negotiated purchases is detrimental to live cattle price discovery for the broader market (Schroeder, Tonsor, and Coffey, Reference Schroeder, Tonsor and Coffey2018). As the number of cattle in negotiated markets has declined, the number marketed using some manner of formula-based pricing has increased. Formula pricing requires a base price to which various premiums or discounts are added, depending on the specific agreement. The base price is derived from some existing price and is not negotiated. One convenient source of base prices is recent negotiated cash prices. This relationship between negotiated and formula prices has caused further concern as there is fear that cattle in the thinning negotiated markets may not be representative of cattle in formula markets, which are marketed with the goal of gaining premiums for having certain carcass traits. Given these concerns and the ever-evolving live cattle markets, understanding how different negotiated markets for live cattle interact with and affect each other through exchange of information is essential to understanding live cattle price discovery.
There is an extensive body of research on live cattle price discovery. A large share of attention has been devoted to the relationship between live cattle cash prices and the Chicago Mercantile Exchange (CME) Live Cattle Futures Contract. A perennial research objective has been to identify which price series causes (or leads) the other (Covey and Bessler, Reference Covey and Bessler1992; Mathews et al., Reference Mathews, Brorsen, Hahn, Arnade and Dohlman2015; Oellermann and Farris, Reference Oellermann and Farris1985). Price analysis that focuses on the cash markets for live cattle has examined cointegration and causal relationships among cash markets (Goodwin and Schroeder, Reference Goodwin and Schroeder1990, Reference Goodwin and Schroeder1991; Pendell and Schroeder, Reference Pendell and Schroeder2006; Schroeder, Reference Schroeder1997). To a lesser degree, the dynamics of how information is shared between live cattle cash markets has been considered (Bailey and Brorsen, Reference Bailey and Brorsen1985, Reference Bailey and Brorsen1989; Goodwin and Schroeder, Reference Goodwin and Schroeder1990; Pendell and Schroeder, Reference Pendell and Schroeder2006; Schroeder and Goodwin, Reference Schroeder and Goodwin1990; Walburger and Foster, Reference Walburger and Foster1998). Research in this latter category has been sparse in recent years. Many factors, such as number of live cattle marketed via negotiation, percentage of all live cattle sold by negotiation, and relative volumes of negotiated trade in key feedlot states, have changed over the past several years. Price discovery analysis, which considers the complexities and changes in the negotiated cash markets for live cattle, is needed to fill this space in the literature.
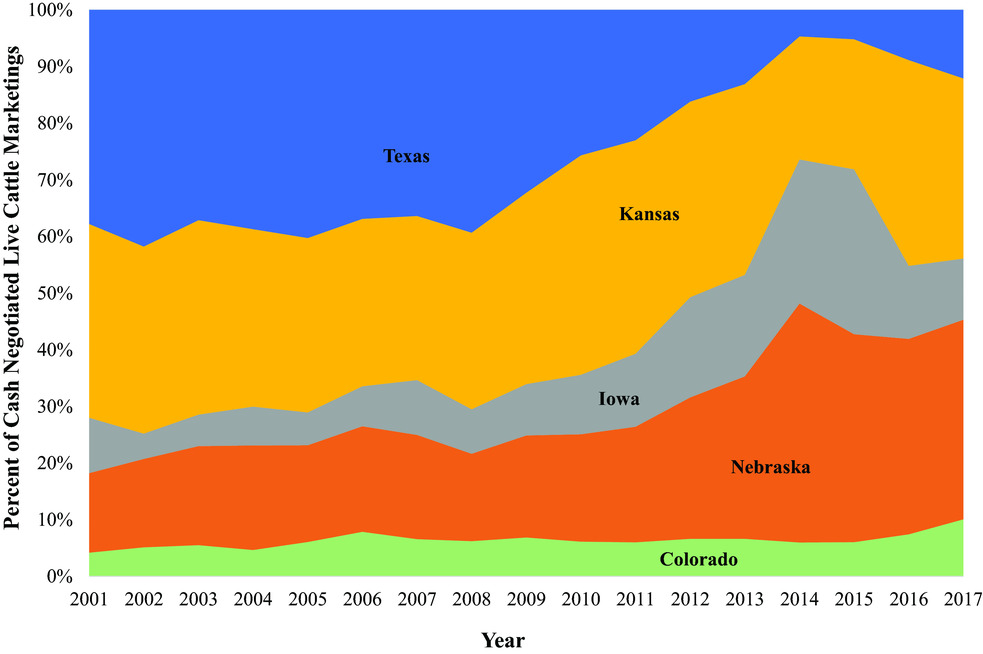
Figure 1 shows the annual average percentage of negotiated sales of live steers and heifers across the five major Livestock Mandatory Price Reporting (LMR) regions. Each region's percentage is calculated as a percent of total marketing in the five regions, forcing the sum of the annual average percentages to sum to 100%. From 2001 to 2015, the relative share of negotiated marketing in Texas declined from being the largest to the smallest among the regions. In the last 2 years, negotiation in Texas has increased, but it remains small relative to earlier levels. Kansas followed a similar, though less severe, trend reaching its low in 2014–2015 and then experiencing a slight increase in negotiation in the last 2 years. Nebraska and Iowa have both increased in their relative shares of the negotiated market. Finally, Colorado's share has remained steady.
Annual Average Percentage of Negotiated Live Cattle Marketings among Major Livestock Mandatory Price Reporting Regions
Given the shift in the relative volumes of negotiated trade, the roles of regional negotiated live cattle markets have potentially changed as well. Updating knowledge regarding the price discovery relationships between major negotiated live cattle markets will be of value to industry participants, analysts, and policy makers who might examine live cattle market structure issues.
The purpose of this research is twofold. First, we examine price discovery relationships between negotiated live cattle markets in the five major LMR regions (Colorado, Iowa/Minnesota, Kansas, Nebraska, Texas/Oklahoma/New Mexico) since the implementation of LMR. Specifically, we use a vector error correction model (VECM) framework to test for Granger causality among the five markets—that is, how past prices contribute to the understanding of current prices. We go on to use the covariance matrix of VECM innovations to parameterize directed acyclic graph (DAG) analysis of contemporaneous causal relationships among the regions to complement the Granger causality analysis. The use of these methods accomplishes the second purpose—demonstrating how these two price discovery tools can be combined, with consideration given to how live cattle markets function, to reveal nuances in the timing of price discovery in negotiated cash markets for live cattle. Results indicate causal roles among the five markets have changed since 2001. In the earlier period, Kansas, Nebraska, and Texas Granger caused prices in other regions. However, from 2010 to 2017, Colorado was the only price series that Granger caused other price series. DAG results show that when within-week information is included, Colorado is the information dump. That is, price information flows to, but not from, Colorado. Taken together, the findings emphasize the value in both techniques to understand nuances of live cattle price discovery. For instance, Colorado, a minor market in terms of relative volume, has apparently assumed a prevalent role in the week-to-week price discovery of other LMR regions.
2. Price Discovery Analysis
Price discovery analysis seeks to identify how information is transmitted from one market to another and to what degree markets are integrated with each other. Research specifically focused on live cattle markets has analyzed cash markets to determine how information travels between the regional markets. Price transmission among cash markets was largely symmetric (Bailey and Brorsen, Reference Bailey and Brorsen1989), and price adjustments from shocks occurred with a week or two (Bailey and Brorsen, Reference Bailey and Brorsen1985; Schroeder and Goodwin, Reference Schroeder and Goodwin1990). Larger markets tended to dominate the price discovery process (Bailey and Brorsen, Reference Bailey and Brorsen1985; Schroeder and Goodwin, Reference Schroeder and Goodwin1990). Koontz, Garcia, and Hudson (Reference Koontz, Garcia and Hudson1990) found that the price discovery process, including which markets are dominant, is dynamic, depends on the underlying market structures, and changes over time. These findings underscore the importance of updating the understanding of the live cattle price discovery process as the industry evolves.
Identifying the degree of cointegration (Engle and Granger, Reference Engle and Granger1987; Johansen, Reference Johansen1988) between different live cattle markets has been one prominent subset of live cattle price discovery literature.Footnote 2 Schroeder and Goodwin (Reference Schroeder and Goodwin1990) found limited cointegration among live cattle cash markets during the period of 1980 to 1987 but noted that cointegration among the markets appeared to be growing over time. Later research using slaughter plant transaction data found regional live cattle markets were mostly cointegrated with one another (Schroeder, Reference Schroeder1997). After the advent of LMR in 2001, data for regional live cattle markets became more standardized and were made publicly available by the U.S. Department of Agriculture's Agricultural Marketing Service (USDA-AMS). Using pre- and post-LMR data, Pendell and Schroeder (Reference Pendell and Schroeder2006) found that regional live cattle cash markets became more integrated after the implementation of LMR. Research focusing on how LMR has changed live cattle markets determined that supply and demand responses changed after LMR (Pozo, Bejan, and Tejeda, Reference Pozo, Bejan and Tejeda2016) and that the LMR did not affect volatility of prices in the Iowa-Minnesota region (Chimai and Chung, 2017).
3. Methods
We employ two methods for identifying how information flows between cash markets for live cattle. The first approach is an error correction model (ECM), which is present in the price discovery literature for cattle (Mathews et al., Reference Mathews, Brorsen, Hahn, Arnade and Dohlman2015; Stockton, Bessler, and Wilson, Reference Stockton, Bessler and Wilson2010), hogs (Franken, Parcell, and Tonsor, Reference Franken, Parcell and Tonsor2011), and energy (Saghaian, Reference Saghaian2010). The ECM approach allows for cointegration among price series. Next, we use DAG to define linkages between live cattle markets. We use both methods to separate the price discovery dynamics. ECM analysis focuses on how lagged prices affect current prices. Alternatively, DAG considers how contemporaneous price shocks are transmitted among markets. Distinguishing between the innovations because of lagged price shocks and current price shocks is important.
3.1. Vector Error Correction Model
Following model selection criteria (Enders, Reference Enders1995), the VECM was chosen. Using the augmented Dickey Fuller test, these data were found to be nonstationary in levels but stationary in the first differences.Footnote 3 The Johansen cointegration test indicated that the five price series were cointegrated at r = 4.Footnote 4 That is, four cointegrating vectors exist among the five-price series. This combination suggests a VECM is appropriate. The VECM is specified as
 $$\begin{equation}
\Delta {P_{r,t}} = {\beta _0} + \sum\limits_m^{} {{\gamma _{m \ne r}}{{\widehat \mu }_{m \ne r,t - 1}}} + \sum\limits_m {\sum\limits_{k = 1}^K {{\beta _{m,k}}\Delta {P_{m,t - k}} + {\varepsilon _{r,t}}} }
\end{equation}$$
$$\begin{equation}
\Delta {P_{r,t}} = {\beta _0} + \sum\limits_m^{} {{\gamma _{m \ne r}}{{\widehat \mu }_{m \ne r,t - 1}}} + \sum\limits_m {\sum\limits_{k = 1}^K {{\beta _{m,k}}\Delta {P_{m,t - k}} + {\varepsilon _{r,t}}} }
\end{equation}$$
Indices r and m both refer to the five major LMR regions for live cattle prices. The speed of innovation coefficient to be estimated is γ and varies across regions. This is a measure of how the price changes in one region respond to price shocks in other regions. Each regional equation has four speed of adjustment coefficients, one for each of the other regions. Lagged errors from the cointegrating equations are represented by  $\widehat \mu $. This error term ( $\widehat \mu $) represents the aforementioned price shocks. In other words, it is the deviation between observed price and the portion of price explained by structural component of the regional equation. ΔP is the lagged price change and is included for K lags in each region. We used Wald tests for lag exclusion to determine that two lags should be included (K = 2). βs are coefficients to be estimated, and ε is the error term. The vector error correction (VEC) framework allows for a test of Granger noncausality among cointegrated prices (Dolado and Lütkepohl, Reference Dolado and Lütkepohl1996; Enders, Reference Enders1995; Toda and Yamamoto, Reference Toda and Yamamoto1995). Prices in region m are said to not Granger cause those in region r if
 $$\begin{equation}
{\beta _{m,1}} = ... = {\beta _{m,k}} = 0.
\end{equation}$$
$$\begin{equation}
{\beta _{m,1}} = ... = {\beta _{m,k}} = 0.
\end{equation}$$
In other words, if the coefficients on any of the lagged price changes are statistically different from zero, Granger causality is present. In the context of the VEC framework, researchers generally refer to this test as a short-run relationship. As usual, Granger causality here indicates that knowing past information improves ability to predict future observations.
3.2. Directed Acyclic Graph Analysis
DAG analysis is a nonparametric method that provides a picture representing causal flow between price series (Bessler and Davis, Reference Bessler and Davis2004) and is appropriate for analyzing cointegrated price series when specified using covariance matrix of errors from the ECM model (Bessler and Davis, Reference Bessler and Davis2004; Haigh, Nomikos, and Bessler, Reference Haigh, Nomikos and Bessler2004; Saghaian, Reference Saghaian2010). DAG analysis identifies the causal relationship(s) between variables using an algorithmic approach. One option is the PC algorithm, which begins by assuming a nondirectional relationship between each variable (Spirtes, Glymour, and Scheines, Reference Spirtes, Glymour and Scheines1993). The relationship is represented graphically by a straight line, or edge, with no arrows. From there, the causal relationship is tested. If a statistically significant partial correlation does not exist, the edge is removed. For statistically significant relationships, the direction of the causal flow is determined (Haigh, Nomikos, and Bessler, Reference Haigh, Nomikos and Bessler2004; Saghaian, Reference Saghaian2010; Spirtes, Glymour, and Scheines, Reference Spirtes, Glymour and Scheines1993). Ultimately, each pair of variables will be connected by one of three possibilities: (1) no line, which means there is no causal relationship; (2) a line with no arrows, which indicates a relationship, but the directional flow is undetermined; or (3) a line with an arrow, which identifies the direction of the causal flow.
4. Data
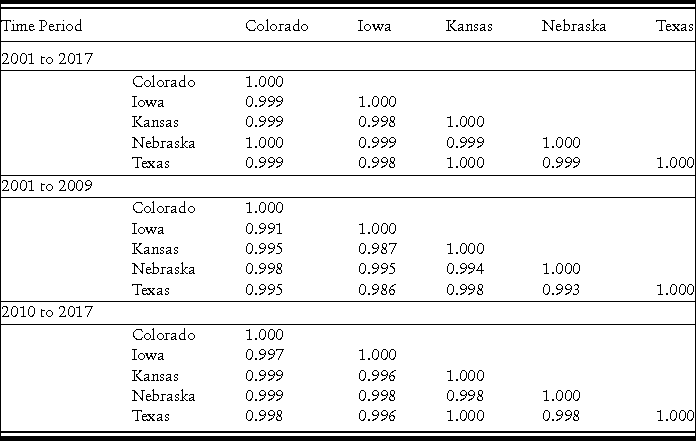
Live cattle price series were taken from USDA-AMS LMR data, compiled by the Livestock Marketing Information Center. Weekly price data from June 2001 to July 2017 were collected for negotiated live steer and heifer sales in the Colorado, Iowa/Minnesota, Nebraska, Kansas, and Texas/Oklahoma/New Mexico regions. Each region's weekly price is the weighted average of the live steer and heifer prices.Footnote 5 Figure 2 is a plot of weighted average of Kansas negotiated live steer and heifer prices over the time period analyzed. Though there are slight differences, plots of price series from other major reporting regions are similar. Since 2010, live cattle prices have reached higher levels and increased volatility, relative to 2001 to 2009. Based on these differences, we analyze the separate periods of 2001 to 2009 and 2010 to 2017, as well as the entire time period. Similar approaches to divide data based on levels and relative volatility have been used in the price discovery literature for livestock (Mathews et al., Reference Mathews, Brorsen, Hahn, Arnade and Dohlman2015) and grains (Arnade and Hoffman, Reference Arnade and Hoffman2015). Summary statistics for the price series are reported in Table 1. Correlations among the price series are shown in Table 2. As expected, cash prices in the five regions are highly correlated. Further, the correlations are similar across both time periods.
Weighted Average Weekly Negotiated Cash Prices of Slaughter Kansas Steers and Heifers

Descriptive Statistics of Weekly Negotiated Live Cattle Cash Prices

Correlations between Weekly Negotiated Live Cattle Cash Prices
5. Results
The VECM in equation (1) was specified using USDA-AMS price data assuming four cointegrating relationships. Three separate time periods were considered: 2001 to 2017, 2001 to 2009, and 2010 to 2017. As VEC coefficients are difficult to interpret (Bessler and Davis, Reference Bessler and Davis2004), we follow convention in the literature and do not report those directly (Bessler and Davis, Reference Bessler and Davis2004; Saghaian, Reference Saghaian2010; Stockton, Bessler, and Wilson, Reference Stockton, Bessler and Wilson2010).Footnote 6 Instead, we focus on the causal relationships identified by the VEC estimates using equation (2). Chi-square test statistics for all causality tests are reported in Table 3.
Vector Error Correction Model (VECM) Granger Causality/Block Exogeneity Wald Tests with Two Lags

Notes: Results are based on results from a VECM that included all five price series as endogenous variables. Each group of test statistics is based on the VECM equation with that particular price series as the dependent variable. Asterisks (** and *) represent statistical significance at the 0.05 and 0.10 levels, respectively.
The Granger causal relationships between the five live cattle cash markets differ over time. In the first period, between 2001 and 2009, Kansas was primary source of price information as it was found to Granger cause all other price series. However, Kansas did not lead any other markets in the more recent period of 2010 to 2017. Nebraska and Texas were also important sources of price discovery information from 2001 to 2009. Unlike Kansas, these two markets also lead multiple other markets when the analysis was broadened to include 2001 to 2017. Perhaps the starkest difference between time periods is the impact of Colorado prices on other markets. Over the entire sample, and in the recent time of 2010 to 2017, Colorado Granger caused prices in all four other regions. However, when the analysis focused on the years 2001 to 2010, Colorado did not lead prices for any other region. Another notable finding is that during 2010 to 2017, Colorado was the only market that Granger caused other price series.
Some of these changes correspond to changes the relative volumes of negotiated sales in the five major LMR regions. As the relative number of transactions in the Texas, and to a lesser degree Kansas, negotiated market have declined (see Figure 1), it would be reasonable to assume that the causal role of these markets has lessened over time. However, other differences are more difficult to reconcile with market conditions. For example, the negotiated live cattle market in Nebraska has grown, relative to the other four markets, but its causal effects disappeared in the 2010 to 2017 model. Further, Colorado has often represented less than 10% of the negotiated trade of the five regions but leads all other price series in 2010 to 2017.
When interpreting these results, it is helpful to remember that Granger causality is strictly measuring the usefulness of lagged information in explaining current information. Putting this in the language of live cattle price discovery and this research, Granger causality exists if one or both of the previous 2 weeks’ prices from one region statistically explain current prices in another region. However, weekly live cattle prices in different regions are not determined simultaneously. Bids and offers occur during the week with some regions trading earlier in the week than others. That means that the price information flow between markets during a given week could be an important part of live cattle price discovery that is overlooked by focusing only on Granger causal relationships.
DAG analysis complements Granger causality analysis by providing a picture of causal flow of price information, including contemporaneous information and without imposing a functional form or other restrictions (Bessler and Davis, Reference Bessler and Davis2004; Haigh, Nomikos, and Bessler, Reference Haigh, Nomikos and Bessler2004; Saghaian, Reference Saghaian2010). The covariances of the full VECM errors (innovations) are shown in Table 4. The variances and covariances of the VEC errors are noticeably greater in the later time period. These covariance matrices of the VECM were used to parameterize DAG analysis of the price series.Footnote 7
Covariance Matrices of Vector Error Correction Model Innovations

Figure 3 is a DAG of the live cattle price series from 2001 to 2017. In this case, every remaining edge has a direction identified at the 0.01 level.Footnote 8 As explained, the line with an arrow shows the causal flow of price information. For example, price information flows from the Iowa market to Colorado and Nebraska. With two arrows flowing away from it, the Iowa market is a stronger source of price information than any of the other four markets. Notice that this is the opposite of the Granger causality findings (Table 3) where lagged Iowa prices did not lead any other market. In fact, from 2001 to 2017, Iowa prices are the most dependent on the lagged prices of other markets as Iowa is the only price series that is Granger caused by all four other markets. This difference illustrates that value of using both methods as proposed in this study. Having absorbed the price information of lagged prices of other markets, Iowa prices became an important causal price series for within-week prices, as revealed by DAG. This potentially fits with bidding behavior in the negotiated cash market for live cattle. If Iowa bids and offers are based on past prices in other regions, cattle trade could occur early in the week in Iowa. Following this, other markets could use the Iowa trade to set prices for that week. The causal role of the Iowa market was different over the period, depending on whether lagged or contemporaneous prices were included.
Directed Acyclic Graph of Cash Negotiated Live Cattle Prices from 2001 to 2017 (note: graph generated with TETRAD 6.3.4 software using the PC algorithm at P = 0.01)

Figures 4 and 5 show DAG results for 2001 to 2009 and 2010 to 2017, respectively. Although, the DAG for 2001 to 2009 is similar to the figure for the entire period, there are three differences between the time periods. The Nebraska prices caused Iowa prices, Kansas prices cause Nebraska prices, and the relationship between Texas and Kansas has no direction assigned. The DAG for 2010 to 2017 (Figure 5) has only three directed edges. This implies that the within-week causal relationships were less well defined, relative to 2001 to 2009 where five directional relationships were identified. In the case of the most recent time period, Colorado is an information dump. That is, information only flows into Colorado. Again, this is in contrast to the Granger causality results for the same period (Table 3) that show Colorado prices leading all other markets. However, finding different conclusions with the VECM approach versus DAG does not mean that either is necessarily incorrect (Saghaian, Reference Saghaian2010). In the case of live cattle negotiated markets, this finding has an intuitive appeal. If Colorado is absorbing within-week price information, then that means cattle are likely trading there late in the week, after other markets have traded. If that is the case, Colorado prices from a previous week will contain the most and most recent information of any market and will be used by other markets to set bids and offers early in the week.Footnote 9 Again, the Colorado price series has a different causal role depending on whether lagged or within-week prices are considered.
Directed Acyclic Graph of Cash Negotiated Live Cattle Prices from 2001 to 2009 (note: graph generated with TETRAD 6.3.4 software using the PC algorithm at P = 0.01)

Directed Acyclic Graph of Cash Negotiated Live Cattle Prices from 2010 to 2017 (note: graph generated with TETRAD 6.3.4 software using the PC algorithm at P = 0.01)

A final point to note regarding the interpretation of these results is the difference in price movements in 2001 to 2009 compared with 2010 to 2017. Live cattle prices experienced an unprecedented bullish trend between 2010 and 2015. Both the Granger causality and DAG results are extreme compared with other model iterations.Footnote 10 Specifically, Colorado is the only region to Granger cause other regions, and all three directed edges present in the DAG flow into Colorado. Though the current analysis does not allow us to statistically test this, these extremes in price discovery could be more likely to occur in such a bullish market. If sellers’ default assumption is that prices are trending upward, then waiting until later in the week to sell would be rational. Cattle feeders in Colorado, a relatively smaller market, might base prices on trade in the relatively larger markets of Iowa, Nebraska, and Kansas. These same larger markets would then find the Colorado prices to be a starting point for the following week. At the same time, causal relationships between other markets existed, but the direction of information was unclear, suggesting the price discovery process in 2001 to 2009 differed from that of 2010 to 2017. Using VEC and DAG analysis together reveals these nuances.
6. Conclusions
This study used a VEC framework to determine Granger causality among live cattle prices in the five major LMR regions. The covariance matrix of the VEC errors was then used to parameterize DAG analysis of the same prices. Using both techniques allows assessment of how lagged and contemporaneous causality compare. Results show that lagged and contemporary causal relationships in live cattle price discovery have changed over time. Analyzing prices in the periods of 2001 to 2017 and 2001 to 2009 shows the five markets to be more connected by causal relationships than when the later period of 2010 to 2017 is isolated. Further, causal roles of markets differ depending on whether lagged (Granger causality in the VEC framework) or contemporaneous (DAG analysis) prices are considered. Results of this study emphasize the importance of understanding nuances of underlying markets and empirical techniques in price discovery analysis. Readers should note the limitations of the methods utilized in this study, as with other price discovery research cited, and interpret results accordingly. That is, we are able to measure statistical relationships between price series but interpret results to draw conclusions about price discovery activity. However, fit with conventional wisdom concerning live cattle markets and robustness of results (see footnote 9) adds credibility to our findings.
The share of live cattle marketed via cash negotiation continues to decline. At the same time, formula sales, which often depend on LMR negotiated prices, continue to grow. These two trends suggest that though use of negotiation as a live cattle marketing method is decreasing, the importance of negotiated prices to broader price discovery is not (Schroeder, Tonsor, and Coffey, Reference Schroeder, Tonsor and Coffey2018). Results of this study show that price information flow among cash markets has changed over the years. For example, the seemingly minor Colorado market actually played a major price discovery role from 2010 to 2017. If the results of this research are reflective of price discovery behavior in live cattle markets, participants in Iowa, Nebraska, Kansas, and Texas benefit from the Colorado prices and the information therein. As LMR evolves, consideration should be given to how this price discovery “work” being done in one region is used in another. For example, will it be appropriate, at some point, to compensate regions that negotiate and provide the information to other regions? If so, can this be accomplished without distorting markets?
Continued research is needed in this area and in analyzing why the five live cattle cash markets were less connected in 2010 to 2017 than in previous years and what the implications of this decrease in connectedness are. One area of needed research implied by our findings is how the similarity or dissimilarity of cattle in the Colorado market compared with the broader U.S. market might affect price discovery in the formula priced or forward contracted cattle. If Colorado prices influence week-to-week negotiated cash prices, it is reasonable to assume that they also influence formula prices (i.e., they might be used a base price). If this is the case, then a relatively small market is indeed pricing a large number of cattle. Presently, it is not clear how this might affect price discovery positively or negatively. However, the findings of this study indicate more research is warranted.


 Open access

