





A fundamental difficulty of speech comprehension is that listeners can come to understand different messages when presented with the same linguistic information (Cain, Oakhill, & Lemmon, Reference Cain, Oakhill and Lemmon2004). This can be especially problematic when one begins the endeavor of learning a new language. In particular, it is common for second language (L2) learners to struggle with intonation—i.e., the melodic contour of an utterance—in the target language (Trofimovich & Baker, Reference Trofimovich and Baker2006). The difficulties associated with intonation can result in comprehension and communication mishaps because the tune is associated with numerous parts of the linguistic system, such as sentence function, e.g., utterance type, syntactic constituency, as well as pragmatic function, e.g., information structure (Casielles-Suárez, Reference Casielles-Suárez2004; Erteschik-Shir, Reference Erteschik-Shir2007), speaker belief states (Pierrehumbert & Hirschberg, Reference Pierrehumbert, Hirschberg, Cohen, Morgan and Pollack1990), polite discourse (Astruc, Vanrell, & Prieto, Reference Astruc, Vanrell, Prieto, Armstrong, Henriksen and Vanrell2016), bias, or presupposition (Henriksen, Armstrong, & García-Amaya, Reference Henriksen, Armstrong, García-Amaya, Armstrong, Henriksen and Vanrell2016). The present study investigated how the perception of intonation during sentence processing develops in adult L2 learners.
Recent research on monolingual populations suggests that individual differences in pragmatic skills, such as empathy, may play a role in meaning disambiguation (Aziz-Zadeh, Sheng, & Gheytanchi, Reference Aziz-Zadeh, Sheng and Gheytanchi2010; Bishop, Reference Bishop2016; Esteve-Gibert, Portes, Schafer, Hemforth, & D’Imperio, Reference Esteve-Gibert, Portes, Schafer, Hemforth and D’Imperio2016; Esteve-Gibert et al., Reference Esteve-Gibert, Schafer, Hemforth, Portes, Pozniak and D’Imperio2020; Orrico & D’Imperio, Reference Orrico and D’Imperio2020). Concretely, higher empathy individuals, in comparison with lower empathy individuals, appear to be more sensitive to the intonational cues of speech during the process of forming sound-meaning associations. Furthermore, increased attention has been given to how individual differences in learner backgrounds play a role in the process of L2 acquisition (Hu et al., Reference Hu, Ackermann, Martin, Erb, Winkler and Reiterer2013; Liu, Reference Liu, Yu, Ke and Han2017; Rota & Reiterer, Reference Rota, Reiterer, Dogil and Reiterer2009). The present study contributes to these lines of research by examining how individual differences in pragmatic skills affect the development of intonation during sentence comprehension. Specifically, we investigated the interplay between language proficiency and an individual pragmatic skill (empathy) when learning an L2. We focused on the role of empathy in the development of L2 prosody by analyzing the perception of intonation in questions and statements in L2 Spanish. In addition, we considered the role of dialectal variation by exposing listeners to utterances from eight varieties of Spanish.
Background and motivation
L2 acquisition of prosody
The difficulties associated with learning an additional language in adulthood are numerous. More often than not, the focus falls on individual sounds, or segments, though there is evidence that adults who learn an L2 face suprasegmental challenges as well (Craft, Reference Craft2015; Thornberry, Reference Thornberry2014; Trofimovich & Baker, Reference Trofimovich and Baker2006, among others). Concretely, L2 learners often struggle with intonation, i.e., melodic variation at the utterance level. This is, in part, because in everyday discourse speakers can use intonation for numerous communicative functions, such as indicating syntactic structure, signaling pragmatic meaning, e.g., whether an utterance is a question or a statement, focusing constituents, conveying affective meaning, etc. Notably, the manner in which intonation is mapped to meaning is language-specific. As a consequence, L2 intonation is often produced in a non-target-like fashion due to cross-linguistic influence.
Intonation has a semantic function and through adequate cognitive decoding of the signal a listener can interpret the intended meaning of a given utterance. For example, an intonational contour can indicate to a listener whether the utterance of an interlocutor is a question or a statement. As touched upon above, a speaker can use prosody to signal numerous additional pragmatic functions as well. For example, an information-seeking yes/no question can be contrasted with an echo yes-no question in Chilean Spanish by using L + H* HH% or L* HH% nuclear contour, respectively (see Ortiz-Lira, Reference Ortiz-Lira2003; Ortiz-Lira & Cid-Uribe, Reference Ortiz-Lira and Cid-Uribe2000). This rich variation in pragmatic uses makes the interpretation and decoding of intonational contours during speech comprehension a non-trivial task for the language learner. Moreover, the use of first language (L1) prosodic features when speaking the target language can result in misunderstandings because the same prosodic features can convey different linguistic and paralinguistic meaning in the target language (Chen, Reference Chen2005; Cruz-Ferreira, Reference Cruz-Ferreira, James and Leather1987; Mennen, Reference Mennen, Trouvain and Gut2007; Pickering, Reference Pickering2001). As noted by Levis (Reference Levis2016), prosody is also “[…] critical for L2 pronunciation because it plays a major role in cementing social bonds as a key marker of social identity” (p. 154).
For learners interested in obtaining native-like pronunciation, intonation is particularly relevant, as prosodic features have been found to be important cues in the perception of non-target-like accents, above and beyond other features of language (Jilka, Reference Jilka, James and Leather2000; Munro, Reference Munro1995; Pettorino, De Meo, & Vitale, Reference Pettorino, De Meo, Vitale, Congosto, Montero Curiel and Salvador Plans2014). Nonetheless, intonation is not traditionally taught in the L2 classroom, perhaps because it is not common knowledge that proper control of prosody allows the learner not only to produce speech that is more intelligible but also to comprehend speech in varied communicative settings (de-la-Mota, Reference de-la-Mota and Rao2019; Derwing & Munro, Reference Derwing and Munro2015). The primary focus is generally placed on syntax and morphology, with target language phonology receiving much less, if any, attention (Rao, Reference Rao and Rao2019). When target language pronunciation is addressed, it often focuses on segmental elements (de-la-Mota, Reference de-la-Mota and Rao2019), despite the fact that merely being intelligible at the segmental level does not necessarily imply one will be pragmatically understood. As a result, some research has found that intonation is one of the last aspects of L2 phonology that learners acquire (e.g., Kvavik & Olsen, Reference Kvavik and Olsen1974).
Research on L2 intonation has been concerned primarily with speech production. Learner difficulties tend to be ascribed to L1 transfer, and models of L2 phonology, by and large, focus on the speech segment, as in the Speech Learning Model (SLM) revised (Flege & Bohn, Reference Flege, Bohn and Wayland2021), or contrasts between segments, i.e., PAM-L2, L2LP (Best & Tyler, Reference Best, Tyler, Bohn and Munro2007; Van Leussen & Escudero, Reference Van Leussen and Escudero2015, respectively). Theoretical work centered on prosody in the acquisition of L2 phonology is relatively much less common, though some researchers have considered how the aforementioned models might account for suprasegmental phenomena (see Trofimovich & Baker, Reference Trofimovich and Baker2006). One clear example of this is the L2 Intonation Learning Theory (LILt, Mennen, Reference Mennen2015). LILt incorporates the basic assumptions of the SLM and PAM-L2, that L2 categories similar to L1 categories may be assimilated, but L2 categories that are perceptually different may be incorporated as new categories. Under this model, cross-language differences may occur along one or more intonation dimensions (systemic, realizational, semantic, and frequency) (see also Ladd, Reference Ladd2008) and the age of onset of acquisition may influence the degree of success in acquiring elements in different dimensions of language variation.
A dearth of knowledge remains regarding how perception of intonation develops in L2 learning, and even less is known about how individual pragmatic differences account for learner outcomes. Similar to the SLM, LILt focuses mostly on intonation production rather than perception and adopts the assumption that difficulties in intonation production are perceptually motivated. The purpose of the present project was to address this gap in the literature by examining the perception of intonation during adult L2 phonological acquisition. For the present study, investigating L2 perception of intonation in statements and questions in L2 learners of Spanish provides an opportunity to examine how L2 perception develops and may differ from L1 perception, especially along the “semantic dimension” of the LILt model, which focuses on how intonation is used to convey meaning. Importantly, whereas LILt considers the influence of external factors such as age of acquisition on the success of learners, the present study investigated the role of empathy as a pragmatic skill on L2 acquisition of intonation, which contributes to our understanding of intonation development along a different dimension.
Acquisition of Spanish prosody
As with all phonetic phenomena, a lack of invariance in the acoustic content of prosodic realizations also increases the difficulty of the learner’s task. Beyond the level of the individual, however, dialectal differences can account for additional difficulties. Spanish is extensively spoken across the world, with relatively small geolectal differences between varieties when compared with other languages, such that speakers from distinct regions can still generally understand each other. That being said, phonetic variation is abundant. For instance, the pitch accent of the same utterance type—e.g., a broad focus statement—may be realized differently with regard to pitch movement and/or syllable duration depending on the variety. Intonational strategies can be different altogether. Consider information-seeking yes/no questions, which, in some varieties like Puerto Rican, Argentine, and Dominican Spanish, can be produced with a falling F0 contour (see Armstrong, Reference Armstrong, Prieto and Roseano2010; Gabriel et al., Reference Gabriel, Feldhausen, Pešková, Colantoni, Lee, Arana, Labastía, Prieto and Roseano2010; Willis, Reference Willis, Prieto and Roseano2010, respectively). These examples illustrate between-variety variability because they can differ from the more common final rise found in many other varieties of Spanish (see Hualde & Prieto, Reference Hualde, Prieto, Frota and Prieto2015).
Previous research on the acquisition of Spanish prosody has primarily focused on the production of statements and questions, particularly in the study abroad context, using pre-, post-test designs (see Craft, Reference Craft2015; Henriksen, Geeslin, & Willis, Reference Henriksen, Geeslin and Willis2010; Thornberry, Reference Thornberry2014; Trimble, Reference Trimble2013a, among others). Though the degree of improvement is variable based on a myriad of factors—such as context formality (Trimble, Reference Trimble2013a), use of Spanish (Henriksen et al., Reference Henriksen, Geeslin and Willis2010; Trimble, Reference Trimble2013a), social integration (Trimble, Reference Trimble2013a), or the development of meaningful social relationships with native speakers (Thornberry, Reference Thornberry2014)—this line of research suggests that learners gradually acquire target-like intonation as they gain experience in the L2.
There is a paucity of research on the perception of Spanish intonation, but limited studies corroborate the general finding in speech production that mastery is indeed possible for adult learners (Brandl, González, & Bustin, Reference Brandl, González, Bustin, Morales-Front, Ferreira, Leow and Sanz2020; Marasco, Reference Marasco2020; Nibert, Reference Nibert2005, Reference Nibert2006; Shang, Reference Shang2022; Trimble, Reference Trimble and Howe2013b). For instance, Trimble (Reference Trimble and Howe2013b) examined the perception of intonational cues in statements and yes/no questions in L1 English L2 Spanish adult learners that had studied abroad in Venezuela, Spain, or not at all. Using a gating task, Trimble (Reference Trimble and Howe2013b) found that intonational cues that were absent from participants’ L1 were difficult to perceive, though learners were more accurate with statements than questions, and that familiarity with the target variety improved accuracy. The investigation lends support to the general notion that the L2 intonation system develops in tandem with proficiency in Spanish, which was positively correlated with time spent studying abroad.
In a similar vein, Brandl et al. (Reference Brandl, González, Bustin, Morales-Front, Ferreira, Leow and Sanz2020) also investigated the perceptual development of intonation in questions and statements in L2 Spanish. Specifically, Brandl et al. (Reference Brandl, González, Bustin, Morales-Front, Ferreira, Leow and Sanz2020) examined the effect of L2 proficiency on the perception of broad focus and narrow focus statements and wh- and yes/no questions in adult L1 English L2 Spanish learners. The learners completed a forced-choice task in which they were presented audio and visual stimuli in matched and mismatched conditions. The participants’ task was to determine whether the sentence presented aurally was the same as the sentence presented visually. Brandl et al. (Reference Brandl, González, Bustin, Morales-Front, Ferreira, Leow and Sanz2020) found that perception and processingFootnote 1 of L2 intonation improved in conjunction with proficiency in Spanish, though it was conditional on the utterance type, with yes/no questions being more difficult to process and acquire when compared with statements. The authors concluded that perception of L2 intonation develops gradually in conjunction with L2 proficiency.
To summarize, the extant literature suggests that mastery of L2 perception of intonation seems feasible for adult learners, as processing speed and accuracy both improve as L2 proficiency increases. That being said, some utterance types present more difficulties than others. Furthermore, familiarity with the L2 variety can positively impact learner outcomes, which is particularly relevant given the rich phonetic and phonological variability attested in Spanish prosody. Much less is known regarding how perceptual development is modulated by individual differences, such as those related to pragmatic skill, though this is a recent and promising field of research that, moving forward, will help us understand individual variation (see also Bishop, Kuo, & Kim, Reference Bishop, Kuo and Kim2020; Shang, Reference Shang2022; Wiener & Bradley, Reference Wiener and Bradley2020).
Empathy and pragmatic skill
The construct empathy refers to one’s ability to infer the intentions of others. It is associated with understanding the feelings and emotions of those with whom one interacts (Baron-Cohen & Wheelwright, Reference Baron-Cohen and Wheelwright2004). Research on empathy has associated the construct with theory of mind and perspective-taking (Baron-Cohen, Reference Baron-Cohen2011; Carruthers, Reference Carruthers2009; Frith & Frith, Reference Frith and Frith2003). Importantly, in recent years empathy has served as a proxy for investigating individual pragmatic skill. From the perspective of the listener, empathy is likely critical because it allows one to understand the intentions of others, predict their behavior, and understand their emotions (Baron-Cohen & Wheelwright, Reference Baron-Cohen and Wheelwright2004). Researchers that work on this construct have described two types of empathy that oftentimes might be difficult to distinguish. On the one hand, affective empathy represents one’s ability to be emotionally aligned with the interlocutor and, on the other, cognitive empathy refers to recognizing and understanding the feelings and thoughts of an interlocutor. This suggests empathy is, to some degree, a necessary element when an individual seeks to understand and interact with its interlocutors in contexts involving literal and non-literal meaning.
The extant literature suggests that individual pragmatic skills modulate intonation processing (Bishop, Reference Bishop2016; Bishop, Chong, & Jun, Reference Bishop, Chong and Jun2015; Bishop & Kuo, Reference Bishop and Kuo2016; Diehl, Bennetto, Watson, Gunlogson, & McDonough, Reference Diehl, Bennetto, Watson, Gunlogson and McDonough2008). Studies on monolingual populations show that individual pragmatic skills correlate with variability in semantic/pragmatic interpretation of ambiguous linguistic items (e.g., Degen & Tanenhaus, Reference Degen and Tanenhaus2016; Nieuwland, Ditman, & Kuperberg, Reference Nieuwland, Ditman and Kuperberg2010). That is, in this line of research, individuals described as having higher pragmatic skill tended to prefer pragmatically enriched interpretations and individuals described as having less pragmatic skill tended to prefer more literal/semantic interpretations. In addition, more pragmatically skilled individuals have also been found to rely on different phonetic cues to parse syntactically ambiguous sentences when compared with less pragmatically skilled individuals (Bishop, Reference Bishop2016). Thus, one possibility is that variability in intonation perception is also linked to individual differences in pragmatic skills. A series of studies has investigated how empathy influences speech perception in monolingual populations (Esteve-Gibert et al., Reference Esteve-Gibert, Portes, Schafer, Hemforth and D’Imperio2016, Reference Esteve-Gibert, Schafer, Hemforth, Portes, Pozniak and D’Imperio2020; Orrico & D’Imperio, Reference Orrico and D’Imperio2020). This work operationalizes the construct empathy as a pragmatic skill and has focused on it as a source of individual differences.
For instance, Esteve-Gibert et al. (Reference Esteve-Gibert, Schafer, Hemforth, Portes, Pozniak and D’Imperio2020) examined how listeners with different levels of empathy interpreted intonation and meaning in contexts in which a temporary lexical ambiguity could only be resolved through intonation. Empathy was measured using the empathy quotient (EQ, Baron-Cohen & Wheelwright, Reference Baron-Cohen and Wheelwright2004), a self-report questionnaire, and participants were partitioned into groups corresponding with low or high empathy. Esteve-Gibert et al. (Reference Esteve-Gibert, Schafer, Hemforth, Portes, Pozniak and D’Imperio2020) tested French monolinguals in a visual world paradigm eye-tracking task that resembled a card guessing game. Target objects were homophones in French (e.g., cane, Eng. “female duck”; canne, Eng. “walking stick”). Esteve-Gibert et al. (Reference Esteve-Gibert, Schafer, Hemforth, Portes, Pozniak and D’Imperio2020) found that processing of the lexical ambiguity (the homophones cane/canne) was modulated by empathy level when intonation was the only cue available. Specifically, highly empathic individuals varied their looking behavior as a function of intonational cues while less empathic individuals did not. That is, higher empathy individuals, in comparison with lower empathy individuals, were found to be more sensitive to intonation cues in the process of forming sound-meaning associations. In short, individuals with more pragmatic skill (higher empathy) appear to be able to use intonation to resolve temporary lexical ambiguities that can lead to confirmatory vs. contrasting interpretations. This research underscores the importance of considering individual pragmatic differences when examining intonational meaning processing and sentence comprehension.
Related research in the SLA context is scant, though early studies included affective variables—such as attitude, motivation, empathy and, more recently, grit, among others—as they pertain to individual differences. Empirical studies on empathy are limited, though the construct received attention from scholars as early as the 60s and 70s (Brown, Reference Brown1973; Guiora & Acton, Reference Guiora and Acton1979; Guiora, Beit-Hallahmi, Brannon, Dull, & Scovel, Reference Guiora, Beit-Hallahmi, Brannon, Dull and Scovel1972; Guiora, Brannon, & Dull, Reference Guiora, Brannon and Dull1972; See Guiora, Taylor, & Brandwin, Reference Guiora, Taylor and Brandwin1968). The particular body of work linking empathy with SLA has focused on speech production, or, more specifically, on what early scholars considered “authentic pronunciation” and, more recently, “pronunciation aptitude” (see Rota & Reiterer, Reference Rota, Reiterer, Dogil and Reiterer2009), though no strong associations have been found. To the best of our knowledge, no studies have explored the construct empathy as it pertains to L2 perceptual development. Thus, at this time we do not know if empathy plays a role in L2 sentence processing in a similar manner to monolingual sentence processing. The present project extends this research to the SLA context to determine if individual differences in this pragmatic skill affect the development of intonation in L2 perception and sentence comprehension.
The present study
We investigated how proficiency and empathy are related to the development of L2 prosody by analyzing the perception of intonation in questions and statements in L2 Spanish. This study was preregistered on the Open Science Framework (https://osf.io/dg64r) and designed to address the following research questions:
-
1. Is perceptual development in L2 Spanish modulated by proficiency and intonation type (i.e., Brandl et al., Reference Brandl, González, Bustin, Morales-Front, Ferreira, Leow and Sanz2020)?
-
2. Do pragmatic skills—specifically, empathy—modulate the rate of development in L2 prosody?
-
3. Does speaker variety affect perception accuracy and processing speed?
Regarding RQ1, we hypothesize that accuracy will increase and processing time will decrease as a function of proficiency and intonation type. As shown in previous studies, yes/no questions (i.e., absolute interrogatives) ought to present the most difficulty for L2 learners of Spanish, followed by wh- questions (i.e., partial interrogatives) and broad focus and narrow focus statements. Based on the findings of Esteve-Gibert et al. (Reference Esteve-Gibert, Schafer, Hemforth, Portes, Pozniak and D’Imperio2020), we posit that prosodic development will occur sooner and at a faster rate in higher empathy individuals (RQ2). In this operationalization, “sooner” refers to lower proficiency levels in a cross-sectional design, that is, at an earlier developmental stage when compared with lower empathy individuals. Finally, with regard to RQ3, we hypothesize that, overall, L2 learners will have the most difficulty (lower accuracy, slower response time) with the Cuban variety. This hypothesis is grounded in exploratory analyses of pilot data collected from 120 monolingual Spanish speakers in which responses to the Cuban variety were the least accurate (see additional analyses in the OSF respository at: https://osf.io/zxkdt).
This project presents a conceptual replication of Brandl et al. (Reference Brandl, González, Bustin, Morales-Front, Ferreira, Leow and Sanz2020) in that we employ a similar experimental paradigm using similar stimuli in order to analyze the relationship between proficiency and L2 perception of intonation. Similar to Brandl et al. (Reference Brandl, González, Bustin, Morales-Front, Ferreira, Leow and Sanz2020), we include speakers from eight different varieties of Spanish in order to consider how dialectal variation influences perceptual development. We extend this research by taking into account pragmatic skill, specifically empathy, in L2 sentence processing. Importantly, this research builds on recent studies looking at the role of individual pragmatic skills in language comprehension and extends them to the field of SLA.
Method
Participants
Two hundred twenty-five individuals completed a two-alternative forced choice (2AFC) task in which auditory stimuli were identified as being questions or statements. Participants were recruited using the Prolific.ac online experimental platform and were compensated at a rate of $9.52 per hour for their time. We estimated the task would take approximately 15 minutes to complete; thus, each participant was paid $2.70 for completing all three tasks. The mean time to completion was approximately 13 minutes. The pool of participants was filtered using criteria set in Prolific.ac to ensure participants self-reported as being L1 English speakers born, raised, and currently living in the Northeastern US with no knowledge of any languages other than English or Spanish. They reported no hearing difficulties and were required to use headphones on a personal computer. Upon beginning the experiment, all participants responded to the following screening questions: 1) What part of the US are you from? 2) At what age did you begin learning Spanish? and 3) Are you proficient in any languages other than English/Spanish? Additionally, participants responded to the prompt “I am most familiar with Spanish from…” and using a pull-down window they selected a variety of Spanish or “I am not familiar with any variety of Spanish.” We excluded data from any participant that responded that they were not from the US Northeast, that they began learning Spanish before the age of 13, or that they were proficient in a language other than English/Spanish. Participants responding categorically across all trials were also excluded. In sum, participants were adult native speakers of American English with varying levels of proficiency in Spanish, ranging from functionally monolingual to highly proficient. All participants with knowledge of Spanish were adult L2 learners, operationally defined as having begun the endeavor of learning Spanish after the age of 13.
Tasks
The study consisted of three tasks: a 2AFC task, a lexical decision vocabulary assessment, and a Likert-type questionnaire to assess empathy. The tasks were programmed in Python using PsychoPy3 (Peirce et al., Reference Peirce, Gray, Simpson, MacAskill, Höchenberger, Sogo, Kastman and Lindelv2019) and presented online via Pavlovia. All code and materials used to generate the tasks are freely available on the Open Science Framework (https://osf.io/dh4zp/).
2AFC
In the 2AFC task, participants were presented an audio file containing a statement (broad focus or narrow focus) or a question (yes/no or wh-). Their task was to determine, as quickly and as accurately as possible, if the utterance they heard was a question or a statement. Specifically, they responded to an on-screen prompt asking “Is this a question?” using the keyboard. Participants typed “1” for “yes” (i.e., “yes, this is a question”) or “0” for “no” (i.e., “no, this is not a question”).
The auditory stimuli consisted of 64 critical items, 16 of each utterance type. The sentences were made up of three function words following a subject-verb-object (SVO) word order, which is the default in Spanish. The object was a noun with penultimate stress in all but three items. Subject pronouns were omitted in wh- questions. To generate the stimuli, we recorded native Spanish speakers of eight different varieties (Cuban, Peninsular-Madrileño, Peninsular-Andalusian, Puerto Rican, Chilean, Argentine, Mexican, and Peruvian). The eight native speakers all produced the same 64 critical items in a quiet room using professional recording equipment. The items were presented to the speaker on a screen. They were asked to read the item in silence to familiarize themselves with the context and to then read it aloud. To elicit narrow focus statements, one of the initiating authors read a question to the speaker and they responded. Table 1 provides an example of each utterance type.
Example stimuli from the 2AFC task

All utterances were segmented using Praat (Boersma & Weenink, Reference Boersma and Weenink2018) and normalized for peak intensity. A detailed description of the auditory stimuli is provided in the OSF respository at: https://osf.io/zxkdt. The 2AFC task included 64 trials in which the stimuli presented were randomized across speaker variety. Each variety had the same probability of being selected on a given trial, such that, on average, a given participant heard each variety approximately eight times (see online Supplementary Materials for more information). Prior to preregistering our research questions and hypotheses, we piloted the 2AFC experiment on 120 monolingual Spanish speakers to assess the difficulty of the task and establish a baseline for response times. We did not come across any issues. An exploratory analysis of the monolingual data is provided in the Supplementary Materials.
LexTALE
To assess Spanish proficiency, we administered the Lexical Test for Advanced Learners of Spanish (LexTALE-ESP, henceforth LexTALE) (Izura, Cuetos, & Brysbaert, Reference Izura, Cuetos and Brysbaert2014; Lemhöfer & Broersma, Reference Lemhöfer and Broersma2012). The LexTALE is a lexical decision experiment used to provide a standardized assessment of proficiency/vocabulary size in Spanish. In this task, participants see a series of words on the computer screen and must decide if they are real or fake using the keyboard (“1” for real, “0” for fake). LexTALE scores can range from −20 to 60. Monolingual Spanish speakers generally score above 50. Scores from individuals with little or no knowledge of Spanish tend to be negative. Adult learners with low to medium proficiency can range from 0 to 25, and advanced learners generally score above 25. We conceive of proficiency as a continuous variable and therefore consider a monolingual English speaker to have little to no proficiency in Spanish (i.e., a negative value on the LexTALE). In our data set, participant scores ranged from −16 to 55, suggesting all proficiency levels were likely represented in the sample. The mean score was 12.95 (95% CrI: [11.18, 14.72]) with a standard deviation of 13.60 (95% CrI: [12.38, 14.9]).
Empathy Questionnaire
The construct empathy was assessed using the EQ (Baron-Cohen & Wheelwright, Reference Baron-Cohen and Wheelwright2004). The EQ is a 60-item questionnaire that presents four point Likert-type items ranging from “strongly agree” to “strongly disagree.” Forty of the questions assess empathy and 20 are filler items. In order to avoid response bias, choices indicating empathic responses are coded to elicit “agree” responses in half the target items and “disagree” responses in the other half. The target items are scored with 2 or 1 points based on if the participant responds “strongly” or “slightly.” Finally, the EQ is scored by summing the total points to produce a single value indicating an individual’s level of empathy. Thus, the minimum possible value is 0 (low empathy) and the maximum is 80 (high empathy). In our data set, the average EQ was 37.88 (range: [9, 69], 95% CrI: [36.13, 39.68], SD: 13.39, 95% CrI of SD: [12.28, 14.67]). The EQ in its entirety is provided in the OSF respository at: https://osf.io/zxkdt.
Procedure
Participants recruited via Prolific.ac completed all three tasks in a single session. The 2AFC task was first, followed by the LexTALE task and, finally, the EQ questionnaire. We planned to collect data from approximately 300 individuals: 100 monolingual Spanish speakers not reported here and 200 L2 learners. Following Brandl et al. (Reference Brandl, González, Bustin, Morales-Front, Ferreira, Leow and Sanz2020), we assumed the effect size for perceptual learning was moderate in terms of the criteria set forth for L2 research by Plonsky and Oswald (Reference Plonsky and Oswald2014) (Cohen’s D = 0.600, Pearson’s r = 0.287). Based on this assumption, we estimated that we would need 94 participants to have an 80% chance of capturing the proficiency effect with a type II error rate of 5%. Our hypothesis related to empathy as a possible mediator of intonation processing is exploratory in nature; therefore, we did not base our sample size estimate on any parameter estimates related to this effect. That said, we believed the aforementioned exploratory effect was likely to be small, and, considering the resources necessary and available to us, planned to recruit 100 additional participants.
We excluded data from participants in the following circumstances: error during data collection, clear lack of understanding or engagement during the task (i.e., all “1” responses, failed three attention checks, etc.), participants reporting having learned Spanish before the age of 13, or participants with knowledge of languages other than English and Spanish. Data from a total of 78 participants were discarded because the experimental session timed out and/or data were incomplete. An additional eight participants were discarded due to low accuracy (n = 5), incomplete data (n = 2), and failed attention checks (n = 1). A total of 225 participants met the criteria for inclusion.
Statistical analyses
We report two primary statistical analyses that were preregistered prior to collecting the learner data: response accuracy and drift diffusion modeling. All additional analyses are exploratory in nature and explicitly described as such. First, we analyzed response accuracy using Bayesian multilevel logistic regression. The model considered response accuracy for the population effects utterance type (broad focus statement, narrow focus statement, yes/no question, wh- question), LexTALE score (i.e., proficiency), EQ, and the higher order interactions. The likelihood of the model was Bernoulli distributed with a logit link function. The criterion, response, was coded as “1” for correct responses and “0” for incorrect responses. Thus, the first analysis modeled the probability of responding correctly to the prompt “Is this a question?”. We specified group-level effects for participants, speaker variety, and items. The slope for utterance type varied for the participant effect, as did the LexTALE by EQ interaction for the speaker variety effect. All continuous variables were standardized and “yes/no questions” was set as the baseline for utterance type; thus, the model intercept represented the probability of a learner with average proficiency and average empathy responding correctly to a yes/no question.
The same model was fit to the response time data with the exception of the model likelihood, which was assumed to be distributed as lognormal. Response time was measured from the offset of the auditory stimuli. We arbitrarily excluded response times longer than 10 seconds, which represented 37 tokens of 14,400 (0.26%). Participants were able to respond at any time after the onset of the auditory stimuli. There was a total of 443 (3.08%) tokens with negative response times. Of this subset, learners responded with 80.36% accuracy; therefore, we added the minimum value of the data set as a constant to all response times. As a result, the response time distribution comprised only positive values, a requirement of drift diffusion models (see below). We also fit an additional exploratory model with the same population- and grouping-effects structure using d’ (d prime) as the outcome variable.
The second primary analysis utilized Bayesian drift diffusion modeling (DDM, Ratcliff & McKoon, Reference Ratcliff and McKoon2008). This approach to analyzing behavioral data models decision-making as a random-walk decision process. DDMs can simultaneously take into account responses and response times in two-choice tasks in a single model; thus, they are particularly beneficial when analyzing tasks in which speed-accuracy tradeoffs may be present. We estimate the parameters of the DDM using Bayesian methods and subsequently fit measurement error models on the posterior estimates of the resulting parameters.
A DDM estimates four parameters: boundary separation, bias, drift rate, and non-decision time. Boundary separation, α, quantifies the amount of information necessary to make a decision. The boundaries represent the thresholds for the two alternatives in the task, which, in our case, implies correct and incorrect responses. Bias, β, gives an indication of a preference for one of the choices at the beginning of the decision-making process. A positive bias value indicates a preference for the upper boundary, whereas a negative bias is an indicator of a preference for the lower boundary. The drift rate, δ, provides an assessment of the rate at which information is accumulated. A higher δ implies a random walk that arrives at one of the thresholds faster and is interpreted as an indication that the participant finds the task to be easier. Conversely, a lower drift rate is interpreted as indicating a more difficult task. The sign of the value is also relevant. Positive drift rate refers to evidence accumulation for the upper boundary and negative drift rate for the lower boundary. Finally, non-decision time, τ, models the part of the time course that is not associated with decision-making (e.g., the time necessary to perceive a stimulus prior to evidence accumulation). Figure 1 provides an example of a hypothetical DDM for the 2AFC task in the present project.
A drift diffusion model of the present study. The upper and lower bounds represent correct and incorrect responses, respectively. The boundary separation (α) is the distance between the two thresholds and indicates the evidence required to make a decision. Non-decision time (τ) represents the time course before evidence accumulation begins, i.e., time used for any process except decision-making. Bias (β) is the starting point for the evidence accumulation in the vertical plane (i.e., closer or further away from a given threshold), and drift rate (δ) quantifies the rate of evidence accumulation. The purple and orange lines represent examples of a decision resulting in a correct (purple) and incorrect (orange) decision. The corresponding density curves represent the distribution of response times at either threshold.

We estimated the aforementioned parameters by fitting a DDM to the response and response time data of each participant independently. We opted for this approach, as opposed to fitting a single model including all participants, for computational reasons. Put simply, the model likely would have taken weeks to fit, whereas the no-pooling (i.e., by-participant) method took approximately 26 hours. Thus, after fitting the DDMs, we obtained a posterior distribution of plausible values for boundary separation, drift rate, bias, and non-decision time for each participant. Next, we used measurement-error models to analyze boundary separation (α) and drift rate (δ) independently. These models followed the same functional form as the response accuracy model described above. That is, in two separate models, we analyzed the boundary separation and drift rate data as a function of utterance type (yes/no question, wh- question), LexTALE score (i.e., proficiency), EQ, and the higher order interactions. The primary difference between the measurement-error models and the traditional regression analyses described for the response data is that the former can incorporate a measure of uncertainty around a point estimate. To give a concrete example, the analysis of the boundary separation data included the posterior median and the standard error for each participant as the outcome variable, as opposed to using just a single point estimate.
For all models, we included regularizing, weakly informative priors (Gelman, Simpson, & Betancourt, Reference Gelman, Simpson and Betancourt2017). Generally, we sample from the posterior distribution of a given model for statistical inferences. To assess our preregistered hypotheses we established a region of practical equivalence (ROPE) around a point null value of 0 (see Kruschke, Reference Kruschke2018) using the following formula:
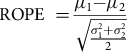 $${\text{ROPE}}\;{\text{ = }}\frac{{{\mu _{\text{1}}} - {\mu _{\text{2}}}}}{{\sqrt {\frac{{\sigma _{\text{1}}^{\text{2}}{\text{ + }}\sigma _{\text{2}}^{\text{2}}}}{{\text{2}}}} }}$$
For all models, median posterior point estimates are reported for each parameter of interest, along with the 95% highest density interval (HDI), the percent of the region of the HDI contained within the ROPE, and the maximum probability of effect (MPE). For statistical inferences, we focus on estimation rather than decision-making rules, though, generally, a posterior distribution for a parameter β in which 95% of the HDI falls outside the ROPE and a high MPE (i.e., values close to 1) are taken as compelling evidence for a given effect. All exploratory analyses, explicitly described as such, include posterior point estimates, the 95% HDI, and the MPE. We conducted all analyses using R and fit all models using the probabilistic programming language stan via the R package brms (Bürkner, Reference Bürkner2017, Reference Bürkner2018). Finally, we provide more information for all analyses in the Supplementary Materials.
Results
Response accuracy
Figure 2 (left panel) summarizes the posterior distribution of the omnibus response accuracy model, illustrating point estimates with 66% and 95% HDIs in graphical form. An equivalent summary of the posterior distribution in table format is provided in the OSF respository at: https://osf.io/zxkdt. The log odds of a correct response to a yes/no question at the average proficiency and EQ levels were 0.53, or approximately 62.95% (β = 0.53, HDI = [0.23, 0.82], ROPE = 0, MPE = 1). In comparison, all other utterance types were associated with an increase in the log odds of responding correctly. The right panel of Figure 2 plots response accuracy of each utterance type in the probability space. As illustrated in the plot, participants were slightly more accurate when responding to wh- questions (β = 0.43, HDI = [0.17, 0.65], ROPE = 0, MPE = 1) with approximately 72.31% correct, and much more accurate when responding to declarative statements (narrow focus: β = 2.13, HDI = [1.84, 2.37], ROPE = 0, MPE = 1, accuracy = 93.46%; broad focus: β = 2.34, HDI = [2.05, 2.59], ROPE = 0, MPE = 1, accuracy = 94.63%).Footnote 2
Forest plot summary of the response accuracy model (left panel) and posterior probability of a correct response for each utterance type (right panel). For both plots, white points represent posterior medians along with 66% and 95% highest density credible intervals.

Figure 3 plots response accuracy as a function of utterance type and proficiency (left panel) and EQ (right panel). For all utterance types, response accuracy increased as proficiency increased. Though the proficiency effect was most visually obvious for yes/no questions (β = 0.28, HDI = [0.15, 0.41], ROPE = 0, MPE = 1) and wh- questions (β = 0.40, HDI = [0.24, 0.57], ROPE = 0.00, MPE = 1.00), this was also the case for broad-focus (β = 0.48, HDI = [0.26, 0.71], ROPE = 0.00, MPE = 1.00) and narrow-focus (β = 0.31, HDI = [0.10, 0.51], ROPE = 0.00, MPE = 1.00) statements. There was no evidence that empathy level predicted response accuracy for yes/no questions (β = −0.02, HDI = [−0.11, 0.09], ROPE = 0.98, MPE = 0.62); however, for wh- questions (β = 0.18, HDI = [0.05, 0.32], ROPE = 0.09, MPE = 1.00), broad focus statements (β = 0.23, HDI = [0.04, 0.42], ROPE = 0.07, MPE = 0.99), and narrow focus statements (β = 0.24, HDI = [0.07, 0.42], ROPE = 0.03, MPE = 1.00), we find compelling evidence that the effect is positive.
Conditional effects of a correct response as a function of proficiency (LexTALE score) (left panel) and empathy quotient (right panel) for each utterance type. Thin lines represent 300 draws from the posterior distribution for each condition and illustrate uncertainty (95% HDI) around the posterior medians (thick lines).

The omnibus model also estimated the proficiency × EQ simple interaction for each utterance type. We used the posterior distribution to estimate the probability that this effect was non-zero for each utterance type. We found evidence that the proficiency effect was modulated by EQ scores for wh- questions (β = 0.22, HDI = [0.05, 0.39], ROPE = 0.06, MPE = 0.99), though not for yes/no questions (β = 0.02, HDI = [−0.09, 0.14], ROPE = 0.93, MPE = 0.65), broad focus statements (β = 0.10, HDI = [−0.14, 0.35], ROPE = 0.46, MPE = 0.80), nor narrow focus statements (β = 0.04, HDI = [−0.17, 0.25], ROPE = 0.65, MPE = 0.64). This relationship is illustrated in Figure 4. Specifically, we plot conditional effects of response accuracy as a function of proficiency and EQ for the yes/no and wh- questions. In the left panel of Figure 4, one observes a positive correlation between response accuracy and proficiency that remains constant at standardized EQ values of −1, 0, and +1 for the yes/no questions. For the wh- questions (right panel), on the other hand, we see that the slope of the proficiency effect increases for higher EQ values. That is to say, for wh- questions, at a given proficiency level, learners with higher empathy (black lines) tended to respond more accurately.
Probability of a correct response as a function of LexTALE score while holding empathy quotient scores constant at −1, 0, and +1 standard deviations from the mean for each question type. Thin lines represent 300 draws from the posterior distribution and indicate uncertainty (95% HDI) around the posterior medians (thick lines).

With regard to response accuracy and response time differences based on speaker variety, we used the speaker variety grouping effect from the omnibus model to obtain posterior estimates (see Figure 5). As was the case with the monolingual Spanish pilot data, learners were least accurate when responding to the Cuban variety and most accurate when responding to the Peninsular-Madrileño and Mexican varieties. Response accuracy to a given variety did not correlate with response times. For instance, although learners were least accurate when responding to the Cuban stimuli, they had average response times similar to the grand mean for this variety.
Grouping-level estimates of response accuracy and response time as a function of speaker variety. Red points represent posterior medians along with 66% and 95% highest density credible intervals. The vertical dotted lines indicate the grand mean.

Drift diffusion models
As described previously, we fit a drift diffusion model to each participants’ data in order to obtain estimates for boundary separation (α) and drift rate (δ). Specifically, we fit two Bayesian measurement error models with the same functional form: boundary separation or drift rate as a function of utterance type, proficiency (LexTALE score), and EQ. Given the high accuracy on declarative statements, we focus our analyses on yes/no and wh- questions. Figure 6 provides a forest plot summarizing the two models.
Forest plot summary of boundary separation (α, white circles under purple distributions) and drift rate (δ, white triangles under orange distributions) error measurement models.

Averaging over utterance type and holding proficiency and EQ constant at the distribution means, posterior medians were positive for both boundary separation (β = 1.77, HDI = [1.70, 1.83], MPE = 1) and drift rate (β = 1.23, HDI = [1.20, 1.26], MPE = 1). Boundary separation was slightly lower in wh- questions (β = −0.04, HDI = [−0.08, −0.01], MPE = 0.99), suggesting that, overall, learners needed less information in order to make a decision when presented with questions of this type. Drift rate, on the other hand, was higher for wh- questions (β = 0.08, HDI = [0.06, 0.10], MPE = 1), which indicates that learners arrived at the decision threshold at a faster rate and, thus, found this type of utterance to be easier. This corresponds with the finding that overall learners were more accurate responding to wh- questions than yes/no questions by approximately 10% (mean difference: β = 9.30, HDI = [3.74, 14.05], ROPE = 0.00, MPE = 1.00). Taken together, we can surmise that the “average” learner has a lower threshold of required information in order to make a decision and arrives at this threshold at a faster rate for wh- questions in comparison with yes/no questions.
Crucially, in both models we also find evidence for a proficiency × EQ interaction. For both question types, boundary separation increased as a function of proficiency, but the association was conditional on EQ score (β = 0.12, HDI = [0.03, 0.20], MPE = 1), with low empathy individuals seeing little to no change in estimated α. The effect was reversed for drift rate. In this case, estimated δ increased as a function of proficiency in low empathy individuals, and higher empathy individuals, particularly those with higher proficiency levels, saw decreases in drift rate (β = −0.06, HDI = [−0.11, −0.02], MPE = 1). To illustrate more clearly the practical relevance of these interactions, we ran 2,000 simulations from the drift diffusion model. Figure 7 plots the simulations for each question type at low/high proficiency and empathy levels (±2 standard deviations). Individual lines represent random walks. The walk ends when enough evidence is accumulated and a decision threshold (horizontal, discontinuous gray lines) is reached. The upper threshold indicates a decision leading to a correct response and the lower threshold an incorrect response. Thick red lines indicate the simulation average for correct/incorrect responses in each condition. Focusing on the lower row of plots (high empathy), moving from left to right (low proficiency to high proficiency) within each question type, one observes (a) an increase in boundary separation (α), i.e. a greater distance between thresholds, via the horizontal gray lines, and (b) a decrease in drift rate (δ), i.e., a slower rate of information accumulation leading to a decision, via the horizontal distance of the red lines. In practical terms, this implies that high proficiency, high empathy learners required more information to reach a decision and responded at a slower rate, compared to low empathy learners (top row), regardless of proficiency level.
Two-thousand simulations of the drift diffusion model for interrogative utterances as a function of empathy quotient (low/high) and LexTALE score (low/high). Low and high levels represent ±2 standard deviations above/below the mean. Horizontal, discontinuous gray lines indicate decision thresholds and dark red lines represent the simulation averages.

Discussion
The present work explored how the comprehension of intonation develops in adult L2 learners of Spanish. We used a 2AFC task in which participants determined whether or not utterances presented in auditory stimuli were questions. Our study represents a conceptual replication of Brandl et al. (Reference Brandl, González, Bustin, Morales-Front, Ferreira, Leow and Sanz2020), but extends this research to address recent findings suggesting that individual pragmatic skill—in the context of the present work, empathy—plays a role in the process of forming sound-meaning associations. We used Bayesian methods, in particular DDM (Ratcliff & McKoon, Reference Ratcliff and McKoon2008), to analyze data from 225 L2 learners. We find that perception and processing of intonation develops in tandem with proficiency in the target language and is, to some degree, modulated by the construct empathy. This study set out to address three preregistered research questions that we will now revisit.
The first question, Is perceptual development in L2 Spanish modulated by proficiency and intonation type?, was developed as a direct result of the previous literature examining the acquisition of Spanish prosody (i.e., Brandl et al., Reference Brandl, González, Bustin, Morales-Front, Ferreira, Leow and Sanz2020; Trimble, Reference Trimble and Howe2013b). Response accuracy to all utterance types was positively correlated with proficiency, as measured by LexTALE scores. This corroborates the general finding that development of L2 intonation is positively correlated with target language proficiency, for both production (Craft, Reference Craft2015; Henriksen et al., Reference Henriksen, Geeslin and Willis2010; Thornberry, Reference Thornberry2014; Trimble, Reference Trimble2013a, among others) and perception (Brandl et al., Reference Brandl, González, Bustin, Morales-Front, Ferreira, Leow and Sanz2020; Nibert, Reference Nibert2005, Reference Nibert2006; Trimble, Reference Trimble and Howe2013b). In contrast with previous studies, our analyses conceptualized proficiency as a continuous variable, obviating the need to arbitrarily assign learners to proficiency groups. This operationalization will benefit future research interested in quantifying the effect of proficiency on perceptual development by allowing for more transparent designs with regard to statistical power and sample sizes. In line with previous studies (e.g., Brandl et al., Reference Brandl, González, Bustin, Morales-Front, Ferreira, Leow and Sanz2020), we found that yes/no questions were most difficult for L2 learners of Spanish, followed by wh- questions and broad focus and narrow focus statements. An exploratory analysis using d’ found that learner sensitivity to the utterance types followed the same pattern. While it is not clear exactly why yes/no questions are the most difficult, one possibility is that wh- questions pose less of a challenge because they contain a wh- word (e.g., cuándo, cómo, etc.). In other words, it might be the presence of a lexical cue in our task (and that of Brandl et al., Reference Brandl, González, Bustin, Morales-Front, Ferreira, Leow and Sanz2020) that facilitates the interpretation of a wh- question in addition to intonation. At this juncture, this possibility cannot be discarded, though it is worth noting that the presence of these words alone does not imply a question. That is to say, in specific contexts these same words can appear in statements as well, in some cases with a pitch accent (i.e., Qué beba María) and in others without (i.e., Que bebe María). A particular intonation contour is typically present to force a question interpretation and said contour can vary between and even within varieties.Footnote 3 Moreover, apart from the propositional content, a wh- question also implies a presupposition and, thus, is more pragmatically complex. On the other hand, the yes/no questions in our experimental task have the same syntactic structure as the declarative statements. Perhaps for this reason, yes/no questions require more effort and attention to intonation in order to be distinguished from statements in our task.
Additionally, our study addressed the question Do pragmatic skills—specifically, empathy—modulate the rate of development in L2 prosody? This question was motivated by a line of research showing that empathy influences language processing in monolingual populations (Esteve-Gibert et al., Reference Esteve-Gibert, Portes, Schafer, Hemforth and D’Imperio2016, Reference Esteve-Gibert, Schafer, Hemforth, Portes, Pozniak and D’Imperio2020; Orrico & D’Imperio, Reference Orrico and D’Imperio2020). Though the construct empathy has been considered in the SLA literature, the current body of research is limited to studies on pronunciation accuracy (i.e., Guiora, Brannon, et al., Reference Guiora, Brannon and Dull1972; Rota & Reiterer, Reference Rota, Reiterer, Dogil and Reiterer2009, among others). Thus, we extend research on empathy to L2 phonological acquisition as it relates to speech perception. Using a cross-sectional design, we show (1) that empathy, as measured by the EQ (Baron-Cohen & Wheelwright, Reference Baron-Cohen and Wheelwright2004), did indeed modulate response accuracy and the decision-making process and (2) how empathy affected sentence processing was related to L2 proficiency. Specifically, we found response accuracy increased as a function of proficiency, independent of empathy for yes/no questions, but not wh- questions. In the case of the latter, we found empathy to have a compounding effect on the correlation between accuracy and proficiency, such that higher empathy individuals showed more accuracy at lower proficiency levels when compared with their lower empathy counterparts. This is taken as evidence suggesting that empathy can potentially modulate the rate of development of L2 prosody. In other words, higher empathy individuals may develop L2 prosody at an earlier stage than lower empathy individuals. That being said, we do not find the same effect with yes/no questions. This finding is quite puzzling, particularly because previous research on sentence processing has found an effect for empathy in yes/no questions, e.g., in Salerno Italian (Orrico & D’Imperio, Reference Orrico and D’Imperio2020). At this time, we are uncertain as to why our results differ in this regard, though the nature of the outcome variable measured in the task used in Orrico and D’Imperio (Reference Orrico and D’Imperio2020) (certainty scores bounded at 0 and 100) may have provided a more fine-grained window into the effect of empathy.
In addition to addressing response accuracy, we also show that for high proficiency, high empathy learners (1) more information was necessary to reach a decision and (2) responses came at a slower rate when compared with low empathy learners at any proficiency level. This interaction effect on sentence processing was found for both types of interrogative utterances. Previous research on monolingual populations has shown that higher empathy individuals are more sensitive to intonation cues in the process of forming sound-meaning associations than lower empathy individuals. Our findings support the notion that this is also true for adult L2 learners, though we show that increased sensitivity does not necessarily imply increased processing speed. Given that empathy comprises the cognitive process of identifying the emotional state of another living being as well as the affective process of experiencing a similar sensation within oneself, it is plausible that higher empathy individuals showed more sensitivity to intonation cues and unconsciously devoted cognitive efforts to this process because they tended to require more information during decision-making. On the contrary, other individuals, which did not require as much information for reaching a decision, likely did not employ the same cognitive and affective processes related to empathy.
Our third research question addressed the effect of speaker variety on L2 perceptual development. Specifically, we asked Does speaker variety affect perception accuracy and processing speed? This question was motivated by Brandl et al. (Reference Brandl, González, Bustin, Morales-Front, Ferreira, Leow and Sanz2020), who raised the possibility that dialectal or sociolectal variation could have influenced participants’ responses in their data. Their study included stimuli from eight varieties of Spanish, though this factor was not considered in their analysis. Building on Brandl et al. (Reference Brandl, González, Bustin, Morales-Front, Ferreira, Leow and Sanz2020), our auditory stimuli also included eight distinct varieties of Spanish. We found that, generally, speaker variety did indeed affect response accuracy. As was the case with our pilot data from monolingual Spanish speakers, learners were most accurate responding to stimuli from the speaker of Peninsular-Madrileño Spanish, and least accurate when responding to the Cuban variety. Interestingly, accuracy with a given variety did not correlate with response times in a straightforward way. For instance, participants did not respond faster to the Peninsular-Madrileño variety even though they were more accurate in their responses to this speaker.
The results of our study suggest that speaker variety does affect perception accuracy, though this does not necessarily map directly on to processing speed. One possibility put forward in the literature is that the variety matters insomuch that it is familiar to the listener (see Perry, Mech, MacDonald, & Seidenberg, Reference Perry, Mech, MacDonald and Seidenberg2018; Trimble, Reference Trimble and Howe2013b). In other words, learners may be more accurate and process speech faster when listening to a variety they know well. Our study took into consideration familiarity, though the variety that was cited as being the most familiar, U.S. Spanish (35% of 225 responses), was not one of the varieties presented in the stimuli.Footnote 4 Mexican (21%) and Peninsular-Madrileño (20%) Spanish were reported as being the second and third most familiar varieties, and no participants indicated Cuban Spanish as being the variety to which they were most familiar. To explore the effect of familiarity further, we conducted a non-preregistered analyses of the data from the participants who claimed to be most familiar with a Spanish variety that was included in our speaker varieties: Peninsular and Mexican Spanish.Footnote 5 We coded the participants’ responses to familiar versus unfamiliar varieties and fit a Bayesian logistic regression model to the data (addtional information is provided in the OSF respository at: https://osf.io/zxkdt). In short, we find that, marginalizing over proficiency and empathy, participants were indeed more accurate when responding to a familiar variety. This is true for all utterance types to a certain extent but is more clearly the case for questions, likely because responses to declarative utterances were near ceiling. Figure 8 plots the familiarity effect for this subset of the data.
Response accuracy as a function of utterance type for unfamiliar and familiar Spanish varieties. Values represent posterior medians along with the 95% HDI for unfamiliar and familiar conditions (left panel), as well as the posterior difference (familiar–unfamiliar; right panel). The posterior predictive distribution is based on data from 91 participants who claimed to be familiar with Mexican (n = 47) and Peninsular (n = 44) Spanish.

Another plausible explanation for variety-specific difficulties lies in cross-linguistic differences in the prosodic realizations of the distinct utterance types. Yes/no questions in Peninsular-Madrileño Spanish, for example, have the common final rise found in many other varieties of Spanish, as well as Standard American English. Cuban and Puerto Rican Spanish, on the other hand, typically have a final fall (see Alvord, Reference Alvord2006; Armstrong, Reference Armstrong, Prieto and Roseano2010, Reference Armstrong2012; Hualde & Prieto, Reference Hualde, Prieto, Frota and Prieto2015; Sosa, Reference Sosa1999, among others). In our data, we do indeed find that L2 and native listeners are less accurate when responding to stimuli with final falls (see additional analyses in the OSF respository at: https://osf.io/zxkdt), though these varieties were also considered to be less familiar. Ultimately, our experimental design does not allow us to say definitively whether dialectal variation at the suprasegmental level accounts for variety-specific difficulties (as opposed to additional variation at the level of the segment, for example), though this reasoning is in line with previous studies, i.e., Trimble (Reference Trimble and Howe2013b).
A final possibility is that speech rate differences associated with the speakers of the stimuli we used may have resulted in some varieties being more or less difficult for the learners (see Baese-Berk & Morrill, Reference Baese-Berk and Morrill2019). In an exploratory analysis of the auditory stimuli, we found that speech rate had no effect on response accuracy, as some of the varieties to which participants responded most accurately were also the fastest (e.g., the stimuli from our Mexican speaker). See Figure 13 of the Supplementary Materials for visualizations and further discussion.
In sum, the present work contributes to our knowledge of an understudied construct, empathy, as it pertains to speech. Additionally, this is the first time, to our knowledge, that drift diffusion models have been used to analyze behavioral data relating to empathy in SLA. We also underscore the general need for models of L2 phonology, such as the SLM-r (Flege & Bohn, Reference Flege, Bohn and Wayland2021), PAM-L2 (Best & Tyler, Reference Best, Tyler, Bohn and Munro2007), L2LP (Van Leussen & Escudero, Reference Van Leussen and Escudero2015), etc., to address the acquisition process beyond the level of the segment. The LILt model (Mennen, Reference Mennen2015) has served as a starting point in the analysis of intonation across languages and L2 acquisition of intonation, framing the process of L2 acquisition of intonation along different developmental and structural dimensions, and has provided the theoretical grounding for numerous L2 studies (see Sánchez Alvarado & Armstrong, Reference Sánchez Alvarado and Armstrong2022; Sánchez-Alvarado, Reference Sánchez-Alvarado2022, among others). The findings of the present study are in line with LILt since they show that perception of intonation in an L2 progresses with higher proficiency. In addition, these findings also emphasize the need for models like LILt to account for how individual differences in pragmatic skills, such as empathy, can influence learner outcomes. A complete model of speech learning should account for both causal prediction and imputation at the segmental and suprasegmental levels. The present study aimed to address this gap in the literature by examining the role of proficiency and empathy on the perception of intonation during sentence processing in adult L2 phonological acquisition.
While the findings of our research suggest there is a relationship between target language proficiency and empathy, it is important to underscore that we do not make any claims about causality. Future research would benefit from considering the learnability of empathy (i.e., Bertrand, Guegan, Robieux, McCall, & Zenasni, Reference Bertrand, Guegan, Robieux, McCall and Zenasni2018; Lam, Kolomitro, & Alamparambil, Reference Lam, Kolomitro and Alamparambil2011) as it relates to L2 outcomes. Furthermore, the cross-sectional design of the present work is not ideal for addressing how empathy levels affect the rate at which perception of L2 intonation develops. Only longitudinal data can appropriately address this issue. On that note, at this time, research on speech perception and empathy is limited to intonation. A fruitful avenue for novel research ought to examine how empathy is related to perception and spoken word recognition at the segmental level. A primary focus of the present project was to expand the line of research involving empathy and intonation perception in two ways: first, to individuals with different linguistic experience (specifically, L2 learners) and, second, to different communicative situations (utterance types). This project was not concerned with understanding why different pitch contours affect intonation perception, particularly with regard to the role of empathy, primarily because there is inherent variability in how speakers realize their communicative intentions, at both the variety and individual level, within utterance types. This variability is also present in our stimuli. Future research would benefit from exploring why and how particular acoustic realizations of pitch within utterance types lead to distinct processing outcomes and how they might interact with pragmatic skill.
Conclusion
The present study investigated the development of L2 perception of intonation. Specifically, this study explored the relationship between target language proficiency and an individual pragmatic skill, empathy, in the process of learning Spanish as a second language by analyzing the perception of intonation in questions and statements. We find that perception of intonation in sentence processing develops in tandem with proficiency in the target language and interacts with individual empathy levels, supporting the general conclusion that higher empathic individuals, in comparison with lower empathic individuals, appear to be more sensitive to intonation cues in the process of forming sound-meaning associations. Importantly, increased sensitivity does not necessarily entail increased processing speed. The results motivate the inclusion of measures of pragmatic skill, such as empathy, to better account for intonational meaning processing and sentence comprehension in second language acquisition research.
Replication package
All research materials, data, and analysis code are freely available at: https://osf.io/dh4zp/.
Acknowledgments
We would like to express our gratitude to Miquel Simonet for comments and suggestions on a previous version of this research. We are also grateful to three anonymous reviewers for insightful comments that improved the quality of this work. All errors are ours alone. This research received no external funding. The study was conducted according to the guidelines of the Declaration of Helsinki and approved by the Institutional Review Board of the Rutgers University. All participants gave their informed consent for inclusion before they participated in this study.
Authors’ note
The authors made the following contributions. Joseph V. Casillas: Conceptualization, data curation, formal analysis, funding acquisition, investigation, methodology, project administration, resources, software, supervision, validation, visualization, writing—original draft preparation, writing—review and editing; Juan José Garrido-Pozú: Conceptualization, investigation, methodology, resources, writing—original draft, writing—review and editing; Kyle Parrish, Laura Fernández Arroyo, and Nicole Rodríguez: Conceptualization, investigation, methodology, writing—original draft, writing—review and editing; Robert Esposito: Conceptualization, investigation, methodology, writing—review and editing; Isabelle Chang: Conceptualization, investigation, methodology, writing—original draft, writing—review and editing; Kimberly Gómez: Conceptualization, investigation, methodology, writing—original draft; Gabriela Constantin-Dureci: Writing—review and editing; Jiawei Shao and Iván Andreu Rascón: Writing—original draft, writing—review and editing; Katherine Taveras: Writing—review and editing.


 Open access

