


Few issues are as politically contentious as immigration. Citizens increasingly cite it as a chief concern shaping their vote choice (Gallup, 2019), and the salience of the immigration issue in parties' appeals to voters has grown dramatically in recent decades (Dancygier and Margalit Reference Dancygier and Margalit2020). Yet notably, both the public discussion and the academic literature on mass attitudes on immigration have largely lumped together two very different components of the immigration phenomenon: the flow and the stock. Whereas the immigrant flow refers to foreigners living overseas and seeking to migrate into the country, the immigrant stock refers to foreigners who already immigrated and are living in the country. When expressing apprehension about immigration and its impacts, which group are native citizens primarily concerned with? If there are systematic differences in public attitudes toward the immigrant stock and flow, what are they and what explains the variation?
The distinction between the stock and flow is particularly pertinent given the striking disconnect between the focus of public opinion research on immigration and the difference in magnitude between the two phenomena. As Figure 1 highlights, between 2000 and 2016, the annual flow of immigration into the United States was equivalent to only 3–7 per cent of the stock of authorized and non-naturalized immigrants residing in the country,Footnote 1 compared to approximately 11 per cent in other Organisation for Economic Co-operation and Development countries. In other words, the annual immigration flow typically represents a mere fraction of the immigration stock. Yet strikingly, as we document below, a large majority of the research studying public opposition to immigration has focused on natives' attitudes toward the flow of immigrants into the country.
Annual immigration stocks and flows in the United States, 2000–2016
Note: data are from the US Census Bureau and the Department of Homeland Security, Office of Immigration Statistics. The calculation of the immigrant stock excludes naturalized and non-authorized migrants, who constitute about 25 per cent of the total immigration stock in the United States. Lines represent the absolute size of immigration flows and stocks.

While it could be that the public's attitude toward the stock and flow of immigrants is similar, there are good theoretical reasons why natives may hold systematically different views regarding the two groups. On the one hand, natives may be more apprehensive about the stock of immigrants because of its sheer size. If a chief concern among White natives is their declining share as a majority (for example, Craig and Richeson Reference Craig and Richeson2014; Kaufmann Reference Kaufmann2018), they should exhibit the strongest support for policies designed to encourage the stock of non-naturalized immigrants – mostly non-White – to leave. Such policies could include, for example, making it harder for immigrants to obtain permanent residence and citizenship if they are using welfare assistance programs, a policy advanced by the Trump administration's initiative to expand the ‘public charge’ clause.Footnote 2
On the other hand, since at least some of the non-naturalized immigrants residing in the country have already begun integrating socially, natives may feel more accepting of the immigrant stock.Footnote 3 Moreover, their presence in the country could generate a sense of moral obligation among the native ‘hosts’, a sentiment they might not feel toward potential migrants who have not yet arrived. Finally, greater opposition to the immigrant flow may also stem from the fact that denying entry to future visa applicants is a relatively impersonal act, as opposed to expelling people residing in the country who have a proverbial name and a face.
Given that these theoretical conjectures generate opposing predictions about natives’ likely views about the stock and flow of immigrants, it is unclear ex ante what empirical patterns we should observe. Further, previous public opinion surveys were not designed to address the stock–flow distinction; as such, they do not allow analysts to infer whether (or how) attitudes toward the two groups differ. For example, the fact that more Americans see establishing stricter policies to prevent people from overstaying their visas as an important policy goal (77 per cent) than the share that prioritizes taking in refugees (61 per cent) or encouraging more highly skilled immigrants to come to the United States (58 per cent), does not necessarily tell us that people prefer immigration flows over stocks (Suls Reference Suls2017). Each of these policies has different costs, targets a different subset of immigrants and uses different policy tools. In comparing public support towards immigrants, the stock–flow distinction is therefore difficult to isolate without a tailored research design.
This article tackles these issues by asking how and why citizens' attitudes differ with respect to the two groups. We begin by theorizing about the different implications of the immigration stock and flow on native citizens, and then test those predictions using novel experimental data. We also examine how findings in the literature on the determinants of immigration attitudes hold up when taking account of the stock–flow distinction.
Our analysis, which focuses on the United States, reveals several findings of note. First, we find that native citizens’ views differ in systematic ways when dealing with granting the stock of immigrants the right to stay as opposed to granting a new flow of immigrants the right to enter. Natives exhibit a significant and discernibly more accepting view of the former. This ‘stock premium’ is evident across a wide range of sub-groups of respondents: men and women, young and old, low and highly educated, liberals and conservatives.
In examining the sources of the stock premium, our analysis indicates that it is not the result of native citizens holding different beliefs, or stereotypes, about the characteristics of the immigrant stock and flow. In fact, natives conceive of members of both groups in remarkably similar terms on a range of dimensions, including their work ethic, level of religiosity and proclivity to violence. Furthermore, we find no evidence that greater social contact with immigrants residing in the country is associated with a larger stock premium. Put differently, familiarity does not appear to breed acceptance.
The main explanation for the differential attitude is that natives exhibit a stronger sense of moral obligation toward people residing in the country. Consequently, they focus on different dimensions of the immigration question when making judgements about the desired level of migration, and exhibit a stronger focus on migrant characteristics related to their economic potential when dealing with potential flows than with stocks.
Taking account of the stock–flow distinction also illuminates earlier findings on immigration attitudes in a different light. For example, prior research shows that while native citizens often disagree about the desired level of immigration into the country, they share a ‘hidden consensus’ about the type of immigrants they wish to see in the country (Hainmueller and Hopkins Reference Hainmueller and Hopkins2015). Our findings indicate that this consensus looks rather different when dealing with stocks and flows. Specifically, natives seem more forgiving toward immigrants already residing in the country, and thus assign less importance to certain individual characteristics when assessing how accommodating immigration policy should be toward those individuals.
Moreover, while we observe that native citizens express a preference for skilled over non-skilled immigrants in the context of both stocks and flows (in line with Hainmueller and Hiscox Reference Hainmueller and Hiscox2010), we also find that natives place greater emphasis on characteristics related to immigrants' employment prospects when dealing with foreigners due to arrive than with immigrants living in the country.
Most directly, our findings contribute to the growing literature on immigration attitudes (Hainmueller and Hopkins Reference Hainmueller and Hopkins2014; Malhotra, Margalit and Mo Reference Malhotra, Margalit and Mo2013). Not only do we show that the ‘stock premium’ is prevalent among natives, but the heterogeneity we observe across population subgroups and immigration circumstances suggests that public preferences vary systematically depending on whether the debate centers on policies dealing with one type of immigration or the other.
From a political standpoint, our findings indicate that one should be cautious about inferring public preferences from one type of immigration to the other. For example, support for building a wall or for introducing a ‘point system’ for visas – policies aimed at restricting a future flow – does not necessarily imply that there is also support for policies designed to make it harder for immigrants residing in the country to stay, such as the Trump administration's aforementioned policy to broaden the ‘public charge’ or its effort to end the Deferred Action for Childhood Arrivals (DACA) program. Put differently, the politics of immigration might be very different when dealing with curtailing the future flow of immigrants as opposed to reducing the existing stock.
Finally, we note that this study focuses on public attitudes toward authorized immigration. Yet of course, undocumented immigration is a concern among native voters and often the target of strong opposition. Theoretically, this concern is relevant with respect to both undocumented immigrants living in the country and those expected to enter in the future. In the concluding section, we discuss ways to broaden this research project to take account of the stock–flow distinction in the context of undocumented immigrants.
Attitudes on Immigration: About Stocks or Flows?
‘Do you think the number of migrants permitted to come to [host country] to live should be increased, left the same as it is now or decreased?’
Scholars of immigration are well familiar with this question, one of the most common items in widely used surveys. The General Social Survey (GSS), the American National Election Study, the European Social Survey and the International Social Survey Program all use this question – sometimes exclusively – to gauge public opinion on immigration.Footnote 4 Consequently, a large share of public opinion analyses on immigration is based on this survey item (Card, Dustmann and Preston Reference Card, Dustmann and Preston2012; Sides and Citrin Reference Sides and Citrin2007; Wright and Citrin Reference Wright and Citrin2011).
This survey question, like many others utilized in the literature studying public attitudes on immigration, is focused on the entry of future migrants into the country. This focus on flows is evident in both observational and experimental studies. But notably, the literature largely ignores the distinction between the two components, and inadvertently treats the investigation of attitudes on one as applying to the other component as well.
Table 1 presents our classification of the survey items used in all studies covered in a recent comprehensive review of articles dealing with attitudes toward immigration (Hainmueller and Hopkins Reference Hainmueller and Hopkins2014). Studies fall into one of four categories based on their focus: flows, stocks, both or neither. As the table indicates, of the seventy-eight relevant studies covered in the review, 38 per cent focus solely on immigration flows, compared to just 19 per cent that focus on immigration stocks.
The focus on flows and stocks in the literature
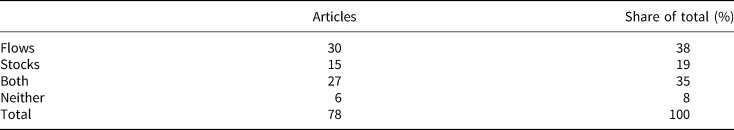
Note: based on the authors' classification of all relevant studies covered in the review on public attitudes toward immigration by Hainmueller and Hopkins (Reference Hainmueller and Hopkins2014).
Not all studies focus explicitly on either flows or stocks; some studies use survey questions that generically refer to ‘immigration’ or ‘immigrants’, without specifying which type of immigration they are asking about. For example, ‘To what extent do you think immigration is an important issue in the coming elections?’ (Dunaway, Branton and Abrajano Reference Dunaway, Branton and Abrajano2010; Hopkins Reference Hopkins2011). When analyzing responses to such items, the researcher cannot tell which type of immigration respondents had in mind when answering the question.
Finally, some studies use multiple survey items that account for both flow and stock, either separately or as components of an index. Yet even then, the items differ in meaningful ways. Whereas questions about flows typically focus on preferred levels of immigration, those about stocks often ask about immigrants’ perceived impact on the host country (Hopkins, Tran and Williamson Reference Hopkins, Tran and Williamson2014). Thus composite measures that include both types of items may mask systematic variation in how people think about immigration stocks and flows. Whether such a differentiation actually exists in people's minds and what explains the variation remain open questions.
Why Might Public Attitudes Toward the Stock and Flow of Immigrants be DIfferent?
Different sentiments among natives toward the immigrant stock and flow may result from a number of factors. In this section we theorize about potential factors and their likely implications on variation in public attitudes toward immigration.
Contact and Social Networks
The classic intergroup contact theory holds that contact between a majority in-group and ethnic minorities can heighten levels of empathy and reduce discriminatory behavior, a process that would be in line with natives holding more positive views toward the immigrant stock (Allport Reference Allport1954; Pettigrew Reference Pettigrew1998; Scacco and Warren Reference Scacco and Warren2018). One source of difference in attitudes toward the stock and flow of immigrants could therefore be natives' contact with the former and lack of it with the latter. Yet for contact to translate into more favorable views of the minority group, contact theory stipulates a set of fairly restrictive conditions that need to be in place: equal status between groups, common goals, intergroup cooperation and institutional support. In practice, these conditions are often not met, and research that systematically investigates their interaction with intergroup contact is lacking (Paluck, Green and Green Reference Paluck, Green and Green2018; Pettigrew and Tropp Reference Pettigrew and Tropp2006). We expect that the absence of these conditions in many real-world environments – most notably, the lack of institutional support and the increasingly hostile politics surrounding immigration – would lessen the effects associated with contact.
Moreover, when ideal conditions are not met, an opposite effect may occur, whereby members of the in-group majority come to feel more threatened by the minority out-group (Enos Reference Enos2014; Hangartner et al. Reference Hangartner2019). Thus while the argument suggests that natives' attitudes toward the stock and flow would differ as a result of contact, the direction of the effect is unclear in advance.
By contrast, being a former immigrant or a relative of immigrants living in the country is likely to generate a ‘stock premium’. Native citizens who are related to resident-alien immigrants in the country are most certain to have a strong preference for their relatives' inclusion and acceptance in society, which may generate more favorable sentiments toward the broader stock of immigrants residing in the country.
Group Characteristics and Stereotypes
Earlier studies have convincingly demonstrated that citizens' judgments of immigrants are affected by their characteristics, particularly those relating to the immigrants' ability to contribute economically (such as language proficiency and professional skills). Moreover, immigrant attributes related to their chances of cultural assimilation, such as religious affiliation, country of origin, and knowledge about the native culture, are also shown to exert a sizable effect on natives' views toward those immigrants (Bansak, Hainmueller and Hangartner Reference Bansak, Hainmueller and Hangartner2016; Valentino et al. Reference Valentino2017; Solodoch Reference Solodoch2020). Thus native citizens may hold systematically different attitudes toward the stock and flow of immigrants if they perceive the members of the two groups as having meaningfully different characteristics.
Such a perception among natives could develop because of the continuously changing patterns of immigration into the United States – perhaps most notably the change in the source countries of immigration. In recent decades waves of migrants from Latin America and Asia have replaced the predominance of earlier waves of migrants from Europe (Zong Batalova and Hallock Reference Zong, Batalova and Hallock2019). These changes are driven by several factors, including important shifts in US immigration law, particularly the abolishment of the national-origin admission quotas. These changes resulted in immigration waves that were not only less White, but also more negatively selected (Hatton and Williamson Reference Hatton, Williamson, Langhammer and Foders2006).Footnote 5 Appendix Table A3 shows that over the last two decades, the share of migrants holding at least a Bachelor's degree grew by 8 percentage points; the share of migrants from South Asia grew by 3 points, while the share of migrants from Mexico and Europe had dropped by 4 and 5 points, respectively.Footnote 6 Although these changes seem moderate given that they took place over two decades, if natives perceive the trend of negative selection as likely to worsen, attitudes toward potential future flows should be more hostile than those toward the stock of resident aliens who arrived in earlier waves.Footnote 7
Perceptions regarding the different characteristics of the two groups could also result from the process of integration that the stock of immigrants in the country has already undergone. In fact, the single most significant predictor of immigrants' degree of integration is years of residency in the host country (Harder et al. Reference Harder2018). Thus as immigrants residing in the country integrate economically and assimilate culturally, natives' views about the characteristics of the immigrants, such as their work ethic, tolerance or even degree of ‘Americanness’, could be very different from those associated with future newcomers. However, such differences may not materialize because citizens are often very poorly informed about immigration, including its magnitude, characteristics and trends (Grigorieff, Roth and Ubfal Reference Grigorieff, Roth and Ubfal2017; Hopkins, Sides and Citrin Reference Hopkins, Sides and Citrin2019). Therefore, despite possibly meaningful objective differences between the immigrant stock and likely future flows, natives may nonetheless have similar perceptions about the characteristics of both groups.
Moral Obligation
Differences in natives' sentiments toward the immigrant stock and flow may also result from a sense of greater moral obligation toward those already living in the country, including resident aliens, than to people living outside the country. This sentiment is echoed in the famous precept from the Talmud, the primary source of Jewish religious law, which states that ‘Your city's poor come first’. The precept's broader dictum is that after the primary responsibility to one's own household, responsibility to the needy in one's midst takes precedence over those in need who are further removed.Footnote 8
The public may view people already living in the host country as having earned the right to stay in the country because they have paid taxes, contributed economically and abided by the nation's laws. Since reciprocity is a norm many people hold dear and follow, natives may prioritize stocks over flows. In line with this proposition, decreased welfare spending is associated with larger immigration inflows rather than the size of the immigrant stock (Soroka et al. Reference Soroka2016). Indeed, a large literature shows that attitudes toward social policies are strongly driven by perceptions of deservingness (Gilens Reference Gilens2009). Reciprocity is recognized as one criterion that shapes people's perceptions of others' deservingness, where the ‘more deserving are those needy people who have contributed to our group before’ (Oorschot Reference Oorschot2000). Yet research suggests that another criterion of control – that is, whether one is responsible for their situation of need or whether it is caused by reasons out of their control – is an even stronger factor shaping perceptions of deservingness. In fact, assessments of responsibility are often the dominant consideration shaping people's sense of deservingness (Swaan Reference Swaan1988; Van Oorschot Reference Van Oorschot2006). In the context of immigration, this logic suggests that refugees, namely people who are persecuted and forcibly displaced from their source countries, would be seen as similarly deserving when considered as either part of the flow or the stock of migrants, because their lack of control over their dire circumstances would override any difference between the two groups on the dimension of reciprocity.
A greater sense of moral obligation toward the immigrant stock could also be the result of people's stronger inclination to aid individuals they can identify, rather than amorphous targets of assistance, a pattern known as the ‘identifiable victim effect’ (Slovic Reference Slovic2010). As research shows, people exhibit the highest level of compassion when a single life is being considered as the subject of assistance; it drops as the number of lives increases and the target of aid becomes less concrete (Västfjäll et al. Reference Västfjäll2014). If the immigrant stock is perceived as a demarcated and clearly defined group, which is not the case for the future flow of migrants, the difference in identifiability of the target could underlie a differential attitude toward the two groups.Footnote 9 Specifically, natives are expected to exhibit more favorable views toward the migrant stock.
As described above, considerations stemming from a sense of moral obligation suggest that we should generally observe a ‘stock premium’ in the attitudes of natives. However, this premium is likely to be weaker in cases where the migrant flow also elicits a moral obligation (for example, people fleeing persecution), or when the flow is a specific – and hence identifiable – visa applicant.
The section above centered on three theoretical reasons why native citizens might hold different views toward the stock vs. flow of immigrants. These reasons are not mutually exclusive. Moral obligations, perceptions of group characteristics and contact could all play a role in shaping public opinion. Nor do they constitute an exhaustive list.
Other factors, such as status quo bias or reluctance to deport immigrants, can also generate a differential attitude toward the two groups. Status quo bias refers to a preference for maintaining the current state of affairs, where any change from the status quo baseline is perceived as a loss. Since the stock of immigrants is already living in the host country while admitting the flow of immigrants means letting new people enter the country from abroad, status quo bias suggests that natives will be more tolerant of the stock than the flow of migrants. Another observationally equivalent explanation might be a reluctance to deport resident aliens, because deportation might be perceived as either a more morally agonizing task, or a more costly procedure, than preventing the admission of future immigrants.
While all three mechanisms – status quo bias, reluctance to deport and moral obligation – predict a stock premium, they are not observationally equivalent. The first two mechanisms predict the same stock premium across different types of immigrant groups, while only the third suggests that the stock premium will differ as a function of the moral considerations the immigrant group stirs. Refugees, for example, will benefit least from the stock premium since natives often feel morally obliged to assist them even when they are not present in the country. In contrast, economic migrants – for whom natives are least likely to feel a sense of moral obligation – are expected to receive the largest premium in favorability when they already reside in the country. Moreover, although all three mechanisms suggest a more favorable attitude among natives toward the immigrant stock, only the moral obligation mechanism suggests that natives would use moral reasoning in their thinking about the immigrant stock while using a more utilitarian (economic) reasoning when thinking about the immigrant flow.
Finally, although the size of the immigrant stock is substantially larger than the typical annual figure of the immigrant inflow, the stock represents a better-defined and contained group. In contrast, despite the relatively modest numbers of the average inflow, the potential size of the migrant flow can be large, particularly considering the immense number of people who wish to migrate from the developing world to the West. The potential scope of the immigration flows, and that fact that there is less certainty about their size and pace, might generate a greater sense of threat among the native population.
The various explanations described above generate different predictions regarding natives’ attitudes toward the stock and flow of immigrants. Next, we describe the experimental set-up we use to test these different explanations.
The Location Experiment
The data presented in this study are based on a national survey carried out in February 2019 in the United States, and administered by Lucid.Footnote 10 Respondents were drawn by quota sampling to match the US population in terms of gender, age, region, ethnicity and level of education.Footnote 11 After collecting general information about respondents' demographic characteristics and general political dispositions, respondents were randomly assigned to be in one of two groups. All subjects participated in the Location Experiment, in which members of the first group were asked questions about immigrants who reside abroad and wish to enter the United States, whereas those assigned to the second group were asked about resident aliens who reside in the United States as non-citizens and wish to renew their visa.
To make sure participants understood which immigrant group the questions were asking about, all participants were first required to read a short preamble paragraph that described the group. This description included the group's visa status (new applicants for immigration visas/ resident alien immigrants), current location (born overseas and living outside the United States/ born overseas but now living officially in the United States as non-citizens) and the consequences of denying applications submitted by group members (cannot enter the United States/ must leave the United States). Moreover, to make sure that subjects in both treatment groups had a broadly similar image of migrants in mind, the preamble also mentioned the same reasons for visa applications submitted by both immigrant groups (for example, for work or family reunification).Footnote 12 Immediately after reading the preamble, all respondents were asked a series of questions regarding their attitudes toward the specific immigrant group described in the preamble. To make sure respondents were aware of the exact group in question, the survey repeated the group description multiple times.
Subjects were then asked to express their view regarding the number of visa applicants the United States should approve (approve none, approve few, approve about half, approve most or approve all). For ease of interpretation, in the analyses below we dichotomize the outcome variable to take a value of 1 for respondents who support approving either ‘most’ or ‘all’ applicants and 0 otherwise.
The Stock Premium
We begin by examining whether natives' views differ with respect to immigrant stocks and flows. To make sure the treatment effects stem from the location of immigrants – whether they are living abroad or already residing in the country – we held constant other potentially relevant factors, including group size and its potential degree of economic integration.Footnote 13 The left panel of Figure 2 presents the share of respondents answering that they would like the United States to approve most or all applicants of the immigrant group they were asked about. While 47.9 per cent of the subjects in the stock treatment group supported accepting most or all visa applicants, the corresponding rate of support was only 39.1 per cent among respondents in the flow treatment group. This 8.7-percentage-point difference – the stock premium – is both statistically significant and substantively large, representing an increase of 22.4 per cent above the baseline rate of the flow.Footnote 14 To contextualize this effect, consider the fact that this premium is 53 per cent greater than the difference in average support for immigration (both stock and flow) between Hispanic and non-Hispanic White respondents. The stock premium is also similar to the effect size of some college or an associate degree over having no formal education, and 3.6 points larger than the effect of being an independent vs. being a Republican.
Immigration stock premium (Panel A) and effect heterogeneity (Panel B)
Note: bars and whiskers in Panel A represent average support for approving most or all visa applications in each treatment condition with 95 per cent confidence intervals, respectively. Markers and lines in Panel B indicate the stock premium (in percentage points) for respondents in each social group with 95 per cent confidence intervals, respectively. The stock premium is calculated as the average support for admitting most or all visa extension applications (stocks) minus the average support for admitting most or all new immigration visas (flows).

Panel B examines whether the stock premium is a feature across different social groups. The markers represent the gap in support for immigration stocks minus support for immigration flows. Horizontal lines denote 95 per cent confidence intervals. Notably, among all groups, without exception, support for approving visa applications of that immigrant stock is a good deal higher, ranging from a 5.1-point gap among Democrats to 13.2 points among Republicans (representing a 46 per cent increase among the latter).Footnote 15 Attitudes toward the immigrant stock are not only more positive; they are also less politically polarized. In fact, the partisan opinion gap shrinks by 8 percentage points, from 23 points over immigration flows to 15 points over the stock of migrants.
Why do People Favor the Immigration Stock?
The analysis above established that the stock premium in immigration attitudes is prevalent, and often sizable, among a wide array of social groups among the native population. Next we examine the empirical support for several potential explanations for this premium that were described earlier.
One explanation for the stock premium may be natives’ social contact with the immigrants residing in the country. If people feel closer to, and more trusting of, immigrants they have gotten to know, they may exhibit more favorable views toward the immigrant stock than toward the yet-to-arrive flows.
To gauge the merits of this explanation, we coded two binary measures denoting whether the respondent has regular contact with immigrants and whether one of her parents was born outside the United StatesFootnote 16 An additional measure we use to capture levels of contact with immigrants is the share of Hispanic residents in the respondent's county.Footnote 17
If familiarity with immigrants is an important driver of the stock premium, we should observe a strong interaction effect, whereby natives who have more frequent contact with immigrants, or even have immigrant relatives, would exhibit ceteris paribus a larger stock premium than those who have lower levels of contact with the immigrant stock.
Table 2 presents the results. For each variable – immigrant parents, self-reported contact with immigrants and the share of Hispanic residents in the county – we present two models. The first model uses the full sample, while the second restricts the analysis to non-Hispanic White respondents. As the table shows, we find no support for this conjecture: the interaction term between contact with immigrants and the stock treatment is well below statistical significance, as is the interaction between family members and the stock treatment. These findings indicate that the stock premium is similar in size among people with a high or low degree of contact with immigrants. Notably, in all cases the main effect of the stock premium remains consistent and sizable.
Contact or family relations with immigrants

Note: standard errors in parentheses. Both models control for respondents' gender, race, education, political leanings and state fixed effects. High Contact denotes respondents who ‘sometimes' or ‘often’ come in contact with immigrants. Immigrant Parent denotes respondents for whom at least one of the parents was born outside of the United States. * p < 0.05, ** p < 0.01, *** p < 0.001
A second explanation for the stock premium might be that natives perceive the two groups of immigrants as systematically different in a range of important characteristics. This could be because of the likely origins of those expected to arrive compared to those already present, or because of the socioeconomic integration that immigrants residing in the country may have achieved. To test this mechanism, we presented respondents with ten scales, each representing a certain characteristic, and asked them to describe their perception of the immigrant group in question along each of the scales. For example, respondents assigned to the stock (flow) treatment were asked what education level they thought characterized the immigrant stock (flow), ranging from ‘highly educated’ to ‘not educated’ (see Appendix Figure A1 for a screen capture of the task).
Figure 3 presents the results. For each treatment group, markers denote the share of respondents who associate immigrants with the stereotype listed on the right-hand side of the scale (for example, peaceful vs. violent).Footnote 18 Strikingly, natives have remarkably similar perceptions of migration visa applicants living abroad and resident aliens living in the United States. This pattern holds across the board, including when asked about immigrants' skills, control of the English language or proclivity to work hard.
Treatment effects on perceived immigrant characteristics
Note: black and gray markers indicate the proportion of respondents choosing the group characteristic listed in the right end of each scale for the flows and stocks treatments, respectively. Horizontal lines represent 95 per cent confidence intervals.

This absence of differences across all dimensions indicates that natives not only hold very similar views of the immigrant stock and flow, but also that the integration of the immigrant stock in American society does not substantially differentiate them in the public's eye from the future flow of immigrants. This is perhaps most notable in the almost identical share of respondents perceiving the immigrant stock and flows as ‘Not American’.
The third explanation for the stock premium has to do with the different locations of the two groups and the subsequent implications of rejecting immigrants’ visa applications. Specifically, we postulated that people feel some sense of moral obligation toward those residing in their country, including immigrants, a sentiment they do not feel toward people living in other countries. Moreover, this difference should be particularly notable in cases where there are no other sources of moral obligation toward those who wish to migrate to the United States, such as refugees escaping persecution or people separated from their families.
To test these hypotheses, we collected attitudes on specific types of immigrants in a separate question. Respondents in the flows [stock] treatment group were asked:
People applying for admission into the U.S. [extension of their visa status], do so for various reasons. With regard to each of the following reasons for immigration, how many of the applications should the U.S. approve? Remember, those whose immigration visa [visa extension] is not approved will not be allowed to enter [be required to leave] the U.S.
Respondents were asked to indicate the share of applications they would support approving in three cases: where immigrants are seeking visa approval due to (1) family reunification, (2) better job prospects or (3) escaping political or religious persecutionFootnote 19 (approve none, approve some, approve most or approve all). As before, we recoded this variable so that 1 denotes approval of most or all applicants, and 0 otherwise.
Figure 4 presents the proportion of respondents approving most or all visa applicants in each treatment group, by reason of application. As the figure indicates, the stock premium is significant and large for job seekers, with a 15 per cent increase above the flows' baseline rate, and decreases when the reason for the visa application stimulates stronger normative commitments.Footnote 20 These findings are consistent with the notion that natives feel some sense of moral obligation toward immigrants who are living in the country. However, once other sources of moral obligation also arise with respect to the flows, as in the case of persecuted asylum seekers, the distinction between deportation and blocking of entry becomes more blurred. Importantly, this pattern is at odds with the hypotheses that the stock premium is entirely driven by a status quo bias or by people's reluctance to deport resident aliens. Rather, it is more compatible with the notion that moral obligation and perceptions of deservingness are at play. While native citizens consider the immigrant stock to be more deserving, when the immigrants in question are persecuted and have little control over their situation, this criterion of deservingness seems to prevail and diminishes the stock premium.
Stock premium and normative commitments
Note: bars indicate for each treatment group the share of respondents that chose to approve most or all applicants, by reason for visa application. Vertical lines represent 95 per cent confidence intervals.

If a sense of moral obligation indeed underlies some of the ‘stock premium’ we observe, we could also expect native citizens to be less interested in the economic benefits and costs associated with the immigrant stock compared to the flow of immigrants.Footnote 21 To assess this claim, we also asked respondents how relevant they think the professional skills and age of the immigrant are for determining whether an application is accepted.Footnote 22 As shown in Figure 5, the stock treatment significantly decreases the weight that native citizens assign to professional skills when considering whether to approve a visa application. Moreover, while 67 per cent of respondents in both treatment conditions stated that the age of the applicant is a (‘somewhat’ or ‘very’) relevant factor in determining whether to approve the immigrant's application, respondents in the two groups differed as to which professional skills and age categories (minors, young, adults or elderly) they thought should be favored. Respondents in the flows treatment were more likely to prioritize immigrants of working age (that is, young and adults), while those in the stock treatment assigned a higher priority to allowing minors and the elderly to stay. Notably, this preference comes despite the fact that these age categories are likely to generate – at least in the short run – greater costs to the host country.
Stock treatment effects on skill premiums
Note: the figure presents OLS estimates of the stock treatment's effect in four regressions on four different outcome variables (listed on the vertical axis). Thin and thick lines represent 95 per cent and 90 per cent confidence intervals, respectively.

Implications
The findings so far indicate that the American public exhibits greater acceptance of immigrants already residing in the country compared to admitting new flows of immigrants. The evidence suggests that a sense of moral obligation plays an important role in this preference. Before concluding, we seek to provide some insights into the possible implications of this pattern by replicating two widely cited studies on immigration attitudes, while incorporating into the experimental manipulation different treatments that distinguish between the immigration stock and flows.
The Skill-Premium: for Flows and Stocks?
The first study we replicate is the ‘skill premium’ experiment (Hainmueller and Hiscox Reference Hainmueller and Hiscox2010), which shows that native respondents tend to be more welcoming of immigrants with higher levels of professional skills. This finding is interpreted as evidence that natives are more accepting of immigrants who can contribute economically and perhaps integrate culturally in the host country than of those with lower prospects of doing so.
As in the original experiment, we also asked survey respondents whether or not they agree that the country should allow more immigrants into the country. In the original design, one randomly assigned group of subjects was asked this question with respect to low-skilled immigrants, while a second group of subjects was asked about high-skilled immigrants. We conducted a similar experiment, but incorporated another manipulation: in addition to the skill dimension (high vs. low), half of our study's subjects were asked the outcome question about non-naturalized immigrants residing in the country (immigrant stock) while the other half was asked about immigrants residing abroad and seeking entry (immigrant flow).
As Figure 6 illustrates, the findings from the original study hold well: in both treatment groups, the skill premium is sizable and statistically significant. The skill premium does shrink in the stock treatment (2.1 percentage points), but the difference is small and not statistically significant. In other words, taking account of the stock–flow distinction does not significantly alter the results obtained in Hainmueller and Hiscox's original study.
Skill and stock premiums
Note: bars show the average support for approving most or all applicants across four treatment groups. Black vertical lines denote 95 per cent confidence intervals.

Taken together with the results presented earlier, the evidence we obtain regarding natives' preference for skilled workers is mixed. On the one hand, people tend to favor highly skilled visa applicants, irrespective of whether thinking about the immigrant stock or flow. However, people are also less likely to cite professional skills as a relevant factor in determining whether to approve resident aliens’ visa extension applications, and less likely to favor working-age immigrants in the case of the immigration stock.
One explanation for this pattern is that respondents may associate the skill treatment – that is, whether the immigrants in question are described as high or low skilled – with other attributes relevant to their judgments, such as whether the immigrants are perceived to be highly educated, have better control of the English language or even come from certain countries of origin. This raises the possibility that the skill treatment is actually capturing something akin to socio-economic status, in which case the experimental treatment also measures a preference for other desirable features that people associate with high skills (for evidence in line with this argument, see Newman and Malhotra Reference Newman and Malhotra2019). Whether this interpretation is correct can be assessed using a replication of a widely cited conjoint experiment, to which we turn next.
Revisiting the Immigration Consensus
The second study we revisit is Hainmueller and Hopkins (Reference Hainmueller and Hopkins2015), which used a conjoint design to analyze what immigrant characteristics influence natives’ judgments regarding which visa applicants should be allowed to migrate to the United States. The chief finding of that study is that, despite disagreeing about the desirable scope of immigration, most Americans actually agree about the characteristics of immigrants who should be allowed to enter. Importantly, that study's chief question centered on people living outside the United States and seeking to migrate to the country (that is, immigrant flow). We replicate the experiment but add another treatment group for which the key question was adjusted to focus on the immigrant stock instead.
In both cases, respondents evaluated four pairs of immigrant profiles comprised of nine different attributes: sex, education, language skills, country of origin, profession, job experience, job plans, application reason and previous trips to the United States. For each profile, our outcome variable is measured using the following question (alternative wording in brackets):
‘On a scale from 1 to 7, where 1 indicates that the U.S. should absolutely not admit [definitely deport] the immigrant [resident alien] and 7 indicates that the United States should definitely admit [allow] the immigrant [resident alien to stay], what would you decide regarding applicant [resident alien] #1?’Footnote 23 Respondents were asked to choose their response from a 7-point scale, where 1 denoted ‘Absolutely not admit’ [‘Definitely deport’], and 7 was ‘Definitely admit’ [‘Definitely allow’].
Figure 7 presents the results drawn from an ordinary least squares (OLS) model with standard errors clustered by respondent, where the outcome variable is the one assigned to each treatment. The model controls for individual fixed effects, which include the fixed treatment – either immigration flows or stock – assigned to each respondent. Dots and thin and thick lines represent point estimates, 95 per cent and 90 per cent confidence intervals, respectively. Round markers (and black lines) represent the effect for the flow treatment; triangular markers (and gray lines) represent the effect of the features interacted with the stock treatment.
Location and the effect of immigrant attributes

First, focusing on the main effects (black circle markers) that relate to the admittance of immigrant flows, it is notable that the results replicate the findings of the original experiment remarkably well. Specifically, we find that higher levels of education, professional skills, job plans and language skills all present statistically significant effects on immigrant admission, and these effects are in the same direction as reported in the original study.Footnote 24
Yet examination of the interaction effects of the stock condition points to two notable findings. First, several small or null interaction terms indicate that some of the patterns associated with immigration flows also hold with respect to stocks: gender, prior trips to the United States and job plans have a similar effect on allowing immigrant stocks to stay in the country. However, the figure also illustrates some substantial differences. For example, when it comes to the immigrant stock, respondents assign far less importance to higher education levels and English skills. While highly educated immigrants are significantly more likely to be admitted than their low-educated counterparts, both groups of immigrants are just as likely to be allowed to stay once they are in the host country. Similar empirical patterns are detected for different levels of language skills and job experience. To formally test the overall difference, we use a nested model comparison of two equations, one without any interactions and the other with all of the interactions between attributes and the stock treatment. As expected, the results show a statistically significant difference between the two models (F(36, 1,578) = 1.65, p = 0.009), indicating that the effects of new visa applicants' attributes on public opinion are different from those of their resident alien counterparts.
Furthermore, most interaction effects are statistically significant only when respondents are told that not approving visa extension applications means deporting the applicants.Footnote 25 This suggests that the different effects associated with the attributes of the resident aliens are at least partly driven by respondents' aversion to the active expulsion of people from the country.
The results suggest that Hainmueller and Hopkins were correct in their observation that Americans share similar preferences with respect to the desired type of immigrant allowed into the country. Yet this ‘hidden consensus’ masks another important pattern, which is that Americans share a different set of preferences when considering future flows of immigrants as opposed to the stock of resident aliens. When dealing with the latter, natives' judgments are less differentiated based on immigrant characteristics; in particular, they assign less importance to features associated with the immigrants' prospects of integration into the labor market. Compared to immigration flows, attitudes toward the immigrant stock appear less economically oriented and more tolerant of individuals with a lower social status. Furthermore, the results are consistent with the notion that the ‘skill premium’ captures a preference for more than just qualified workers, but also reflects an association that people make between higher skill and other desirable characteristics.
Conclusion
Despite important differences between the immigration stock and the immigration flow – in magnitude, immediacy of impact, fiscal and social implications – the vast literature on public attitudes toward immigration rarely distinguishes between these two components. Moreover, the de facto focus of this literature has been on attitudes toward the immigration flow, which is somewhat surprising given that the flows typically represent a small share of the stock of non-resident aliens in the host country. This article has sought to highlight this distinction between the two groups, theoretically tease out its possible implications on public opinion, and systematically test the impact of immigrants' location on native citizens’ attitudes.
Using an experimental approach, our study demonstrates that people are significantly more accepting of the stock of immigrants than of immigrant flows. Moreover, we find that this ‘stock premium’ is prevalent across many social groups and is not unique to a particular segment of the population. Exploring the mechanisms underlying this pattern, we find that neither contact with immigrants, nor perceptions of immigrant characteristics, account for the stock premium. Instead, the evidence suggests that this premium is partly driven by a stronger sense of moral obligation to accommodate people residing in the country, including immigrants.
These findings highlight an overlooked and potentially important aspect of the politics revolving the immigration issue. As instances from recent years demonstrate, railing voters against the threat of new immigrants seeking to enter the country can be a vote-winning strategy. Yet even when this strategy is successful, it may not mean that the electorate is also hostile toward the stock of immigrants. For example, public support for immigration policies designed to restrict or change the flow of migrants – such as building a border wall or introducing a ‘point system’ for visas – may be popular among voters. Yet that does not necessarily imply that there is also public support for policies designed to make it harder for the stock of immigrants to stay. Indeed, the Trump Administration's effort to broaden the ‘public charge’ clause – that is, to limit the ability of resident aliens to become citizens if they use various forms of public assistance such as Medicaid or housing vouchers – has generated widespread opposition and controversy.Footnote 26 Thus, in debating the political feasibility of policy changes related to immigration reform, both policy makers and analysts would do well to take account of the public's views with respect to the specific targets of the proposal, giving particular attention to the stock–flow distinction.
Although our focus has been on authorized immigration, this observation may also hold in regard to policies aimed at restricting undocumented immigration. Indeed, there is substantially greater public support for policies that seek to reduce the flow of undocumented immigrants vs. the stock of undocumented immigrants. Figure 8 presents data from the 2018 American National Election Study, and shows that an overwhelming majority (88 per cent) of Trump voters supported a border wall with Mexico to restrict immigrant flows, while a much smaller share of Trump voters (52 per cent) supported the deportation of unauthorized stock of migrants. These results are merely suggestive, but are nevertheless consistent with our contention that voters are more supportive of restrictive policies that target flows rather than stocks. Future studies should examine whether that is also the case with respect to undocumented workers.
Public support for restrictive immigration policies, by support for Trump
Note: bars present the share of support for the policy within each group of voters. Trump voters are respondents who reported that they plan to vote for him in the 2020 elections; non-Trump voters are all other respondents who plan to vote for a Democratic candidate, someone else, or probably would not vote. The panel on the left shows the share of voters who favor building a wall on the US border with Mexico. The panel on the right presents the share of voters who support making ‘all unauthorized immigrants felons and send[ing] them back to their home country’ over having a guest worker program so they can work in the United States, or allowing them to remain and eventually qualify for US citizenship. Black vertical lines denote 95 per cent confidence intervals.

Our analysis also indicates that some of the previous findings on public attitudes toward immigration merit some modification after the distinction between the stock and flow is taken into account. For example, rather than a single ‘immigration consensus’ among Americans regarding the desired profile of all immigrants (Hainmueller and Hopkins Reference Hainmueller and Hopkins2015), we find that the desired profiles differ between the future flow and current stock. Moreover, while we find that natives' preferences for highly skilled immigrants holds with respect to both stocks and flows, natives' concern with the labor market prospects of immigrants is less prominent and more nuanced when dealing with those already living in the country as compared to the future migrant flow.
Further investigation of the implications of the stock–flow distinction on the politics of immigration is a promising avenue for future research. For example, the striking similarity observed in the immigration attitudes of workers employed in very heterogeneous industries (Hainmueller, Hiscox and Margalit Reference Hainmueller, Hiscox and Margalit2015) may look different once assessed separately with respect to stocks and flows: do sector-specific interests generate variability in native workers' views toward migrants seeking entry as opposed to those who are already part of the local workforce? In a similar vein, earlier findings regarding the increase in public opposition to immigration during hard economic times (Dancygier and Donnelly Reference Dancygier and Donnelly2012) may also differ with respect to the two types of immigration. Specifically, how does the magnitude of the stock premium change as a function of economic conditions in the country? Clearly, there is ample room to develop new insights on how the location of the immigrants in question – whether inside or outside of the country's borders – shapes natives' views and preferences on immigration policy.
Supplementary material
Online appendices are available at https://doi.org/10.1017/S0007123420000940.
Data availability statement
Replication data for this article can be found in Harvard Dataverse at: https://doi.org/10.7910/DVN/EGARNT
Acknowledgements
For valuable comments and suggestions, we thank Dominik Hangartner, Daniel Hopkins, Neil Malhotra, and the editors and reviewers. Earlier versions of the article were circulated under the title: ‘Location Matters: Is the Immigration Debate over Stocks or Flows?’
Ethical Standards
The research was conducted in accordance with the protocols approved by the Institutional Review Board at Tel Aviv University.


 Open access