

1. Motivation: understanding ANN Crowd architectures
Artificial Neural Network (ANN) crowds represent a novel approach to ensemble learning, leveraging the collective wisdom of a diverse set of neural network architectures to solve predictive tasks (Reference Adebayo, Patel and SummersAdebayo et al., 2024). Unlike traditional single-model approaches, ANN crowds consist of 189 unique architectures, replicated 100 times each with random initial weights, thus satisfying the crowd requirements of diversity, independent, and decentralization (Reference Adebayo, Patel and SummersAdebayo et al., 2024). ANN crowds have been effectively used for early-stage product predictions, such as assembly time and market price, especially when limited data is available (Adebayo et al., Reference Adebayo, Patel and Summers2024; Gill et al., Reference Gill, Summers and Turner2017; Namouz, Reference Namouz2013; Owensby & Summers, Reference Owensby and Summers2014; Patel et al., Reference Patel, Andrews, Summers, Harrison, Schulte and Laine Mears2017). However, despite their potential, the inner workings of ANN crowds, particularly the effects of architectural diversity, remain poorly understood (Bian & Wang, Reference Bian and Wang2007; Brown et al., Reference Brown, Wyatt, Harris and Yao2005; Minku et al., Reference Minku, White and Yao2010; Robert & Romero, Reference Robert and Romero2015). To maximize the predictive power of ANN crowds, it is essential to investigate how specific architectural features, such as the number and depth of layers, influence their collective behaviour and accuracy.
While prior studies have explored the general principles of ensemble learning and the benefits of ANN crowds, they often treat the crowd as a monolithic entity without delving into the influence of individual architectural variations (Ganaie et al., Reference Ganaie, Hu, Malik, Tanveer and Suganthan2021; Hansen & Salamon, Reference Hansen and Salamon1990; Reference KroghKrogh, n.d.; Li et al., Reference Li, Wang and Ding2018; Owensby & Summers, Reference Owensby and Summers2014; Patel et al., Reference Patel, Andrews, Summers, Harrison, Schulte and Laine Mears2017; Reference Yang, Lv and ChenYang et al., n.d.). In particular, the impact of layer configurations, ranging from shallow to deep architectures on ANN crowd behaviour metrics, such as Normality, Centrality, and Width, has received limited attention. This research addresses the critical questions: (1) how do variations in the number of layers influence ANN crowd behaviour as measured by these metrics, and (2) how do layer-induced behaviour profiles correlate with specific prediction accuracy metrics, such as Mean Absolute Error and Standard Deviation? By focusing on layer variations, this aligns with ICED’s focus on computational tools for engineering design, offering designers a scalable method to predict assembly time and market price early, enhancing decision-making and reducing design iteration cycles.
2. Ensemble deep learning and ANN Crowd
Ensemble deep learning is a powerful paradigm that combines the strengths of ensemble methods and deep learning techniques (Ganaie et al., Reference Ganaie, Hu, Malik, Tanveer and Suganthan2022; Mahajan et al., Reference Mahajan, Uddin, Hajati and Moni2023; Sagi & Rokach, Reference Sagi and Rokach2018). This approach leverages the feature extraction capabilities of deep learning with the error-reduction benefits of ensemble methods to create more robust and accurate predictive models (Reference Ganaie, Hu, Malik, Tanveer and SuganthanGanaie et al., 2022). At its core, ensemble deep learning involves combining multiple deep learning models to improve overall performance and generalization (Ali et al., Reference Ali, Youssef, Abdelal and Raja2024; Ganaie et al., Reference Ganaie, Hu, Malik, Tanveer and Suganthan2022; Qiu et al., Reference Qiu, Zhang, Ren, Suganthan and Amaratunga2014). The key principle behind this approach is that by aggregating the predictions of diverse models, the ensemble can overcome the limitations of individual models and achieve superior results (Reference Ganaie, Hu, Malik, Tanveer and SuganthanGanaie et al., 2022).
The ANN Crowd exemplifies a specialized form of ensemble deep learning, scaling this concept to an unprecedented level with 18,900 individual neural networks (189 unique architectures × 100 replicates). (Reference Adebayo, Patel and SummersAdebayo et al., 2024). This relationship situates ANN Crowds within the ensemble learning framework while showcasing their enhanced scalability and ability to handle diverse datasets with minimal data, such as predicting assembly time and market price in early-stage design. Compared to traditional ensemble methods, ANN Crowds offer distinct advantages. For instance, the ANN Crowd achieves a reported prediction error of 5% for Assembly Model to Assembly Time (AM-AT) with just 20 samples (Miller et al., Reference Miller, Summers, Mathieson and Mocko2014; Owensby & Summers, Reference Owensby and Summers2014; Sri Ram Mohinder et al., Reference Sri Ram Mohinder, Gill and Summers2017), outperforming Bagging in fraud detection (Reference Zareapoor and Shamsolmoali~10-15% implied MAE, 100,000 samples(Zareapoor & Shamsolmoali, 2015) and Negative Correlation Learning (NCL) (~8.15% RMS error, 720 samples (Reference Liu and YaoY. Liu & Yao, 1999). However, this scalability comes at the cost of higher computational demands, contrasting with the efficiency of smaller ensembles like Stacking (Reference WolpertWolpert, 1992), which uses fewer models but requires careful tuning.
By extracting the collective wisdom of its vast array of ANNs, the ANN Crowd excels in tasks with limited or noisy data, offering a robust alternative to conventional approaches. This study builds on this foundation, exploring how architectural variations, particularly layer configurations, influence crowd behavior and prediction accuracy.
2.1. Novelty of ANN Crowds
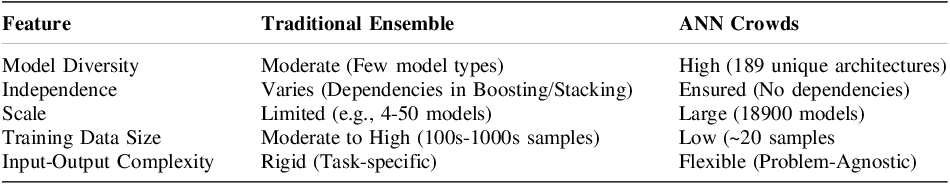
The ANN Crowd represents a significant evolution in ensemble deep learning, distinguished from traditional ensemble methods by its unique architectural features and scalability. Unlike methods such as Bagging, Boosting, or Stacking, which typically combine a modest number of models (e.g., 4-50), ANN Crowds leverage 18,900 models (189 architectures × 100 replicates), offering a flexible, problem-agnostic approach to predictive tasks. This section details the defining innovations of ANN Crowds, model diversity, independence, large-scale architecture, minimal data requirements, and capacity for complex input-output relationships, while contrasting them with state-of-the-art techniques to highlight advantages and limitations (Table 1).
Comparison of ANN Crowds with traditional ensemble methods

2.1.1. Diversity
ANN crowds incorporate an extensive range of diverse ensemble strategies and architectures (Reference Adebayo, Patel and SummersAdebayo et al., 2024). Unlike traditional methods that might use a limited number of model types or create multiple versions of the same datasets (Ha et al., Reference Ha, Cho and MacLachlan2005; Randhawa et al., Reference Randhawa, Loo, Seera, Lim and Nandi2018; Sethanan et al., Reference Sethanan, Pitakaso, Srichok, Khonjun, Thannipat, Wanram, Boonmee, Gonwirat, Enkvetchakul, Kaewta and Nanthasamroeng2023), ANN crowds employ 189 different artificial neural network (ANN) architectures, each with varying numbers of nodes (1-15) and layers (1-3). This level of architectural diversity allows the ANN crowd to explore a much broader solution space, allowing the ensemble to handle complex, high-dimensional problems more effectively (Reference Adebayo, Patel and SummersAdebayo et al., 2024). This approach aligns with the theoretical underpinnings of ensemble learning, which emphasizes the importance of diversity for improving model performance (Ganaie et al., Reference Ganaie, Hu, Malik, Tanveer and Suganthan2022; Nam et al., Reference Nam, Yoon, Lee and Lee2021; Robert & Romero, Reference Robert and Romero2015).
2.1.2. Independence
A key novelty of ANN crowds is the method used to ensure independence among models (Adebayo et al., Reference Adebayo, Patel and Summers2023, Reference Adebayo, Patel and Summers2024; Mathieson, Reference Mathieson2011). Each of the 189 architectures is designed to operate without any interaction or dependencies between them (Reference MathiesonMathieson, 2011). There is no exchange of information during the training for the individual ANNs. This guarantees that there is independence in the models. They are run in parallel. This level of independence is crucial for avoiding correlated errors and ensuring a truly diverse set of predictions (Reference MathiesonMathieson, 2011). Unlike methods like Boosting or Stacking, where models are inherently dependent on each other (González et al., Reference González, García, Del Ser, Rokach and Herrera2020; Low et al., Reference Low, Park and Teoh2020), ANN crowds maintain strict separation between each model’s training process. This independence allows the ANN crowd to capture a wider range of perspectives on the data, potentially leading to more robust and accurate predictions.
2.1.3. Size and scale
The sheer scale of ANN crowds sets them apart from traditional ensemble methods (Reference Adebayo, Patel and SummersAdebayo et al., 2024). With 18,900 total models (189 architectures × 100 replicates), ANN crowds operate at a scale that is orders of magnitude larger than most ensemble approaches (Reference Deng and PlattDeng & Platt, n.d.; Reference Liu, Han, Meng and TongP. Liu et al., n.d.). The replicates are possible with random initial weights in each architecture and an early termination before convergence of the training. This scale amplifies the ANN crowd’s ability to generalize, making it more resilient to overfitting and capable of handling a wide range of prediction tasks (Reference Adebayo, Patel and SummersAdebayo et al., 2024). The large number of models allows the ANN crowd to capture subtle patterns and relationships in the data that might be missed by smaller ensembles.
2.1.4. Training data size
One of the most striking innovations of ANN crowds is their ability to achieve remarkable prediction accuracy using minimal training data (Adebayo et al., Reference Adebayo, Patel and Summers2023, Reference Adebayo, Patel and Summers2024). ANN crowds can be successfully trained with as few as 20 samples, which is particularly noteworthy given the complexity and scale of the ensemble (Reference Adebayo, Patel and SummersAdebayo et al., 2023). This efficiency in handling small datasets set ANN crowds apart from many deep learning approaches that typically require large amounts of training data (Reference Huang, Li, Pleiss, Liu, Hopcroft and WeinbergerHuang et al., 2017). The ability to work with limited data makes ANN crowds particularly valuable in domains where data collection is expensive, time-consuming, or otherwise constrained.
2.1.5. Input and output complexity
ANN Crowds excel in handling complex input-output mappings, such as predicting market prices or assembly times from intricate product assembly models, showcasing their versatility and adaptability in engineering and design tasks (Reference Owensby and SummersOwensby & Summers, 2014). Unlike traditional ensemble methods, ANN Crowds leverage a structured yet flexible input-output complexity framework, which incorporates 29 graph-based complexity metrics as inputs (Reference Adebayo, Patel and SummersAdebayo et al., 2024; Reference Mathieson, Shanthakumar, Sen, Arlitt, Summers and StoneMathieson et al., 2011). These metrics capture detailed aspects of product design, including size, interconnectivity, and decomposition, enabling the ANN Crowd to account for the multifaceted relationships inherent in such tasks (Reference MathiesonMathieson, 2011). This approach enhances the ANN Crowd’s ability to process intricate inputs and generate interpretable, problem-specific outputs (See Figure 1) (Reference MathiesonMathieson, 2011). Such adaptability is particularly valuable in engineering design, where non-linear interactions among numerous variables often determine outcomes. By maintaining a problem-agnostic structure, ANN Crowds avoid the need for domain-specific adjustments, making them a robust and efficient solution across diverse predictive tasks.
Mapping complexity metrics to target

2.2. Prior work and applications
The ANN Crowd has proven effective in predicting critical product characteristics during early design stages, such as assembly time and market price, using limited design data like assembly and function models.(Miller et al., Reference Miller, Summers, Mathieson and Mocko2014; Sri Ram Mohinder et al., Reference Sri Ram Mohinder, Gill and Summers2017). Its applications extend to identifying automotive assembly defects and evaluating life cycle assessments, demonstrating versatility in complex engineering challenges (Reference Patel, Andrews, Summers, Harrison, Schulte and Laine MearsPatel et al., 2017). Leveraging 29 structural complexity metrics as input, the ANN Crowd’s 18,900 diverse neural networks independently identify relationships between inputs and target values such as market price or assembly time (Figure 1) (Reference Adebayo, Patel and SummersAdebayo et al., 2024). Predictions are validated against known outcomes to assess accuracy and precision, with assembly models typically outperforming function structures (Reference Sri Ram Mohinder, Gill and SummersSri Ram Mohinder et al., 2017). Despite its successes, variations in accuracy across prediction models highlight the need for deeper exploration of ANN Crowd architectures and individual network behaviours to optimize performance further.
3. Architectural variations (diversity) in ANN Crowds
Architectural variations in ANN crowds are central to their predictive performance, offering a rich diversity of configurations. These variations encompass nodes, connection pattern and layers, each contributing uniquely to the collective wisdom of the crowd.
3.1. Node variations
Node variation refers to differences in the number of neurons (nodes) within each architecture of the ANN crowd (Reference Davenport, Ronanki, Wheaton and NguyenDavenport et al., n.d.). The number of neurons, which range from 1 to 15 neurons per hidden layer, defines the network’s computational capacity to process input data and generate predictions (Reference MathiesonMathieson, 2011). The key logic behind varying node counts is to strike a balance between generalization and the ability to model complex relationships. While fewer nodes help prevent overfitting by promoting generalization, more nodes enable the model to capture more intricate data patterns. This diversity of node configurations is essential in allowing the ANN crowd to tackle a broad range of prediction tasks, such as assembly time or market price, where different levels of complexity are involved (Reference MathiesonMathieson, 2011). The ANN crowd includes 189 different architectures with various node counts, with each architecture replicated 100 times for robustness, ensuring a broad exploration of node capabilities.
3.2. Connection variations
Connection variation in ANN crowds defines how neurons connect across layers, shaping the flow and transformation of information. Patterns include Convergence (C), where larger layers reduce to smaller ones (e.g., 5 nodes to 3 nodes); Same (S), where layers maintain the same number of nodes; and Divergence (D), where smaller layers expand into larger ones (e.g., 2 nodes to 5 nodes). For example, Figure 2 illustrates an architecture in ANN Crowd with connection pattern [C, S, D] starts with 29 input metrics converging to 2 nodes, followed by another 2-node layer, and then diverging to 5 nodes before converging to a single output. This diversity in connection patterns plays a critical role in how the crowd processes the input metrics and influences prediction accuracy.
Architecture [C,S,D]

3.3. Layer variations
Layer variation in the ANN crowd captures differences in the number and structure of hidden layers, with networks ranging from one to three layers. These variations enable the crowd to balance simplicity and complexity, with shallow architectures offering efficiency and deeper networks capturing intricate data relationships. While a single hidden layer can approximate any function, multi-layered configurations better model complex patterns, providing flexibility for diverse prediction tasks. The ANN crowd limits the number of neurons per layer relative to the total layers to prevent overfitting while maintaining modelling efficiency. Configurations such as [2,2,5] (three layers with a mix of 2 and 5 neurons) exemplify this approach, ensuring robust performance across varying levels of task complexity. By analysing these variations, researchers gain insights into how architectural complexity impacts prediction accuracy, informing the design of optimized ANN crowds tailored to specific applications.
4. Behavior coding in ANN Crowds
Understanding how individual architectures contribute to the collective performance of an ANN crowd is essential for optimizing its predictive capabilities (Reference Adebayo, Patel and SummersAdebayo et al., 2024). The Architecture Behavior Coding Scheme provides a structured approach to evaluate these contributions, offering insights into the roles and impacts of diverse architectures within the crowd (Reference Adebayo, Patel and SummersAdebayo et al., 2024). Using three key metrics; Normality, Centrality, and Width. This scheme categorizes architectures into distinct behavioral profiles, enabling a nuanced analysis of their influence on the crowd’s behavior and prediction accuracy.
Normality measures the alignment of an architecture’s prediction distribution with the overall crowd distribution, serving as an indicator of confidence in its reliability. Architectures with high alignment are labeled High Confidence, reflecting consistency with the crowd, while those with significant divergence are categorized as Low Confidence, indicating potential unreliability. Centrality evaluates an architecture’s role in shaping overall accuracy, classifying them as Positive, Neutral, or Negative contributors, depending on their influence on the crowd’s prediction error. Width assesses the variability introduced by an architecture, categorizing it as Narrow, Similar, or Wide, based on its effect on the consistency of prediction errors.
These metrics form the basis of the Architecture Behavior Interpretation Scheme, which groups architectures into 18 behavioral categories based on their Confidence, Goodness (derived from Centrality), and Magnitude (derived from Width). For example, architecture labelled High Confidence, Good Centrality, High Width (HGH) are consistent contributors to accuracy but may introduce variability, while Low Confidence, Bad Centrality, Low Width (LBL) architectures are unreliable and detrimental to performance. This classification system not only helps identify high-performing architectures but also provides insights into the broader dynamics of ANN crowds.
In this research, the coding scheme plays a pivotal role in linking layer variations to architectural behavior and prediction accuracy, supporting the paper’s overarching goal of understanding and optimizing ANN crowd architectures. By characterizing architectural behaviors, this framework contributes actionable insights for designing task-specific ANN crowds that maximize diversity and predictive power.
5. Research approach
This study builds upon previous research in ANN Crowds, leveraging existing datasets and prediction models to investigate the impact of architectural variations on prediction accuracy. Specifically, the research examines how changes in the number and depth of architectural layers influence behaviour metrics (e.g., Normality, Centrality, and Width) and overall prediction performance. By analysing layer configurations and their implications, the study aims to uncover the relationship between architecture and predictive behaviours.
The data used in this research comprises 20 consumer electro-mechanical products, including power tools and kitchen appliances. These products are represented through assembly models and function structures, obtained from publicly available sources such as GRAB CAD Footnote 1 and 3D CONTENT CENTRAL Footnote 2 . For unavailable models, a reverse engineering approach is employed. Connectivity graphs for the assembly models were derived using interference detection tools within SolidWorks, identifying physical interactions between components (Reference Owensby and SummersOwensby & Summers, 2014). Assembly times were manually calculated using Boothroyd and Dewhurst Design for Assembly (DFA) tables, ensuring consistency with established methodologies (Reference Owensby and SummersOwensby & Summers, 2014). Additionally, market prices were obtained from Amazon.com, averaging five base-price quotes for accuracy. The data was split into training and test sets to evaluate predictive performance comprehensively—for example, 16 products were used for training ANN Crowd models, while four were reserved for testing. Training the 18,900 models required approximately 40 minutes and prediction times averaged 2 minutes across the test set, suggesting computational feasibility for early-stage design iterations where lead time reductions—hours versus manual DFA’s days—justify the upfront training cost.
Key prediction models analysed include Assembly Model to Assembly Time (AM-AT), which exhibits high accuracy with a prediction error of 5%, and Function Model to Market Price (FM-MP), which demonstrates lower performance with a 50% accuracy rate (Reference Sri Ram Mohinder, Gill and SummersSri Ram Mohinder et al., 2017). The inclusion of these contrasting prediction models allows for studying the architectural behaviours across a spectrum of precision, offering insights into the responsiveness of ANN Crowd configurations.
6. Results: behaviour distribution across layers
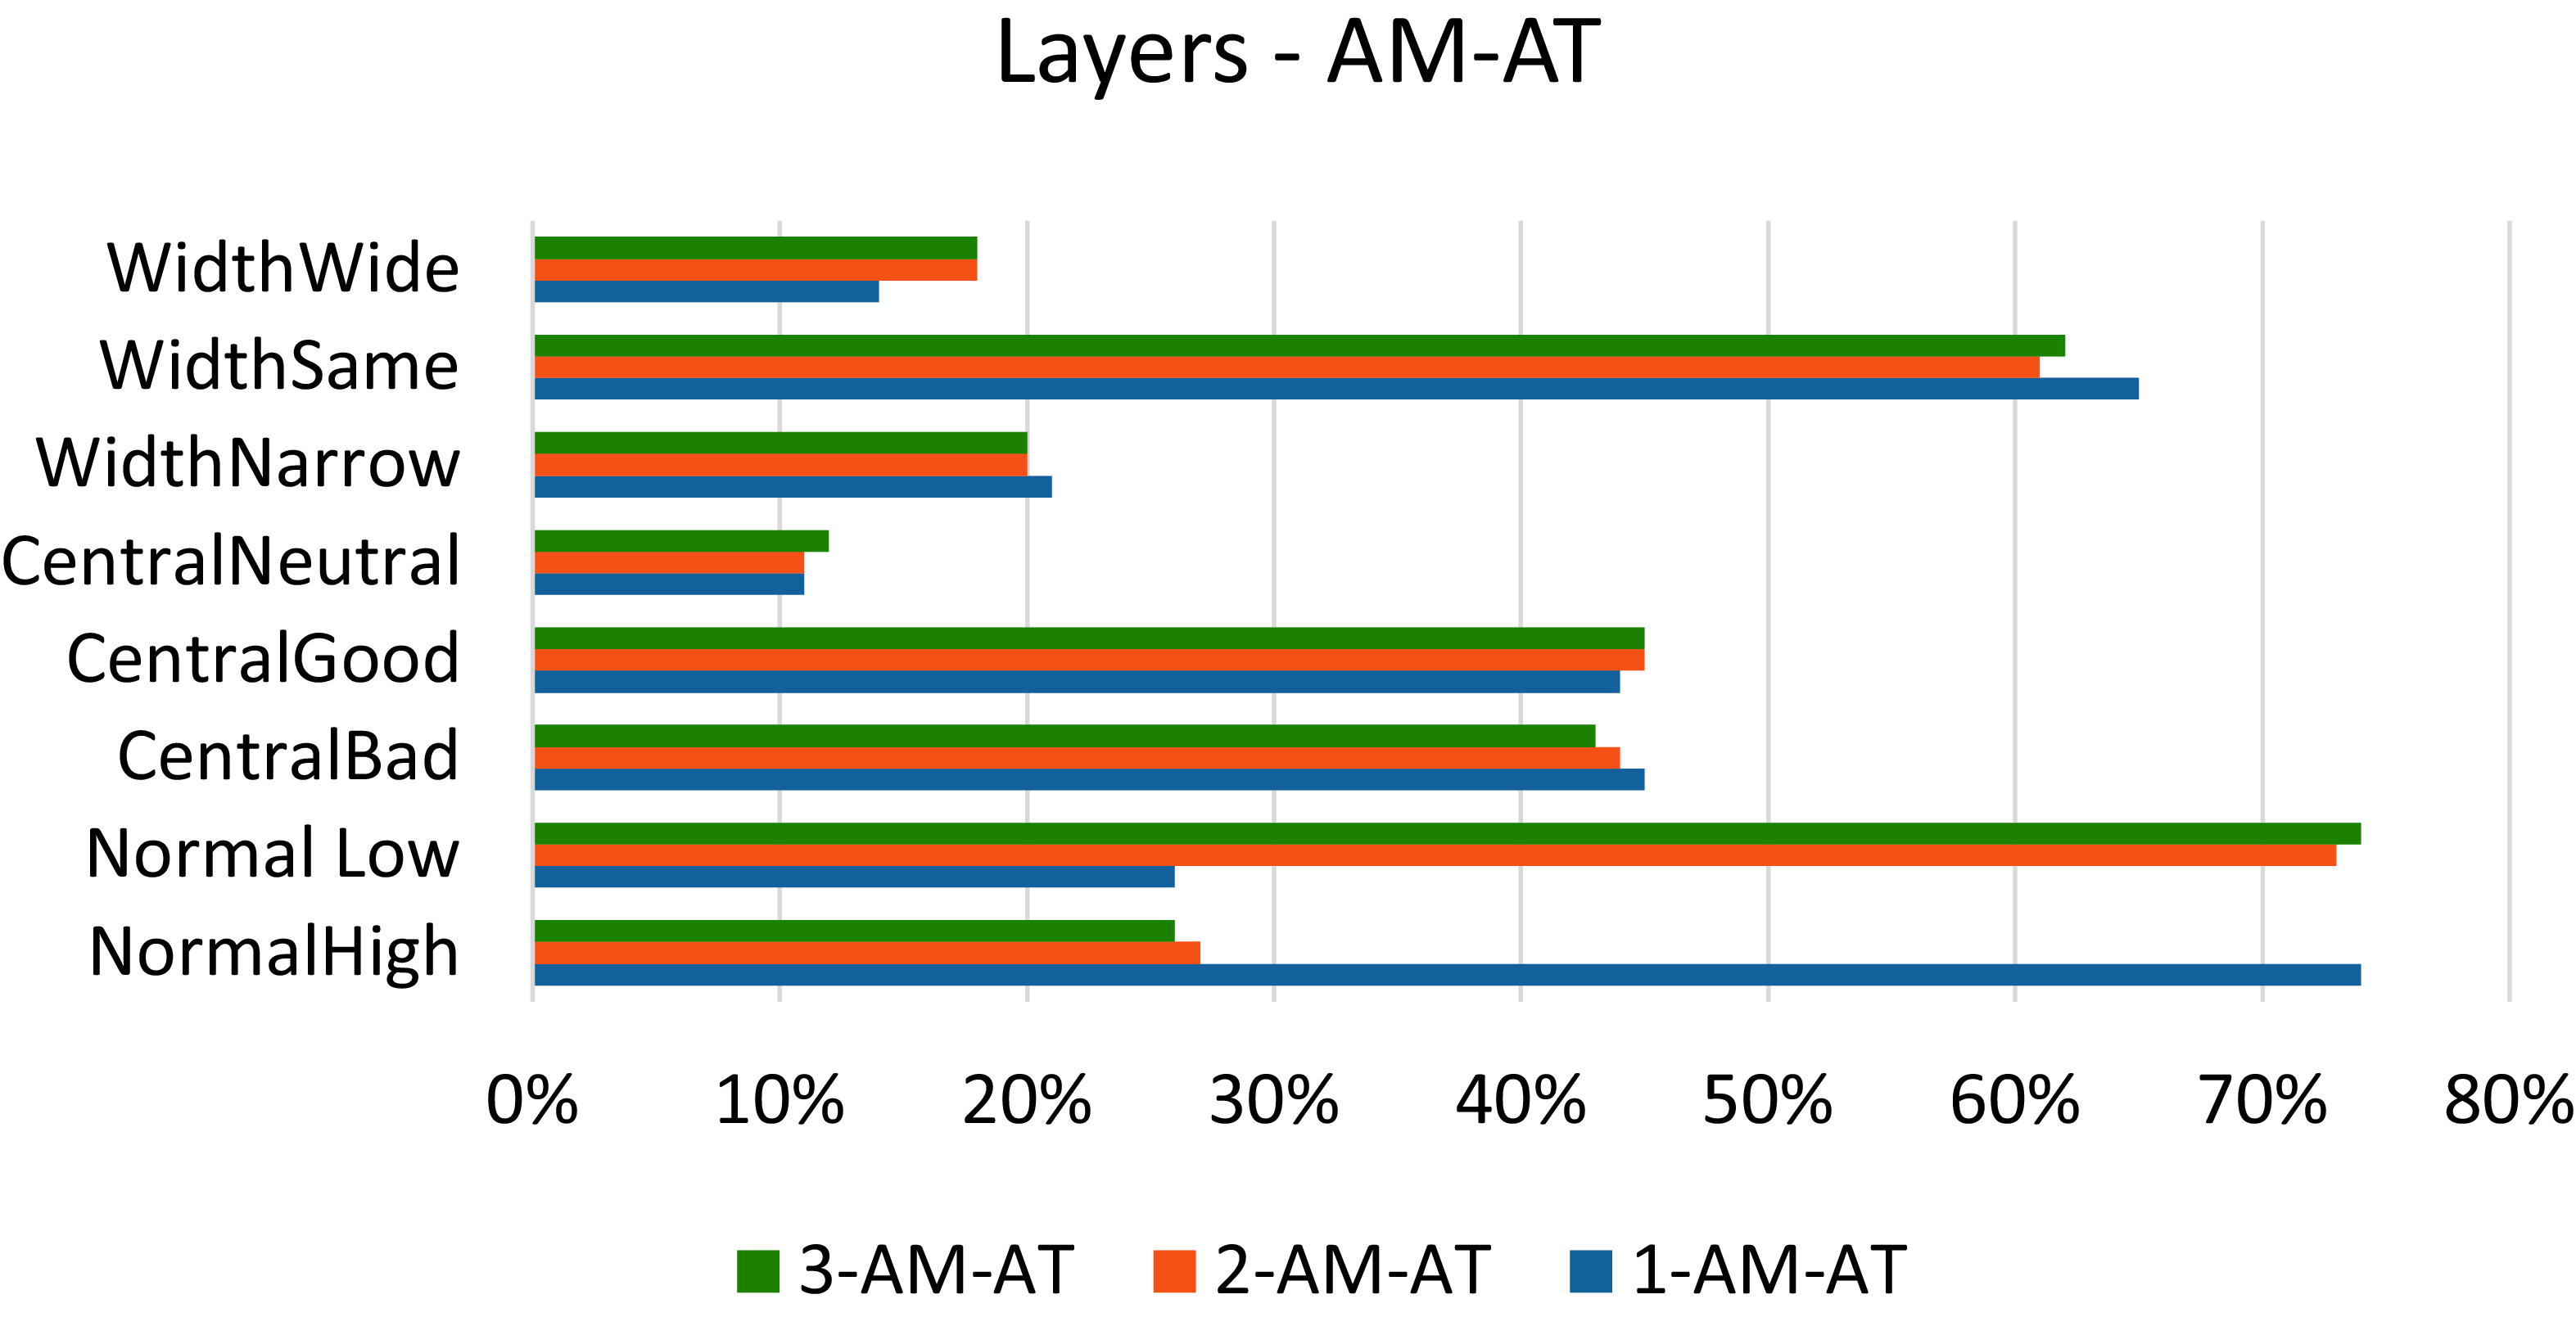
This section presents distribution of behaviors across three layers of the ANN Crowd for the two prediction models: AM-AT and FM-MV. Figure 3 and Figure 4 illustrate the normal and unique behavior distributions for AM-AT, while Figure 5 and Figure 6 do the same for FM-MV. The percentages represent the proportion of each behavior relative to the total behavior observed in each layer.
For the AM-AT prediction model, Figure 3 shows that NormalHigh behavior starts at 74% in the first layer but decreases sharply to 27% and 26% in Layers 2 and 3, respectively. Conversely, NormalLow increases significantly from 26% in Layer 1 to 73% and 74% in subsequent layers. Other behaviors such as CentralBad and CentralGood remain relatively stable, fluctuating between 43% and 45%. Similarly, WidthNarrow, WidthSame, and WidthWide exhibit minor changes, with values remaining between 20% and 65% across the layers. Unique behaviors for AM-AT (Figure 4) show consistent dominance of combinations like High-Bad-Same and High-Good-Same (19% to 22%) across layers, while rare combinations such as Low-Neutral-Wide remain close to 0% throughout.
AM-AT behaviour distribution

AM-AT unique behaviour distribution

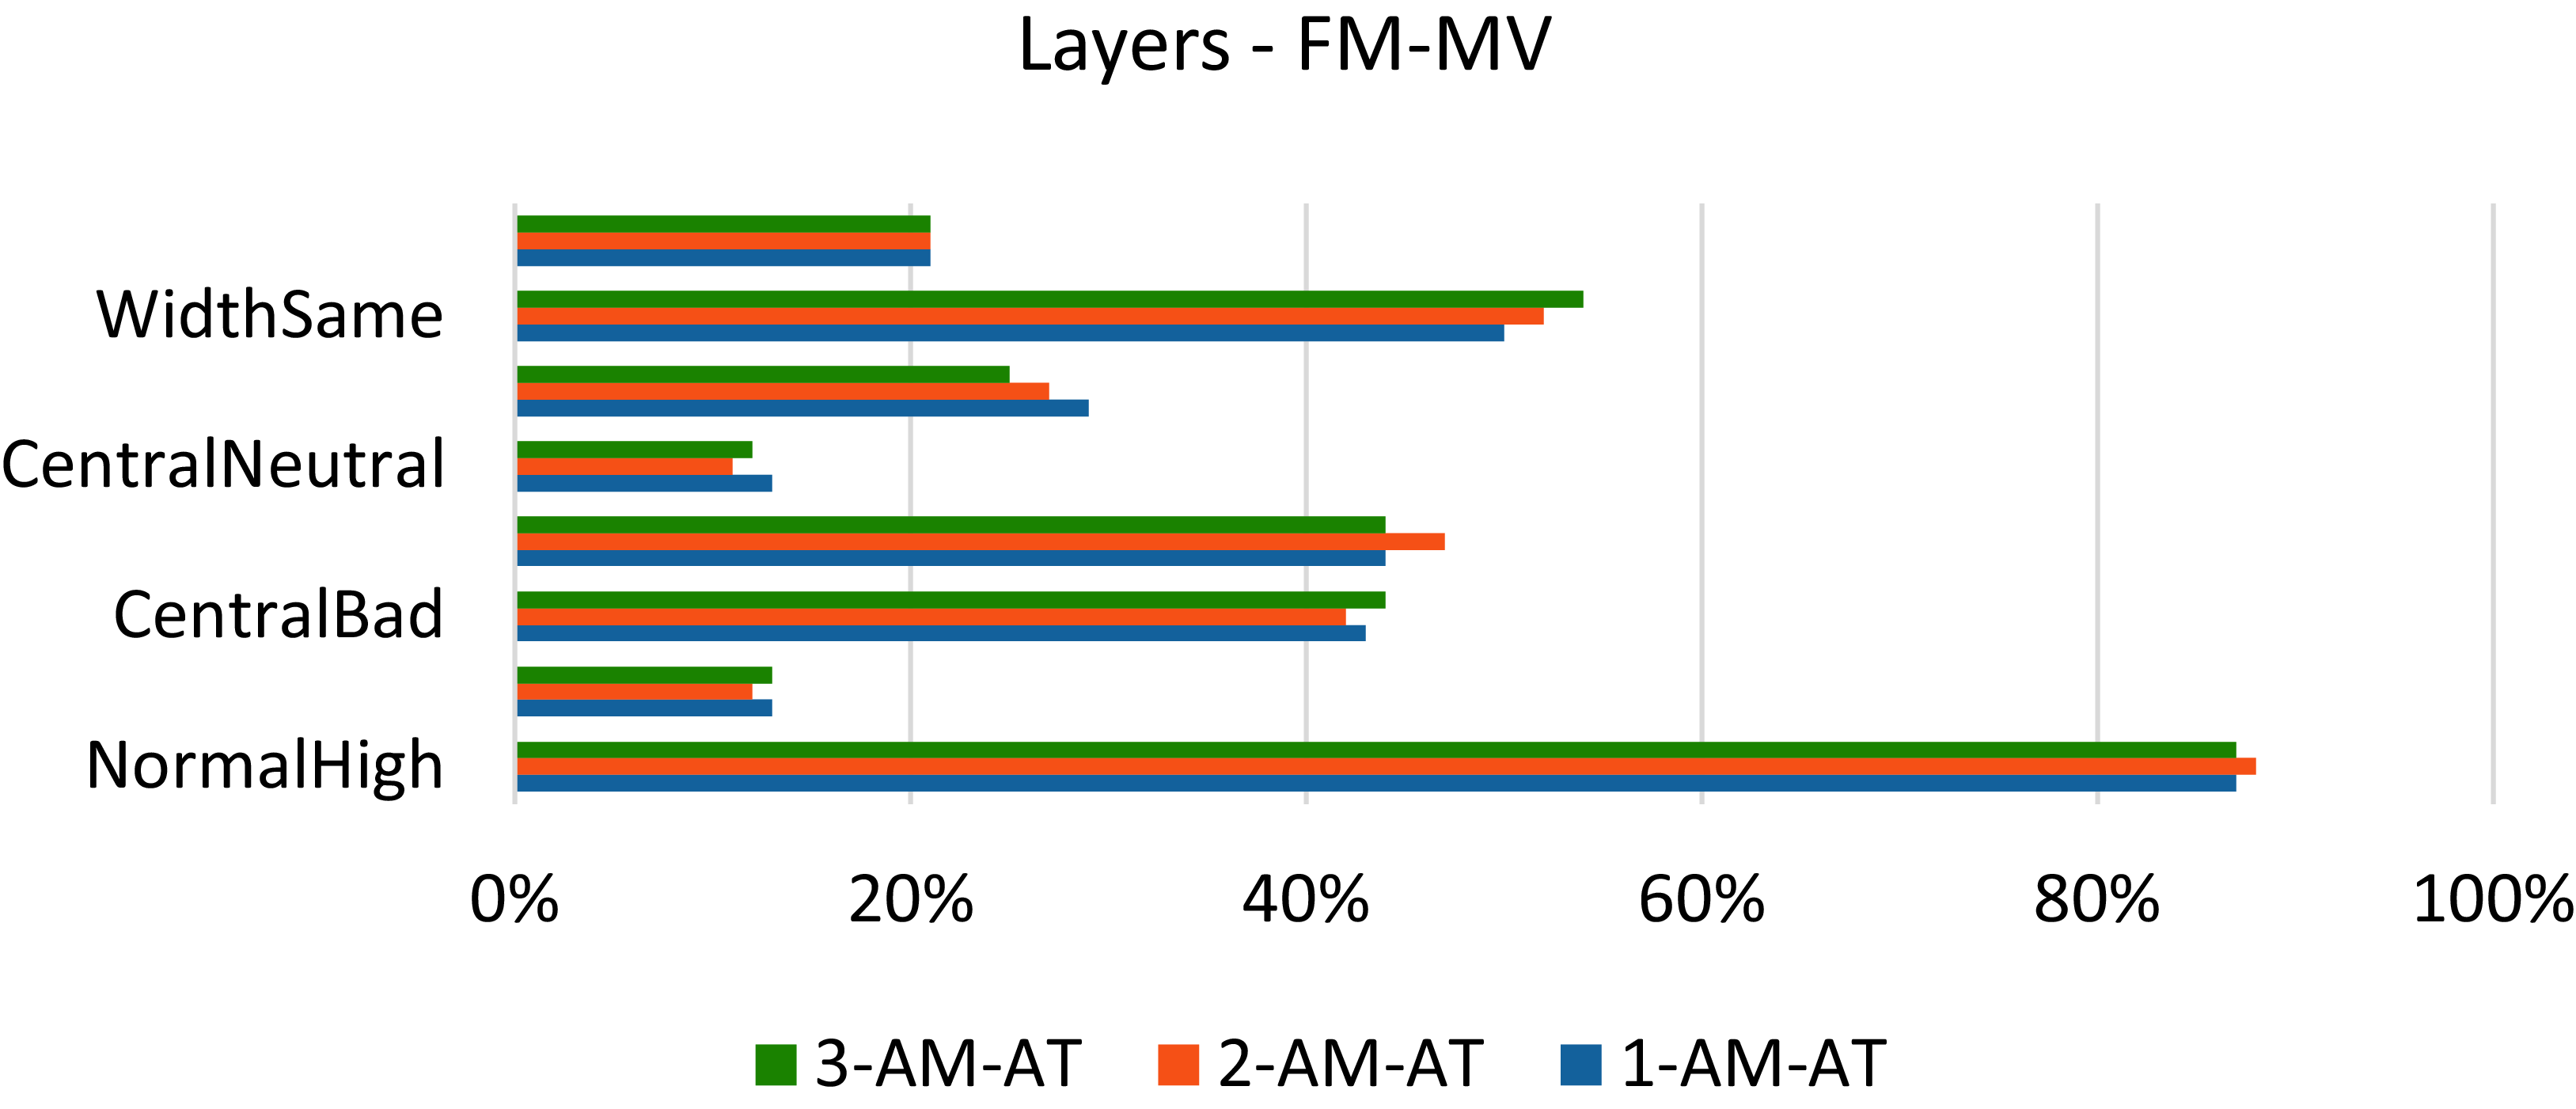
For the FM-MV prediction model, Figure 5 indicates that NormalHigh remains highly dominant across all layers, with percentages of 87%, 88%, and 87% for Layers 1, 2, and 3, respectively. Similarly, NormalLow is steady at 12% to 13%. Behaviors like CentralBad and CentralGood show slight variations, with CentralGood increasing to 47% in Layer 2 before returning to 44% in Layer 3. The width behaviors (WidthNarrow, WidthSame, and WidthWide) exhibit minimal changes across layers, with values ranging from 25% to 54%. Unique behaviors for FM-MV (Figure 6) reveal that combinations such as High-Good-Same remain consistently dominant (20% to 21%), while less frequent behaviors like Low-Bad-Wide and Low-Neutral-Wide are nearly absent across all layers.
FM-MV Behaviour distribution

Overall, the behavior distributions for both prediction models are largely stable across the layers, with only minor fluctuations observed. These preliminary findings suggest that the ANN Crowd maintains consistency in its predictions. To explore this stability’s impact, we computed correlations between behavior metrics and prediction accuracy. For AM-AT, NormalHigh in Layer 1 showed a very weak positive correlation with MAE (r ≈ 0.038), while CentralityGood exhibited a moderate negative correlation (r ≈ -0.449), indicating that higher CentralityGood values reduce error. WidthWide in Layer 3 had a weak positive correlation with standard deviation (r ≈ 0.22), suggesting increased variability. In Layers 2 and 3, NormalHigh’s correlation with MAE remained negligible (r ≈ -0.005 and -0.006). For FM-MP, NormalHigh’s dominance (87-88%) aligned with a stable MAE of 50%, with all correlations near zero (r < 0.05), reflecting minimal layer-driven shifts in error.
FM-MV unique behaviour distribution

In the subsequent analysis, researchers will investigate whether the observed layer variations, although minimal, impact the prediction accuracy of the ANN Crowd. This will involve analyzing metrics such as the mean error and standard deviation to understand how these variations influence the model’s overall performance.
7. Conclusions
This preliminary study investigated the behavior distributions across layers of the ANN Crowd using two distinct prediction models, AM-AT and FM-MV, for a dataset encompassing all products collectively. The findings reveal largely stable patterns across layers, with minimal fluctuations in behaviors such as Normality, Centrality, and Width. These results suggest that the ANN Crowd demonstrates consistent predictive behaviors across layers, highlighting its robustness in addressing varying prediction tasks. However, the study does not delve into behavior distributions for individual products, leaving room for further exploration.
Future work will expand on these findings by investigating whether the observed layer variations impact the prediction accuracy of the ANN Crowd. This will involve analyzing metrics such as error margins and standard deviations to understand the influence of architectural configurations on overall predictive performance. For engineering design, these findings suggest ANN Crowds can streamline early-stage prototyping by predicting key metrics with minimal data, potentially cutting lead times by days compared to manual methods like DFA. Industrial applications (e.g., automotive assembly) could further validate this impact.


 Open access